Abstract
Information and communication technologies (ICT) are increasingly permeating our daily life and we ever more commit our data to the cloud. Events like the COVID-19 pandemic put an exceptional burden upon ICT. This involves increasing implementation and use of data centers, which increased energy use and environmental impact. The scope of this work is to summarize the present situation on data centers as to environmental impact and opportunities for improvement. First, we introduce the topic, presenting estimated energy use and emissions. Then, we review proposed strategies for energy efficiency and conservation in data centers. Energy uses pertain to power distribution, ICT, and non-ICT equipment (e.g., cooling). Existing and prospected strategies and initiatives in these sectors are identified. Among key elements are innovative cooling techniques, natural resources, automation, low-power electronics, and equipment with extended thermal limits. Research perspectives are identified and estimates of improvement opportunities are mentioned. Finally, we present an overview on existing metrics, regulatory framework, and bodies concerned.
1. Introduction
The digital economy is expanding and so is the demand for information and communication technology (ICT), driving the data center industry. Compared to the recent “age of computing”, the present time is regarded as the “age of data” [1]. Drivers for the recent massive expansion of ICT are the fifth-generation mobile networks (5G), modern computing paradigms, internet of things (IoT) [2,3], cryptocurrencies, blockchain [4], big data science, artificial intelligence (AI), and emergencies like the ongoing COVID-19 pandemic [5,6]. Key estimates on 2018–2023 digital evolution by Cisco are reported in Table 1 [7].

Table 1.
Forecast of digital evolution 2018–2023, elaborated from [7].
The fifth-generation mobile network, known as 5G, is being implemented to meet increasing service demand [8]. The related energy demand is under investigation [9,10].
Cryptocurrencies (Bitcoin being the first and most famous) are media of exchange, which are digital, encrypted, and distributed. They are not issued by a central authority but rather are based on a distributed ledger, typically blockchain. Mining is the release of new units of cryptocurrencies [11,12]. The energy and environmental costs of cryptocurrency mining is an emerging issue [13,14,15,16,17]. The estimated energy use related to Bitcoin is reported in Figure 1. Sustainable alternatives are under investigation [18].
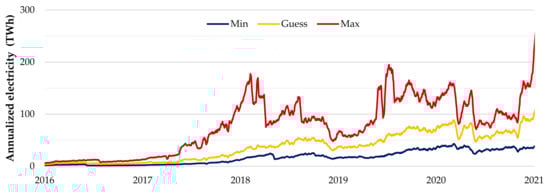
Figure 1.
Estimation of Bitcoin electricity consumption, via the Cambridge Bitcoin Electricity Consumption Index [38].
A blockchain is an open-source distributed database, based on state-of-the-art cryptography, via a distributed ledger [19]. The first application of blockchains has been to support bitcoin transactions; today, they are regarded as disruptive in many applications [20,21], including climate change [22], energy [23], and health [24]. A recent application of blockchains is in smart mobility, supporting Internet-of-Vehicles [25]. The energy and environmental impact of blockchains is investigated [17,26]. Other drivers are modern computing paradigms—cloud computing, edge computing, fog computing, and IoT [3].
The COVID-19 pandemic changed the use of ICT. In March 2020, Microsoft Teams use increased by 775% [27] and Facebook group calls increased tenfold in Italy [28]; Zoom exceeded 200 million daily participants [29]. Changes in social media use following COVID-19 are addressed e.g., by J.P. Morgan [30]; Amazon notably profited [31]. This can also lead to beneficial results: Ong et al. [32,33] estimate the impact of videoconferencing, in terms of energy and CO2 costs over the life cycle, compared to face-to-face meetings.
Information traders (e.g., Google/Alphabet, Amazon, Apple, Facebook, Microsoft) are among top companies by market capitalization [34,35]. ICT electricity demand is expected to accelerate 2020–2030, to 8% ÷ 21% (based on scenario) of total electricity demand [36]. Power usage of data centers can be as high as hundreds of megawatts [37]. Examples of top data centers by power are presented in Table 2.
Table 2.
Examples of top data centers [37,44,45,46].
Data centers use ICT equipment (servers, storage drives, and network devices), which are electrically powered. The operation of ICT requires non-ICT equipment, or data center physical infrastructure (DCPI), e.g., cooling to remove ICT heat, lighting (Figure 2).
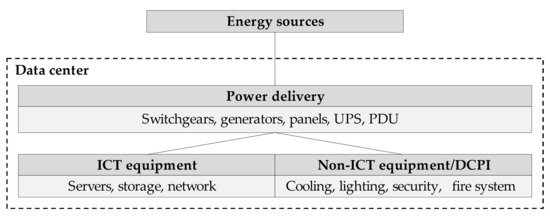
Figure 2.
Energy use in a data center, elaborated from [41].
The top items of energy consumptions are cooling and servers, estimated as 43% each, followed by storage drives and network devices (11% and 3%, respectively) [39]. Other estimations are roughly 52% ICT, 38% cooling system, and 10% other equipment [40].
Power flows in a typical data center are illustrated in Figure 3. Electricity use estimations 2010–2030 for ICT and data centers are presented in Figure 4. Global greenhouse gases (GHG) emissions by ICT are presented in Figure 5.
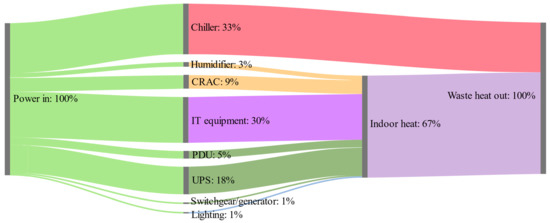
Figure 3.
Power flows in a typical data center, elaborated from [42].
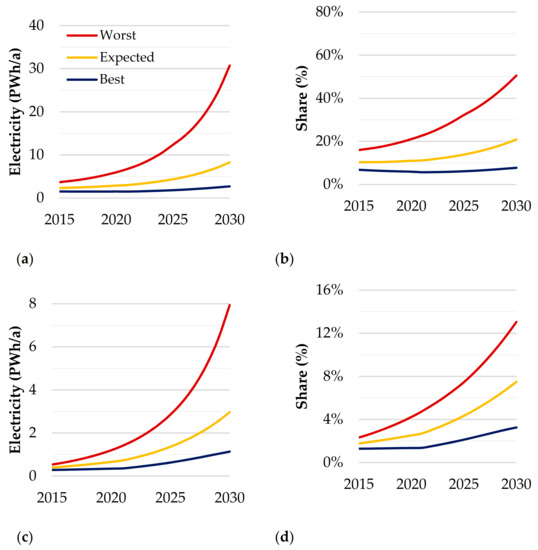
Figure 4.
(a) Global ICT annual electricity use; (b) global ICT annual electricty share; (c) global data center annual electricity use; (d) global data center annual electricity share; elaborated from [36].
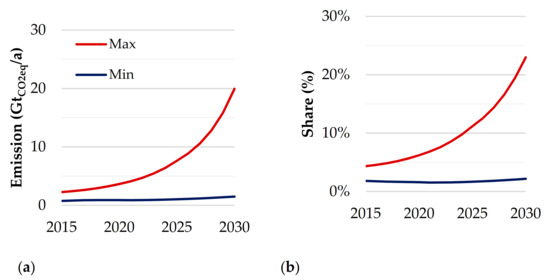
Figure 5.
(a) Global ICT annual GHG emission; (b) global ICT annual GHG emission share; elaborated from [36,48].
On these grounds, energy and environmental sustainability of data centers is a priority in the ICT industry. European strategies push for data center to be carbon-neutral by 2030 [43].
The main actions on energy use and operational carbon of data centers are high-performance computing (software); energy conservation of computer rooms (hardware); low-power servers (hardware); and renewable energy application (hardware) [47] (Figure 6). In this work, we focus on energy conservation strategies at physical level (ICT and DCPI), as outlined in Figure 7—energy conservation at the software level falls outside the scope.
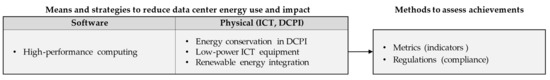
Figure 6.
Schematic of main actions to reduce data center energy use and impact, elaborated from [47].
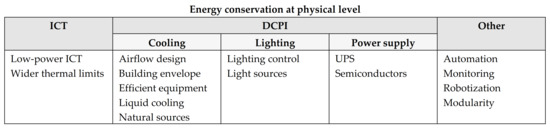
Figure 7.
Examples of main opportunities for energy conservation at physical level.
2. Power Supply and Continuity
Electrical power supply plays a key role in the proper and efficient operation of a data center. The loads of a data center can be classified in two main levels according to the type of service requested. DCPI require a preferential service, by emergency generator sets (EGS)—a downtime of seconds is tolerable, given system inertia. ICT and critical equipment require a vital service with stringent continuity of supply, by Uninterruptible Power Systems (UPS)—they are vulnerable even to very short (milliseconds) voltage dips. Standard ISO 8528-1:2018 defines application, ratings, and performance of EGS [49]. Ratings are outlined in Table 3.
Table 3.
EGS rating definitions, elaborated from [50].
Only COP rating is sufficient for data center Tier III or IV certification (see 2.1) but implies an oversized EGS. DCP is not sufficient as it implies a reliable utility. The additional “data center continuous power” (DCC) rating is defined, as the maximum power that the generator can continuously deliver to a constant or varying load for unlimited time in a data center application [50,51].
Open-source ICT systems are redefining how power is distributed in IT racks, by replacing internal server power supply units (PSU) with a centralized rack-level PSU. Servers use a variety of dc voltage levels, ranging from 12 to 1 Vdc. These are generated from mains ac voltage in several steps via transformers, rectifiers, and converters. PSU can be divided in single-cord or dual-cord supply. Dual-corded equipment is normally fed from separate sources by two PSU below 50% capacity, so that either PSU can feed total load whenever necessary. Conventional internal server PSU architectures and centralized rack-level PSU architectures (12 Vdc and 48 Vdc) are the most used architectures in IT rack data centers. With best-in-class components, the consolidated 12 Vdc rack-level PSU architecture provides a small incremental energy efficiency improvement over the conventional architecture. Consolidating at 48 Vdc provides another small incremental energy efficiency improvement over 12 Vdc. Conventional and open-source PSU are illustrated in Figure 8.
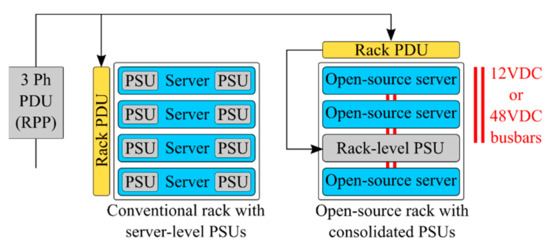
Figure 8.
Conventional server rack and rack with PSU disaggregated from servers, elaborated from [52].
2.1. Tier Classification
Service continuity is of paramount importance for data centers. The Tier classification by The Uptime Institute [53] is the international standard on data center performance. Tiers are assigned based on data center reliability. They consequently define criteria on maintenance, power supply, cooling, and fault capabilities. A summary of Tier classification is reported in Table 4. The Uptime Institute illustrates characteristics of Tiers and features and actions on ICT equipment, electrical infrastructure, mechanical infrastructure, and facility operations for reliability, availability, and serviceability [53]. Examples of power distribution based on Tier are given in Figure 9. Following Tier classification, ratings are defined by standard ANSI/TIA 942-B-2017 [54], as:
Table 4.
Tier classification and requirements summary, elaborated from [53,55].
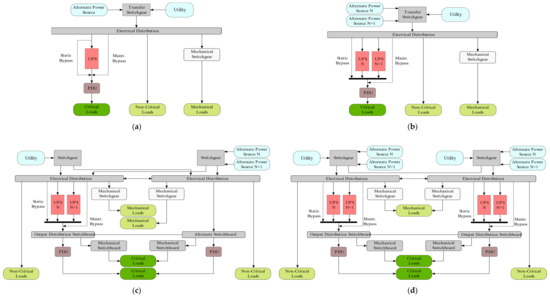
Figure 9.
Diagrams of power distribution systems based on Tier: (a) Tier I; (b) Tier II; (c) Tier III; (d) Tier IV; elaborated from [59].
- Rated-1: Basic site infrastructure;
- Rated-2: Redundant capacity component site infrastructure;
- Rated-3: Concurrently maintainable site infrastructure;
- Rated-4: Fault tolerant site infrastructure.
Redundancy (multiplication of components) is a pursued strategy to reduce probability of failure and improve reliability (ability to perform under stated conditions for a given time) and availability (degree to which a system is operational when required for use) [41,56,57]. Topology and power distribution for reliability is discussed e.g., by Wiboonrat [58]. It should be remarked that redundancy increases costs and decreases energy efficiency [41]. Therefore, sustainability should be assessed also based on reliability. This is also reflected in multidimensional metrics.
2.2. Power Losses
Multiple causes of energy loss exist in a data center, as discussed e.g., by Rasmussen [42]. Ideally, all power should be delivered to IT equipment; in reality, energy is obviously also consumed by non-IT equipment/DCPI. Part of the DCPI is in series with and powers IT while the other is in parallel as it supports IT operation. DCPI efficiency is pursued via more efficient devices, accurate sizing, and innovative techniques. A more accurate sizing matching IT load is regarded as the most immediate opportunity.
Losses in DCPI components are usually divided among no-load losses, proportional losses, and square-law losses; typical values as a fraction of full load rating are reported [42]. An energy model of data centers is also available, illustrating various items of energy loss (Figure 10) [42]. Data center modeling in the literature is discussed by Ahmed et al. and a model of the electrical energy consumption of data center subsystems, considering their interactions and highlighting power losses, is presented [60].
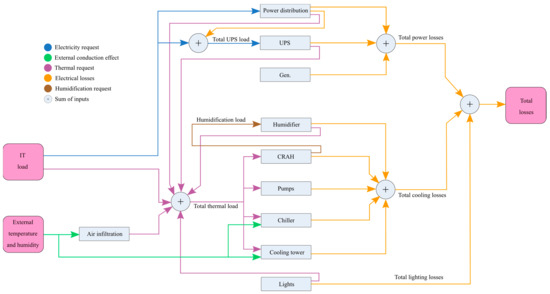
Figure 10.
Diagram of energy losses in a data center, elaborated from [42].
2.3. UPS
Data centers are mission-critical, and reliability is expected; hence, UPS are key. Even if they operate in emergency conditions, they are part of the infrastructure and taken into account in efficiency measurements. UPS losses can be grouped into no-load losses, proportional losses, and square-law losses (Figure 11a), as follows [61]:
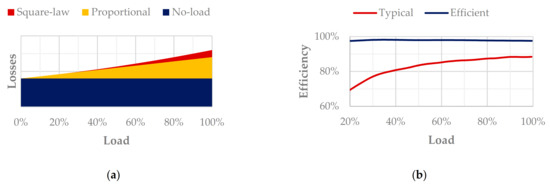
Figure 11.
(a) Total losses in UPS, elaborated from [61]; (b) curve of efficiency of UPS, elaborated from [61,63].
- No-load losses: Caused by no-load losses in transformers, capacitors, and auxiliaries;
- Proportional losses: Due to switching losses in transistors and conduction losses in semiconductors and rectifiers;
- Square-law losses: Joule losses.
UPS efficiency can be pursued via technology, topology, and modularity. Efficiency typically decreases with reduced load in common UPS, while it is maintained in efficient UPS (Figure 11b). UPS efficiency is discussed e.g., by Milad and Darwish [62].
UPS efficiency values are usually given at 100% load under the most favorable conditions, leading to nearly identical values for different UPS. UPS efficiency depends on the load—increasing redundancy means adding extra spare capacity, hence redundancy can have a deep impact on efficiency. Efficiency at 30% load is proposed to better specify a UPS [61]. An example can be given as follows. Assuming 800 kW load, so that a 1000 kW UPS operates at 80% load (typical threshold set by operators), the effect of UPS alternative configurations is as per Table 5. The same load represents a different relative load based on UPS configuration. Above 80% load, the energy cost of UPS losses is regarded as small with respect to IT load. Offline UPS provide the load with a bypass mains power supply without conditioning and ensure maximum efficiency (99%) compared to online UPS.
Table 5.
Example on comparison of loading of different UPS configurations.
Standard IEC 62040-3 [64] applies to electronic UPS that deliver single/three-phase fixed frequency ac output voltage not exceeding 1000 V and that incorporate an energy storage system, generally connected via a dc link. The standard specifies performance and test requirements for a complete UPS system (not of individual UPS functional units) and introduces a code of identification of UPS service.
3. Energy Conservation of Computer Rooms
Rong et al. [47] review technologies for optimizing energy use in data centers as of 2016, including energy conservation in computer rooms. Nadjahi et al. [40] discuss thermal loads, active cooling (air conditioning), and passive cooling (free cooling, liquid cooling, two-phase cooling, building envelope), as of 2018. Ebrahimi et al. [65] discuss configuration of data centers, thermal loads, and thermal management (cooling systems); they also provide discussion on technologies for waste heat recovery. Energy conservation of computer rooms may rely on:
- New architecture and control of the cooling system [40];
- Possible control of lighting system [66].
3.1. Improvement of the Cooling System
As one of major items of energy use in data centers, improvements of cooling systems are investigated. The main strategies are presented in the following.
3.1.1. Location of Data Centers
Choosing the most appropriate location for a data center is essential. One common driver in this choice is the risk associated with the site itself [67]. Here, “risk” has a general meaning, pertaining not only to natural adverse events, but also to utility costs and relationship with other services and facilities.
On the other hand, electric air conditioning is found to aggravate urban microclimate (heat island effect), in turn exacerbating the need for cooling [47,68], in a vicious circle. Nonetheless, location choice based on environmental conditions can improve the efficiency of the cooling system [69,70]. For example, locations with abundant water or cold climate are considered for natural cooling: BMW has a data center in Iceland [71,72], Facebook has and is investing in data centers in Sweden [73,74,75], and Google has a data center in Finland [76]. Microsoft deployed an underwater data center off Scotland’s Orkney Islands [77]. In some of those locations, inexpensive, renewable energy is also available.
Lei et al. [78] recently investigated achievable Power Usage Effectiveness (PUE, see Section 5.1.1), i.e., practical minimum PUE with given climate conditions and state-of-the-art technologies, based on locations of 17 Facebook and Google hyperscale data centers, via a simulation model of free cooling with different sources. It is found that this can impact up to twice as much. The impact on different items of consumption is also noted. Other studies on quantification of the impact of the location were by Depoorter et al. [79] and by Shehabi et al. [80]. Considerations on the location of data centers are addressed by Atkins [81]. An illustration of the distribution of data centers is given in Figure 12.
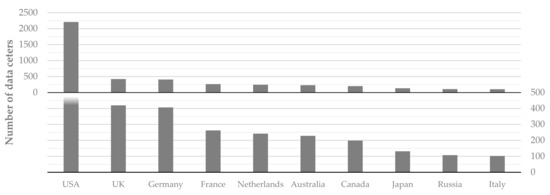
Figure 12.
Distribution of data centers among top countries by numerosity, elaborated from [82].
3.1.2. Room Configuration
The configuration of computer rooms impacts on airflow; parameters can be e.g., room ceiling or configuration of floor openings in raised-floor data centers [83,84,85]. The cost for a proper design of room layout and ventilation system in large data centers is estimated as 8%–10% of total cost and it is usually compensated by energy saving in two to three years [47].
3.1.3. Room Temperature
Room temperature and humidity values are recommended, for equipment life. However, as better equipment is being released, thermal limits are relaxing accordingly, to cut cooling costs. ASHARE thermal guidelines recommended 20–25 °C dry-bulb air temperature in 2004 and 18–27 °C in 2008; in 2011, equipment classes were defined, allowing a range as wide as 5–45 °C. Dell presented servers able to withstand 45 °C air [86]. Google raised room temperature to 26.7 °C [87].
3.1.4. Airflow Pattern and Active Cooling
Unified rack arrangement is now obsolete, implying mixing of hot and cold air; face-to-face or back-to-back (hot aisle/cold aisle) arrangement is now common [40,47,88]. Bedekar et al. [89] investigated the optimal computer room air conditioning (CRAC) location via computational fluid dynamics.
Air distribution in computer rooms is discussed in the literature [40,47,90,91]. Air distribution can be divided as upward or downward. Floor design can be hard floor or overhead. Air pattern can be open, local pipeline, or full pipeline [47]. Air can be conveyed between CRAC and rack via flooded supply/return, locally ducted supply/return, or fully ducted supply/return [91]. To avoid mixing of hot and cold air in hot aisle/cold aisle arrangement, cold aisle containment or hot aisle containment are implemented [40]. The latter is found to be the best of the two [90].
The CRAC unit maintains temperature, airflow, and humidity in the computer room. It typically uses the compression refrigeration cooling. Other than energy consumption, the downsides of active cooling are noise and reliability [40]. To address energy consumption, passive cooling has been investigated.
3.1.5. Innovative Cooling Systems
Innovative cooling systems [92,93,94] can be based on natural air, chilled water, liquid immersion, evaporative cooling, geothermal cooling, passive cooling, pumped two-phase cooling, as well as with the contribution of smart monitoring and IoT.
3.1.6. Use of Natural Cold Source
The use of a natural cold source can be a direct use or an indirect use. In direct use, outdoor air is directly introduced; humidity control and filtration are required. In indirect use, heat exchange equipment is used. The crucial point in using a natural cold source is the efficiency of the heat exchange between indoor and outdoor air [47].
3.1.7. Free Cooling
In free cooling, natural fluids are used, without mechanical active components [40]. This increases energy efficiency, savings, and reliability. Free cooling exploits airside or waterside economization. In airside economization, cold air is used, which must be at least 5 °C colder than indoor air. In waterside economization, water is used, from a nearby water source. In both cases, free cooling can be direct or indirect. In addition, the heat pipe concept can be combined with free cooling. Free cooling technologies are discussed by Zhang et al. [95] and by Daraghmeh et al. [96]. Techniques are reported in Table 6. Reviewed studies present PUE in the range 1.10–1.16 and energy savings 30%-40%; certain studies declare a coefficient of performance up to 9–12, or energy savings up to 47%–49%.
Table 6.
Free cooling techniques.
3.1.8. Liquid Cooling
In high power density data centers, technologies other than air cooling are recommended, e.g., liquid cooling. This has a higher heat transfer capacity per unit mass [97], allowing for a lower temperature difference between equipment and coolant, potentially allowing for passive cooling and also for heat reuse. Liquid cooling systems are discussed e.g., by Capozzoli et al. [98].
Liquid cooling systems can be implemented via micro-channels flow and cold-plate heat exchangers in contact with components. Studies are e.g., by Zimmermann et al. [99,100] (hot water-cooled electronics and heat reuse; energy performance of Aquasar, the first hot water-cooled prototype), Coles et al. [101] (direct liquid cooling), and Iyengar et al. [102,103] (experimental on IBM chiller-less test facility). Commercial systems are proposed e.g., by Asetek [104].
Another emerging technique is the fully immersed direct liquid cooling [90]. Commercial systems are proposed e.g., by Iceotope [105]. Chi et al. [97] compare an air-cooled and a fully immersed liquid-cooled system. Temperatures for liquid-cooling systems are discussed in the literature [97,99,101,106].
3.2. Improvement of Lighting System
Energy saving in lighting is pursued reducing power losses via efficient equipment (passive measures) and regulating power use via control systems (active measures) [107]. The motivation of lighting control is to provide lighting when, where, and in the amount needed.
3.2.1. Lighting Control
Many data centers implement a “lights-out” practice, in which light fixtures are switched manually across a (large) space. The drawbacks are that the illuminated area is large compared to the accessed spot, and that lights can then be left on unnecessarily [66].
A proposed approach is the “follow-me” lighting (implemented e.g., in Facebook’s Oregon and North Carolina data centers) in which lighting is operated as a spotlight following the technician. Motion detectors are implemented in each light fixture and connected to a central application, which controls the on/off state and intensity (dimming) of each fixture [66].
3.2.2. Light Sources
The common, inexpensive technology for data center lighting is fluorescent lighting. Drawbacks are as follows: Life is shortened by number of starts and by dimming; maintenance is required, which is aggravated by shorter life, multitude of lamps, and disposal; dimming, as a cause of aging, is seldom implemented. LED lighting has surpassed fluorescent lighting in energy efficiency and light quality, and it is recommended on the grounds of lower electricity use, lower heat release (impacting on HVAC), and dimming capability. The higher price of LED fixtures is dropping and is compensated by longer life. To further reduce heat release in the data center, LED fixtures are available, which do not implement drivers and are powered via a central supply, providing power conversion and control [66].
3.2.3. Other Strategies for Lighting Improvement
Although black is the most common finish, white racking could reduce the number of luminaires and lighting energy use by as much as 37% each [108].
4. Electronics and Other Strategies
4.1. Low-Power Servers
The server is regarded as the basic unit of power and heat flow path [109]. In low-power servers, energy usage is reduced via components configuration. Approaches are illustrated by Rong et al. [47], including features, energy efficiency, and constraint of selected technologies. Recent advancements are presented by Jin et al. [109], who compare existing server power consumption models and identify future research trends. It is found that it is possible to handle a heavier workload without increasing energy use. While accurate power consumption models of servers result in accurate cooling load calculation and avoid excessive redundancy, energy- and thermal-aware managements based on the model results in the best overall energy-savings. Meisner et al. [110] investigated high-power versus low-power server design.
4.2. The Little Box Challenge
Shrinking magnetics, capacitance, and heat extraction are the main challenges in the design of high-power density converters [111]. The Little Box Challenge (LBC) was a competition, sponsored by Google and the IEEE Power Electronics Society [112,113], to build a prototype of a power inverter with the given specifications (e.g., size approximately 1/10 of that of contemporary state of the art, efficiency above 95%, fitting in a 40 in3 casing) [114]. Improving Google’s data center efficiency was among the scopes [112]. Main design challenges are discussed by Neumayr et al. [115]. The outcomes ignited attention from the consumer electronics community and technology advancements. Design challenges and proposed solutions are examined [111,116] (Table 7).
Table 7.
Main features of LBC finalists [111,116].
Approaches to heat management are discussed by Kim et al. [116] (Table 8). Wide-bandgap switches cause lower switching losses than silicon switches. They are decisive in high-power density converters and were widely used in LBC prototypes. It is deduced that all teams relied on forced air cooling via fans. The winners (Red Electrical Devils by CE+T) paid much attention to thermal design [117].
Table 8.
Thermal management of LBC finalists [116].
4.3. Direct-Current Power Supply
The diffusion of dc grids and power supply systems is envisaged in the evolution of the power system and ICT [118,119]. Wong et al. [118] simulate a modular dc power supply unit for servers. Pueschel [119] investigates a 380 Vdc microgrid, serving an office building and the data center of a German company, as an approach to energy efficiency and safety.
4.4. Semiconductors
Until recently, the best efficiency in UPS power stages (96%) was achieved via insulated-gate bipolar transistors (IGBT) with three-level switching topologies. Recently, silicon carbide (SiC) transistors were able to exceed 98% efficiency, nearly independent of percentage load. This is possible via the properties of wide-bandgap (WBG) semiconductors. SiC devices are proposed by ROHM Semiconductor, Wolfspeed, and ON Semiconductor [120]. As an example, the efficiency of a Mitsubishi SiC-based UPS is reported above 98% for any load above 30% [63].
4.5. Automation, Monitoring, and Robotization
The integration of robotics in data centers is envisaged for their management and maintenance. While robots cannot completely replace human operators, they can be used to automate repetitive tasks, relieving operators and increasing productivity. Robotic maintenance can enable the implementation of “lights out” data centers and of a vertical configuration of the space. Challenges and possible benefits are discussed [121]. An unmanned data center has been launched by AOL [122]. In addition, robotics can be used for diagnosis of data centers and energy management [123,124,125]. Emerging applications of automation, monitoring, and robotization are presented by Levy and Subburaj [126].
4.6. Modular Data Centers
Modular data centers are mobile data centers, designed for rapid deployment, e.g., for disaster recovery. They feature high energy efficiency and density, and they can be easily scaled. As an example, HP manufactures the Performance Optimized Datacenter (POD). Model 240a, nicknamed “EcoPOD”, has a declared PUE of 1.05 to 1.30.
5. Regulatory Environment Governing Data Centers
To support advancements in data center sustainability, a regulatory environment is important, providing standardized requirements and evaluation methods.
5.1. Metrics
5.1.1. Indicators
Given the increasing impact of data centers on society under many aspects (energy, security, sustainability), the need for comparing different solutions calls for reliable metrics and figures of merit. That is the reason behind the introduction of the “multidimensional approach” by Levy and Raviv [41,127], who formalized more specific previous attempts, such as [128]. That approach was then specialized on “green” [129,130] and sustainability metrics [131,132].
Concerning data center efficiency, common metrics are the power usage effectiveness (PUE) and the carbon usage effectiveness (CUE). PUE is defined as the ratio of total facility power to ICT power, quantifying extra power required per unit ICT power. The best PUE is ideally 1 and in practice it ranges from 1.2 (very efficient) to 3 (very inefficient). The data center infrastructure efficiency (DCIE) is sometimes used, equivalent to the inverse of PUE. CUE is defined as the ratio of total CO2 emission to ICT power. Alternatively, it can be defined as the product of CO2 emission factor (CEF) and PUE [133].
Other performance indicators are reported [47,133,134]. Specific indicators are proposed, to quantify effectiveness of on-site renewable generation (on-site energy fraction, OEF, and on-site energy matching, OEM), energy reuse (energy reuse factor, ERF), and water usage (water usage effectiveness, WUE) [133]. Concerning data center sustainability, specific environmental metrics beyond renewable energy and efficiency can be introduced, such as those related to lifecycle assessment, decommissioning costs, the use of recycled materials, and the possibility of second-life reuse of some parts [135,136]. Moreover, indicators exist to correlate energy to processed information, e.g., joules per bit [137]. Levy and Raviv present a discussion on metrics and sub-metrics and propose a new metric approach, the “data center multidimensional scorecard”, illustrated in Figure 13 [41]. In addition, Lykou et al. discuss existing metrics and propose a new, sustainability-oriented methodology [138]. A comprehensive taxonomy on data center metrics is presented by Reddy et al. [139].
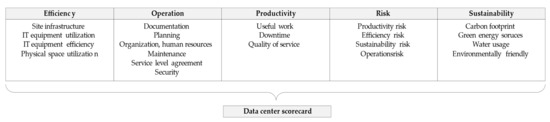
Figure 13.
Illustration of the data center multidimensional scorecard metric, elaborated from [41].
5.1.2. Trends
A global survey by the Uptime Institute reported average annual PUE to have decreased 2007–2013 and then stalled (Figure 14). Improvements are due to major steps in energy efficiency (hot/cold air separation, increased thermal limits, enhanced control, free cooling). Speculations on the recent stall include exceptional outdoor temperatures, shift of workloads to public cloud services—resulting in data centers operating inefficiently—or diffusion of the high power density data center.

Figure 14.
Evolution of industry-average PUE, elaborated from [140].
5.2. Regulations
The main requirements of data centers [141] are on: Temperature and humidity control—see ASHRAE specifications [142], static electricity monitoring; fire suppression; physical security; continuity and quality of supply, availability, physical protection, information security (protection of personal and financial data), etc. The regulatory framework concerning data centers is constantly evolving; the main institutions that have contributed are listed by Levy and Raviv [41]. An overview on the matter is reported in Table 9.
Table 9.
Main best practices, guidelines, and standards on data centers.
5.3. Certifications and Initiatives
Data centers fall within certifications or initiatives on sustainable ICT or buildings.
In the United States, possible certifications for green data centers are the Leadership in Energy and Environmental Design (LEED) by the U.S. Green Building Council [143] and the U.S. National Data Center Energy Efficiency Information Program within the ENERGY STAR program [144]. Other than advanced cooling and reduced energy use, features of an LEED compliant data center are a clean backup system, the use of renewable energy, green construction, and intelligent design [145].
A number of companies and other stakeholders of data center efficiency are part of The Green Grid consortium [146]. The Green500 list biannually ranks supercomputers, in the TOP500 list, for energy efficiency—the NVIDIA DGX SuperPOD (2.356 Pflops) ranked first in November 2020 with 26.195 Gflops/W [147]. Other pertaining initiatives in the U.S.A. are the Energy Efficiency Improvement Act of 2014 (H.R. 2126), the Data Center Optimization Initiative, and the Federal Data Center Consolidation Initiative [41].
6. Net Zero Energy Data Center
The concept of Net Zero Energy Data Center (NZEDC) can be taken to recap the main strategies for data center sustainability. NZEDC are defined, as per Deliverable 4.5 of project RenewIT [148], as data centers that «consume net zero non-renewable primary energy from power grid and district energy networks during their lifetime, while generating as much energy (both electric and thermal) as they use during a year». A road map towards NZEDC is presented in Table 10. Many technical concepts are investigated in the mentioned deliverable, as presented in Figure 15, and the results on energy flows are discussed.
Table 10.
Road map to net zero energy data center, elaborated from [148].
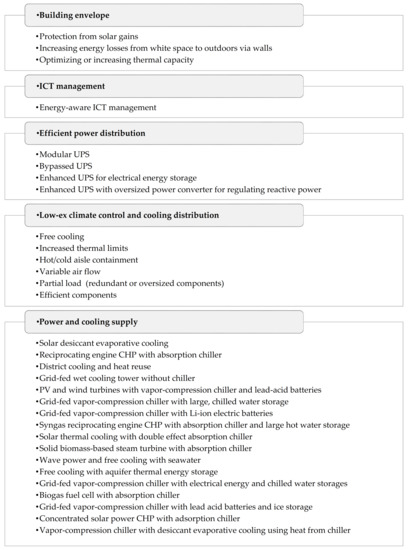
Figure 15.
Advanced technical concepts to reduce electric and cooling load, elaborated from [148].
7. Conclusions
Energy use for ICT is ever more increasing and so are concerns on the sustainability of data centers. In this paper, we review approaches to reduce energy consumption and resource depletion caused by the operation of data centers, highlighting promising strategies and future research directions. The main actions are on software (HPC) and hardware (energy conservation of computer rooms—cooling and lighting, energy conservation in electronic equipment, integration of renewable energy). Metrics and the regulatory environment are a useful framework to support actions. Several indicators have been introduced to assess the state of the art and future targets of single aspects of efficiency (energy efficiency, carbon impact, use of resources). As a general concept, the definition of NZEDC was proposed in the literature and it can be regarded as a useful benchmark. To reduce cooling load, several concepts have been proposed, taking advantage of favorable environmental conditions (location), natural cold sources, and passive cooling. Furthermore, electronics are evolving to reduce IT load, via energy-aware IT management and new architectures. Additionally, a balance must be achieved between energy conservation and performances (continuity and quality). The extension of efficiency initiatives to data centers and the investigation of new technologies are desirable. As our life ever more relies on data and thus on the data center industry, in light of the ongoing digital evolution and rising environmental concerns, the sustainability of data centers must be pursued.
Funding
This research received no external funding.
Acknowledgments
The authors acknowledge Matteo Dalboni and Ludovica Gentili (Department of Engineering and Architecture, University of Parma, Italy) for technical support on figures and Jeff Litherland (Global Power, LLC) for technical documentation. Author Seeram Ramakrishna acknowledges the IAF-PP project “Sustainable Tropical Data Centre Test Bed” recently awarded by the National Research Foundation of Singapore.
Conflicts of Interest
The authors declare no conflict of interest.
References
- Dhillon, G. Council Post: From the Age of Computing to The Age of Data: Are You Ready? Available online: https://www.forbes.com/sites/forbestechcouncil/2019/03/27/from-the-age-of-computing-to-the-age-of-data-are-you-ready/ (accessed on 1 March 2021).
- Allen, R.; Siukonen, P.; Cattermull, N.; Brown, M.; Eaves, S. Devouring Data: 5G, Edge Computing & the Future of Data Centres; Kingston Technology Europe: Sunbury-on-Thames, UK, 2020. [Google Scholar]
- Donno, M.D.; Tange, K.; Dragoni, N. Foundations and Evolution of Modern Computing Paradigms: Cloud, IoT, Edge, and Fog. IEEE Access 2019, 7, 150936–150948. [Google Scholar] [CrossRef]
- World Bank. Europe and Central Asia Economic Update, May 2018: Cryptocurrencies and Blockchain; World Bank: Washington, DC, USA, 2018. [Google Scholar]
- Eaves, S. The Demand on Data Centers in the Time of Coronavirus. 2021. Available online: https://www.kingston.com/italy/us/solutions/servers-data-centers/coronavirus-demands-on-data-centers (accessed on 1 January 2021).
- Nicholson, J. How is Coronavirus Impacting the News? Our Analysis of Global Traffic and Coverage Data—Chartbeat Blog. 2020. Available online: https://blog.chartbeat.com/2020/03/25/coronavirus-data-news-traffic-impact-analysis/ (accessed on 1 January 2021).
- Cisco. Cisco Annual Internet Report (2018–2023). 2020. Available online: https://www.cisco.com/c/en/us/solutions/collateral/executive-perspectives/annual-internet-report/white-paper-c11-741490.pdf (accessed on 1 February 2021).
- Liu, Y.; Peng, M.; Shou, G.; Chen, Y.; Chen, S. Toward Edge Intelligence: Multiaccess Edge Computing for 5G and Internet of Things. IEEE Internet Things J. 2020, 7, 6722–6747. [Google Scholar] [CrossRef]
- Chih-Lin, I.; Han, S.; Bian, S. Energy-efficient 5G for a greener future. Nat. Electron. 2020, 3, 182–184. [Google Scholar]
- Panwar, N.; Sharma, S.; Singh, A.K. A survey on 5G: The next generation of mobile communication. Phys. Commun. 2016, 18, 64–84. [Google Scholar] [CrossRef]
- Ashford, K. What Is Cryptocurrency? 2020. Available online: https://www.forbes.com/advisor/investing/what-is-cryptocurrency/ (accessed on 1 February 2021).
- Lansky, J. Possible State Approaches to Cryptocurrencies. J. Syst. Integr. 2018, 9, 19–31. [Google Scholar] [CrossRef]
- Li, J.; Li, N.; Peng, J.; Cui, H.; Wu, Z. Energy consumption of cryptocurrency mining: A study of electricity consumption in mining cryptocurrencies. Energy 2019, 168, 160–168. [Google Scholar] [CrossRef]
- Krause, M.J.; Tolaymat, T. Quantification of energy and carbon costs for mining cryptocurrencies. Nat. Sustain. 2018, 1, 711–718. [Google Scholar] [CrossRef]
- Mora, C.; Rollins, R.L.; Taladay, K.; Kantar, M.B.; Chock, M.K.; Shimada, M.; Franklin, E.C. Bitcoin emissions alone could push global warming above 2 °C. Nat. Clim. Chang. 2018, 8, 931–933. [Google Scholar] [CrossRef]
- Dittmar, L.; Praktiknjo, A. Could Bitcoin emissions push global warming above 2 °C? Nat. Clim. Chang. 2019, 9, 656–657. [Google Scholar] [CrossRef]
- Sedlmeir, J.; Buhl, H.U.; Fridgen, G.; Keller, R. The Energy Consumption of Blockchain Technology: Beyond Myth. Bus. Inf. Syst. Eng. 2020, 62, 599–608. [Google Scholar] [CrossRef]
- Fairley, P. The Ridiculous Amount of Energy It Takes to Run Bitcoin—IEEE Spectrum. 2017. Available online: https://spectrum.ieee.org/energy/policy/the-ridiculous-amount-of-energy-it-takes-to-run-bitcoin (accessed on 1 February 2021).
- IEEE Blockchain Initiative. 2021. Available online: https://blockchain.ieee.org/about (accessed on 1 April 2021).
- Laroiya, C.; Saxena, D.; Komalavalli, C. Applications of Blockchain Technology. In Handbook of Research on Blockchain Technology; Krishnan, S., Balas, V.E., Julie, E.G., Robinson, Y.H., Balaji, S., Kumar, R., Eds.; Academic Press: Cambridge, MA, USA, 2020; pp. 213–243, Chapter 9. [Google Scholar]
- Frauenthaler, P.; Sigwart, M.; Spanring, C.; Sober, M.; Schulte, S. ETH Relay: A Cost-efficient Relay for Ethereum-based Blockchains. In Proceedings of the in 2020 IEEE International Conference on Blockchain (Blockchain), Rhodes, Greece, 2–6 November 2020; pp. 204–213. [Google Scholar]
- Howson, P. Tackling climate change with blockchain. Nat. Clim. Chang. 2019, 9, 644–645. [Google Scholar] [CrossRef]
- Andoni, M.; Robu, V.; Flynn, D.; Abram, S.; Geach, D.; Jenkins, D.; McCallum, P.; Peacock, A. Blockchain technology in the energy sector: A systematic review of challenges and opportunities. Renew. Sustain. Energy Rev. 2019, 100, 143–174. [Google Scholar] [CrossRef]
- Gunasekeran, D.V.; Tseng, R.M.W.W.; Tham, Y.-C.; Wong, T.Y. Applications of digital health for public health responses to COVID-19: A systematic scoping review of artificial intelligence, telehealth and related technologies. NPJ Digit. Med. 2021, 4, 40. [Google Scholar] [CrossRef]
- Gao, L.; Wu, C.; Yoshinaga, T.; Chen, X.; Ji, Y. Multi-channel Blockchain Scheme for Internet of Vehicles. IEEE Open J. Comput.Soc. 2021, 2, 192–203. [Google Scholar] [CrossRef]
- Ghosh, E.; Das, B. A Study on the Issue of Blockchain’s Energy Consumption. In Proceedings of the International Ethical Hacking Conference 2019; Springer: Singapore, 2020; pp. 63–75. [Google Scholar]
- Microsoft. Update #2 on Microsoft Cloud Services Continuity. 2020. Available online: https://azure.microsoft.com/en-us/blog/update-2-on-microsoft-cloud-services-continuity/ (accessed on 1 March 2021).
- Facebook. Keeping Our Services Stable and Reliable During the COVID-19 Outbreak—About Facebook. 2020. Available online: https://about.fb.com/news/2020/03/keeping-our-apps-stable-during-covid-19/ (accessed on 1 March 2021).
- Yuan, E.S. A Message to our Users. 2020. Available online: https://blog.zoom.us/a-message-to-our-users/ (accessed on 1 March 2021).
- Morgan, J.P. Media Consumption in the Age of COVID-19. 2020. Available online: https://www.jpmorgan.com/insights/research/media-consumption (accessed on 1 March 2021).
- Klebnikov, S. 5 Big Numbers That Show Amazon’s Explosive Growth during the Coronavirus Pandemic. 2021. Available online: https://www.forbes.com/sites/sergeiklebnikov/2020/07/23/5-big-numbers-that-show-amazons-explosive-growth-during-the-coronavirus-pandemic/ (accessed on 1 March 2021).
- Ong, D.; Moors, T.; Sivaraman, V. Complete life-cycle assessment of the energy/CO2 costs of videoconferencing vs face-to-face meetings. In Proceedings of the 2012 IEEE Online Conference on Green Communications (GreenCom), Piscataway, NJ, USA, 25–28 September 2012; pp. 50–55. [Google Scholar]
- Ong, D.; Moors, T.; Sivaraman, V. Comparison of the energy, carbon and time costs of videoconferencing and in-person meetings. Comput. Commun. 2014, 50, 86–94. [Google Scholar] [CrossRef]
- Jones, N. How to stop data centres from gobbling up the world’s electricity. Nat. Cell Biol. 2018, 561, 163–166. [Google Scholar] [CrossRef]
- YCharts. 2021. Available online: https://ycharts.com/ (accessed on 1 February 2021).
- Andrae, A.S.G.; Edler, T. On Global Electricity Usage of Communication Technology: Trends to 2030. Challenges 2015, 6, 117–157. [Google Scholar] [CrossRef]
- World’s Top. Data Centers. 2014. Available online: http://worldstopdatacenters.com (accessed on 1 February 2021).
- Cambridge Centre for Alternative Finance. Cambridge Bitcoin Electricity Consumption Index (CBECI). 2021. Available online: https://cbeci.org/ (accessed on 1 February 2021).
- Shehabi, A.; Smith, S.; Sartor, D.; Brown, R.; Herrlin, M.; Koomey, J.; Masanet, E.; Horner, N.; Azevedo, I.; Lintner, W. United States Data Center Energy Usage Report. 2016. Available online: https://www.osti.gov/servlets/purl/1372902 (accessed on 1 January 2021).
- Nadjahi, C.; Louahlia, H.; Lemasson, S. A review of thermal management and innovative cooling strategies for data center. Sustain. Comput. Inform. Syst. 2018, 19, 14–28. [Google Scholar] [CrossRef]
- Levy, M.; Raviv, D. An Overview of Data Center Metrics and a Novel Approach for a New Family of Metrics. Adv. Sci. Technol. Eng. Syst. J. 2018, 3, 238–251. [Google Scholar] [CrossRef][Green Version]
- Rasmussen, N. Electrical Efficiency Measurement for Data Centers—White Paper 154—Revision 2; Schneider Electric’s Data Center Science Center: Rueil-Malmaison, France, 2011. [Google Scholar]
- Directorate General for Communications Networks Content and Technology. Shaping Europe’s Digital Future. 2020. Available online: http://op.europa.eu/it/publication-detail/-/publication/33b6e417-53c8-11ea-aece-01aa75ed71a1 (accessed on 1 February 2021).
- Analytics Vidhya. Available online: https://www.analyticsvidhya.com/blog/ (accessed on 1 May 2021).
- Chawla, V. Yotta Infrastructure Inaugurates India’s Largest Data Center Facility. 2020. Available online: https://analyticsindiamag.com/yotta-infrastructure-inaugurates-indias-largest-data-center-facility/ (accessed on 1 May 2021).
- DataCenters.com. 2021. Available online: https://www.datacenters.com/ (accessed on 1 May 2021).
- Rong, H.; Zhang, H.; Xiao, S.; Li, C.; Hu, C. Optimizing energy consumption for data centers. Renew. Sustain. Energy Rev. 2016, 58, 674–691. [Google Scholar] [CrossRef]
- Belkhir, L.; Elmeligi, A. Assessing ICT global emissions footprint: Trends to 2040 & recommendations. J. Clean. Prod. 2018, 177, 448–463. [Google Scholar]
- ISO 8528-1:2018. Reciprocating Internal Combustion Engine Driven Alternating Current Generating Sets Application, Ratings and Performance; ISO: Geneva, Switzerland, 2018. [Google Scholar]
- Yoon, S.; Scroggins, R. Generator Set Ratings for Data Centers and Other Applications; Cummins: Columbus, IN, USA, 2019. [Google Scholar]
- Matuseski, D. Data Center Continuous (DCC) Ratings: A Comparison of DCC Ratings, ISO Definitions and Uptime Requirements; Cummins: Columbus, IN, USA, 2018. [Google Scholar]
- Bunger, R.; Torell, W. Efficiency Analysis of Consolidated vs. Conventional Server Power Architectures—White Paper 232; Schneider Electric’s Data Center Science Center: Rueil-Malmaison, France, 2019. [Google Scholar]
- Turner, W.P.; Seader, J.H.; Brill, K.G. Industry Standard Tier Classifications Define Site Infrastructure Performance; Uptime Institute: Santa Fe, NM, USA, 2005. [Google Scholar]
- ANSI/TIA-942-B-2017; Telecommunications Infrastructure Standard for Data Centers: Arlington, VA, USA, 2017.
- Uptime Institute. Tier Standard: Topology; Uptime Institute: New York, NY, USA, 2018. [Google Scholar]
- Minas, L.; Ellison, B. Energy Efficiency for Information Technology: How to Reduce Power Consumption in Servers and Data Centers; Intel Press: Santa Clara, CA, USA, 2009. [Google Scholar]
- ANSI/BICSI-002 Data Center Design and Implementation Best Practices; BICSI: Tampa, FL, USA, 2019.
- Wiboonrat, M. Energy sustainability and management of data center. In Proceedings of the in 2016 World Congress on Sustainable Technologies (WCST), London, UK, 12–14 December 2016; pp. 23–28. [Google Scholar]
- Global Power Supply LLC. Personal communication, 2021.
- Ahmed, K.M.U.; Sutaria, J.; Bollen, M.H.J.; Rönnberg, S.K. Electrical Energy Consumption Model of Internal Components in Data Centers. In Proceedings of the in 2019 IEEE PES Innovative Smart Grid Technologies Europe (ISGT-Europe), Bucharest, Romania, 29 September–2 October 2019; pp. 1–5. [Google Scholar]
- Sawyer, R.L. Making Large UPS Systems More Efficient—White Paper 108; Schneider Electric’s Data Center Science Center: Rueil-Malmaison, France, 2006. [Google Scholar]
- Milad, M.; Darwish, M. UPS system: How can future technology and topology improve the energy efficiency in data centers? In Proceedings of the 2014 49th International Universities Power Engineering Conference (UPEC), Cluj-Napoca, Romania, 2–5 September 2014; pp. 1–4. [Google Scholar]
- Mitsubishi. Uninterruptible Power Supplies—UPS Systems—Backup Power | Mitsubishi Electric. 2021. Available online: https://www.mitsubishicritical.com/ (accessed on 1 January 2021).
- IEC 62040-3:2011 Uninterruptible Power Systems (UPS)—Part 3: Method of Specifying the Performance and Test Requirements; IEC: Geneva, Switzerland, 2011.
- Ebrahimi, K.; Jones, G.F.; Fleischer, A.S. A review of data center cooling technology, operating conditions and the corresponding low-grade waste heat recovery opportunities. Renew. Sustain. Energy Rev. 2014, 31, 622–638. [Google Scholar] [CrossRef]
- Commscope. Lighting and the Efficient Data Center. 2014. Available online: https://capital-electric.com/wp-content/files/Data.Center.Lighting-CommScope.pdf (accessed on 1 January 2021).
- Levy, M.; Raviv, D. A framework for data center site risk metric. In Proceedings of the 2017 IEEE 8th Annual Ubiquitous Computing, Electronics and Mobile Communication Conference (UEMCON), New York, NY, USA, 19–21 October 2017; pp. 9–15. [Google Scholar]
- Li, C.; Zhou, J.; Cao, Y.; Zhong, J.; Liu, Y.; Kang, C.; Tan, Y. Interaction between urban microclimate and electric air-conditioning energy consumption during high temperature season. Appl. Energy 2014, 117, 149–156. [Google Scholar] [CrossRef]
- Díaz, A.J.; Neves, G.; Silva-Llanca, L.; Valle, M.D.; Cardemil, J.M. Meteorological assessment and implementation of an air-side free-cooling system for data centers in Chile. In Proceedings of the in 2017 16th IEEE Intersociety Conference on Thermal and Thermomechanical Phenomena in Electronic Systems (ITherm), Orlando, FL, USA, 30 May–2 June 2017; pp. 943–947. [Google Scholar]
- Malkamäki, T.; Ovaska, S.J. Data centers and energy balance in Finland. In Proceedings of the 2012 International Green Computing Conference (IGCC), San Jose, CA, USA, 4–8 June 2012; pp. 1–6. [Google Scholar]
- Rath, J. BMW to Deploy HPC Clusters at Verne Global in Iceland. 2012. Available online: https://www.datacenterknowledge.com/archives/2012/09/20/bmw-to-build-hpc-clusters-at-verne-global-in-iceland (accessed on 1 January 2021).
- Adalbjornsson, T. Iceland’s Data Centers Are Booming—Here’s Why That’s a Problem. 2019. Available online: https://www.technologyreview.com/2019/06/18/134902/icelands-data-centers-are-booming-heres-why-thats-a-problem/ (accessed on 1 January 2021).
- Baxtel. Facebook Data Center Locations, News, Photos, and Maps. Available online: https://baxtel.com/data-centers/facebook (accessed on 1 January 2021).
- Bradbury, D. Super Cool: Arctic Data Centres Aren’t Just for Facebook. 2016. Available online: https://www.theregister.com/2016/05/12/power_in_a_cold_climate/ (accessed on 1 January 2021).
- Harding, L. The node pole: Inside Facebook’s Swedish hub near the Arctic Circle. The Guardian, 25 September 2015. [Google Scholar]
- Google. Hamina, Finlandia—Data Center—Google. 2021. Available online: https://www.google.com/intl/it/about/datacenters/locations/hamina/ (accessed on 1 January 2021).
- Microsoft. Microsoft Finds Underwater Datacenters Are Reliable, Practical and Use Energy Sustainably|Innovation Stories. 2020. Available online: https://news.microsoft.com/innovation-stories/project-natick-underwater-datacenter/ (accessed on 1 January 2021).
- Lei, N.; Masanet, E. Statistical analysis for predicting location-specific data center PUE and its improvement potential. Energy 2020, 201, 117556. [Google Scholar] [CrossRef]
- Depoorter, V.; Oró, E.; Salom, J. The location as an energy efficiency and renewable energy supply measure for data centres in Europe. Appl. Energy 2015, 140, 338–349. [Google Scholar] [CrossRef]
- Shehabi, A.; Masanet, E.; Price, H.; Horvath, A.; Nazaroff, W.W. Data center design and location: Consequences for electricity use and greenhouse-gas emissions. Build. Environ. 2011, 46, 990–998. [Google Scholar] [CrossRef]
- Atkins, E. Tracing the ‘cloud’: Emergent political geographies of global data centres. Political Geogr. 2020, 102306. [Google Scholar] [CrossRef]
- Grand View Research. Data Center Power Market Size, Share & Trends Analysis Report by Product (PDU, UPS, Busway), By End Use (IT & Telecom, BFSI, Energy, Healthcare, Retail), By Region, and Segment Forecasts, 2019–2025. 2019. Available online: https://www.researchandmarkets.com/reports/4753469/data-center-power-market-size-share-and-trends (accessed on 1 February 2021).
- Sorell, V.; Abougabal, Y.; Khankari, K.; Gandhi, V.; Watave, A. An Analysis of the Effects of Ceiling Height on Air Distribution in Data Centers. Ashrae Trans. 2006, 112, 623–631. [Google Scholar]
- Karki, K.C.; Patankar, S.V. Airflow distribution through perforated tiles in raised-floor data centers. Build. Environ. 2006, 41, 734–744. [Google Scholar] [CrossRef]
- Patankar, S.V. Airflow and Cooling in a Data Center. J. Heat Transf. 2010, 132, 073001. [Google Scholar] [CrossRef]
- Fitch, J. Dell’s Next Generation Servers: Pushing the Limits of Data Center Cooling Cost Savings; DELL: Round Rock, TX, USA, 2012. [Google Scholar]
- Google. Data Center Efficiency. 2021. Available online: https://www.google.com/intl/it/about/datacenters/efficiency/ (accessed on 1 January 2021).
- Sullivan, R. Alternating Cold and Hot Aisles Provides More Reliable Cooling for Server Farms; Uptime Institute: Santa Fe, NM, USA, 2002. [Google Scholar]
- Bedekar, V.; Karajgikar, S.; Agonafer, D.; Iyyengar, M.; Schmidt, R. Effect of CRAC location on fixed rack layout. In Proceedings of the Thermal and Thermomechanical 10th Intersociety Conference on Phenomena in Electronics Systems, ITHERM 2006, San Diego, CA, USA, 30 May–2 June 2006; pp. 5–425. [Google Scholar]
- Niemann, J.; Brown, K.; Avelar, V. Impact of Hot and Cold Aisle Containment on Data Center Temperature and Efficiency—White Paper 135; Schneider Electric’s Data Center Science Center: Rueil-Malmaison, France, 2013. [Google Scholar]
- Rasmussen, N. The Different Types of Air Distribution for IT Environments—White Paper 55—Revision 5; Schneider Electric’s Data Center Science Center: Rueil-Malmaison, France, 2020. [Google Scholar]
- Netrality. Making Data Centers Cool. 2019. Available online: https://netrality.com/innovation/making-data-centers-cool/ (accessed on 1 January 2021).
- Matthews, K. The Future of Data Center Cooling: Five Trends to Follow. 2021. Available online: https://www.vxchnge.com/blog/the-future-of-data-center-cooling (accessed on 1 January 2021).
- Legrand. Passive Cooling Solutions for Data Center and Server Rooms. Available online: https://datacenter.legrand.com/en/our-solutions/racks-%26-cooling/passive-cooling (accessed on 1 January 2021).
- Zhang, H.; Shao, S.; Xu, H.; Zou, H.; Tian, C. Free cooling of data centers: A review. Renew. Sustain. Energy Rev. 2014, 35, 171–182. [Google Scholar] [CrossRef]
- Daraghmeh, H.M.; Wang, C.-C. A review of current status of free cooling in datacenters. Appl. Therm. Eng. 2017, 114, 1224–1239. [Google Scholar] [CrossRef]
- Chi, Y.Q.; Summers, J.; Hopton, P.; Deakin, K.; Real, A.; Kapur, N.; Thompson, H. Case study of a data centre using enclosed, immersed, direct liquid-cooled servers. In Proceedings of the 2014 Semiconductor Thermal Measurement and Management Symposium (SEMI-THERM), San Jose, CA, USA, 9–13 March 2014; pp. 164–173. [Google Scholar]
- Capozzoli, A.; Primiceri, G. Cooling Systems in Data Centers: State of Art and Emerging Technologies. Energy Procedia 2015, 83, 484–493. [Google Scholar] [CrossRef]
- Zimmermann, S.; Meijer, I.; Tiwari, M.K.; Paredes, S.; Michel, B.; Poulikakos, D. Aquasar: A hot water cooled data center with direct energy reuse. Energy 2012, 43, 237–245. [Google Scholar] [CrossRef]
- Zimmermann, S.; Tiwari, M.K.; Meijer, I.; Paredes, S.; Michel, B.; Poulikakos, D. Hot water cooled electronics: Exergy analysis and waste heat reuse feasibility. Int. J. Heat Mass Transf. 2012, 55, 6391–6399. [Google Scholar] [CrossRef]
- Coles, H.; Greenberg, S. Direct Liquid Cooling for Electronic Equipment; LNBL: Berkeley, CA, USA, 2014. [Google Scholar]
- Iyengar, M.; David, M.; Parida, P.; Kamath, V.; Kochuparambil, B.; Graybill, D.; Simons, R.; Schmidt, R.; Chainer, T. Server liquid cooling with chiller-less data center design to enable significant energy savings. In Proceedings of the 2012 28th Annual IEEE Semiconductor Thermal Measurement and Management Symposium (SEMI-THERM), San Jose, CA, USA, 18–22 March 2012; pp. 212–223. [Google Scholar]
- Iyengar, M.; David, M.; Parida, P.; Kamath, V.; Kochuparambil, B.; Graybill, D.; Simons, R.; Schmidt, R.; Chainer, T. Extreme energy efficiency using water cooled servers inside a chiller-less data center. In Proceedings of the 13th InterSociety Conference on Thermal and Thermomechanical Phenomena in Electronic Systems, San Diego, CA, USA, 30 May–1 June 2012; pp. 137–149. [Google Scholar]
- Asetek. Asetek Liquid Cooling. Available online: https://asetek.com/ (accessed on 1 January 2021).
- Iceotope. Iceotope. Available online: https://www.iceotope.com/ (accessed on 1 January 2021).
- Kim, M.-H.; Ham, S.-W.; Park, J.-S.; Jeong, J.-W. Impact of integrated hot water cooling and desiccant-assisted evaporative cooling systems on energy savings in a data center. Energy 2014, 78, 384–396. [Google Scholar] [CrossRef]
- Manganelli, M.; Consalvi, R. Design and energy performance assessment of high-efficiency lighting systems. In Proceedings of the 2015 IEEE 15th International Conference on Environment and Electrical Engineering (EEEIC), Rome, Italy, 10–13 June 2015; pp. 1035–1040. [Google Scholar]
- Shaw, G. Intelligent Lighting in a Data Hall—Efficiency Meets Sustainability. 2020. Available online: https://www.datacenterdynamics.com/en/opinions/intelligent-lighting-in-a-data-hall-efficiency-meets-sustainability/ (accessed on 1 January 2021).
- Jin, C.; Bai, X.; Yang, C.; Mao, W.; Xu, X. A review of power consumption models of servers in data centers. Appl. Energy 2020, 265, 114806. [Google Scholar] [CrossRef]
- Meisner, D.; Wenisch, T.F. Does low-power design imply energy efficiency for data centers? In Proceedings of the IEEE/ACM International Symposium on Low Power Electronics and Design, Fukuoka, Japan, 1–3 August 2011; pp. 109–114. [Google Scholar]
- Halsted, C.W.; Manjrekar, M.D. A Critique of Little Box Challenge Inverter Designs: Breaking from Traditional Design Tradeoffs. IEEEPower Electron. Mag. 2018, 5, 52–60. [Google Scholar] [CrossRef]
- Tweed, K. Winning Google’s Little Box Challenge Will Take a ‘Holistic Approach’—IEEE Spectrum. IEEE Access 2021. [Google Scholar]
- Stockton, N. What It Will Take to Win Google’s Million-Dollar Electric Power Prize. 2014. Available online: https://www.wired.com/2014/08/google-power-inverter-challenge/ (accessed on 1 January 2021).
- Little Box Challenge. Detailed Inverter Specifications, Testing Procedure, and Technical Approach and Testing Application Requirements for the Little Box Challenge. 2014. Available online: https://web.archive.org/web/20160310120416/https://www.littleboxchallenge.com/pdf/LBC-InverterRequirements.pdf (accessed on 1 January 2021).
- Neumayr, D.; Bortis, D.; Kolar, J.W. The essence of the little box challenge-part A: Key design challenges & solutions. Cpss Trans. Power Electron. Appl. 2020, 5, 158–179. [Google Scholar]
- Kim, K.A.; Liu, Y.; Chen, M.; Chiu, H. Opening the box: Survey of high power density inverter techniques from the little box challenge. Cpss Trans. Power Electron. Appl. 2017, 2, 131–139. [Google Scholar] [CrossRef]
- Bomboir, O. Red Electrical Devils by CE+T Team: Technical Approach; CE+ T Power Co.: Liege, Belgium, 2015. [Google Scholar]
- Wong, C.C.; Liu, C.C.; Hou, K.C. DC power supply system for intelligent server. In Proceedings of the Processing and Communications Systems, Tamsui, Taiwan, 4–7 November 2012; pp. 245–249. [Google Scholar]
- Pueschel, T. DC-Powered Office Buildings and Data Centres: The First 380 VDC Micro Grid in a Commercial Building in Germany. In Proceedings of the 2018 International Power Electronics Conference (IPEC-Niigata 2018 -ECCE Asia), Niigata, Japan, 20–24 May 2018; pp. 190–195. [Google Scholar]
- Editorial Staff. SiC Semiconductor for Data Center. 2020. Available online: https://www.powerelectronicsnews.com/sic-semiconductor-for-data-center/ (accessed on 1 January 2021).
- Kleyman, B. The Role of Robotics in Data Center Automation. 2013. Available online: https://www.datacenterknowledge.com/archives/2013/12/18/role-robotics-data-center-automation (accessed on 1 January 2021).
- Miller, R. AOL Launches New ‘Lights Out’ Data Center. 2011. Available online: https://www.datacenterknowledge.com/archives/2011/10/11/aol-launches-new-lights-out-data-center/ (accessed on 1 January 2021).
- Mansley, C.; Connell, J.; Isci, C.; Lenchner, J.; Kephart, J.O.; McIntosh, S.; Schappert, M. Robotic mapping and monitoring of data centers. In Proceedings of the IEEE International Conference on Robotics and Automation, Shanghai, China, 9–13 May 2011; pp. 5905–5910. [Google Scholar]
- Lenchner, J.; Isci, C.; Kephart, J.O.; Mansley, C.; Connell, J.; McIntosh, S. Towards data center self-diagnosis using a mobile robot. In Proceedings of the 8th ACM International Conference on Autonomic Computing, Karlsruhe, Germany, 14–18 June 2011; Association for Computing Machinery: New York, NY, USA, 2011; pp. 81–90. [Google Scholar]
- Chan, H.; Connell, J.; Isci, C.; Kephart, J.O.; Lenchner, J.; Mansley, C.; McIntosh, S. A robot as mobile sensor and agent in data center energy management. In Proceedings of the 8th ACM International Conference on Autonomic Computing, New York, NY, USA, 14–18 June 2011; pp. 165–166. [Google Scholar]
- Levy, M.; Subburaj, A. Emerging Trends in Data Center Management Automation. In Proceedings of the 2021 IEEE 11th Annual Computing and Communication Workshop and Conference (CCWC), Las Vegas, NV, USA, 27–30 January 2021; pp. 480–485. [Google Scholar]
- Levy, M.; Raviv, D. A Novel Framework for Data Center Metrics using a Multidimensional Approach. In Proceedings of the 15th LACCEI International Multiconference for Engineering, Education, and Technology, Boca Raton, FL, USA, 19–21 July 2017. [Google Scholar]
- Sisó, L.; Salom, J.; Jarus, M.; Oleksiak, A.; Zilio, T. Energy and Heat-Aware Metrics for Data Centers: Metrics Analysis in the Framework of CoolEmAll Project. In Proceedings of the 2013 International Conference on Cloud and Green Computing, Karlsruhe, Germany, 30 September–2 October 2013; pp. 428–434. [Google Scholar]
- Kushwaha, M.; Singh, A.; Raina, B.L. Categorization of Metrics for Improving Efficiency of Green Data Centers. In Proceedings of the 2019 International Conference on Computational Intelligence and Knowledge Economy (ICCIKE), Dubai, UAE, 11–12 December 2019; p. 56. [Google Scholar]
- Ferreira, J.; Callou, G.; Josua, A.; Maciel, P. Estimating the Environmental Impact of Data Centers. In Proceedings of the 2018 IEEE 17th International Symposium on Network Computing and Applications (NCA), Cambridge, MA, USA, 1–3 November 2018; pp. 1–4. [Google Scholar]
- Moud, H.I.; Hariharan, J.; Hakim, H.; Kibert, C. Sustainability Assessment of Data Centers Beyond LEED. In Proceedings of the 2020 IEEE Green Technologies Conference (GreenTech), Oklahoma City, OK, USA, 1–3 April 2020; pp. 62–64. [Google Scholar]
- Ramli, S.; Jambari, D.I.; Mokhtar, U.A. A framework design for sustainability of green data center. In Proceedings of the 2017 6th International Conference on Electrical Engineering and Informatics (ICEEI), Langkawi, Malaysia, 25–27 November 2017; pp. 1–6. [Google Scholar]
- Van de Voort, T.; Zavrel, V.; Galdiz, J.T.; Hensen, J.L.M. Analysis of performance metrics for data center efficiency—should the Power Utilization Effectiveness PUE still be used as the main indicator? (Part 1). Rehva J. 2017, 2017, 37–43. [Google Scholar]
- Sharma, M.; Arunachalam, K.; Sharma, D. Analyzing the Data Center Efficiency by Using PUE to Make Data Centers More Energy Efficient by Reducing the Electrical Consumption and Exploring New Strategies. Procedia Comput. Sci. 2015, 48, 142–148. [Google Scholar] [CrossRef]
- Tan, B.; Pan, S.L.; Zuo, M. Harnessing collective IT resources for sustainability: Insights from the green leadership strategy of China mobile. J. Assoc. Inf. Sci. Technol. 2014, 66, 818–838. [Google Scholar] [CrossRef]
- Harmon, R.; Demirkan, H.; Auseklis, N.; Reinoso, M. From Green Computing to Sustainable IT: Developing a Sustainable Service Orientation. In Proceedings of the 2010 43rd Hawaii International Conference on System Sciences, Honolulu, HI, USA, 5–8 January 2010; pp. 1–10. [Google Scholar]
- Dayarathna, M.; Wen, Y.; Fan, R. Data Center Energy Consumption Modeling: A Survey. IEEE Commun. Surv. Tutor. 2015, 18, 732–794. [Google Scholar] [CrossRef]
- Lykou, G.; Mentzelioti, D.; Gritzalis, D. A new methodology toward effectively assessing data center sustainability. Comput. Secur. 2017, 76, 327–340. [Google Scholar] [CrossRef]
- Reddy, V.D.; Setz, B.; Rao, G.S.V.; Gangadharan, G.R.; Aiello, M. Metrics for Sustainable Data Centers. IEEE Trans. Sustain. Comput. 2017, 2, 290–303. [Google Scholar] [CrossRef]
- Uptime Institute. Global Data Center Survey; Uptime Institute: New York, NY, USA, 2019. [Google Scholar]
- Bradford, C. Top 5 Data Center Environmental Standards and Concerns. 2021. Available online: https://blog.storagecraft.com/top-5-data-center-environmental-standards-and-concerns/ (accessed on 1 January 2021).
- ASHRAE. TC 9.9. Thermal Guidelines for Data Processing Environments–Expanded Data Center Classes and Usage Guidance; ASHRAE: Peachtree Corners, GA, USA, 2011. [Google Scholar]
- U.S. Green Building Council. LEED Rating System. 2021. Available online: https://www.usgbc.org/leed (accessed on 1 January 2021).
- ENERGY STAR. 2021. Available online: https://www.energystar.gov/?s=mega (accessed on 1 January 2021).
- LifelineDataCtr. What is LEED Certification for Data Centers? 2021. Available online: https://lifelinedatacenters.com/colocation/leed-certification-data-centers/ (accessed on 1 January 2021).
- The Green Grid. 2021. Available online: https://www.thegreengrid.org/ (accessed on 1 January 2021).
- Meuer, H.; Strohmaier, E.; Dongarra, J.; Simon, H.; Meuer, M. TOP500. 2021. Available online: https://www.top500.org/ (accessed on 1 January 2021).
- Shrestha, N.L. RenewIT—Deliverable D4.5—Catalogue of Advanced Technical Conceptsfor Net Zero Energy Data Centres. 2015. Available online: http://www.renewit-project.eu/d4-3-catalogue-advanced-technical-concepts-net-zero-energy-data-centres-draft-version/ (accessed on 1 March 2021).


Publisher’s Note: MDPI stays neutral with regard to jurisdictional claims in published maps and institutional affiliations. |
© 2021 by the authors. Licensee MDPI, Basel, Switzerland. This article is an open access article distributed under the terms and conditions of the Creative Commons Attribution (CC BY) license (https://creativecommons.org/licenses/by/4.0/).