
Analysis of Nutritional Quality Attributes and Their Inter-Relationship in Maize Inbred Lines for Sustainable Livelihood


 ,
,  ,
,  and
and
Abstract
:1. Introduction
2. Materials and Methods
2.1. Plant Materials
2.2. Preliminary Analysis
2.3. Estimation of Protein, Moisture, Sugar, Starch, 100-Kernel Weight (100-Kernel wt.), Specific Gravity, and Fat Concentration
2.4. Statistical Analysis
2.4.1. Analysis of Variance (ANOVA)
2.4.2. Univariate and Multivariate Statistics
3. Results
3.1. Variability Analysis and Factor Analysis
3.2. Correlation Analysis
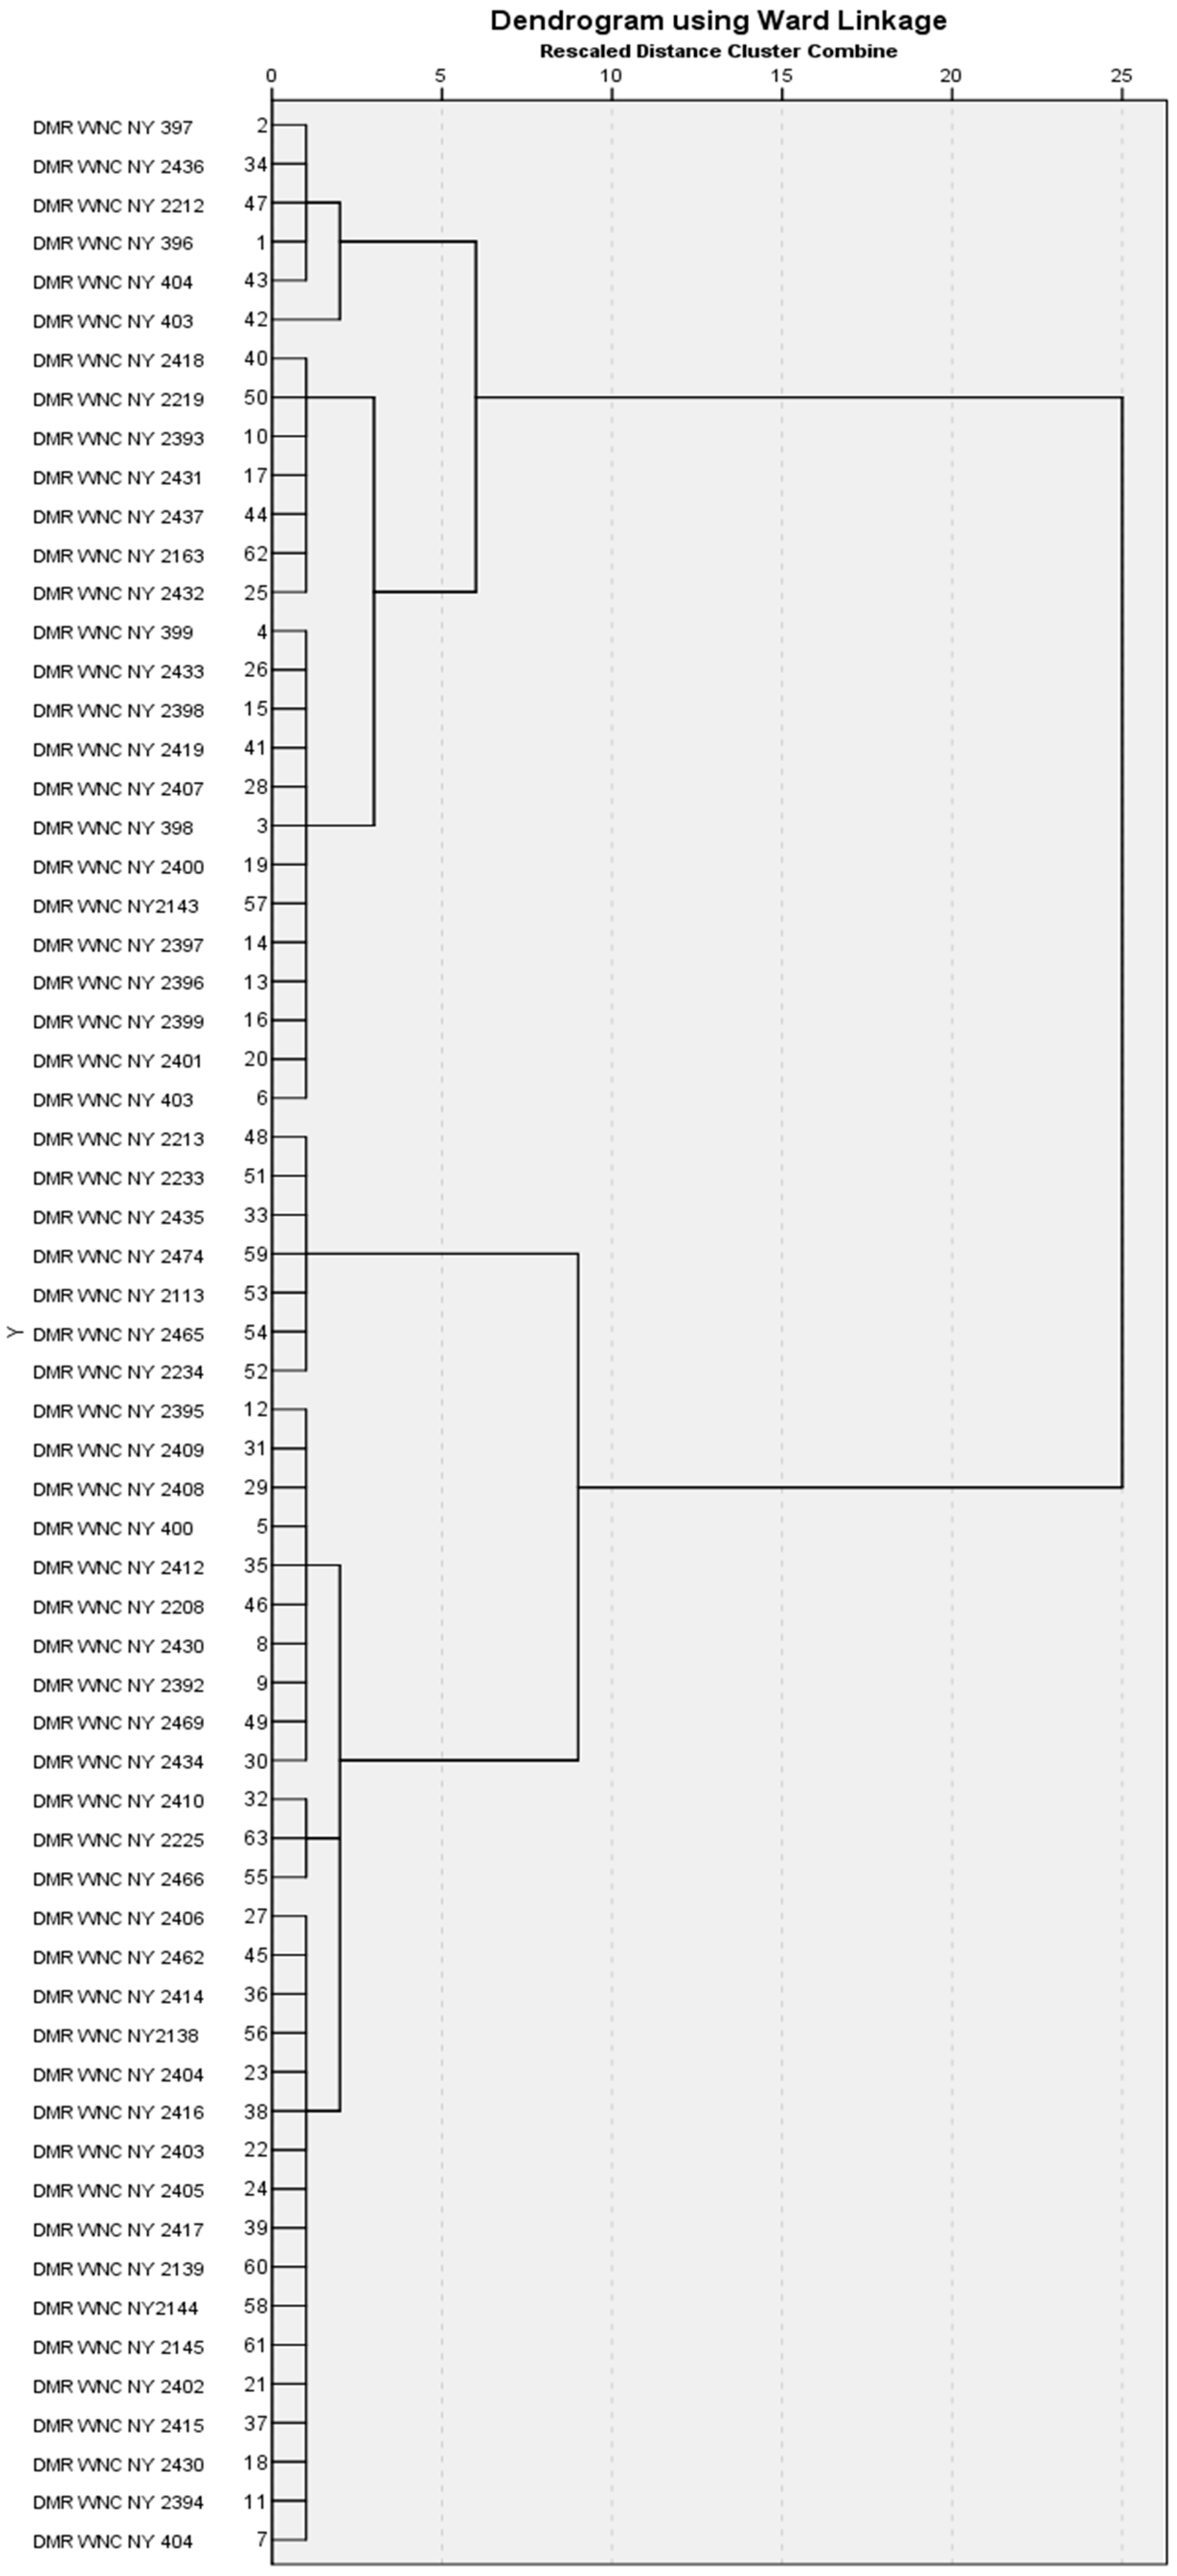
3.3. Genetic Distance Measurement and Hierarchical Cluster Analysis
4. Discussion
5. Conclusions
Author Contributions
Funding
Institutional Review Board Statement
Informed Consent Statement
Data Availability Statement
Conflicts of Interest
References
- Glenn, K.C. Nutritional and safety assessments of foods and feeds nutritionally improved through biotechnology: Lysine maize as a case study. J. AOAC Int. 2007, 90, 1470–1479. [Google Scholar] [CrossRef] [Green Version]
- Food and Agricultural Organization of the United Nations. The State of Food Insecurity in the World 2008: High Food Prices and Food Security-Threats and Opportunities. Available online: http://www.fao.org/docrep/011/i0291e/i0291e00.htm (accessed on 20 January 2021).
- Nuss, E.T.; Tanumihardjo, S.T. Maize: A Paramount Staple Crop in the Context of Global Nutrition. Compr. Rev. Food Sci. Food Saf. 2010, 9, 4. [Google Scholar] [CrossRef] [PubMed]
- United States Department of Agriculture and Foreign Agricultural Service. Corn 2008: Production, Supply, Demand Database. 2008. Available online: http://www.pecad.fas.usda.gov/cropexplorer/ (accessed on 20 January 2021).
- Brown, W.L.; Bressani, R.; Glover, D.V.; Hallauer, A.R.; Johnson, V.A.; Qualset, C.O. Quality-Protein Maize: Report of an Ad Hoc Panel of the Advisory Committee on Technology Innovation, Board on Science and Technology for International Development, National Research Council, in Cooperation with the Board on Agriculture, National Research Council; National Academy Press: Washington, DC, USA, 2008. [Google Scholar]
- Lutz, W.; Sanderson, W.; Scherbov, S. The end of world population growth. Nature 2001, 412, 543–545. [Google Scholar] [CrossRef] [PubMed] [Green Version]
- United States Department of Agriculture. National Nutrient Database for Standard Reference. 2009. Available online: http://www.nal.usda.gov/fnic/foodcomp/search/ (accessed on 21 December 2020).
- NFHS (2018-19). Available online: http://www.nfhsindia.org/nfhs3.shtml (accessed on 21 December 2020).
- World Health Organization. Malnutrition. 2017. Available online: www.who.int/mediacentre/factsheets/malnutrition/en/ (accessed on 30 November 2020).
- Gupta, H.S.; Hossain, F.; Muthusamy, V. Biofortification of maize: An Indian perspective. Indian J. Genet. Plant. Breed. 2015, 75, 1–22. [Google Scholar] [CrossRef]
- Bouis, H.E.; Saltzman, A. Improving nutrition through biofortification: A review of evidence from HarvestPlus, 2003 through 2016. Glob. Food Sec. 2017, 12, 49–58. [Google Scholar] [CrossRef] [PubMed]
- Hossain, F.; Sarika, K.; Muthusamy, V.; Zunjare, R.U.; Gupta, H.S. Quality Protein Maize for Nutritional Security. In Quality Breeding in Field Crops; Qureshi, A., Dar, Z., Wani, S., Eds.; Springer: Cham, Switzerland, 2019; pp. 13–25. [Google Scholar]
- Kumar, P.; Chaudhary, M.; Hossain, F.; Singh, N.K.; Choudhary, P.; Gupta, M.; Singh, V.; Chikappa, G.K.; Kumar, R.; Kumar, B.; et al. Nutritional quality improvement in maize (Zea mays): Progress and challenges. Indian J. Agric. Sci. 2019, 89, 895–911. [Google Scholar]
- Singh, I.; Langyan, S.; Yadava, P. Sweet Corn and Corn-Based Sweeteners. Sugar Tech 2014, 16, 144–149. [Google Scholar] [CrossRef]
- Changan, S.; Chaudhary, D.P.; Kumar, S.; Kumar, B.; Kaul, J.; Guleria, S.; Jat, S.L.; Singode, A.; Turchi, M.; Langyan, S.; et al. Biochemical characterization of elite maize (Zea mays) germplasm for carotenoids composition. Indian J. Agric. Sci. 2017, 87, 46–50. [Google Scholar]
- Rakshit, S.; Chikkappa, K.G.; Jat, S.L.; Dhillon, B.S.; Singh, N.N. Scaling-up of proven technology for maize improvement through participatory approach in India. In Best Practices of Maize Production Technology in South Asia; Pandey, P.R., Koirala, K.B., Eds.; SAARC Agriculture Centre: Dhaka, Bangladesh, 2017; p. 144. [Google Scholar]
- Maize Production Technologies in India. Available online: https://farmer.gov.in/imagedefault/pestanddiseasescrops/normalmaizeproductiontechnologies.pdf (accessed on 30 January 2021).
- Lodha, M.L.; Srivastava, K.N.; Gupta, H.O.; Eggum, B.O.; Mehta, S.L.; Singh, J. Nutritive value of normal and opaque-2 maize. Curr. Sci. 1976, 45, 287–289. [Google Scholar]
- Gupta, H.O.; Lodha, M.L.; Singh, J.; Mehta, S.L. Protein quality of normal and opaque maize at different stages of ripening. J. Food Sci. Technol. 1978, 15, 148–149. [Google Scholar]
- Li, Y.; Wang, Y.; Wei, M.; Li, X.; Fu, J. QTL identification of grain protein concentration and its genetic correlation with starch concentration and grain weight using two populations in maize (Zea mays L). J. Genet. 2009, 88, 61–67. [Google Scholar] [CrossRef] [PubMed]
- Chaudhary, D.P.; Sapna, M.S.; Kumar, R. Interrelationship among nutritional quality parameters of maize (Zea mays) genotypes. Indian J. Agric. Sci. 2012, 82, 681–686. [Google Scholar]
- AOAC. Official Methods of Analysis of the Association of Official Agricultural Chemicals, 10th ed.; AOAC: Rockville, MD, USA, 1970; pp. 744–745. [Google Scholar]
- Nelson, N. A photometric adoption of the somogyi’s method for determination of glucose. J. Biol. Chem. 1944, 153, 375–378. [Google Scholar] [CrossRef]
- Clegg, K.M. The application of anthrone reagent to the estimation of starch in cereals. J. Sci. Food Agric. 1956, 7, 40–44. [Google Scholar] [CrossRef]
- Sangamithra, A.; Gabriela, J.S.; Prema, R.S.; Nandini, K.; Kannan, K.; Sasikala, S.; Suganya, P. Moisture-dependent physical properties of maize kernels. Int. Food Res. J. 2016, 23, 109. [Google Scholar]
- United States Department of Agriculture. World Agricultural Production: World Wheat Area Down, Corn Steady, Soy Up; Foreign Agricultural Service/USDA Office of Global Analysis. Available online: http://www.fas.usda.gov/wap/circular/2009/09-05/productionfull05-09.pdf (accessed on 20 January 2021).
- Ray, D.K.; Mueller, N.D.; West, P.C.; Foley, J.A. Yield trends are insufficient to double global crop production by 2050. PLoS ONE 2013, 8, e66428. [Google Scholar] [CrossRef] [Green Version]
- Boyer, C.D.; Shannon, J.C. Carbohydrates of the kernel. In Corn: Chemistry and Technology; Watson, S.A., Ramstad, P.E., Eds.; Am. Assoc. Cereal Chem: Saint Paul, MN, USA, 1987; pp. 253–272. [Google Scholar]
- Assman, E. Seed Density and Quality Relationships in Gravity Graded Soybean [Glycine max (L.) Merrill] Seed. Ph.D. Thesis, Mississipi State University: Starkville, MS, USA.
- Seidemann, J.; Inglett, G.E. Corn: Culture, Processing, Products. Major Feed and Food Crops in Agriculture and (Food Series. 369 Seiten, 73 Abb., 65 Tab; The AVI Publishing Company: Westport, CT, USA, 1970. [Google Scholar]
- Saleem, M.; Ahsan, M.; Aslam, M.; Majeed, A. Comparative evaluation and correlation estimates for grain yield and quality attributes in maize. Pak. J. Bot. 2008, 6, 40–47. [Google Scholar]
- Willmot, D.B.; Dudley, J.W.; Rocheford, T.R.; Bari, A. Effect of random mating on marker-QTL associations for grain quality traits in the cross of Illinois High Oil × Illinois Low Oil. Maydica 2006, 51, 187–199. [Google Scholar]
- Clark, D.; Dudley, J.W.; Rocheford, T.R.; LeDeaux, J.R. Genetic analysis of corn grain chemical composition in the random mated 10 generations of the cross of generations 70 of IHO X ILO. Crop. Sci. 2006, 46, 807–819. [Google Scholar] [CrossRef]
- Dudley, J.W.; Clark, D.; Rocheford, T.R.; LeDeaux, J.R. Genetic analysis of corn grain chemical composition in the random mated 7 generations of the cross of generations 70 of IHP × ILP. Crop. Sci. 2007, 47, 45–57. [Google Scholar] [CrossRef]
- Liu, Y.Y.; Dong, Y.B.; Niu, S.Z.; Cui, D.Q.; Wang, Y.Z.; Wei, M.G. QTL identification of kernel composition traits with popcorn using both F2:3 and BC2F2 populations developed from the same cross. J. Cereal Sci. 2008, 48, 625–631. [Google Scholar]
- Zhang, J.; Lu, X.Q.; Song, X.F.; Yan, J.B.; Song, T.M.; Dai, J.R. Mapping quantitative trait loci for oil, starch, and protein contents in grain with high-oil maize by SSR markers. Euphytica. 2008, 162, 335–344. [Google Scholar] [CrossRef]
- Panthee, D.R.; Pantalone, V.R.; West, D.R.; Saxton, A.M.; Sams, C.E. Quantitative traits loci for seed protein and oil counteraction and seed size in soybean. Curr. Sci. 2005, 45, 2015–2022. [Google Scholar]
- Boyer, C.D.; Hannah, L.C. Kernel mutants of corn. In Specialty Corn; Hallauer, A.R., Ed.; CRC Press: Boca Raton, FL, USA, 2001; pp. 1–31. [Google Scholar]
- Okporie, E.O.; Obi, I.U. Estimation of genetic gains in protein and oil of eight populations of maize (Zea Mays L.) after three cycles of reciprocal recurrent selection. J. Sci Agric. Food Tech. Environ. 2002, 2, 40–45. [Google Scholar]
- Okporie, E.O.; Oselebe, I.U. Correlation of protein and oil content with five agronomic characters of maize (Zea mays L.) after three cycles of reciprocal recurrent selection. World J. Agric. Sci. 2007, 3, 639–641. [Google Scholar]


| PEDIGREE | Protein (%) | Fat (%) | Sugar (%) | Starch (%) | 100-K wt. (g) | Specific Gravity (g/cm3) |
|---|---|---|---|---|---|---|
| DMR WNC NY 396 | 12.39 | 3.08 | 3.58 | 68.46 | 14.3 | 1.19 |
| DMR WNC NY 397 | 11.56 | 3.19 | 3.24 | 70.60 | 17.00 | 1.42 |
| DMR WNC NY 398 | 12.38 | 3.05 | 3.82 | 68.05 | 24.50 | 1.23 |
| DMR WNC NY 399 | 10.31 | 3.23 | 3.71 | 68.44 | 19.90 | 1.67 |
| DMR WNC NY 400 | 9.86 | 4.47 | 3.24 | 73.39 | 27.90 | 1.27 |
| DMR WNC NY 403 | 15.54 | 2.41 | 3.42 | 67.43 | 24.40 | 1.35 |
| DMR WNC NY 404 | 13.52 | 2.48 | 3.55 | 70.22 | 26.70 | 1.34 |
| DMR WNC NY 2430 | 12.20 | 3.56 | 3.08 | 70.29 | 25.00 | 1.39 |
| DMR WNC NY 2392 | 9.83 | 3.15 | 3.44 | 71.33 | 23.54 | 1.47 |
| DMR WNC NY 2393 | 10.45 | 3.28 | 3.14 | 71.93 | 20.70 | 1.15 |
| DMR WNC NY 2394 | 12.07 | 2.57 | 3.56 | 68.80 | 26.30 | 1.10 |
| DMR WNC NY 2395 | 10.61 | 2.21 | 3.47 | 72.90 | 26.80 | 1.41 |
| DMR WNC NY 2396 | 11.24 | 2.26 | 3.38 | 68.33 | 23.50 | 1.10 |
| DMR WNC NY 2397 | 10.72 | 2.36 | 3.90 | 67.93 | 24.65 | 1.17 |
| DMR WNC NY 2398 | 11.00 | 2.92 | 4.27 | 70.55 | 21.37 | 1.19 |
| DMR WNC NY 2399 | 11.50 | 2.87 | 4.04 | 68.22 | 22.60 | 1.26 |
| DMR WNC NY 2431 | 11.19 | 2.64 | 3.23 | 73.07 | 20.66 | 1.15 |
| DMR WNC NY 2430 | 12.51 | 2.89 | 3.08 | 68.85 | 27.90 | 1.27 |
| DMR WNC NY 2400 | 11.86 | 3.36 | 3.65 | 68.91 | 24.00 | 1.26 |
| DMR WNC NY 2401 | 12.61 | 2.50 | 3.51 | 68.42 | 21.76 | 1.21 |
| DMR WNC NY 2402 | 12.06 | 3.22 | 3.06 | 69.04 | 27.10 | 1.13 |
| DMR WNC NY 2403 | 8.83 | 2.43 | 3.74 | 70.79 | 28.30 | 1.18 |
| DMR WNC NY 2404 | 9.79 | 2.32 | 3.86 | 70.47 | 26.70 | 1.21 |
| DMR WNC NY 2405 | 9.75 | 2.58 | 3.28 | 68.96 | 26.30 | 1.20 |
| DMR WNC NY 2432 | 11.83 | 3.30 | 3.33 | 72.64 | 22.30 | 1.17 |
| DMR WNC NY 2433 | 10.42 | 2.29 | 3.13 | 68.22 | 21.20 | 1.12 |
| DMR WNC NY 2406 | 11.91 | 2.56 | 3.01 | 70.42 | 29.30 | 1.13 |
| DMR WNC NY 2407 | 11.79 | 2.28 | 3.64 | 70.63 | 20.05 | 1.22 |
| DMR WNC NY 2408 | 11.12 | 2.69 | 3.28 | 74.92 | 25.80 | 1.17 |
| DMR WNC NY 2434 | 9.55 | 3.05 | 3.65 | 73.35 | 23.70 | 1.25 |
| DMR WNC NY 2409 | 9.76 | 2.28 | 4.34 | 72.66 | 25.8 | 1.17 |
| DMR WNC NY 2410 | 12.03 | 2.23 | 3.71 | 73.18 | 29.90 | 1.15 |
| DMR WNC NY 2435 | 12.50 | 2.73 | 3.68 | 69.78 | 35.60 | 1.19 |
| DMR WNC NY 2436 | 11.31 | 3.23 | 3.75 | 70.73 | 17.40 | 1.16 |
| DMR WNC NY 2412 | 11.65 | 2.61 | 3.10 | 72.51 | 24.40 | 1.22 |
| DMR WNC NY 2414 | 11.21 | 2.04 | 3.01 | 68.92 | 30.90 | 1.14 |
| DMR WNC NY 2415 | 11.24 | 3.22 | 3.45 | 69.25 | 27.30 | 1.14 |
| DMR WNC NY 2416 | 9.64 | 2.72 | 3.56 | 71.35 | 27.00 | 1.17 |
| DMR WNC NY 2417 | 11.35 | 2.84 | 5.37 | 71.91 | 26.40 | 1.20 |
| DMR WNC NY 2418 | 12.67 | 3.50 | 3.68 | 72.75 | 19.05 | 1.90 |
| DMR WNC NY 2419 | 11.56 | 2.35 | 3.17 | 70.30 | 21.79 | 1.21 |
| DMR WNC NY 403 | 15.54 | 2.41 | 3.42 | 67.43 | 9.14 | 0.96 |
| DMR WNC NY 404 | 13.52 | 2.48 | 3.55 | 70.22 | 13.63 | 1.24 |
| DMR WNC NY 2437 | 11.31 | 3.18 | 3.75 | 74.26 | 21.94 | 1.22 |
| DMR WNC NY 2462 | 12.29 | 2.23 | 3.52 | 70.15 | 29.98 | 1.36 |
| DMR WNC NY 2208 | 12.19 | 3.01 | 3.34 | 71.48 | 24.33 | 1.28 |
| DMR WNC NY 2212 | 12.65 | 3.21 | 3.91 | 68.47 | 17.26 | 1.57 |
| DMR WNC NY 2213 | 10.66 | 2.45 | 4.86 | 71.35 | 33.30 | 1.15 |
| DMR WNC NY 2469 | 10.52 | 2.47 | 3.15 | 70.89 | 24.74 | 1.24 |
| DMR WNC NY 2219 | 11.82 | 2.82 | 4.28 | 74.66 | 19.61 | 1.63 |
| DMR WNC NY 2233 | 12.22 | 2.50 | 4.87 | 71.36 | 33.83 | 1.41 |
| DMR WNC NY 2234 | 10.12 | 2.59 | 4.74 | 75.31 | 36.11 | 1.20 |
| DMR WNC NY 2113 | 11.08 | 3.05 | 4.40 | 71.72 | 35.43 | 1.27 |
| DMR WNC NY 2465 | 9.93 | 2.48 | 3.65 | 72.53 | 35.94 | 1.28 |
| DMR WNC NY 2466 | 10.00 | 2.68 | 3.38 | 74.76 | 31.63 | 1.44 |
| DMR WNC NY2138 | 11.21 | 3.41 | 4.67 | 68.07 | 29.23 | 1.33 |
| DMR WNC NY2143 | 12.07 | 2.33 | 4.61 | 68.41 | 24.00 | 1.20 |
| DMR WNC NY2144 | 11.66 | 3.18 | 4.25 | 70.87 | 27.91 | 1.21 |
| DMR WNC NY 2474 | 11.54 | 2.90 | 4.36 | 68.88 | 33.37 | 1.19 |
| DMR WNC NY 2139 | 11.59 | 3.11 | 4.56 | 71.25 | 26.26 | 1.19 |
| DMR WNC NY 2145 | 11.93 | 3.32 | 5.77 | 69.82 | 26.31 | 1.19 |
| DMR WNC NY 2163 | 11.66 | 3.21 | 4.69 | 74.09 | 22.18 | 1.11 |
| DMR WNC NY 2225 | 11.52 | 2.88 | 3.76 | 73.38 | 29.19 | 1.22 |
| Variables | N | Mean | F-Ratio | Minimum | Maximum |
|---|---|---|---|---|---|
| Protein | 63 | 11.34 ± 0.15 * | 13.61 | 8.83 | 15.54 |
| Sugar | 63 | 3.54 ± 0.08 * | 22.07 | 3.01 | 5.37 |
| Starch | 63 | 70.46 ± 0.04 ** | 21.37 | 67.43 | 75.31 |
| Fat | 63 | 2.81 ± 0.25 * | 4.11 | 2.04 | 4.47 |
| Moisture | 63 | 9.11 ± 2.0 * | 2.80 | 9.16 | 10.49 |
| Specific gravity | 63 | 1.25 ± 0.11 | 12.89 | 0.96 | 1.90 |
| 100-K wt. | 63 | 25.08 ± 0.23 | 206.72 | 9.14 | 36.11 |
| Component | ||||||
|---|---|---|---|---|---|---|
| 1 | 2 | 3 | ||||
| Protein | −0.750 | 0.073 | 0.376 | |||
| Starch | 0.714 | 0.243 | −0.272 | |||
| 100-Kernel wt. | 0.688 | −0.391 | 0.168 | |||
| Fat | 0.118 | 0.770 | 0.107 | |||
| Specific Gravity | 0.083 | 0.758 | 0.042 | |||
| Sugar | 0.398 | −0.012 | 0.865 | |||
| Initial | Extraction | |||||
| Protein | 1.000 | 0.709 | ||||
| Oil | 1.000 | 0.618 | ||||
| Sugar | 1.000 | 0.907 | ||||
| Starch | 1.000 | 0.643 | ||||
| 100-Kernel wt. | 1.000 | 0.655 | ||||
| Specific Gravity | 1.000 | 0.583 | ||||
| Component | Initial Eigenvalues | Extraction Sums of Squared Loadings | ||||
| Total | Variance (%) | Cumulative (%) | Total | Variance (%) | Cumulative (%) | |
| 1 | 1.725 | 28.750 | 28.750 | 1.725 | 28.750 | 28.750 |
| 2 | 1.384 | 23.074 | 51.824 | 1.384 | 23.074 | 51.824 |
| 3 | 1.006 | 16.762 | 68.586 | 1.006 | 16.762 | 68.586 |
| 4 | 0.745 | 12.420 | 81.006 | |||
| 5 | 0.627 | 10.452 | 91.458 | |||
| 6 | 0.513 | 8.542 | 100.000 | |||
| Parameters | Sugar | Starch | 100-K wt. | Specific Gravity | |
|---|---|---|---|---|---|
| Protein | −0.049 | −0.048 | −0.392 ** | −0.351 ** | 0.031 |
| P = 0.702 | P = 0.711 | P = 0.001 | P = 0.005 | P = 0.811 | |
| Fat | 0.076 | 0.129 | −0.140 | 0.283 * | |
| P = 0.553 | P = 0.315 | P = 0.272 | P = 0.025 | ||
| Sugar | 0.101 | 0.247 | 0.016 | ||
| P = 0.429 | P = 0.051 | P = 0.900 | |||
| Starch | 0.227 | 0.149 | |||
| P = 0.074 | P = 0.245 | ||||
| 100-K wt. | −0.091 | ||||
| P = 0.479 | |||||
Publisher’s Note: MDPI stays neutral with regard to jurisdictional claims in published maps and institutional affiliations. |
© 2021 by the authors. Licensee MDPI, Basel, Switzerland. This article is an open access article distributed under the terms and conditions of the Creative Commons Attribution (CC BY) license (https://creativecommons.org/licenses/by/4.0/).
Share and Cite
Langyan, S.; Dar, Z.A.; Chaudhary, D.P.; Shekhar, J.C.; Herlambang, S.; El Enshasy, H.; Sayyed, R.Z.; Rakshit, S. Analysis of Nutritional Quality Attributes and Their Inter-Relationship in Maize Inbred Lines for Sustainable Livelihood. Sustainability 2021, 13, 6137. https://doi.org/10.3390/su13116137
Langyan S, Dar ZA, Chaudhary DP, Shekhar JC, Herlambang S, El Enshasy H, Sayyed RZ, Rakshit S. Analysis of Nutritional Quality Attributes and Their Inter-Relationship in Maize Inbred Lines for Sustainable Livelihood. Sustainability. 2021; 13(11):6137. https://doi.org/10.3390/su13116137
Chicago/Turabian StyleLangyan, Sapna, Zahoor A. Dar, D. P. Chaudhary, J. C. Shekhar, Susila Herlambang, Hesham El Enshasy, R. Z. Sayyed, and S. Rakshit. 2021. "Analysis of Nutritional Quality Attributes and Their Inter-Relationship in Maize Inbred Lines for Sustainable Livelihood" Sustainability 13, no. 11: 6137. https://doi.org/10.3390/su13116137