Article

Customer Satisfaction of Recommender System: Examining Accuracy and Diversity in Several Types of Recommendation Approaches

1
School of Management, KyungHee University, 26, Kyungheedae-ro, Dongdaemun-gu, Seoul 02447, Korea
2
Department of Big Data Analytics, KyungHee University, 26, Kyungheedae-ro, Dongdaemun-gu, Seoul 02447, Korea
3
Graduate School of Business Administration, KyungHee University, 26, Kyungheedae-ro, Dongdaemun-gu, Seoul 02447, Korea
*
Author to whom correspondence should be addressed.
Sustainability 2021, 13(11), 6165; https://doi.org/10.3390/su13116165
Submission received: 30 April 2021 / Revised: 26 May 2021 / Accepted: 28 May 2021 / Published: 30 May 2021
(This article belongs to the Special Issue Applications of Big Data Analysis for Sustainable Growth of Firms)

Abstract

:
Information technology and the popularity of mobile devices allow for various types of customer data, such as purchase history and behavior patterns, to be collected. As customer data accumulate, the demand for recommender systems that provide customized services to customers is growing. Global e-commerce companies offer recommender systems to gain a sustainable competitive advantage. Research on recommender systems has consistently suggested that customer satisfaction will be highest when the recommendation algorithm is accurate and recommends a diversity of items. However, few studies have investigated the impact of accuracy and diversity on customer satisfaction. In this research, we seek to identify the factors determining customer satisfaction when using the recommender system. To this end, we develop several recommender systems and measure their ability to deliver accurate and diverse recommendations and their ability to generate customer satisfaction with diverse data sets. The results show that accuracy and diversity positively affect customer satisfaction when applying a deep learning-based recommender system. By contrast, only accuracy positively affects customer satisfaction when applying traditional recommender systems. These results imply that developers or managers of recommender systems need to identify factors that further improve customer satisfaction with the recommender system and promote the sustainable development of e-commerce.

1. Introduction

The e-commerce market continues to grow with the development of information technology and the popularization of mobile devices. However, with new items being released regularly, customers are increasingly spending a significant amount of time and effort selecting items that they want [1]. Therefore, personalized recommender systems are rapidly becoming important, and global companies such as Amazon [2], Netflix [3], and Google [4] are offering various services using recommender systems to maintain a sustainable competitive advantage in e-commerce. Providing products or services that suit customer interests can help reduce customers’ efforts to explore offerings and increase customer satisfaction as well as item sales [5]. In particular, a recommender system that provides recommendations using customer purchase history data can help customers choose among various available alternatives [6]. However, personalized recommender systems that do not meet customer expectations may reject recommendations and even show for contempt for personalized services.
Previous studies have focused primarily on enhancing recommender algorithm performance using customer purchasing history or preferences [5,6,7]. The performance of the recommender algorithm was primarily measured using accuracy and diversity metrics [8,9,10,11]. Accuracy shows how well the customer’s actual and predicted preference fit, and diversity shows how well customers were recommended items that they had not previously purchased [10,12,13]. Studies of recommendation accuracy have mainly focused on how well recommender algorithms improve predictive accuracy for customers. Thus, general recommender system research aims to increase the predictive accuracy of the model [5,7,14,15,16,17,18,19]. The study of the diversity of recommendations focuses on how well recommender systems recommend various products that the customer had not previously purchased while maintaining a certain level of accuracy [20,21,22,23]. Generally, if the recommender system provides items suitable for customer preference, customer satisfaction should be increased. However, if the system recommends the same item every time, customer satisfaction will decrease even if the recommender system’s accuracy is high [13,24]. Other studies suggest that pursuing diversity while maintaining a certain level of recommender system accuracy can increase customer satisfaction [25,26]. In other words, there seems to be an accuracy-diversity dilemma for recommender systems [8,27,28,29]. Thus, although research on recommender systems has focused on enhancing the model’s performance, customer satisfaction with the recommender system is just as important as improving system performance. Nonetheless, few studies have considered the relation between the performance of the recommender system and customer satisfaction. We believe it is important to address this issue because the recommender system is also an important factor to gain a sustainable competitive advantage for the e-commerce platform.
This study proposes a novel research methodology to identify factors that affect customer satisfaction when using recommender systems on an e-commerce platform. A few studies have determined that the accuracy and diversity of recommendations are positively related to customer satisfaction [8,30,31,32,33,34,35]. However, in these previous studies, it is not clear that accuracy and diversity affect customer satisfaction. To explore this question, we developed several recommender systems and measured the accuracy and diversity of recommendations and customer satisfaction through a series of experiments with a real diverse dataset. In addition, we adopted the expectancy disconfirmation theory (EDT) approach, which is widely used in online e-commerce to identify customer satisfaction [36,37]. Many previous studies have calculated customer satisfaction with recommendations through surveys, and this study calculates customer satisfaction from simulation experiments using extensive data from e-commerce websites. We show that the proposed customer satisfaction calculation approach can be applied to other domains, including the phenomenon of the entire market. This study seeks to make theoretical contributions by simultaneously considering the customer attitude aspect and its relationship to the recommendation performance aspect. It also identifies how the e-commerce platform facilitates the customer decision-making process from a practitioner aspect.
This study collected a dataset from GroupLens and Amazon, including User ID, Item ID, and Rating. We then constructed accuracy, diversity, and customer satisfaction metrics and used regression models to identify the impact of the accuracy and diversity of recommendations on customer satisfaction. Finally, we studied the prediction power of our proposed factors affecting customer satisfaction using a dataset containing 1,000,209 interactions and 2,023,070 interactions from GroupLens and Amazon, respectively. The results of our experiments indicate that recommendation accuracy significantly influences customer satisfaction. Recommendation accuracy can positively affect customer satisfaction when applying the most popular recommender system algorithms, such as ItemKNN, SVD, and NCF. Additionally, the diversity of recommendations positively affects customer satisfaction only when applying deep learning-based recommender systems such as NCF. These results confirm that accuracy and diversity positively affect customer satisfaction when applying a deep learning-based recommender system. By contrast, only accuracy positively affects customer satisfaction when applying traditional recommender systems. The framework of this study is shown in Figure 1.
The remainder of this study is structured as follows: Section 2 describes recommender systems in e-commerce, overviews of the recommender system method, and EDT with customer satisfaction. Section 3 presents the developed research hypotheses. Section 4 and Section 5 describe two publicly available datasets, evaluation criteria, and experimental results, respectively. Finally, Section 6 summarizes the research and describes future studies.

2. Literature Review

2.1. Recommender Systems in E-Commerce

Personalized recommender systems in e-commerce research have been regarded as significant issues in approximately the last 20 years [13,38]. Following the success of Amazon, Netflix, Spotify, and others, most e-commerce companies have tried to provide a certain level of personalized recommendation service. Otherwise, e-commerce companies would not last for a long time [39]. Customers are becoming familiar with receiving recommendations via smartphones, and it will not be easy to achieve sales continuity if customers are recommended only products that suit their preferences. Many products are being produced worldwide and introduced to the market, and consumer needs are more diverse than in the past; consequently, customers seek a differentiated personalization experience when purchasing products. Recently, technologies such as machine learning and deep learning have been developed, and customers’ data can be analyzed in various ways. Therefore, e-commerce is focusing on a more advanced personalization recommender system for sustainable development [40].
Netflix [3] proposed a personalization recommendation algorithm based on a deep neural network to build a video recommender system. Because of this personalization recommender system, Netflix has become a leader in movies and dramas. Spotify [41] has topped the music streaming market by offering personalization services. Spotify’s services are Discover Weekly, which suggests new music every Monday, and Fresh Finds, which introduces songs by relatively lesser-known artists, and so on. Google [4] recommends news in real-time based on users’ regions and interests. It also provides AI assistant services by learning users’ life patterns. Amazon [42] started to provide personalization services by applying AI technology to its AI speakers and Amazon websites. Furthermore, Amazon has released some AI technologies as a service. Samsung provides automatic personalized services by analyzing users’ living habits and usage environments through their smartphones. Alibaba [43] and Naver [44] have applied AI-based personalization services to search content.
Recently, the term hyper-personalization has emerged as an advance beyond personalization. The reason is that services that satisfy customers in e-commerce are becoming increasingly important. However, it is not easy to find empirical studies to examine the relation between personalization services in e-commerce and customer satisfaction. Therefore, this study aims to identify factors that affect customer satisfaction when they provide personalized recommender systems in e-commerce.

2.2. Methodologies in Recommender Systems

Recommender systems help users filter useless information to reduce information overload and provide personalized recommendations. E-commerce platforms have achieved great success in assessing customers’ preferred products and improving their business profit. To enhance personalization capabilities, recommender systems are widely applied in many multimedia platforms targeting media products to specific customers. Since the early e-commerce platforms, the most representative analysis technique in recommender systems has been collaborative filtering (CF), which is reported to provide good performance despite its simple structure and ease of use [5,7,39,45]. The CF algorithm predicts customers’ preferences by calculating similarities among customers or items [15,38,39].
CF algorithms are mainly divided into two categories: memory-based and model-based [6]. Memory-based CF can be divided into user-based and item-based CF. User-based CF calculates the similarity between customers by comparing their ratings on the same item [38]. It then computes the predicted rating for an item by the active customer as a weighted average of the item’s ratings by customers similar to the active customer, where weights are the similarities of these customers with the target item. Item-based CF computes predictions using the similarity between items that are not the similarity between customers [13,15]. Model-based CF uses a user-item rating matrix to train a model with machine learning or data mining techniques to improve the CF algorithm’s performance [6,46]. The trained model can then be used to provide recommendation lists for individual users. These techniques can quickly recommend a series of items because they use a precomputed model, and they have been proven to produce recommendation results similar to the neighborhood-based recommender system [13]. Algorithms that are often used in model-based CF include SVD (singular value decomposition), Bayesian networks, and neural networks [6,13,38]. However, an issue known as “cold start” accompanies CF, whereby the recommendations for new customers suffer from unpredictability because of a lack of historical data on their past purchases. Another issue known as “first start”, in which recommendations cannot be made until a customer’s preferences are reflected, is also widely prevalent [6,13]. In addition, as the volume of data increases, there is a scalability problem that reduces the CF algorithm’s computational speed. Recently, many researchers have started to apply deep learning to recommender systems to maximize each method’s advantages, sment the disadvantages of CF algorithms, and effectively utilize various kinds of information [44,47]. A deep neural network (DNN) refers to a network of two or more hidden layers between the input and output layers [48]. This method uses sophisticated mathematical modeling to solve complex problems. Compared to traditional machine learning algorithms, it has been reported that DNNs have the advantage of being able to identify the potential structure of data [48]. Covington, et al. [49] proposed a recommendation algorithm based on DNN to build a video recommender system and showed that the proposed recommendation algorithm predicted 60% of video clicks on YouTube. Cheng, et al. [50] proposed an app recommender system for Google Play based on a DNN, and Okura, et al. [51] proposed a news recommender system based on a recursive neural network (RNN) and achieved good performance when applying it to Yahoo News. Since such a DNN-based recommender system shows an outstanding performance improvement over traditional recommender systems based on content-based filtering (CB), CF, and their hybrid methodologies, various attempts have been made to apply the DNN model to diverse recommendation problems [47]. The neural collaborative filtering (NCF) algorithm is one of the most typical models combining DNN and CF. NCF is trained by estimating the relationship between the user’s latent vector and the latent vector of the item through the multilayer perceptron-based matrix factorization technique [52]. Therefore, in this study, we applied the most popular approaches, CF, SVD, and NCF, to develop a recommender system to identify which factors can affect customer satisfaction.

2.3. EDT and Customer Satisfaction

This study identifies factors that affect customer satisfaction when recommender systems are used on an e-commerce platform. To calculate customer satisfaction, we employ the EDT approach, which has been widely used in previous studies. EDT, which is used in various fields, is an extension model based on expectation-confirmation theory and the technology acceptance model (TAM) [53]. The EDT model is used in various studies to determine its impact on customer satisfaction and continuance intention in the latest technologies and online environments [53,54]. Continuation intention is influenced by customer satisfaction, determined by the difference between perceived quality and expectation levels. Consequently, customer satisfaction has a positive effect on continuance intention and word of mouth. According to EDT theory, the satisfaction that customers feel after purchasing products and services results from the following five stages [55]. First, customers shape their expectations for products and services through their experience. Second, they recognize the performance after using products and services. Third, they compare the performance with their expectations. If the performance is higher (or lower) than their expectations, a positive (or negative) disconfirmation will occur. Fourth, customers judge their satisfaction level based on these initial expectations and the resulting degree of disconfirmation. In other words, customers who have experienced positive disconfirmation are satisfied, while customers with negative disconfirmation are dissatisfied. Finally, the satisfied customer will then form the intention to repurchase or reuse the product or service, but dissatisfied customers will stop using it.
For example, Bhattacherjee [53] used expectation-confirmation theory to identify factors that influence customers’ reuse intentions for online banking. McKinney, et al. [56] used EDT theory to measure web customer satisfaction in the information search stage of online shopping. Lin [57] proposed that EDT theory in e-commerce is an appropriate model for customer behavior because customer repurchase decisions are influenced by customer behavior. Based on EDT theory, Nevo and Chan [58] studied the effects of customer expectations and the desire for knowledge management systems on system satisfaction. Doong and Lai [59] used EDT theory to identify factors that influence the reuse intent of an e-negotiation system. In these studies, we can infer that EDT theory is suitable for a wide range of applications in which a comparison of customers’ expectations of a product or system with the perceived performance plays an essential role in decision making. Applying a recommender system in e-commerce is directly related to sales and profit, so it is essential to develop or introduce a recommender system that fits customers’ expectations. Whether a recommender system should continue to be applied to an e-commerce site can be determined by the disconfirmation between the customers’ experience with the recommender system and their prior expectations.

3. Research Hypotheses

3.1. Hypothesis 1: Accuracy of Recommendation

Customer satisfaction is important for maintaining a sustainable competitive advantage in e-commerce [60]. The customer who is satisfied with the recommendation service provided by an internet shopping mall tends to repurchase items at the e-commerce platform and recommend the recommendation service to his/her family, friends, and colleagues.
Algorithms for recommender systems were developed on the assumption that the satisfaction of customers increases as the accuracy of recommender systems increases [7,38,61,62]. Some researchers have shown that more accurate recommendations increase customer satisfaction [8,30,31]. Liang, et al. [63] empirically verified that user satisfaction with the recommender system can be increased depending on how accurate the recommendation provided is. In other words, more accurate recommendations increase the likelihood that customers will find items that suit their preferences, which in theory increases customer satisfaction. Therefore, reflecting the relationship between the accuracy of the recommender system and customer satisfaction, the following hypothesis is presented:
Hypothesis 1 (H1). 
Accurate recommendations as a function of the number of recommended items positively influence customer satisfaction.

3.2. Hypothesis 2: Diversity of Recommendation

Providing new items or services to customers in e-commerce is related to the diversity of recommendations. The diversity of the recommendations is achieved by evaluating the ability of a recommender system to provide a diverse list of recommendations that the customer did not know [61]. It is known that if the accuracy of the recommender system is high, the customer satisfaction level is also high [63]. However, the satisfaction or reliability of the recommender system will decrease if the customer receives the same recommended item repeatedly. Some studies have claimed that accuracy was not the only consideration when measuring the quality of the recommendation [32,33,34,35]. Other studies argue that a more diverse list of recommendations increases the probability that a customer will choose the recommended item [12,32,64,65]. Thus, it is also important for recommender systems to provide a recommendation list consisting of diverse items as well as accurate items. In other words, the diversity of the recommendations decreasing the similarity of the items in the recommended list significantly improves customer satisfaction [24,35,66]. Thus, the hypothesis is presented as follows:
Hypothesis 2 (H2). 
Diverse recommendations as a function of the number of recommended items positively influence customer satisfaction.

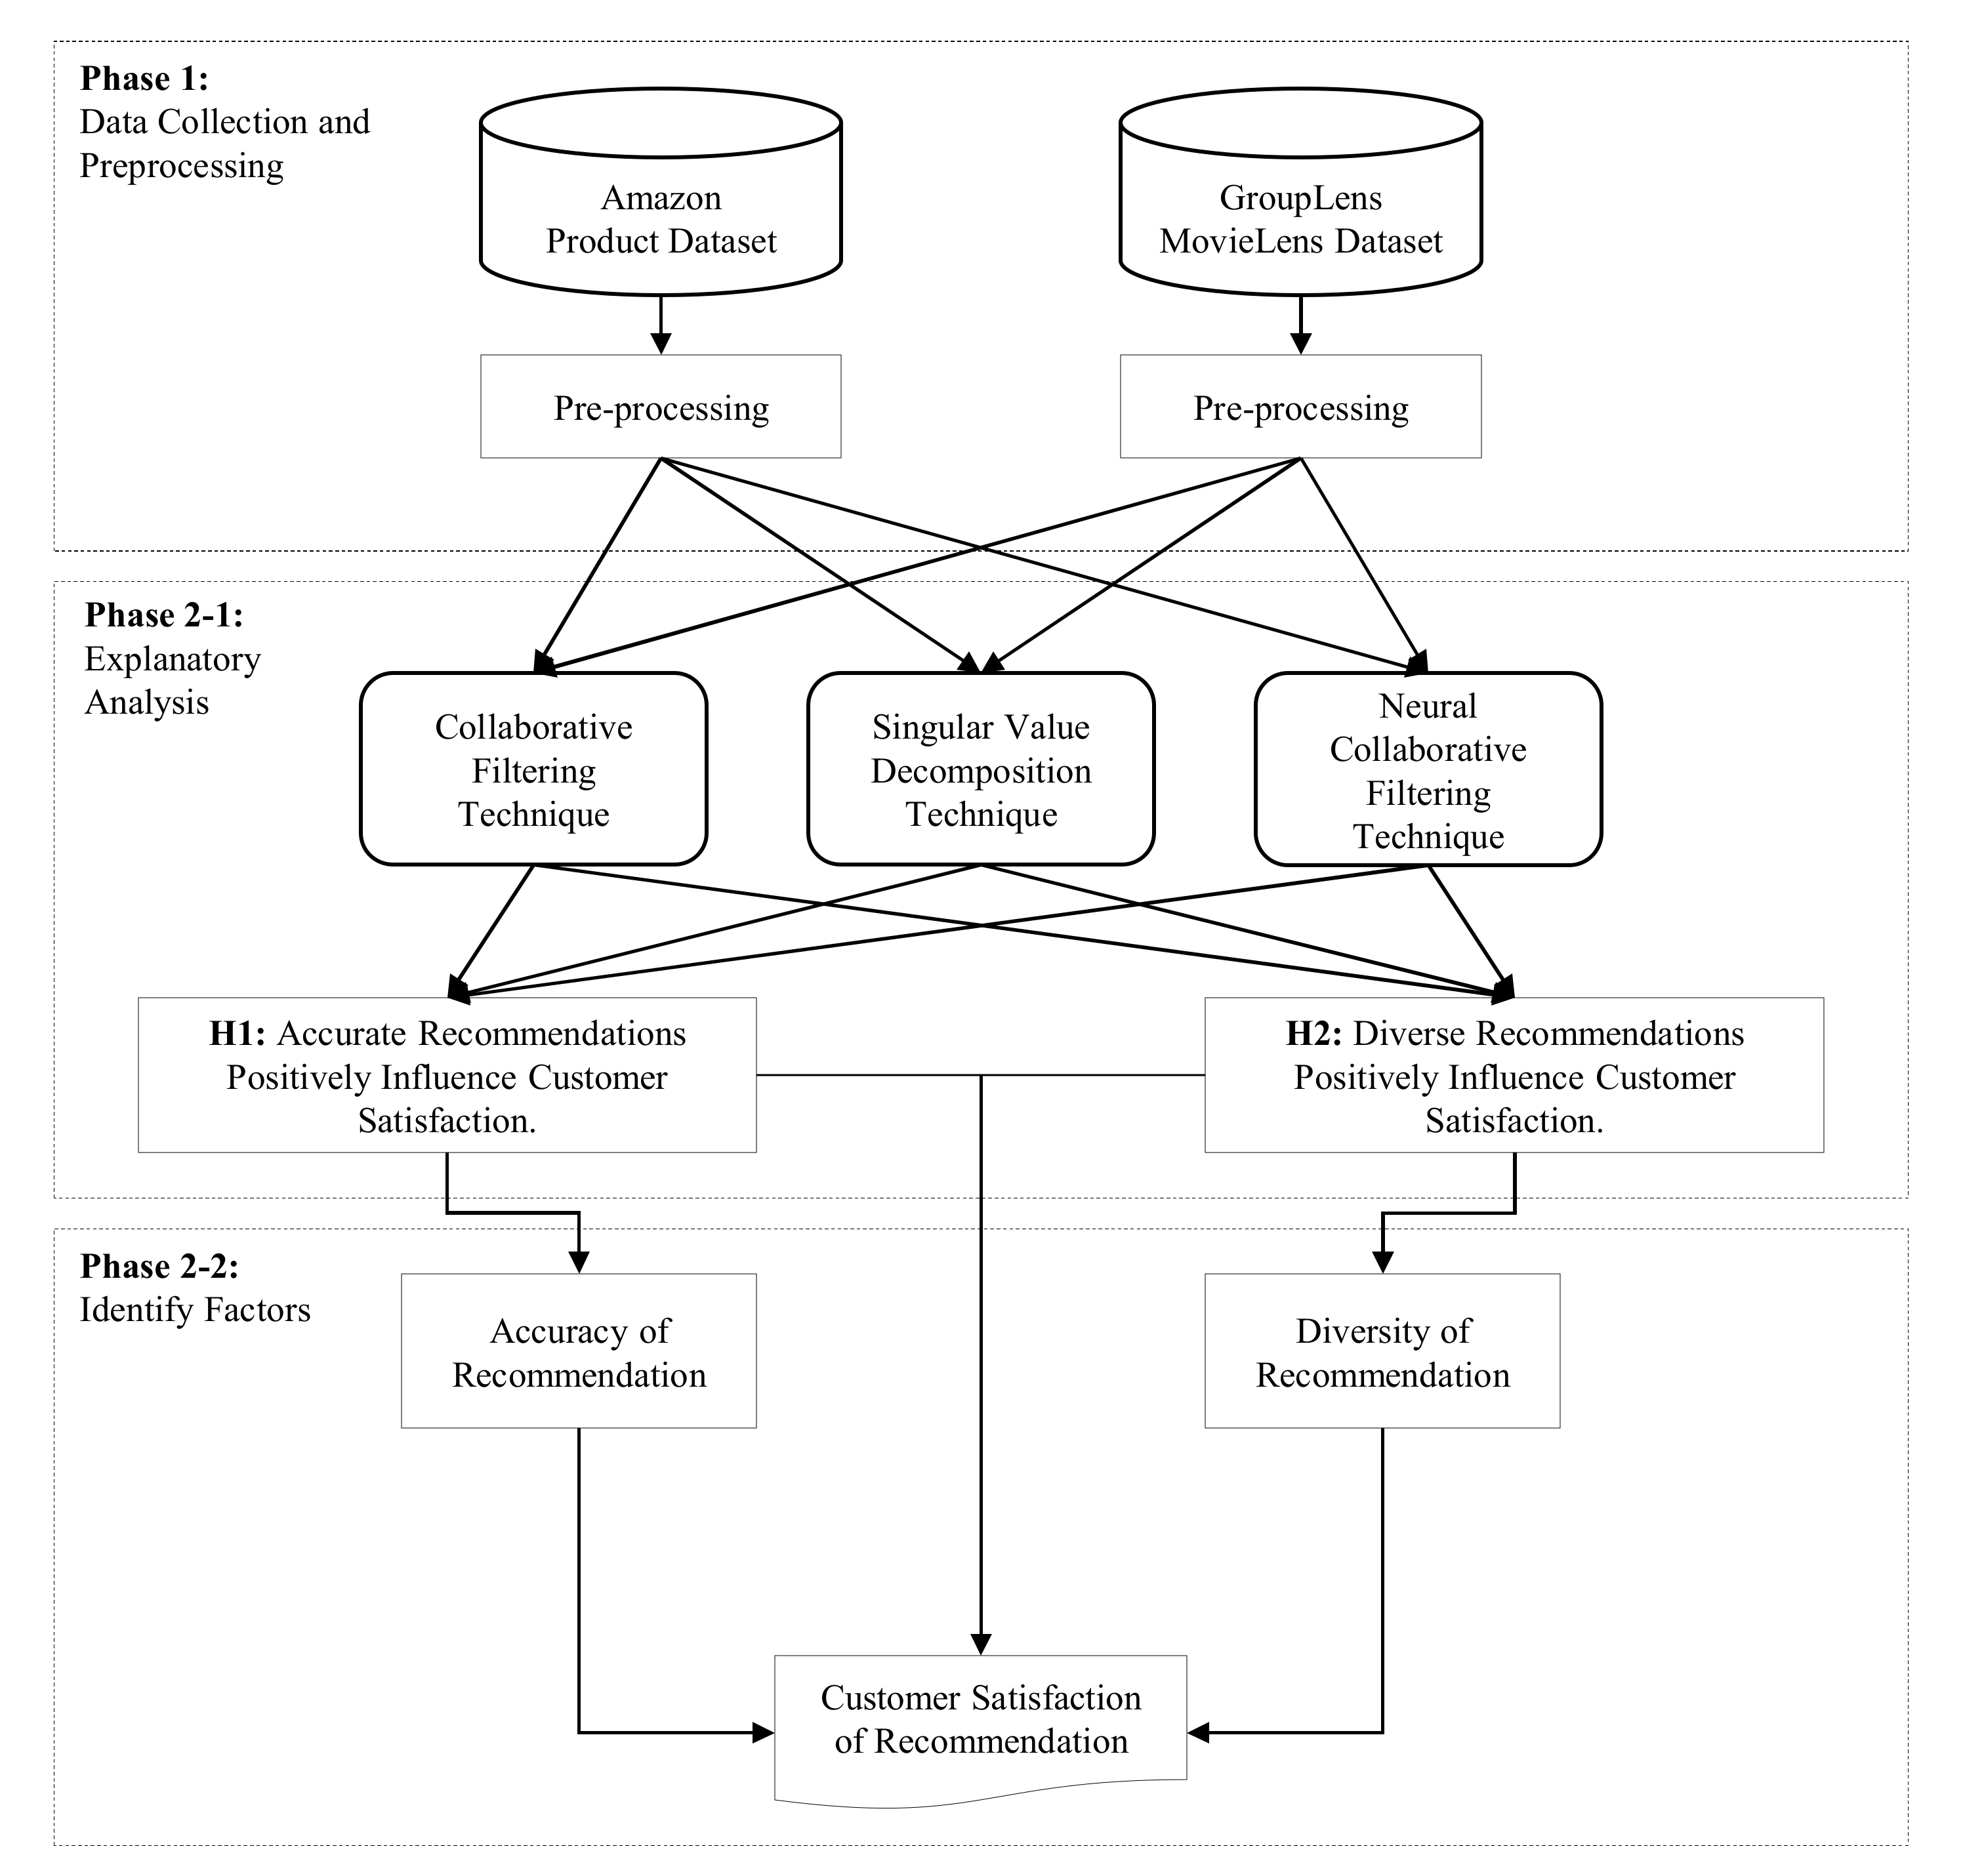
4. Dataset and Evaluation Criteria

4.1. Dataset Collection and Pre-Processing

We used MovieLens 1M (https://grouplens.org/datasets/movielens/1m/, accessed on 1 October 2020) and Amazon Product (http://jmcauley.ucsd.edu/data/amazon/, accessed on 1 October 2020), two publicly accessible datasets, for our experiments. The descriptive statistics of the two datasets are summarized in Table 1. The MovieLens dataset contains 1,000,209 ratings from 6040 users on 3706 items with a sparsity of 95.53%. This dataset includes a discrete scale of 1–5, where each user has rated at least 20 movies. The Amazon dataset contains 2,023,070 ratings from 1,210,271 users on 249,274 items with a sparsity of 99.99%. This original dataset is extensive but very sparse. For example, over 73% of users have rated only one item, making it difficult to evaluate algorithms. Therefore, the datasets were filtered in the same way as MovieLens datasets that held only users with 20 or more ratings. This results in a subset of the dataset that contains 2826 users and 42,042 items.

4.2. Evaluation Criteria of Accuracy, Diversity, and Customer Satisfaction

To measure the accuracy and diversity of recommendations as well as customer satisfaction, we adopted simple random sampling (SRS), which has been widely used in the literature [13,38]. We set 80% as a training dataset for each user and utilized the remaining dataset used to make predictions. The evaluation metrics depend on the method of recommendation approach. Accuracy metrics show how well the customer’s actual and predicted preference fit, and diversity metrics show how well customers were recommended items that they had not previously purchased or expected. The metrics measuring accuracy are divided into statistical and decision-supporting accuracy metrics [67]. The former are employed for predictive algorithms, and the latter are employed for classification algorithms. In this study, to evaluate the performance of the recommender system, we employed the mean absolute error (MAE) and F1 score as metrics that have been widely used in the literature [61,67,68]. The MAE is a statistical accuracy metric that evaluates the quality of prediction by comparing the difference between predicted and actual ratings on test users, as shown in Equation (1). A lower MAE value is a more accurate recommendation prediction.
M A E = 1 n i = 1 n a b s ( r ^ u i r u i )   ,
where n is the total number of recommendation items, r ^ u i is the predicted rating, and r u i is the actual rating by the user u for the item i .
To understand whether users are interested in the recommendation list, we employ the precision, recall, and F1 score metrics, which are widely used in Top-K recommendation to evaluate the varying number of recommendation lists [33,61]. The F1 score is a balanced weighted average between precision and recall. A higher F1 score means a higher prediction ability of the recommendation system. The precision recall and F1 score for Top-K recommendations are defined in Equations (2)–(4).
p r e c i s i o n = T P T P + F P   ,
r e c a l l = T P T P + F N   ,
F 1   = 2 × p r e c i s i o n × r e c a l l p r e c i s i o n + r e c a l l   ,
where TP is true positive (item relevant and recommended), FP is false positive (item irrelevant and recommended), and FN is false negative (item relevant and not recommended). The available ratings are binary to differentiate relevant and irrelevant items.
Most recent studies have suggested measuring the diversity of recommended items as well to avoid a situation where many customers are referred to the same items [8,12,20]. There are several metrics for measuring the diversity of recommendations. In this study, we measured diversity using Shannon entropy (SE), which is widely used in several studies [69,70]. The SE is defined as follows:
S E = i = 1 n ( p i log ( p i ) ) ,
where pi is the percentage of the recommendation items containing the i th item and n is the total number of items.
Many customers post star ratings of items on e-commerce platforms that they have purchased. Star ratings are essential for predicting initial expectation levels for recommended items because the recommender system predicts the likelihood of customer purchases based on star ratings. Additionally, star ratings are important in measuring the performance following the purchase because high and low ratings indicate positive and negative views of items, respectively [71]. Therefore, we can define disconfirmation as the average of the differences in users’ actual ratings and predicted ratings. Disconfirmation is defined as follows:
D i s c o n f i r m a t i o n = 1 m i = 1 n ( r ^ u i r u i ) ,
where m is the total number of recommendation items, r ^ u i is the predicted rating, and r u i is the actual rating by the user u for the item i . We calculated customer satisfaction for each test user and reported the average score.

5. Exploratory Analysis

5.1. Build Several Types of Recommender System

To test the research hypotheses, we developed ItemKNN, SVD, and NCF algorithms, which are the most popular algorithms of recommender systems [10,24]. The simulation experiments were programmed using the Surprise and Keras libraries. All experiments were carried out on a system with an i9-9900 KF CPU @3.60 GHz with 64 GB RAM. The three types of recommender system methods can be described as follows:

5.1.1. ItemKNN

This method is the standard item-based CF that is based on neighborhood models in recommender systems [10,14,68]. We followed the setting of the existing literature to adapt it to an explicit dataset [2,72]. The most common item-based CF is a similarity measure between items, where s i m i , j denotes the similarity of item i and item j . Many studies have measured similarity based on the Pearson correlation coefficient [13,73]. The similarity between item i and item j is calculated as follows:
s i m ( i , j ) = u U R u , i R ¯ i R u , j R ¯ j u U R u , i R ¯ i 2 u U R u , j R ¯ j 2
where R u , i represents the rating of user u for item i and R ¯ i is the average rating of the i-th item. In this method, the goal is to predict R ^ u i —unobserved values by user u for item i . Calculates the sum of ratings given by the user for items similar to i to predict item i for user u. Each rating is weighted by the corresponding similarity sim(i,j) between items i and j [73]. The predicted rating is taken as a weighted average of the ratings for neighboring items defined as follows:
R ^ u i = n N R u , n × s i m ( i , j ) n N s i m ( i , j )

5.1.2. SVD

Recently, the matrix factorization model has gained popularity because of its high accuracy and scalability [10,13,24]. This study will focus on methods that are induced by the SVD of the user-item interaction matrix. SVD is the most popular approach for estimating the interaction component in the matrix factorization technique that reduces the number of features in a dataset by reducing the space dimension from a high-level dimension to a low-level dimension [24,38]. Accordingly, each item i is associated with a latent vector V, and each user u is associated with a vector U. Typically, this method is applied to explicit feedback datasets while avoiding overfitting through a regularized model [74,75]. The SVD model is defined as follows:
min U . V Y M ( U V ) F 2 + λ ( U F 2 + V F 2 ) ,
where U and V are the number of latent factor users and items, respectively, and λ is used for regularizing the model. Y is the available ratings set, and M is the binary mask.

5.1.3. NCF

In general, the traditional latent factor model uses a simple vector dot item for estimating the relationship latent vector. Therefore, the model cannot produce good results [47,76]. To overcome the limitations of the existing technique, this method is trained by estimating the relationship between the latent vector of user u and the latent vector of item i through the multilayer perceptron [47,77]. The user embedding and item embedding are provided in a multilayer neural structure to map latent vectors to prediction scores. Finally, the dimensions of the last hidden layer N determine the functionality of the model. The output layer is the predicted rating, and the model training is performed by minimizing the loss between the predicted rating and its actual rating [47,52]. The training model followed the parameter settings of existing studies [52,77]. The NCF predictive model is defined as follows:
z 1 = ϕ 1 ( P T u u U , Q T v i I ) = P T u u U Q T v i I z 2 = ϕ 2 ( z 1 ) = a 2 ( W 2 T z 1 + b 2 ) z L = ϕ L ( z L 1 ) = a L ( W L T z L 1 + b L ) y ^ u , i = σ ( h T ϕ L ( z L 1 ) )
where u u U and v i I denote that the input layer consists of two feature vectors. P T u u U and Q T v i I denote the latent factors for the user and item, respectively, and θ denotes the parameter of the model. W and b represent weight matrices and bias vectors, respectively.

5.2. Experiment 1: Movielens Dataset

5.2.1. Impact of Predictive Factor Size

In this section, we study the impact of factor size change on the predictive performance of the recommender system with the MovieLens dataset. To determine the optimal number of factors, we performed several experiments that set several factors from 5 to 100. For the SVD and NCF algorithms, the number of factors is equal to the number of latent factors. For ItemKNN algorithms, we performed experiments with several neighborhood sizes and reported the best performance. Figure 2 shows the results of the experiments. The results show that the predictive performance of the ItemKNN algorithm increased as the neighborhood size increased. The SVD algorithm does not change much as the number of factors increases. In the NCF algorithm, after a certain factor, the improvement gains diminished, and the quality of prediction worsened. For each algorithm, the quality of prediction was great when the number of factors was 50, 50, and 10. Thus, we performed several other experiments to determine the optimal number of item recommendations when the number of factors was optimized.

5.2.2. Impact of Number of Recommendation List

To determine the optimal accuracy and diversity, various studies were conducted on several recommendation lists that varied from 5 to 100 at the optimized number of factors. The results are shown in Figure 3, Figure 4 and Figure 5. In all recommender system algorithms, it can be observed from the figure that accuracy (F1 score) and diversity (Shannon entropy) improve with the increasing number of recommendation lists. For each algorithm, the accuracy was highest when the number of recommendation sizes was 100, 90, and 100, whereas diversity continued to increase with the recommendation list’s increasing length. The diversity was highest when the number of recommendation sizes was 100 on all algorithms. In other words, the total number of unique items increased as the length of the recommendation list increased. These results showed that both accuracy and diversity are optimized for recommender systems such as the ItemKNN and NCF algorithms when the number of recommendation sizes is 100. Furthermore, the SVD algorithm’s accuracy and diversity are optimized when the number of recommendation sizes is 90. Therefore, we tested the hypothesis at the optimized number of factors and the number of recommendations.

5.2.3. Experimental Results

The mean and standard deviation for accuracy, diversity, and customer satisfaction at the MovieLens Dataset are listed in Table 2. The mean values for accuracy and diversity were between 0.5146 and 0.6927 and between 1.0560 and 1.1628, respectively. Furthermore, the mean value of customer satisfaction was between 0.4820 and 0.6204. The highest value of accuracy is for the NCF algorithms (0.6927), and the lowest value of accuracy is for the ItemKNN algorithms (0.5146). The highest value of diversity is at the NCF algorithm (1.1628), and the lowest value of diversity is at the SVD algorithm (1.0560). The highest value of customer satisfaction is at NCF algorithms (0.6204), and the lowest value of customer satisfaction is at ItemKNN algorithms (0.4820).
To test the research hypotheses proposed above, we performed multiple regression analyses (MRA), using customer satisfaction as a dependent variable and the accuracy and diversity of recommendations as independent variables under simulation output data. Table 3 summarizes the results of MRA for hypotheses H1 and H2 in the MovieLens Datasets. In Table 3, for the ItemKNN and SVD algorithms, the significant factors of customer satisfaction are both accuracies (p < 0.001). The effect of diversity of recommendation is not significant for ItemKNN and negatively affects customer satisfaction (p < 0.001) for SVD algorithms. The regression model explains 14.3% and 1.9% of the variance in profitability, respectively. For the NCF algorithms, the significant factors of customer satisfaction are both accuracy (p < 0.001) and diversity (p < 0.05). The regression model explains 25.7% of the variance in profitability. For the ItemKNN and SVD algorithms, the results show that accuracy positively and significantly affects customer satisfaction, supporting Hypothesis 1. For the NCF algorithms, both accuracy and diversity positively and significantly affect customer satisfaction, supporting Hypothesis 1 and Hypothesis 2.
Additionally, a one-way analysis of variance (ANOVA) was conducted to determine whether there was a significant difference in accuracy, diversity, and customer satisfaction for each recommender systems on the MovieLens datasets. The Scheffé Post Hoc Test was used to identify multiple comparisons of group means. The results presented in Table 4 indicate a significant accuracy (F = 2.002, Sig. = 0.048), diversity (F = 13.873, Sig. = 0.000), and customer satisfaction (F = 4.428, Sig. = 0.003) difference among the recommender systems.

5.3. Experiment 2: Amazon Dataset

5.3.1. Impact of Predictive Factor Size

As in the MovieLens dataset experiment, to determine the optimal number of factors, we performed several experiments that set the factor number from 1 to 100. Figure 6 shows the results of the experiments for the Amazon dataset. The results show that the predictive performance of the ItemKNN algorithm increased before maintaining a certain level of accuracy as the neighborhood size increased. The SVD algorithm decreased minutely as the number of factors increased. In the NCF algorithm, after a certain factor, the improvement gains diminished, and the quality of prediction worsened. For each algorithm, the quality of prediction was great when the number of factors was 60, 5, and 5.

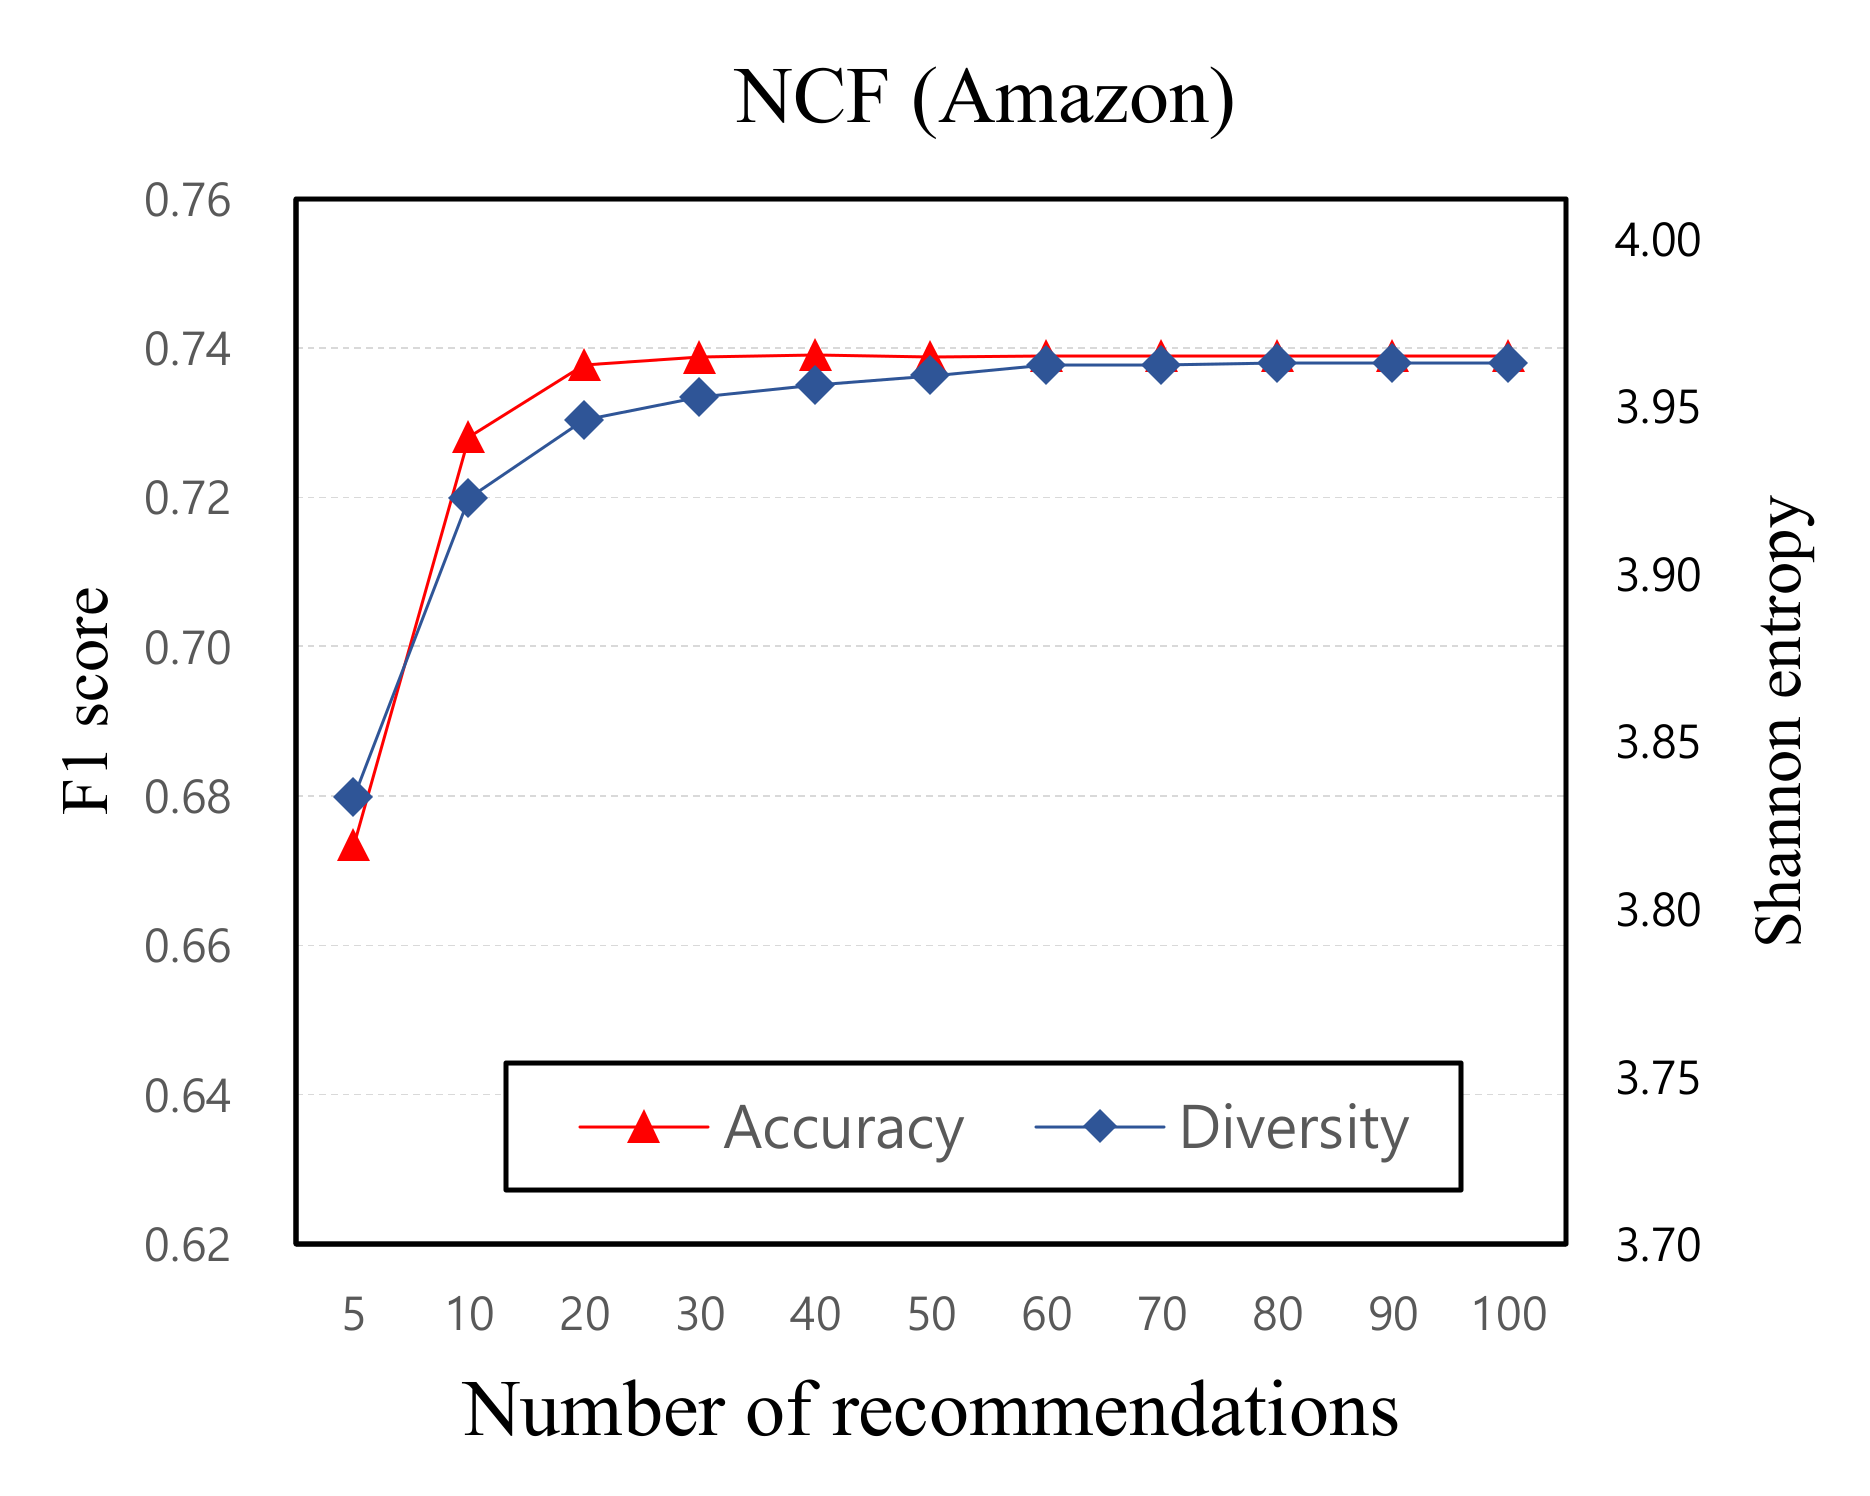
5.3.2. Impact of Number of Recommendation List

To determine the optimal accuracy and diversity, a variety of studies were conducted on several recommendations lists that varied from 5 to 100 at the optimized number of factors for each algorithm. The results are shown in Figure 7, Figure 8 and Figure 9. In all recommender system algorithms, it can be observed from the figures that accuracy (F1 score) and diversity (Shannon entropy) improve with the increasing number of recommendation lists. For each algorithm, the accuracy was highest when the number of recommendation sizes was 70, 40, and 40, whereas diversity continued to increase with the increasing size of the recommendation list. The diversity was highest when the number of recommendation sizes was 90, 80, and 90. In other words, the total number of unique items increased as the size of the recommendation list increased. These results show that both accuracy and diversity are optimized when the number of recommendation sizes is 70, 40, and 50, respectively.

5.3.3. Experimental Results

The mean and standard deviation for accuracy, diversity, and customer satisfaction at Amazon Datasets are listed in Table 5. The mean values for accuracy and diversity were between 0.6797 and 0.7797 and between 0.6826 and 0.7162, respectively. Furthermore, the mean value of customer satisfaction was between 0.6550 and 0.6911. The highest value of accuracy is at the ItemKNN algorithm (0.7797), and the lowest value of accuracy is at the SVD algorithm (0.6797). The highest value of diversity is at the NCF algorithm (0.7162), and the lowest value of diversity is at the ItemKNN algorithm (0.6826). The highest value of customer satisfaction is at NCF algorithms (0.6911), and the lowest value of customer satisfaction is at SVD algorithms (0.6550).
As in the experiment above, we performed MRA using customer satisfaction as a dependent variable and the accuracy and diversity of recommendations as independent variables under simulation output data for Amazon datasets. Table 6 summarizes the results of MRA for hypotheses H1 and H2 for the Amazon datasets. In Table 6, for the ItemKNN and SVD algorithms, the significant factors of customer satisfaction are both accuracies (p < 0.001). The effect of recommendation diversity is not significant. The regression model explains 35.9% and 29.2% of the variance in profitability, respectively. For the NCF algorithms, the significant factors of customer satisfaction are both accuracy (p < 0.05) and diversity (p < 0.05). The regression model explains 16.7% of the variance in profitability. For the ItemKNN and SVD algorithms, the results show that accuracy positively and significantly affects customer satisfaction, therefore supporting Hypothesis 1. For the NCF algorithms, both accuracy and diversity positively and significantly affect customer satisfaction, therefore supporting Hypothesis 1 and Hypothesis 2.
Additionally, a one-way analysis of variance (ANOVA) was conducted to determine whether there was a significant difference in accuracy, diversity, and customer satisfaction for each recommender systems on Amazon datasets. The Scheffé Post Hoc Test was used to identify multiple comparisons of group means. The results presented in Table 7 indicate a significant accuracy (F = 0.170, Sig. = 0.001), diversity (F = 1.265, Sig. = 0.014), and customer satisfaction (F = 6.170, Sig. = 0.000) difference among the recommender systems.

6. Conclusions

6.1. Results and Discussion

The purpose of this study is to examine the effect of recommendation accuracy and diversity on customer satisfaction when recommending products or services to customers in the e-commerce industry. Many e-commerce global companies, such as Amazon, Google, and Netflix, offer personalized recommendation services to maintain a sustainable competitive advantage. However, there is a trade-off between the accuracy of recommendations and the diversity of recommendations and continuing debates about which factors have a significant impact on customer satisfaction. Thus, we applied the most popular ways to approach recommender systems and investigated which factors affect customer satisfaction through a series of experiments with publicly available datasets widely used to evaluate recommender system performance. Finally, to test the hypotheses, MRA was conducted using customer satisfaction as a dependent variable and the accuracy and diversity of recommendations as independent variables.
The finding of this study is as follows. First, we employed EDT to measure customer satisfaction with the most popular recommender systems algorithms for the first time. The existing EDT study was limited to the concept of the individual level, and limited data collection has been mainly conducted based on questionnaires. We performed several experiments utilizing two datasets that contain the phenomenon of the entire market for measuring customer satisfaction. Second, we identified the factors that affect customer satisfaction. In traditional recommender system algorithms such as ItemKNN and SVD, the results showed that accurate recommendations positively affected customer satisfaction, which showed the same result for the two different datasets. In the deep learning-based recommender system, the effects of customer satisfaction after a recommendation on recommendation accuracy and diversity of recommendation were found to be significant. These results can be interpreted in the following way. Traditional recommendation algorithms such as ItemKNN and SVD obtain a list of recommended items from neighbors similar to the target user, and since most of the significant users tend to be fixed as most of the users’ neighbors, it is often difficult to recommend various products [5,7]. However, since NCF is a deep learning method, it can be assumed that various products are recommended from various neighbors through much more computation.

6.2. Theoretical Contributions and Practical Implications

This study provides theoretical contributions to the recommendation performance aspects and the customer attitude aspects for customer evaluation on the personalized recommendation service. First, there has been a lot of study on recommender systems since the late 1990s. However, most previous studies on personalized recommendation services have focused on improving accuracy performance [5,7,14,15,16,17]. However, when service recommends the same product every time, customer satisfaction will decrease even if the recommender system’s accuracy is high [13,24]. Other studies suggest that pursuing diversity while maintaining a certain level of recommender system accuracy can increase customer satisfaction [25,26]. In other words, there is an accuracy-diversity dilemma with personalized recommendation services [8,27,28,29]. Therefore, the study on personalized recommendation services focuses on enhancing the recommendation performance. However, customer satisfaction with the personalized recommendation services is just as important as improving system performance. Nonetheless, few studies have considered the relation between recommendation performance and customer satisfaction. However, recommendation performance and customer satisfaction are likely to form complex causal relationships, and more complex research methodologies are needed to account for these causal relationships. This study collects market-level real e-commerce datasets to describe the complex causal relationships among various variables through simulation experiments. Furthermore, it contributes to expanding the scope of research on personalized recommendation services by using the concept of customer satisfaction for personalized recommendation services that have been difficult to see in previous studies. Second, the previous measuring customer satisfaction research was limited to the concept of individual level, and limited data collection has been mainly conducted based on questionnaires. However, with IT technologies, including the Internet, market-level data are being collected in various fields. To utilize the data that contains the phenomenon of the entire market, it is necessary to apply various theories at the market level. Therefore, we adopted the EDT approach, which is widely used in online e-commerce to identify the accuracy of recommendations, diversity of recommendations, and customer satisfaction at the market level. This study contributes to expanding customer satisfaction studies utilizing market-level diverse datasets.
Finally, the experimental results of this study provide the following implications for decision-makers or practitioners in the e-commerce field. First, the existing recommender systems provided products based on customers’ purchase history, aiming to increase the system’s accuracy. This is because they believe that customers are satisfied when products or services are correctly recommended. However, if a customer is referred to similar products or services each time, he/she will be less satisfied with the recommender system. This study suggests that there is room for rethinking existing business strategies by statistically verifying that the accuracy and diversity of recommended items affect customer satisfaction. Most existing recommender systems of e-commerce platforms widely use traditional algorithms such as ItemKNN and SVD, thus suggesting an increase in sales volume by providing items that meet customer preferences because the recommendation’s accuracy can increase customer satisfaction. On the contrary, the deep learning-based recommender systems such as NCF algorithms suggest that sales volume could be increased by providing various items that meet customer preferences because pursuing diversity while maintaining accuracy can increase customer satisfaction. Second, as the e-commerce market has grown recently, the results of this study have implications for new e-commerce sites and existing large e-commerce sites. For the factors related to customer satisfaction identified in this study, related companies should closely investigate these factors and find other factors related to customer satisfaction. The results of this study can be used as a basic reference for e-commerce sites to reduce unnecessary costs and losses in terms of data collection and recommender system development and to suggest the direction of super-personalized services.

6.3. Limitations and Future Research

Nevertheless, there are several limitations to this study. First, our experiments were conducted using a movie and product dataset only. A generalization of this study results requires further experiments using datasets from various domains. Second, we conducted experiments with traditional algorithms and deep learning algorithms. However, the experimental results show that the deep learning algorithm performs better than traditional algorithms. Therefore, further study is needed on whether this study’s results will hold when various other deep learning algorithms, such as a convolutional neural network (CNN) and recurrent neural network (RNN), are used. Finally, this study identified the factors of accuracy and diversity of recommendation affecting customer satisfaction. In an e-commerce company, other evaluation metrics, such as serendipity and novelty, can also be essential factors in customer satisfaction. Therefore, future studies are needed to confirm the relationship between customer satisfaction and other evaluation metrics with a series of experiments with real datasets.

Author Contributions

Conceptualization, I.C. and Q.L.; methodology, I.C. and Q.L.; data curation, Q.L. and J.K.; writing—original draft preparation, Q.L.; writing—review and editing, I.C. and J.K.; supervision, J.K. All authors have read and agreed to the published version of the manuscript.

Funding

This research was supported by the BK21 FOUR Program (5199990913932) funded by the Ministry of Education (MOE, Korea) and the National Research Foundation of Korea (NRF), and the Industrial Strategic Technology Development Program (20009050) funded by the Ministry of Trade, Industry, and Energy (MOTIE, Korea).

Institutional Review Board Statement

Not applicable.

Informed Consent Statement

Not applicable.

Data Availability Statement

The data is available on https://grouplens.org/datasets/movielens/1m/ (accessed on 19 May 2021) and http://jmcauley.ucsd.edu/data/amazon/ (accessed on 19 May 2021).

Conflicts of Interest

The authors declare no conflict of interest.

References

  1. Cho, Y.H.; Kim, J.K. Application of Web usage mining and product taxonomy to collaborative recommendations in e-commerce. Expert Syst. Appl. 2004, 26, 233–246. [Google Scholar] [CrossRef]
  2. Linden, G.; Smith, B.; York, J. Amazon.com recommendation—Item-to-item collaborative filtering. IEEE Internet Comput. 2003, 7, 76–80. [Google Scholar] [CrossRef] [Green Version]
  3. Bennett, J.; Lanning, S. The netflix prize. In Proceedings of the KDD Cup and Workshop, San Jose, CA, USA, 12 August 2007; p. 35. [Google Scholar]
  4. Das, A.S.; Datar, M.; Garg, A.; Rajaram, S. Google news personalization: Scalable online collaborative filtering. In Proceedings of the 16th International Conference on World Wide Web 2007, Banff, AB, Canada, 8–12 May 2007; pp. 271–280. [Google Scholar]
  5. Kim, H.K.; Kim, J.K.; Ryu, Y.U. Personalized Recommendation over a Customer Network for Ubiquitous Shopping. IEEE Trans. Serv. Comput. 2009, 2, 140–151. [Google Scholar] [CrossRef]
  6. Ricci, F.; Rokach, L.; Shapira, B. Introduction to recommender systems handbook. In Recommender Systems Handbook; Springer: Boston, MA, USA, 2011; pp. 1–35. [Google Scholar]
  7. Kim, H.K.; Ryu, Y.U.; Cho, Y.; Kim, J.K. Customer-driven content recommendation over a network of customers. IEEE Trans. Syst. Man Cybern. Part A Syst. Hum. 2011, 42, 48–56. [Google Scholar] [CrossRef]
  8. Zhou, T.; Kuscsik, Z.; Liu, J.-G.; Medo, M.; Wakeling, J.R.; Zhang, Y.-C. Solving the apparent diversity-accuracy dilemma of recommender systems. Proc. Natl. Acad. Sci. USA 2010, 107, 4511–4515. [Google Scholar] [CrossRef] [Green Version]
  9. Silveira, T.; Zhang, M.; Lin, X.; Liu, Y.; Ma, S. How good your recommender system is? A survey on evaluations in recommendation. Int. J. Mach. Learn. Cybern. 2019, 10, 813–831. [Google Scholar] [CrossRef] [Green Version]
  10. Lu, J.; Wu, D.; Mao, M.; Wang, W.; Zhang, G. Recommender system application developments: A survey. Decis. Support Syst. 2015, 74, 12–32. [Google Scholar] [CrossRef]
  11. Bag, S.; Ghadge, A.; Tiwari, M.K. An integrated recommender system for improved accuracy and aggregate diversity. Comput. Ind. Eng. 2019, 130, 187–197. [Google Scholar] [CrossRef] [Green Version]
  12. Smyth, B.; McClave, P. Similarity vs. diversity. In Proceedings of the International Conference on Case-Based Reasoning, Vancouver, BC, Canada, 30 July–2 August 2001; pp. 347–361. [Google Scholar]
  13. Bobadilla, J.; Ortega, F.; Hernando, A.; Gutiérrez, A. Recommender systems survey. Knowl. Based Syst. 2013, 46, 109–132. [Google Scholar] [CrossRef]
  14. Choi, I.Y.; Oh, M.G.; Kim, J.K.; Ryu, Y.U. Collaborative filtering with facial expressions for online video recommendation. Int. J. Inf. Manag. 2016, 36, 397–402. [Google Scholar] [CrossRef]
  15. Herlocker, J.L.; Konstan, J.A.; Riedl, J. Explaining collaborative filtering recommendations. In Proceedings of the 2000 ACM Conference on Computer Supported Cooperative Work, Philadelphia, PA, USA, 2–6 December 2000; pp. 241–250. [Google Scholar]
  16. Unger, M.; Tuzhilin, A.; Livne, A. Context-Aware Recommendations Based on Deep Learning Frameworks. ACM Trans. Manag. Inf. Syst. (TMIS) 2020, 11, 1–15. [Google Scholar] [CrossRef]
  17. Adomavicius, G.; Tuzhilin, A. Context-aware recommender systems. In Recommender Systems Handbook; Springer: Boston, MA, USA, 2011; pp. 217–253. [Google Scholar]
  18. Colace, F.; De Santo, M.; Lombardi, M.; Santaniello, D. CHARS: A cultural heritage adaptive recommender system. In Proceedings of the 1st ACM International Workshop on Technology Enablers and Innovative Applications for Smart Cities and Communities, New York, NY, USA, 10 November 2019; pp. 58–61. [Google Scholar]
  19. Colace, F.; Lemma, S.; Lombardi, M.; Pascale, F. A Context Aware Approach for Promoting Tourism Events: The Case of Artist’s Lights in Salerno. In Proceedings of the 19th International Conference on Enterprise Information Systems (ICEIS (2)), Porto, Portugal, 26–29 April 2017; pp. 752–759. [Google Scholar]
  20. Hurley, N.; Zhang, M. Novelty and diversity in top-n recommendation—Analysis and evaluation. ACM Trans. Internet Technol. (TOIT) 2011, 10, 1–30. [Google Scholar] [CrossRef]
  21. Adomavicius, G.; Kwon, Y. Improving aggregate recommendation diversity using ranking-based techniques. IEEE Trans. Knowl. Data Eng. 2011, 24, 896–911. [Google Scholar] [CrossRef]
  22. Zhang, L.; Wei, Q.; Zhang, L.; Wang, B.; Ho, W.-H. Diversity balancing for two-stage collaborative filtering in recommender systems. Appl. Sci. 2020, 10, 1257. [Google Scholar] [CrossRef] [Green Version]
  23. Kotkov, D.; Veijalainen, J.; Wang, S. How does serendipity affect diversity in recommender systems? A serendipity-oriented greedy algorithm. Computing 2020, 102, 393–411. [Google Scholar] [CrossRef] [Green Version]
  24. Aggarwal, C.C. Recommender Systems; Springer: Cham, Switzerland, 2016; Volume 1. [Google Scholar]
  25. Lathia, N.; Hailes, S.; Capra, L.; Amatriain, X. Temporal diversity in recommender systems. In Proceedings of the 33rd International ACM SIGIR Conference on Research and Development in Information Retrieval, Geneva, Switzerland, 23 July 2010; pp. 210–217. [Google Scholar]
  26. Beel, J.; Langer, S.; Genzmehr, M.; Gipp, B.; Breitinger, C.; Nürnberger, A. Research paper recommender system evaluation: A quantitative literature survey. In Proceedings of the International Workshop on Reproducibility and Replication in Recommender Systems Evaluation, Hong Kong, China, 12 October 2013; pp. 15–22. [Google Scholar]
  27. Isufi, E.; Pocchiari, M.; Hanjalic, A. Accuracy-diversity trade-off in recommender systems via graph convolutions. Inf. Process. Manag. 2021, 58, 102459. [Google Scholar] [CrossRef]
  28. Eskandanian, F.; Mobasher, B. Using Stable Matching to Optimize the Balance between Accuracy and Diversity in Recommendation. In Proceedings of the 28th ACM Conference on User Modeling, Adaptation and Personalization, Genoa, Italy, 12–18 July 2020; pp. 71–79. [Google Scholar]
  29. Adomavicius, G.; Kwon, Y. Overcoming accuracy-diversity tradeoff in recommender systems: A variance-based approach. In Proceedings of the 18th Workshop on Information Technology and Systems (WITS), Paris, France, 13–14 December 2008. [Google Scholar]
  30. Abdel-Hafez, A.; Tang, X.; Tian, N.; Xu, Y. A reputation-enhanced recommender system. In Proceedings of the International Conference on Advanced Data Mining and Applications, Guilin, China, 19–21 December 2014; pp. 185–198. [Google Scholar]
  31. Christoffel, F.; Paudel, B.; Newell, C.; Bernstein, A. Blockbusters and wallflowers: Accurate, diverse, and scalable recommendations with random walks. In Proceedings of the 9th ACM Conference on Recommender Systems, Vienna, Austria, 16–20 September 2015; pp. 163–170. [Google Scholar]
  32. McNee, S.M.; Riedl, J.; Konstan, J.A. Being accurate is not enough: How accuracy metrics have hurt recommender systems. In Proceedings of the CHI’06 Extended Abstracts on Human Factors in Computing Systems, Montréal, QC, Canada, 22–27 April 2006; pp. 1097–1101. [Google Scholar]
  33. Herlocker, J.L.; Konstan, J.A.; Terveen, L.G.; Riedl, J.T. Evaluating collaborative filtering recommender systems. ACM Trans. Inf. Syst. (TOIS) 2004, 22, 5–53. [Google Scholar] [CrossRef]
  34. Pu, P.; Chen, L.; Hu, R. A user-centric evaluation framework for recommender systems. In Proceedings of the Fifth ACM Conference on Recommender Systems, Chicago, IL, USA, 23–27 October 2011; pp. 157–164. [Google Scholar]
  35. Kaminskas, M.; Bridge, D. Diversity, serendipity, novelty, and coverage: A survey and empirical analysis of beyond-accuracy objectives in recommender systems. ACM Trans. Interact. Intell. Syst. (TIIS) 2016, 7, 1–42. [Google Scholar] [CrossRef]
  36. Elkhani, N.; Bakri, A. Review on “expectancy disconfirmation theory”(EDT) Model in B2C E-Commerce. J. Inf. Syst. Res. Innov. 2012, 2, 95–102. [Google Scholar]
  37. Liao, C.; Liu, C.-C.; Liu, Y.-P.; To, P.-L.; Lin, H.-N. Applying the expectancy disconfirmation and regret theories to online consumer behavior. CyberpsychologyBehav. Soc. Netw. 2011, 14, 241–246. [Google Scholar] [CrossRef]
  38. Park, D.H.; Kim, H.K.; Choi, I.Y.; Kim, J.K. A literature review and classification of recommender systems research. Expert Syst. Appl. 2012, 39, 10059–10072. [Google Scholar] [CrossRef]
  39. Kim, J.K.; Kim, H.K.; Oh, H.Y.; Ryu, Y.U. A group recommendation system for online communities. Int. J. Inf. Manag. 2010, 30, 212–219. [Google Scholar] [CrossRef]
  40. Guo, Y.; Yin, C.; Li, M.; Ren, X.; Liu, P. Mobile e-commerce recommendation system based on multi-source information fusion for sustainable e-business. Sustainability 2018, 10, 147. [Google Scholar] [CrossRef] [Green Version]
  41. Van Den Oord, A.; Dieleman, S.; Schrauwen, B. Deep content-based music recommendation. In Proceedings of the Neural Information Processing Systems Conference (NIPS 2013), Lake Tahoe, NV, USA, 5–8 December 2013. [Google Scholar]
  42. Quadrana, M.; Karatzoglou, A.; Hidasi, B.; Cremonesi, P. Personalizing session-based recommendations with hierarchical recurrent neural networks. In Proceedings of the Eleventh ACM Conference on Recommender Systems, Como, Italy, 27–31 August 2017; pp. 130–137. [Google Scholar]
  43. Hu, Y.; Da, Q.; Zeng, A.; Yu, Y.; Xu, Y. Reinforcement learning to rank in e-commerce search engine: Formalization, analysis, and application. In Proceedings of the 24th ACM SIGKDD International Conference on Knowledge Discovery & Data Mining, London, UK, 19–23 August 2018; pp. 368–377. [Google Scholar]
  44. Park, K.; Lee, J.; Choi, J. Deep neural networks for news recommendations. In Proceedings of the 2017 ACM on Conference on Information and Knowledge Management, Singapore, 6–10 November 2017; pp. 2255–2258. [Google Scholar]
  45. Goldberg, D.; Nichols, D.; Oki, B.M.; Terry, D. Using collaborative filtering to weave an information tapestry. Commun. ACM 1992, 35, 61–70. [Google Scholar] [CrossRef]
  46. Ekstrand, M.D.; Riedl, J.T.; Konstan, J.A. Collaborative Filtering Recommender Systems; Now Publishers Inc: Delft, The Netherlands, 2011. [Google Scholar]
  47. Zhang, S.; Yao, L.; Sun, A.; Tay, Y. Deep learning based recommender system: A survey and new perspectives. ACM Comput. Surv. (CSUR) 2019, 52, 1–38. [Google Scholar] [CrossRef] [Green Version]
  48. Schmidhuber, J. Deep learning in neural networks: An overview. Neural Netw. 2015, 61, 85–117. [Google Scholar] [CrossRef] [Green Version]
  49. Covington, P.; Adams, J.; Sargin, E. Deep neural networks for youtube recommendations. In Proceedings of the 10th ACM Conference on Recommender Systems, Boston, MA, USA, 15–19 September 2016; pp. 191–198. [Google Scholar]
  50. Cheng, H.-T.; Koc, L.; Harmsen, J.; Shaked, T.; Chandra, T.; Aradhye, H.; Anderson, G.; Corrado, G.; Chai, W.; Ispir, M. Wide & deep learning for recommender systems. In Proceedings of the 1st Workshop on Deep Learning for Recommender Systems, Boston, MA, USA, 15 September 2016; pp. 7–10. [Google Scholar]
  51. Okura, S.; Tagami, Y.; Ono, S.; Tajima, A. Embedding-based news recommendation for millions of users. In Proceedings of the 23rd ACM SIGKDD International Conference on Knowledge Discovery and Data Mining, Halifax, NS, Canada, 13–17 August 2017; pp. 1933–1942. [Google Scholar]
  52. He, X.; Liao, L.; Zhang, H.; Nie, L.; Hu, X.; Chua, T.-S. Neural collaborative filtering. In Proceedings of the 26th International Conference on World Wide Web, Perth, Australia, 3–7 April 2017; pp. 173–182. [Google Scholar]
  53. Bhattacherjee, A. Understanding information systems continuance: An expectation-confirmation model. MIS Q. 2001, 25, 351–370. [Google Scholar] [CrossRef]
  54. Roca, J.C.; Chiu, C.-M.; Martínez, F.J. Understanding e-learning continuance intention: An extension of the Technology Acceptance Model. Int. J. Hum. Comput. Stud. 2006, 64, 683–696. [Google Scholar] [CrossRef] [Green Version]
  55. Oliver, R.L. A cognitive model of the antecedents and consequences of satisfaction decisions. J. Mark. Res. 1980, 17, 460–469. [Google Scholar] [CrossRef]
  56. McKinney, V.; Yoon, K.; Zahedi, F.M. The measurement of web-customer satisfaction: An expectation and disconfirmation approach. Inf. Syst. Res. 2002, 13, 296–315. [Google Scholar] [CrossRef]
  57. Lin, H.-F. The impact of website quality dimensions on customer satisfaction in the B2C e-commerce context. Total Qual. Manag. Bus. Excell. 2007, 18, 363–378. [Google Scholar] [CrossRef]
  58. Nevo, D.; Chan, Y.E. A temporal approach to expectations and desires from knowledge management systems. Decis. Support Syst. 2007, 44, 298–312. [Google Scholar] [CrossRef]
  59. Doong, H.-S.; Lai, H. Exploring usage continuance of e-negotiation systems: Expectation and disconfirmation approach. Group Decis. Negot. 2008, 17, 111–126. [Google Scholar] [CrossRef]
  60. Calvo-Porral, C.; Levy-Mangin, J.P. Switching behavior and customer satisfaction in mobile services: Analyzing virtual and traditional operators. Comput. Hum. Behav. 2015, 49, 532–540. [Google Scholar] [CrossRef]
  61. Shani, G.; Gunawardana, A. Evaluating recommendation systems. In Recommender Systems Handbook; Springer: Boston, MA, USA, 2011; pp. 257–297. [Google Scholar]
  62. Lee, H.I.; Choi, I.Y.; Moon, H.S.; Kim, J.K. A Multi-Period Product Recommender System in Online Food Market based on Recurrent Neural Networks. Sustainability 2020, 12, 969. [Google Scholar] [CrossRef] [Green Version]
  63. Liang, T.P.; Lai, H.J.; Ku, Y.C. Personalized content recommendation and user satisfaction: Theoretical synthesis and empirical findings. J. Manag. Inf. Syst 2006, 23, 45–70. [Google Scholar] [CrossRef] [Green Version]
  64. McGinty, L.; Smyth, B. On the role of diversity in conversational recommender systems. In Proceedings of the International Conference on Case-Based Reasoning, Trondheim, Norway, 23–26 June 2003; pp. 276–290. [Google Scholar]
  65. Ziegler, C.-N.; McNee, S.M.; Konstan, J.A.; Lausen, G. Improving recommendation lists through topic diversification. In Proceedings of the 14th International Conference on World Wide Web, Chiba, Japan, 10–14 May 2005; pp. 22–32. [Google Scholar]
  66. Bradley, K.; Smyth, B. Improving recommendation diversity. In Proceedings of the Twelfth Irish Conference on Artificial Intelligence and Cognitive Science, Maynooth, Ireland, 5–7 September 2001; pp. 141–152. [Google Scholar]
  67. Chen, R.; Hua, Q.; Chang, Y.-S.; Wang, B.; Zhang, L.; Kong, X. A survey of collaborative filtering-based recommender systems: From traditional methods to hybrid methods based on social networks. IEEE Access 2018, 6, 64301–64320. [Google Scholar] [CrossRef]
  68. Cho, Y.H.; Kim, J.K.; Kim, S.H. A personalized recommender system based on web usage mining and decision tree induction. Expert Syst. Appl. 2002, 23, 329–342. [Google Scholar] [CrossRef]
  69. Panniello, U.; Tuzhilin, A.; Gorgoglione, M. Comparing context-aware recommender systems in terms of accuracy and diversity. User Modeling User Adapt. Interact. 2014, 24, 35–65. [Google Scholar] [CrossRef]
  70. Castells, P.; Hurley, N.J.; Vargas, S. Novelty and Diversity in Recommender Systems. In Recommender Systems Handbook; Ricci, F., Rokach, L., Shapira, B., Eds.; Springer: Boston, MA, USA, 2015; pp. 881–918. [Google Scholar] [CrossRef]
  71. Susan, M.M.; David, S. What makes a helpful online review? A study of customer reviews on amazon.com. MIS Q. 2010, 34, 185–200. [Google Scholar]
  72. Pujahari, A.; Sisodia, D.S. Pair-wise preference relation based probabilistic matrix factorization for collaborative filtering in recommender system. Knowl. Based Syst. 2020, 196, 105798. [Google Scholar] [CrossRef]
  73. Sarwar, B.; Karypis, G.; Konstan, J.; Riedl, J. Item-based collaborative filtering recommendation algorithms. In Proceedings of the 10th International Conference on World Wide Web, Hong Kong, China, 1–5 May 2001; pp. 285–295. [Google Scholar]
  74. Vozalis, M.G.; Margaritis, K.G. Using SVD and demographic data for the enhancement of generalized collaborative filtering. Inf. Sci. 2007, 177, 3017–3037. [Google Scholar] [CrossRef]
  75. Paterek, A. Improving regularized singular value decomposition for collaborative filtering. In Proceedings of the KDD Cup and Workshop, San Jose, CA, USA, 12 August 2007; pp. 5–8. [Google Scholar]
  76. Batmaz, Z.; Yurekli, A.; Bilge, A.; Kaleli, C. A review on deep learning for recommender systems: Challenges and remedies. Artif. Intell. Rev. 2019, 52, 1–37. [Google Scholar] [CrossRef]
  77. Chen, W.; Cai, F.; Chen, H.; Rijke, M.D. Joint neural collaborative filtering for recommender systems. ACM Trans. Inf. Syst. (TOIS) 2019, 37, 1–30. [Google Scholar] [CrossRef] [Green Version]
Figure 1. Research Framework.
Sustainability 13 06165 g001
Figure 2. Performance of MAE on the number of factors for the MovieLens dataset.
Sustainability 13 06165 g002
Figure 3. Evaluation of Top-K item recommendation where K ranges from 5 to 100 on the ItemKNN algorithm for the MovieLens dataset.
Sustainability 13 06165 g003
Figure 4. Evaluation of Top-K item recommendation where K ranges from 5 to 100 on the SVD algorithm for the MovieLens dataset.
Sustainability 13 06165 g004
Figure 5. Evaluation of Top-K item recommendation where K ranges from 5 to 100 on the NCF algorithm for the MovieLens dataset.
Sustainability 13 06165 g005
Figure 6. Performance of MAE on the number of factors for the Amazon dataset.
Sustainability 13 06165 g006
Figure 7. Evaluation of Top-K item recommendation where K ranges from 5 to 100 on the ItemKNN algorithm for the Amazon dataset.
Sustainability 13 06165 g007
Figure 8. Evaluation of Top-K item recommendation where K ranges from 5 to 100 on the SVD algorithm for the Amazon dataset.
Sustainability 13 06165 g008
Figure 9. Evaluation of Top-K item recommendation where K ranges from 5 to 100 on the NCF algorithm for the Amazon dataset.
Sustainability 13 06165 g009
Table 1. Descriptive statistics of the two datasets.
DatasetUserItemRatingSparsity
MovieLens604037061,000,20995.53%
Amazon1,210,271249,2742,023,07099.99%
Table 2. Description of the statistical results for the MovieLens datasets.
MethodsVariablesMeanStd. Deviation
ItemKNNAccuracy
Diversity
Customer satisfaction
0.51461
1.05600
0.4820
0.39460
0.47720
0.1831
SVDAccuracy
Diversity
Customer satisfaction
0.52531
1.15400
0.5848
0.37280
0.42300
0.1497
NCFAccuracy
Diversity
Customer satisfaction
0.69271
1.16280
0.6204
0.28320
0.40580
0.2964
Table 3. Summary of MRA and hypothesis testing results.
Methods β SEtpResult
ItemKNNH10.6620.2328.930**Supported
H2−0.0010.009−0.069 Rejected
SVDH10.0670.00610.3967**Supported
H2−0.0270.005−5.389**Rejected
NCFH11.0230.02343.672**Supported
H20.0250.0102.579*Supported
R I t e m K N N 2 = 0.143, R S V D 2 = 0.019, R N C F 2 = 0.257
* p < 0.05, ** p < 0.001.
Table 4. One-way ANOVA analysis results for the several types of recommender system algorithms on MovieLens datasets.
Subscale and SourceSSdfMSF
Accuracy of recommendation
Between groups5.78221.4712.002 *
Within groups75.82416,6140.063
Diversity of recommendation
Between groups5.67122.33613.873 **
Within groups125.10416,6140.168
Customer Satisfaction
Between groups13.32224.4414.428 *
Within groups352.27716,6140.960
* p < 0.05, ** p < 0.001.
Table 5. Description of the statistical results for the Amazon dataset.
MethodsVariablesMeanStd. Deviation
ItemKNNAccuracy
Diversity
Customer satisfaction
0.77970
0.68260
0.6748
0.24720
0.31180
0.2652
SVDAccuracy
Diversity
Customer satisfaction
0.67970
0.68780
0.6550
0.37280
0.30170
0.2464
NCFAccuracy
Diversity
Customer satisfaction
0.73180
0.71620
0.6911
0.28320
0.31830
0.2544
Table 6. Summary of MRA and hypothesis testing results.
Methods β SEtpResult
ItemKNNH10.7310.01938.585**Supported
H20.0230.0161.427 Rejected
SVDH10.7530.02530.215**Supported
H20.0010.0180.055 Rejected
NCFH10.3920.02139.789*Supported
H20.6640.0542.144*Supported
R I t e m K N N 2 = 0.359, R S V D 2 = 0.292, R N C F 2 = 0.167
* p < 0.05, ** p < 0.001.
Table 7. One-way ANOVA analysis results for the several types of recommender system algorithms on Amazon datasets.
Subscale and SourceSSdfMSF
Accuracy of recommendation
Between groups0.01020.0050.170 **
Within groups225.26280250.028
Diversity of recommendation
Between groups4.88921.1541.265 *
Within groups156.01280250.998
Customer Satisfaction
Between groups22.75820.0056.170 **
Within groups108.76580250.028
* p < 0.05, ** p < 0.001.
Publisher’s Note: MDPI stays neutral with regard to jurisdictional claims in published maps and institutional affiliations.

