
Value-Based Building Maintenance Practices for Public Hospitals in Malaysia


Abstract
:1. Introduction
2. Literature Review
2.1. User Involvement
2.2. Value-Adding Practices
2.3. Value Co-Creation
2.4. Value Outcomes
3. Methods
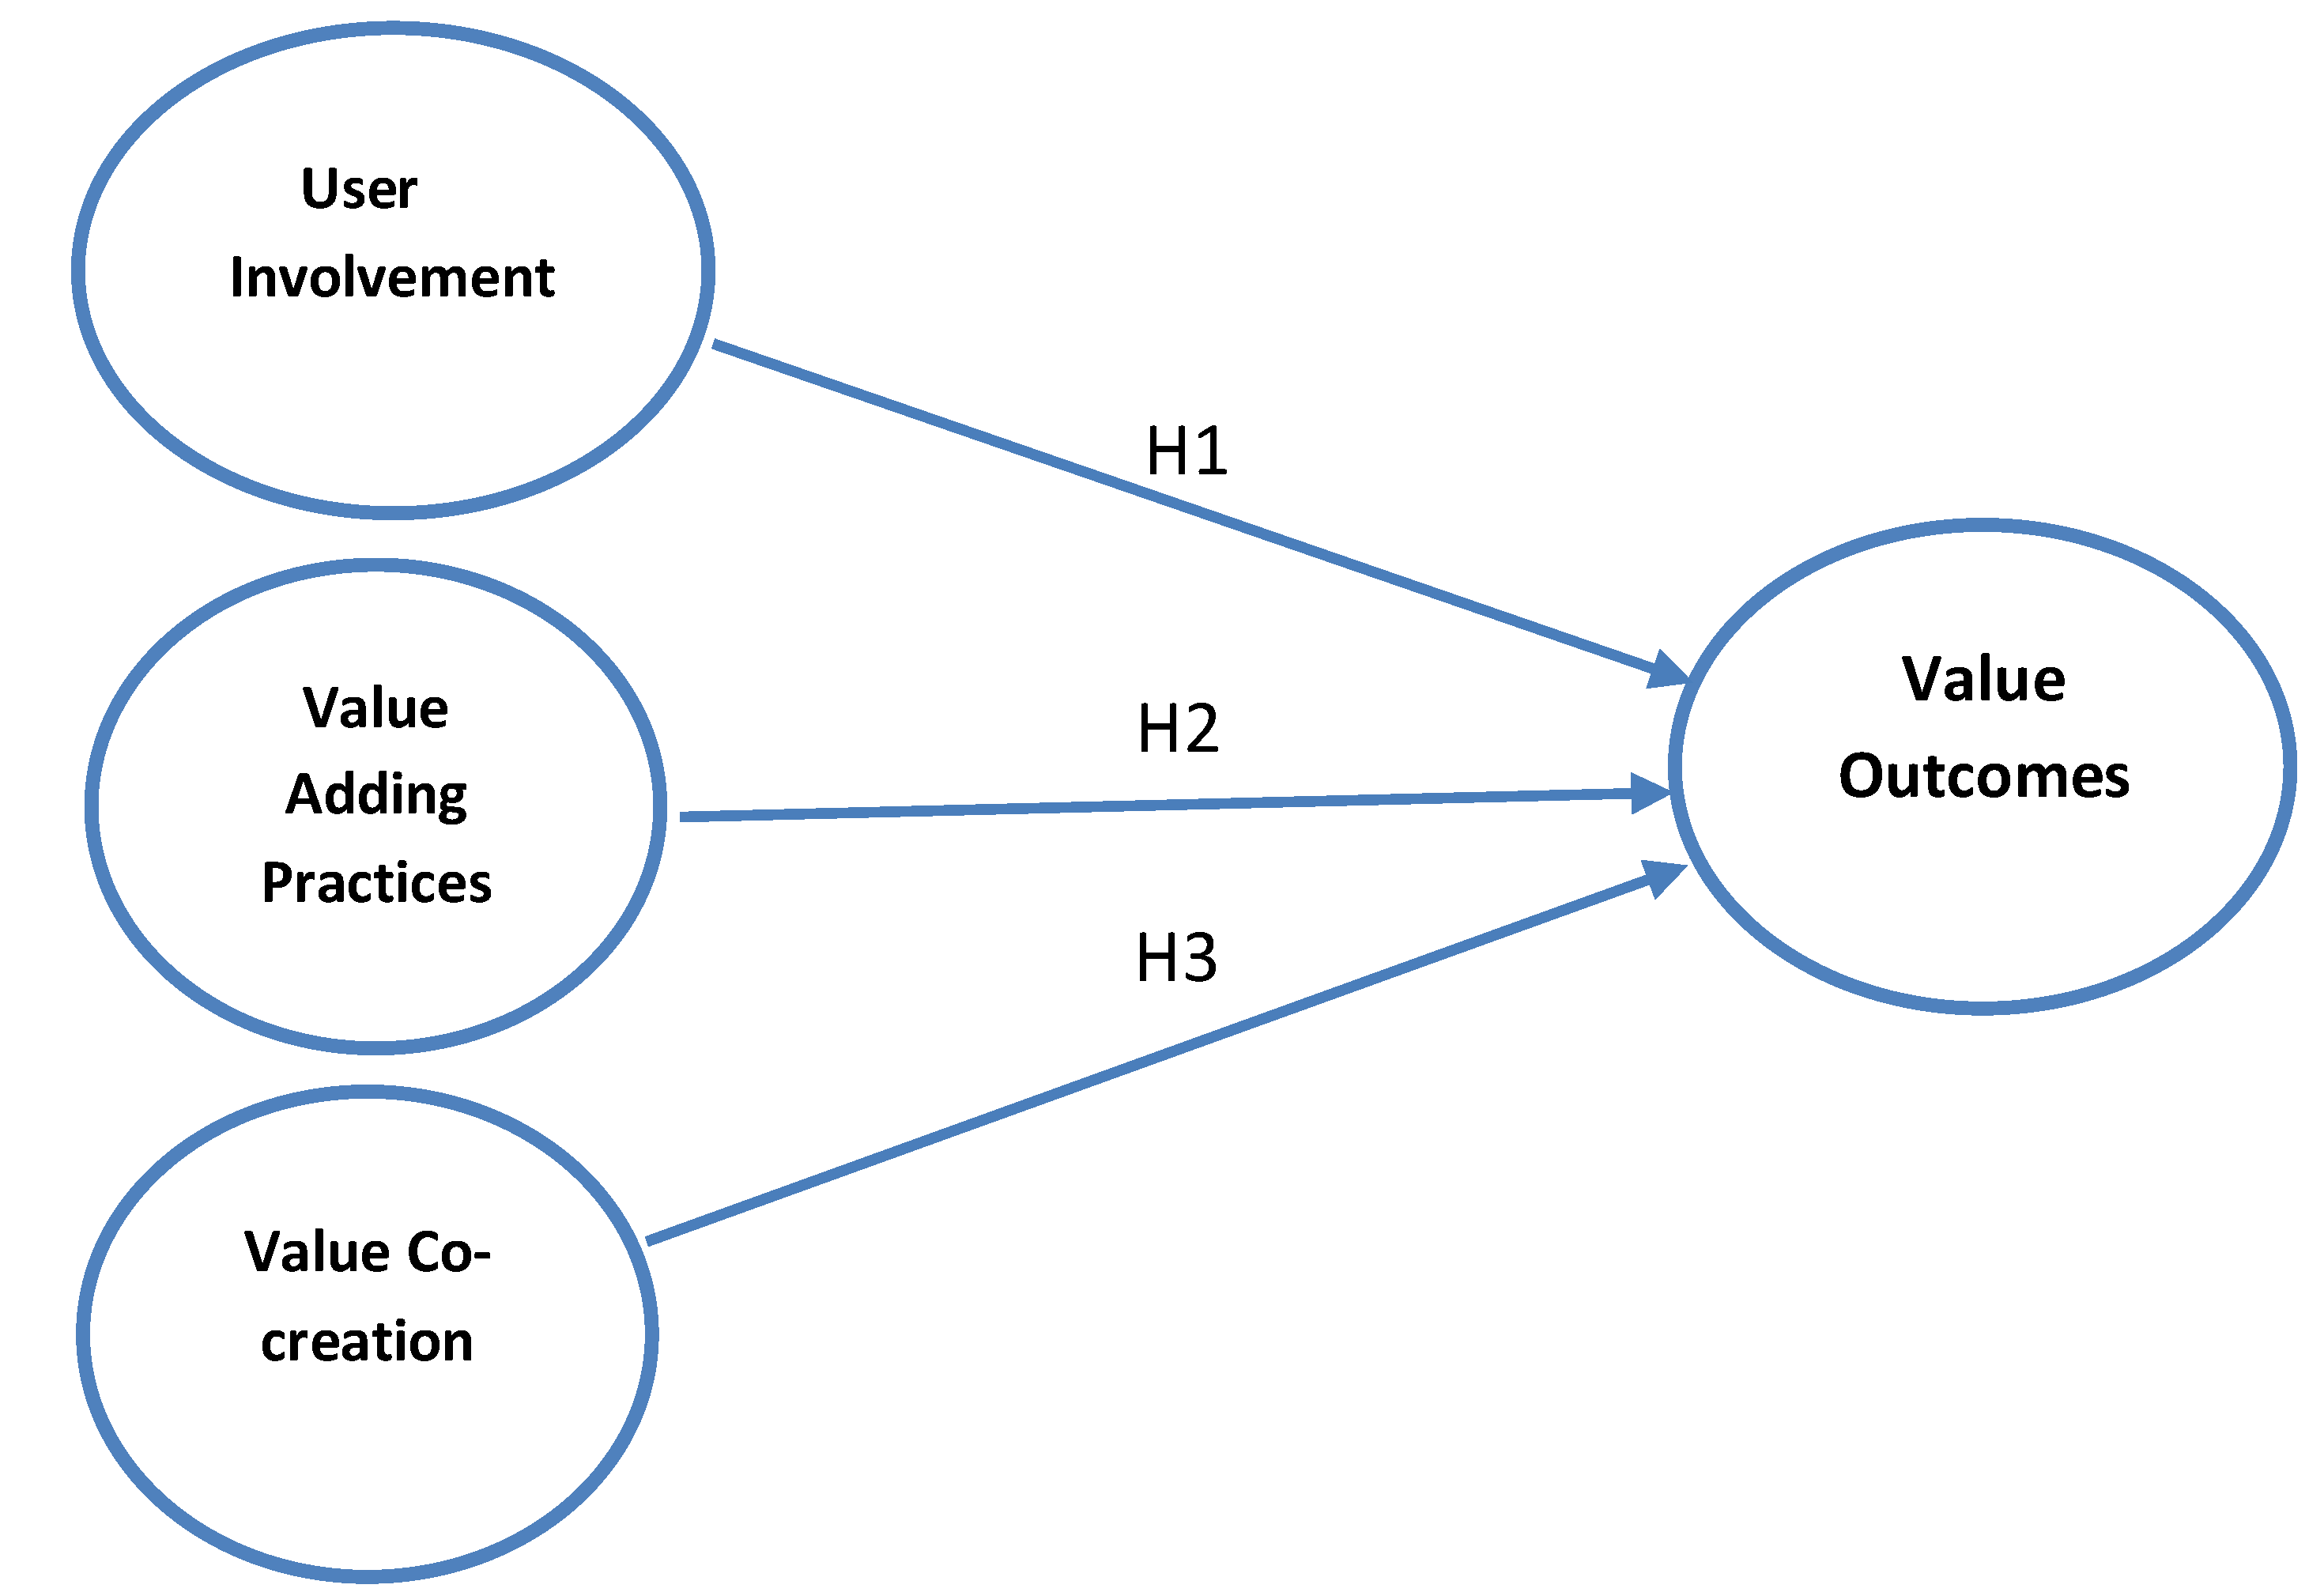
Proposed Model
4. Results and Discussions
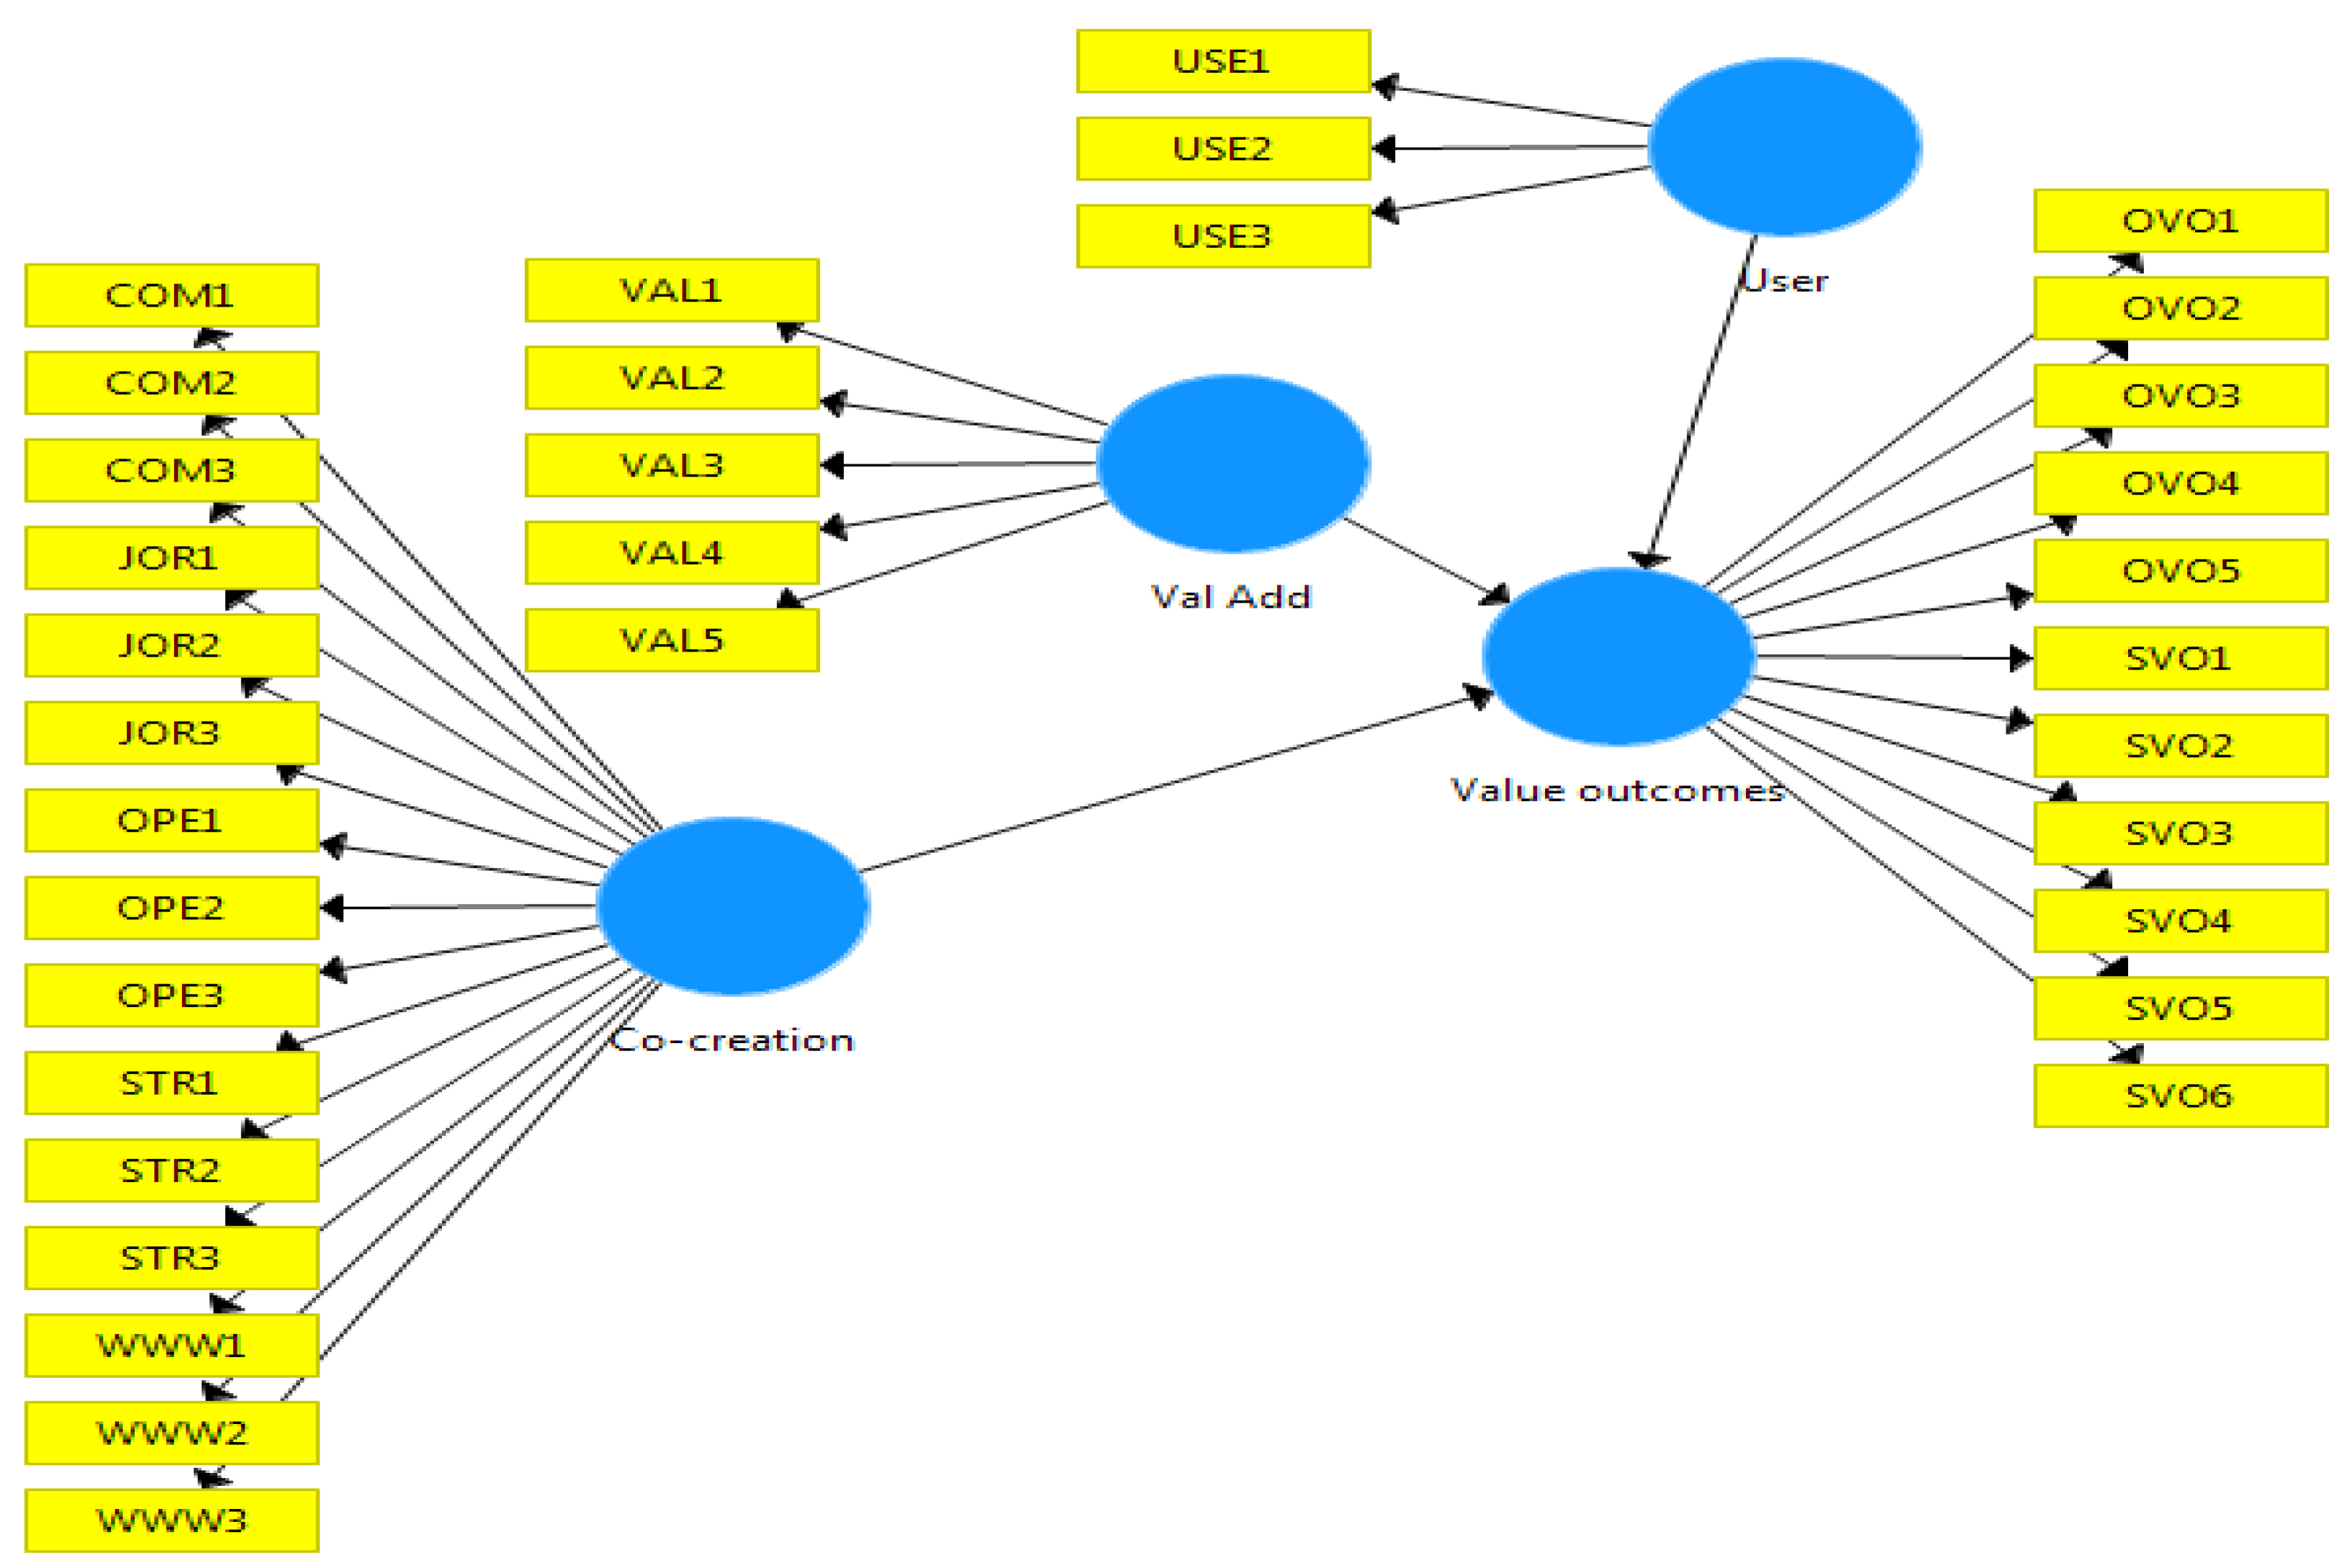
4.1. Reflective Measurement Model
4.2. Validation of the Structural Model
4.3. Hypothesis Testing
- Value-adding practices positively influence value outcomes.
- Value co-creation positively influences value outcomes.
5. Conclusions
5.1. Theoretical Implications
5.2. Practical Implications
5.3. Limitations and Future Research
Author Contributions
Funding
Institutional Review Board Statement
Informed Consent Statement
Data Availability Statement
Conflicts of Interest
References
- World Health Organisation. 2020. Available online: https://www.who.int/health-topics/hospitals#tab=tab_2 (accessed on 7 April 2020).
- Lavy, S.; Shohet, I.M. Integrated maintenance management of hospital buildings: A case study. Constr. Manag. Econ. 2004, 22, 25–34. [Google Scholar] [CrossRef]
- Adenuga, O.; Ibiyemi, A. An Assessment of the State of Maintenance of Public Hospital Buildings in Southwest Nigeria. Constr. Econ. Build. 2009, 9, 51–60. [Google Scholar] [CrossRef] [Green Version]
- Olanrewaju, A.L.; Wong, W.F.; Yahya, N.N.-H.N.; Im, L.P. Proposed research methodology for establishing the critical success factors for maintenance management of hospital buildings. Int. Symp. Green Sustain. Technol. 2019, 2157, 020036. [Google Scholar] [CrossRef]
- Codinhoto, R.; Tzortzopoulos, P.; Kagioglou, M.; Aouad, G.; Cooper, R. The impacts of the built environment on health outcomes. Facilities 2009, 27, 138–151. [Google Scholar] [CrossRef]
- Loo, V.G.; Bertrand, C.; Dixon, C.; Vityé, D.; DeSalis, B.; McLean, A.P.H.; Brox, A.; Robson, H.G. Control of Construction-Associated Nosocomial Aspergillosis in an Antiquated Hematology Unit. Infect. Control. Hosp. Epidemiology 1996, 17, 360–364. [Google Scholar] [CrossRef]
- Abisuga, A.O.; Famakin, I.O.; Oshodi, O.S. Educational building conditions and the health of users. Constr. Econ. Build. 2016, 16, 19–34. [Google Scholar] [CrossRef] [Green Version]
- Enshassi, A.; Farida, E.S.; Suhair, A. Assessment of Operational Maintenance in Public Hospitals Buildings in the Gaza Strip. Int. J. Sustain. Constr. Eng. Technol. 2015, 6, 2180–3242. [Google Scholar]
- Galán, M.H.; Edith, M.D. Management Audit Applied to the Maintenance Department in Hospital Facilities. Ing. Mec. 2017, 20, 152–159. [Google Scholar]
- Salleh, N.M.; Salim, N.A.A.; Jaafar, M.; Sulieman, M.Z.; Ebekozien, A. Fire safety management of public buildings: A systematic review of hospital buildings in Asia. Prop. Manag. 2020, 38, 497–511. [Google Scholar] [CrossRef]
- Shastri, B.A.; Raghav, Y.S.; Sahadev, R.; Yadav, B.P. Analysis of Fire Protection Facilities in Hospital Buildings. In Advances in Fire and Process. Safety; Siddiqui, N.A., Tauseef, S.M., Abbasi, S.A., Rangwala, A.S., Eds.; Springer Nature: Singapore, 2018; pp. 183–190. [Google Scholar] [CrossRef]
- Malaysia Productivity Corporation. Reducing Unnecessary Regulatory Burdens on Business: Private Hospitals. 2014. Available online: http://www.mpc.gov.my/reducing-unnecessary-regulatory-burdens-rurb-2/ (accessed on 2 January 2021).
- Ministry of Health Malaysia. Healthcare Facilities (Government). 2019. Available online: http://www.moh.gov.my/ (accessed on 22 February 2020).
- Fan, H.P. Privatization of Facility Management in Public Hospitals: A Malaysian Perspective; Patridge Publishing: Singapore, 2016. [Google Scholar]
- Baba, M.; Abdul, H.M. A Conceptual Contract Framework for Research to Develop a Contract Framework for Outsourcing of Facilities Management in Malaysian Hospitals; IRERS: Kuala Lumpur, Malaysia, 2008. [Google Scholar]
- Ali, M.; Mohamad, W.M.N.B.W. Audit assessment of the facilities maintenance management in a public hospital in Malaysia. J. Facil. Manag. 2009, 7, 142–158. [Google Scholar] [CrossRef]
- National Audit Department Malaysia. Auditor General’s Report 2015 Series 2; National Audit Department Malaysia: Putrajaya, Malaysia, 2016.
- Mustapa, F.D.; Muzani, M.; Fuziah, I.; Kherun, N.I. Outsourcing in Malaysian Healthcare Support Services: A Study on the Causes of Increased Operational Costs. In Proceedings of the International Conference on Construction Industry, Sumatra Barat, Indonesia, 21–24 June 2006. [Google Scholar]
- Ministry of Health Malaysia. Malaysia National Health Accounts; Health Expenditure Report 1997–2017; Planning Division, MOH: Putrajaya, Malaysia, 2019.
- Yousefli, Z.; Nasiri, F.; Moselhi, O. Healthcare facilities maintenance management: A literature review. J. Facil. Manag. 2017, 15, 352–375. [Google Scholar] [CrossRef]
- Lavy, S.; Shohet, I.M. On the effect of service life conditions on the maintenance costs of healthcare facilities. Constr. Manag. Econ. 2007, 25, 1087–1098. [Google Scholar] [CrossRef]
- Al-Zubaidi, H. Assessing the Demand for Building Maintenance in a Major Hospital Complex. Prop. Manag. 1997, 15, 173–183. [Google Scholar] [CrossRef]
- Vanzanella, C.; Fico, G.; Arredondo, M.T.; Delfino, R.; Viggiani, V.; Triassi, M.; Pecchia, L. Interactive management control via analytic hierarchy process: An empirical study in a public university hospital. J. Int. Bus. Entrep. Dev. 2015, 8, 144. [Google Scholar] [CrossRef] [Green Version]
- Mustapha, Z.; Justice, A. Building Maintenance Systems of Public Health Institutions in Ghana: A Case Study of La General Hospital. J. Constr. Proj. Manag. Innov. 2011, 1, 155–166. [Google Scholar]
- Amankwah, O.; Choong, W.-W.; Mohammed, A.H. Modelling the influence of healthcare facilities management service quality on patients satisfaction. J. Facil. Manag. 2019, 17, 267–283. [Google Scholar] [CrossRef]
- Pheng, L.S.; Rui, Z. Service Quality for Facilities Management in Hospitals; Springer: Singapore, 2016. [Google Scholar] [CrossRef]
- Jandali, D.; Sweis, R. Factors affecting maintenance management in hospital buildings. Int. J. Build. Pathol. Adapt. 2019, 37, 6–21. [Google Scholar] [CrossRef]
- Yousefli, Z.; Nasiri, F.; Moselhi, O. Maintenance workflow management in hospitals: An automated multi-agent facility management system. J. Build. Eng. 2020, 32, 101431. [Google Scholar] [CrossRef]
- Okoroh, M.; Gombera, P.; John, E.; Wagstaff, M. Adding value to the healthcare sector—A facilities management partnering arrangement case study. Facilities 2001, 19, 157–164. [Google Scholar] [CrossRef]
- Manaf, N.H.A. Quality management in Malaysian public health care. Int. J. Heal. Care Qual. Assur. 2005, 18, 204–216. [Google Scholar] [CrossRef]
- Ghani, A.; Zaid, M.; Abd, Z.; Ibrahim, I.; Musa, Z. Defining the Critical Success Factor in FM Malaysian Healthcare Sector. In Proceedings of the 3rd International Building Control Conference, Kuala Lumpur, Malaysia, 21 November 2013. [Google Scholar]
- Ahmad, P.; Nur, A.; Mat, N.A.; Mohd, A.; Janice, L.Y.M.; Mohd, N.J.; Abdul, H.M. Critical Success Factors for Facilities Management Implement in the Healthcare Industry. Int. J. Real Estate Stud. 2017, 11, 69–83. [Google Scholar]
- Rani, N.A.A.; Baharum, M.R.; Akbar, A.R.N.; Nawawi, A.H. Perception of Maintenance Management Strategy on Healthcare Facilities. Procedia Soc. Behav. Sci. 2015, 170, 272–281. [Google Scholar] [CrossRef] [Green Version]
- Omar, M.F.; Ibrahim, F.A.; Omar, W.M.S.W. Key Performance Indicators for Maintenance Management Effectiveness of Public Hospital Building. MATEC Web Conf. 2017, 97, 01056. [Google Scholar] [CrossRef] [Green Version]
- Abdullah, M.S.I.; Noor, M.A.R.; Tauran, Z.A.Z.; Khairul, A.K. Latest Development on Sustainability Programme Initiatives in Malaysian Healthcare Facility Management. In Proceedings of the 37th Conference of the ASEAN Federation of Engineering Organisations, Jakarta, Indonesia, 11–15 September 2019. [Google Scholar]
- Kamaluddin, K.A.; Muhammad, S.I.A.; Yang, S.S. Development of Energy Benchmarking of Malaysian Government Hospitals and Analysis of Energy Savings Opportunities. J. Build. Perform. 2016, 7, 72–87. [Google Scholar]
- Sahamir, S.R.; Rozana, Z. Green Assessment Criteria for Public Hospital Building Development in Malaysia. Procedia Environ. Sci. 2014, 20, 106–115. [Google Scholar] [CrossRef] [Green Version]
- Olanrewaju, A.L.; Abdul-Aziz, A.-R. Building Maintenance Processes and Practices: The Case of a Fast Developing Country; Springer: Singapore, 2015. [Google Scholar] [CrossRef]
- Awang, N.A.; Chua, S.J.L.; Ali, A.S. Building Condition Assessment Focusing on Persons with Disabilities’ Facilities at Hospital Buildings. J. Des. Built Environ. 2017, 17, 73–84. [Google Scholar] [CrossRef]
- Ab Ghani, M.Z.; Srazali, A. Comparative Review of Design Requirements for Natural Smoke Ventilation in Hospital Buildings. J. Malays. Inst. Plan. 2018, 16, 334–344. [Google Scholar] [CrossRef]
- National Audit Department Malaysia. Auditor General’s Report 2015 Series 1; National Audit Department Malaysia: Putrajaya, Malaysia, 2016.
- Carvalho, M.; Hemananthani, S.; Rahimy, R.; Loshana, K.S. Auditor-General’ s Report 2017: Alor Gajah Hospital Comes under Scrutiny. The Star Online. 6 August 2018. Available online: https://www.thestar.com.my/news/nation/2018/08/06/ag-report-2017-alor-gajah-hospital-comes-under-scrutiny (accessed on 11 October 2019).
- Olanrewaju, A.; Fang, W.W.; Tan, S.Y. Hospital Building Maintenance Management Model. Int. J. Eng. Technol. 2018, 7, 747–753. [Google Scholar] [CrossRef]
- Prahalad, C.K.; Ramaswamy, V. Co-creating unique value with customers. Strat. Leadersh. 2004, 32, 4–9. [Google Scholar] [CrossRef]
- Jensen, P.A.; Maslesa, E. Value based building renovation—A tool for decision-making and evaluation. Build. Environ. 2015, 92, 1–9. [Google Scholar] [CrossRef] [Green Version]
- Abdul-Lateef, O.A. Quantitative Analysis of Criteria in University Building Maintenance in Malaysia. Constr. Econ. Build. 2010, 10, 51–61. [Google Scholar] [CrossRef] [Green Version]
- Olanrewaju, A.L.; Mohd, F.K.; Arazi, I. Validation of Building Maintenance Performance Model for Malaysian Universities. Int. J. Hum. Soc. Sci. 2011, 6, 159–163. [Google Scholar]
- Zulkarnain, S.H.; Emma, M.A.Z.; Rahman, M.Y.A.; Nur, K.F.M. A Review of Critical Success Factor in Building Maintenance Management Practice for University Sector. Int. J. Civ. Environ. Struct. Constr. Archit. Eng. 2011, 55, 215–219. [Google Scholar] [CrossRef]
- Tucker, M.; Smith, A. User perceptions in workplace productivity and strategic FM delivery. Facilities 2008, 26, 196–212. [Google Scholar] [CrossRef] [Green Version]
- Ali-Marttila, M.; Marttonen-Arola, S.; Kärri, T.; Pekkarinen, O.; Saunila, M. Understand what your maintenance service partners value. J. Qual. Maint. Eng. 2017, 23, 144–164. [Google Scholar] [CrossRef]
- Grönroos, C.; Voima, P. Critical service logic: making sense of value creation and co-creation. J. Acad. Mark. Sci. 2013, 41, 133–150. [Google Scholar] [CrossRef]
- Coenen, C.; Alexander, K.; Kok, H. Facility management value dimensions from a demand perspective. J. Facil. Manag. 2013, 11, 339–353. [Google Scholar] [CrossRef]
- Bititci, U.S.; Martinez, V.; Albores, P.; Parung, J. Creating and managing value in collaborative networks. Int. J. Phys. Distrib. Logist. Manag. 2004, 34, 251–268. [Google Scholar] [CrossRef] [Green Version]
- Martinez, V.; Bititci, U.S. Aligning value propositions in supply chains. Int. J. Value Chain Manag. 2006, 1, 6–18. [Google Scholar] [CrossRef] [Green Version]
- Joshi, K.P.; Murthy, C. Determining Value Co-Creation Opportunity in B2B Services. In Proceedings of the 2011 Annual SRII Global Conference (SRII 2011), San Jose, CA, USA, 29 March–2 April 2011; pp. 674–684. [Google Scholar] [CrossRef]
- Sun, S.Y.; Li, S.C. Achieving Value Co-Creation in IT Outsourcing. J. Int. Technol. Inf. Manag. 2016, 25, 1–18. [Google Scholar]
- Vargo, S.L.; Maglio, P.P.; Akaka, M.A. On value and value co-creation: A service systems and service logic perspective. Eur. Manag. J. 2008, 26, 145–152. [Google Scholar] [CrossRef]
- Dibley, A.; Moira, C. How to Implement. Best Practice in Strategic Partnerships: An. Outsource Supplier and Client Perspective; The Henley Centre for Customer Management: London, UK, 2011. [Google Scholar]
- Jensen, P.A. The Facilities Management Value Map: a conceptual framework. Facilities 2010, 28, 175–188. [Google Scholar] [CrossRef]
- Dibley, A.; Clark, M. Value Co-Creation in Strategic Partnerships: An Outsourcing Perspective. In Service-Dominant Logic., Network & Systems Theory and Service Science: Integrating Three Perspectives for a New Service Agenda; Polese, F., Ed.; Henle Business School: Napoli, UK, 2005. [Google Scholar]
- Gummerus, J. Value creation processes and value outcomes in marketing theory. Mark. Theory 2013, 13, 19–46. [Google Scholar] [CrossRef]
- Christian, M.R.; Wende, S.; Becker, J.M. SmartPLS 3; SmartPLS GmbH: Bönningstedt, Germany, 2015. [Google Scholar]
- Ramayah, T.; Jacky, C.; Francis, C.; Hiram, T.; Mumtaz, A.M. Partial Least Squares Structural Equation Modeling (PLS-SEM) Using SmartPLS 3.0., 2nd ed.; Pearson Malaysia Sdn. Bhd.: Kuala Lumpur, Malaysia, 2018. [Google Scholar]
- Hair, J.F.G.; Tomas, M.H.; Christian, R.; Marko, S. A Primer on Partial Least Squares, 2nd ed.; SAGE Publications, Inc.: Los Angeles, CA, USA, 2017. [Google Scholar]
- Chomeya, R. Quality of Psychology Test between Likert Scale 5 and 6 Points. J. Soc. Sci. 2010, 6, 399–403. [Google Scholar]
- Willis, G.B. Questionnaire Pretesting. In The SAGE Handbook of Survey Methodology; Christof, W., Dominique, J., Tom, W., Yang, C.F., Eds.; SAGE Publishing Ltd.: London, UK, 2016; pp. 359–381. [Google Scholar]
- Collins, D. Pretesting Survey Instruments: An Overview of Cognitive Methods. Quality 2009, 12, 229–238. [Google Scholar] [CrossRef]
- National Audit Department Malaysia. Auditor General’s Report 2014 Series 3; National Audit Department Malaysia: Putrajaya, Malaysia, 2015.
- Mooi, E.; Marko, S. Concise Guide to Market. Research: The Process, Data and Methods Using IBM SPSS Statistics; Springer: Berlin/Heidelberg, Germany, 2011. [Google Scholar]
- Barclay, D.W.; Christopher, A.H.; Ronald, T. The Partial Least Squares Approach to Causal Modeling: Personal Computer Adoption and Use as Illustration. Technol. Stud. 1995, 2, 285–309. [Google Scholar]
- Hair, J.F.; Risher, J.J.; Sarstedt, M.; Ringle, C.M. When to use and how to report the results of PLS-SEM. Eur. Bus. Rev. 2019, 31, 2–24. [Google Scholar] [CrossRef]
- Hair, J.F.; William, C.B.; Barry, J.B.; Rolph, E.A.; Tatham, R. Multivariate Data Analysis, 7th ed.; Pearson Prentice Hall: Hoboken, NJ, USA, 2010. [Google Scholar]
- Aliman, K.H. Audit Finds Malaysian Hospitals Understaffed, Underfunded and Overcrowded. The Edge Markets. 15 July 2019. Available online: https://www.theedgemarkets.com/article/audit-finds-malaysian-hospitals-understaffed-underfunded-and-overcrowded# (accessed on 11 October 2019).


| Factor | Code | Sub-Factor | Literature Source |
|---|---|---|---|
| User Involvement | USE1 | User’s Expectation | [38,45,52,59] |
| USE2 | User’s Involvement | [26,38,45,59] | |
| USE3 | User’s Satisfaction | [38,48] | |
| Value Adding Practices | VAL1 | Integrated Service Solutions | [50] |
| VAL2 | Innovative Improved Practices | [29] | |
| VAL3 | Value for Money | [29] | |
| VAL4 | Cost Reduction/Saving | [29] | |
| VAL5 | Responsive to Needs | [38,60] | |
| Value Co-creation | JOR1 | Sharing of Resources | [52,53,57] |
| JOR2 | Joint Technology | [57] | |
| JOR3 | Sharing of Information | [57] | |
| OPE1 | Operational Integration | [53] | |
| OPE2 | Intensive Cooperation | [52] | |
| OPE3 | Knowledge Transfer | [55,58] | |
| COM1 | Effective Communication | [52] | |
| COM2 | Transparency of Internal Information | [53,55] | |
| COM3 | Openness and Honesty | [60] | |
| WWW1 | Shared Risks | [53,55] | |
| WWW2 | Mutual Trust and Confidence | [60] | |
| WWW3 | Relationship Synergies | [50] | |
| STR1 | Strategic Integration | [53] | |
| STR2 | Strategic Alignment | [55] | |
| STR3 | Strong Governance | [60] |
| Category | Code | Value Outcomes | Literature source |
|---|---|---|---|
| Operational | OVO1 | Daily Work Process | [55] |
| OVO2 | Quality of Output | [53] | |
| OVO3 | Response Time | [53,55] | |
| OVO4 | Reduced Risk | [53] | |
| OVO5 | Health and Safety | [50] | |
| Strategic | SVO1 | Skill and Knowledge | [53] |
| SVO2 | Technology | [53] | |
| SVO3 | Contractor as Partner | [55] | |
| SVO4 | Performance | [47] | |
| SVO5 | User Satisfaction | [29,46,53,59] | |
| SVO6 | Corporate Image | [29] |
| Frequency (N = 66) | % | |
|---|---|---|
| Position | ||
| (i) Engineer | 27 | 40.9 |
| (ii) Assistant engineer | 39 | 59.1 |
| Total: | 66 | 100 |
| Education (Level) | ||
| (i) Diploma | 32 | 48.5 |
| (ii) Bachelor degree | 31 | 47.0 |
| (iii) Master degree | 3 | 4.5 |
| (iv) Others | 0 | 0 |
| Total: | 66 | 100 |
| Academic qualification | ||
| (i) Mechanical engineering | 10 | 15.2 |
| (ii) Electrical engineering | 9 | 13.6 |
| (iii) Civil engineering | 42 | 63.6 |
| (iv) Construction management | 1 | 1.5 |
| (v) Biomedical | 1 | 1.5 |
| (vi) Others | 3 | 4.6 |
| Total: | 66 | 100 |
| Years of Experience | ||
| Mean: | 5.19 | |
| Standard deviation: | 2.593 | |
| Range: | 1–14 |
| Construct | Items | Loadings | AVE | CR |
|---|---|---|---|---|
| User | USE1 | 0.685 | 0.509 | 0.756 |
| USE2 | 0.682 | |||
| USE3 | 0.769 | |||
| Val Add | VAL1 | 0.757 | 0.595 | 0.880 |
| VAL2 | 0.857 | |||
| VAL3 | 0.771 | |||
| VAL4 | 0.792 | |||
| VAL5 | 0.668 | |||
| Value Co-creation | COM1 | 0.597 | 0.502 | 0.909 |
| COM3 | 0.816 | |||
| JOR3 | 0.741 | |||
| OPE2 | 0.710 | |||
| OPE3 | 0.621 | |||
| STR1 | 0.738 | |||
| STR2 | 0.702 | |||
| STR3 | 0.585 | |||
| WWW2 | 0.678 | |||
| WWW3 | 0.850 | |||
| Value Outcomes | OVO1 | 0.633 | 0.563 | 0.927 |
| OVO2 | 0.815 | |||
| OVO3 | 0.658 | |||
| OVO5 | 0.715 | |||
| SVO1 | 0.728 | |||
| SVO2 | 0.552 | |||
| SVO3 | 0.776 | |||
| SVO4 | 0.861 | |||
| SVO5 | 0.855 | |||
| SVO6 | 0.842 |
| Co-Creation | User | Val Add | Value Outcomes | |
|---|---|---|---|---|
| Co-creation | 0.709 | |||
| User | 0.272 | 0.713 | ||
| Val Add | 0.583 | 0.387 | 0.771 | |
| Value Outcomes | 0.538 | 0.299 | 0.607 | 0.75 |
| Co-Creation | User | Val Add | |
|---|---|---|---|
| Co-creation | |||
| User | 0.423 | ||
| Val Add | 0.654 | 0.562 | |
| Value Outcomes | 0.54 | 0.393 | 0.668 |
| Construct | Value Outcomes (VIF) |
|---|---|
| Value Outcomes | |
| Co-creation | 1.52 |
| User | 1.181 |
| Val Add | 1.655 |
| H | Relationship | Std Beta | Std Error | t-Value | p Value | Decision | f2 |
|---|---|---|---|---|---|---|---|
| H1 | User → Value Outcomes | 0.061 | 0.112 | 0.569 | 0.285 | not supported | 0.005 |
| H2 | Val Add → Value Outcomes | 0.423 | 0.117 | 3.476 | 0.000 | supported | 0.187 |
| H3 | Co-creation → Value Outcomes | 0.275 | 0.132 | 2.214 | 0.014 | supported | 0.086 |
Publisher’s Note: MDPI stays neutral with regard to jurisdictional claims in published maps and institutional affiliations. |
© 2021 by the authors. Licensee MDPI, Basel, Switzerland. This article is an open access article distributed under the terms and conditions of the Creative Commons Attribution (CC BY) license (https://creativecommons.org/licenses/by/4.0/).
Share and Cite
Wong, W.F.; Olanrewaju, A.; Lim, P.I. Value-Based Building Maintenance Practices for Public Hospitals in Malaysia. Sustainability 2021, 13, 6200. https://doi.org/10.3390/su13116200
Wong WF, Olanrewaju A, Lim PI. Value-Based Building Maintenance Practices for Public Hospitals in Malaysia. Sustainability. 2021; 13(11):6200. https://doi.org/10.3390/su13116200
Chicago/Turabian StyleWong, Wai Fang, AbdulLateef Olanrewaju, and Poh Im Lim. 2021. "Value-Based Building Maintenance Practices for Public Hospitals in Malaysia" Sustainability 13, no. 11: 6200. https://doi.org/10.3390/su13116200