
A Comprehensive Framework for Evaluating Sustainable Green Building Indicators under an Uncertain Environment


 , ,
, ,
Abstract
:1. Introduction
- A theoretical reference has been introduced which provides a useful archive of dimensions and their indicators for future scholars, architects, and stakeholders to use in GBs in developing countries.
- We suggested a neutrosophic MCDM approach based on AHP to help stakeholders to determine the most priority dimensions and indicators.
- For the first time, the dimensions and indicators of GB construction are being evaluated under a neutrosophic environment.
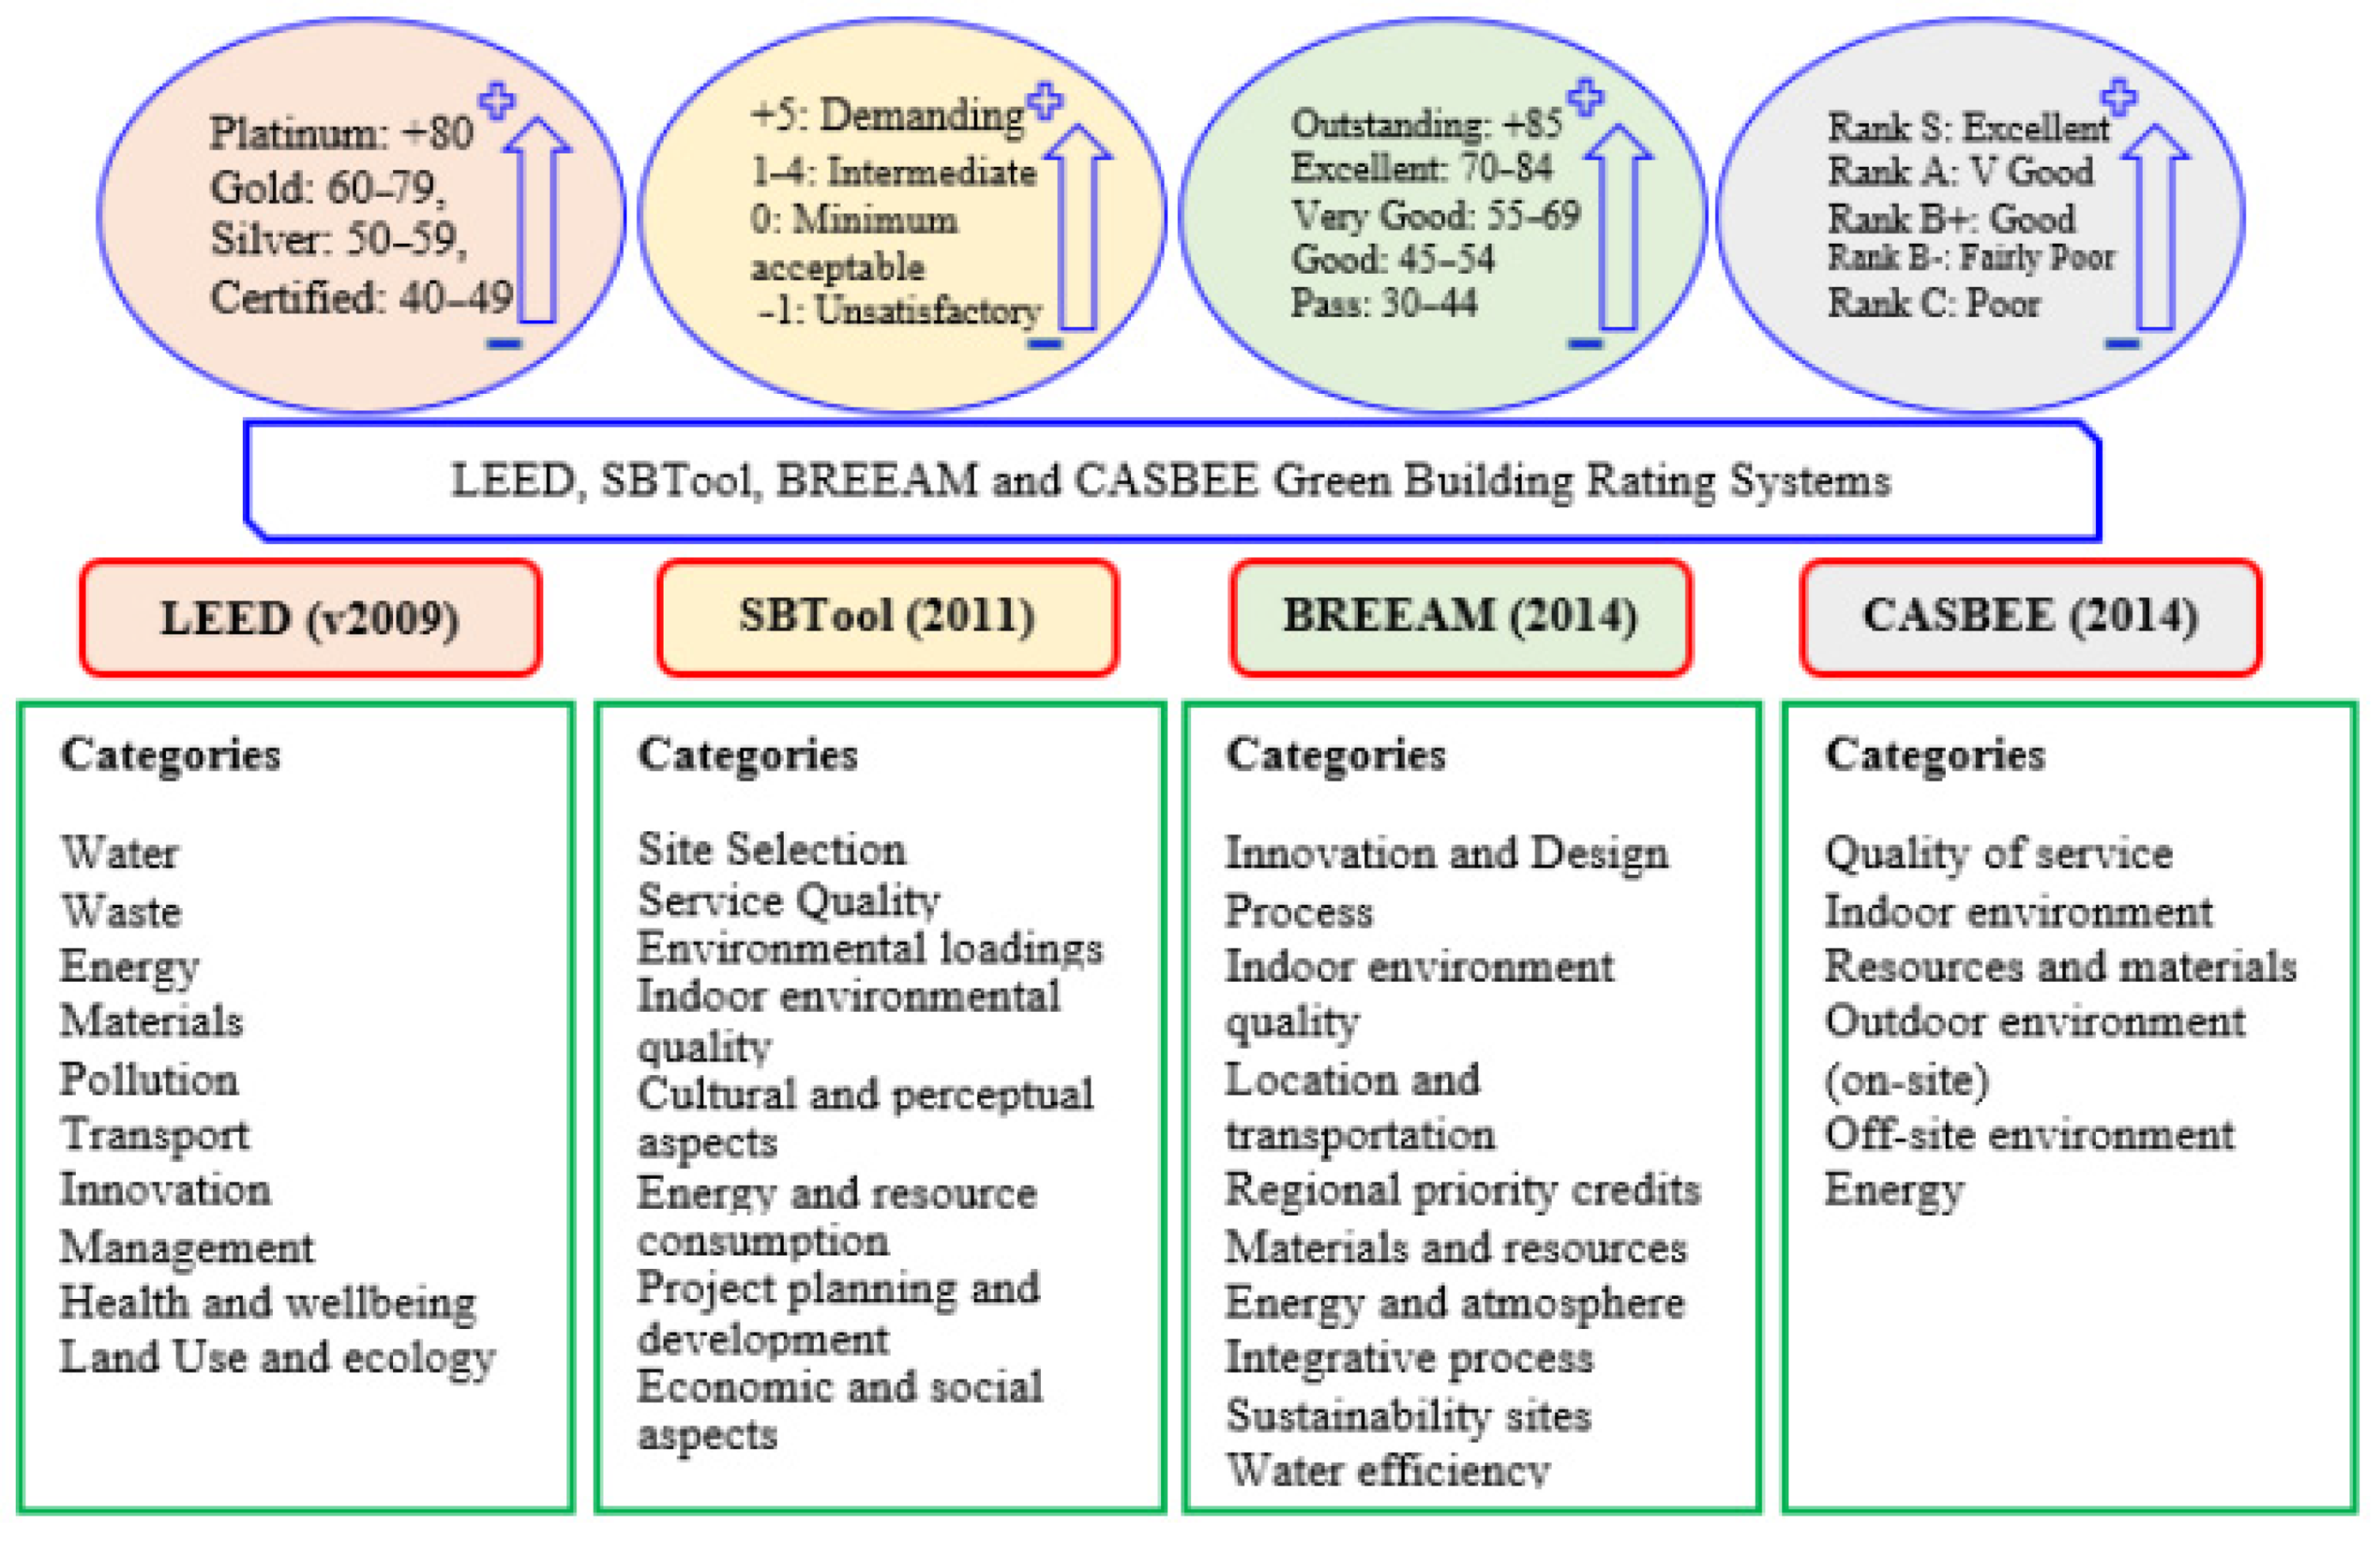
2. Literature Review
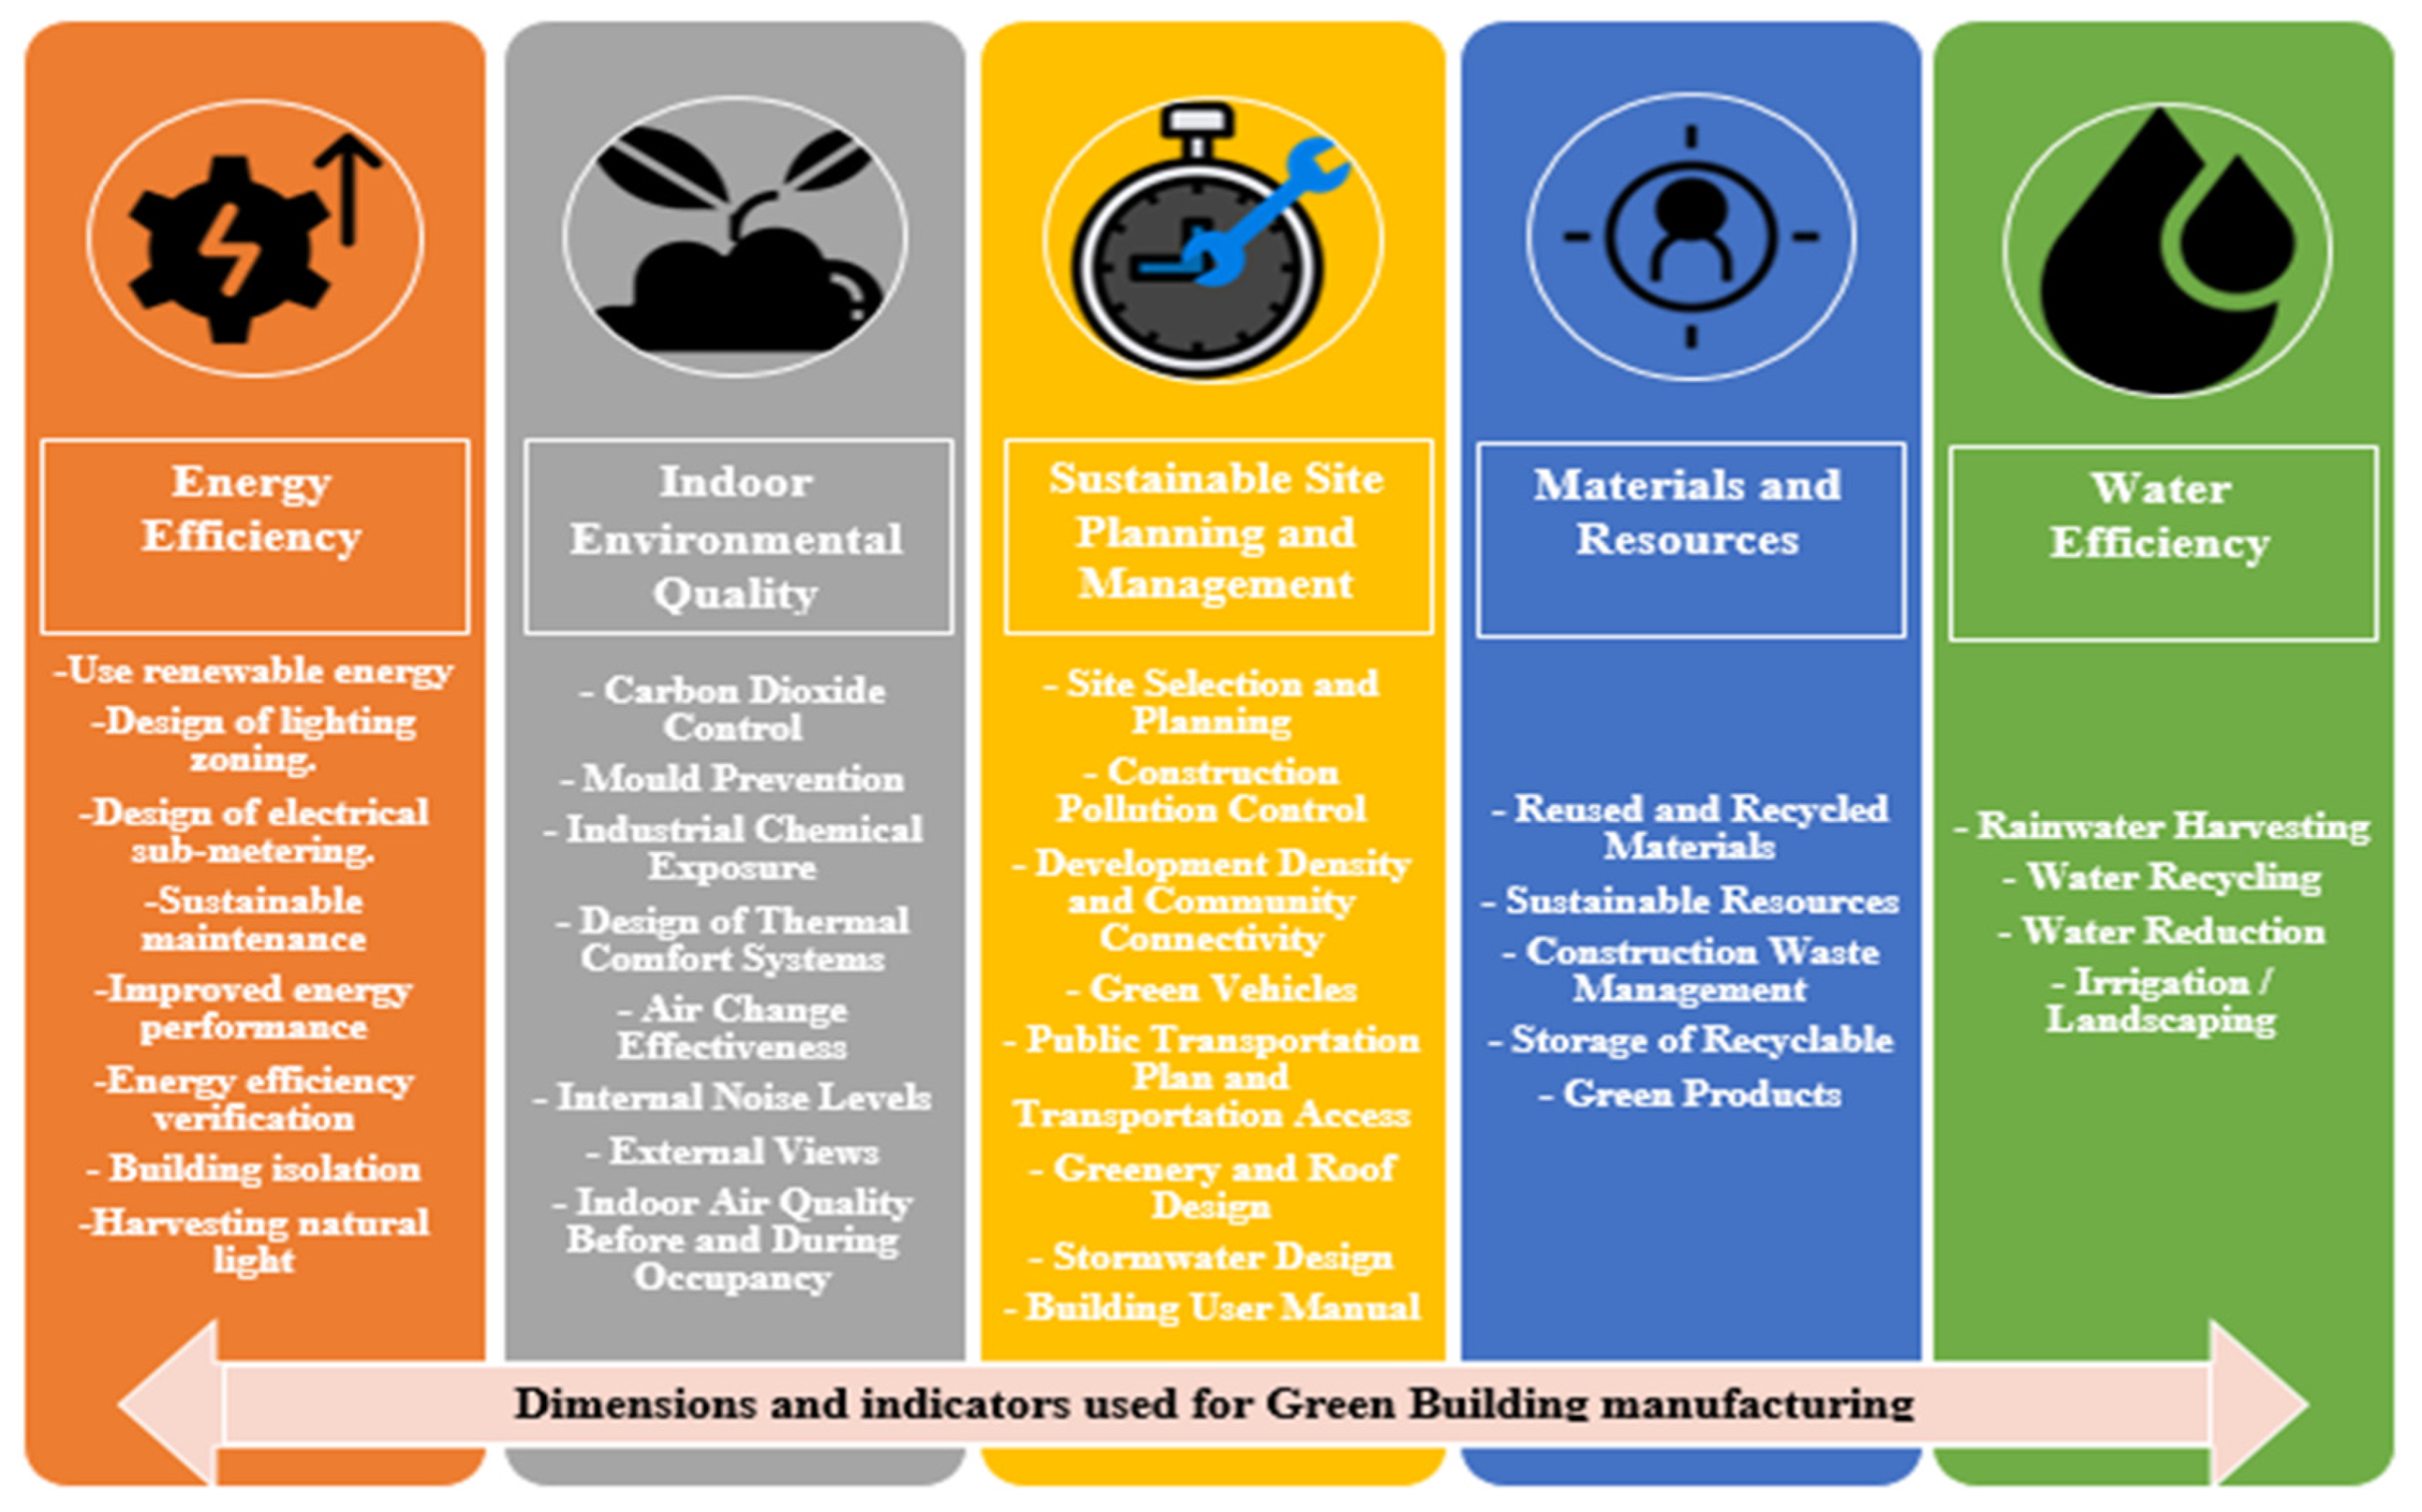
3. Green Building Indicators
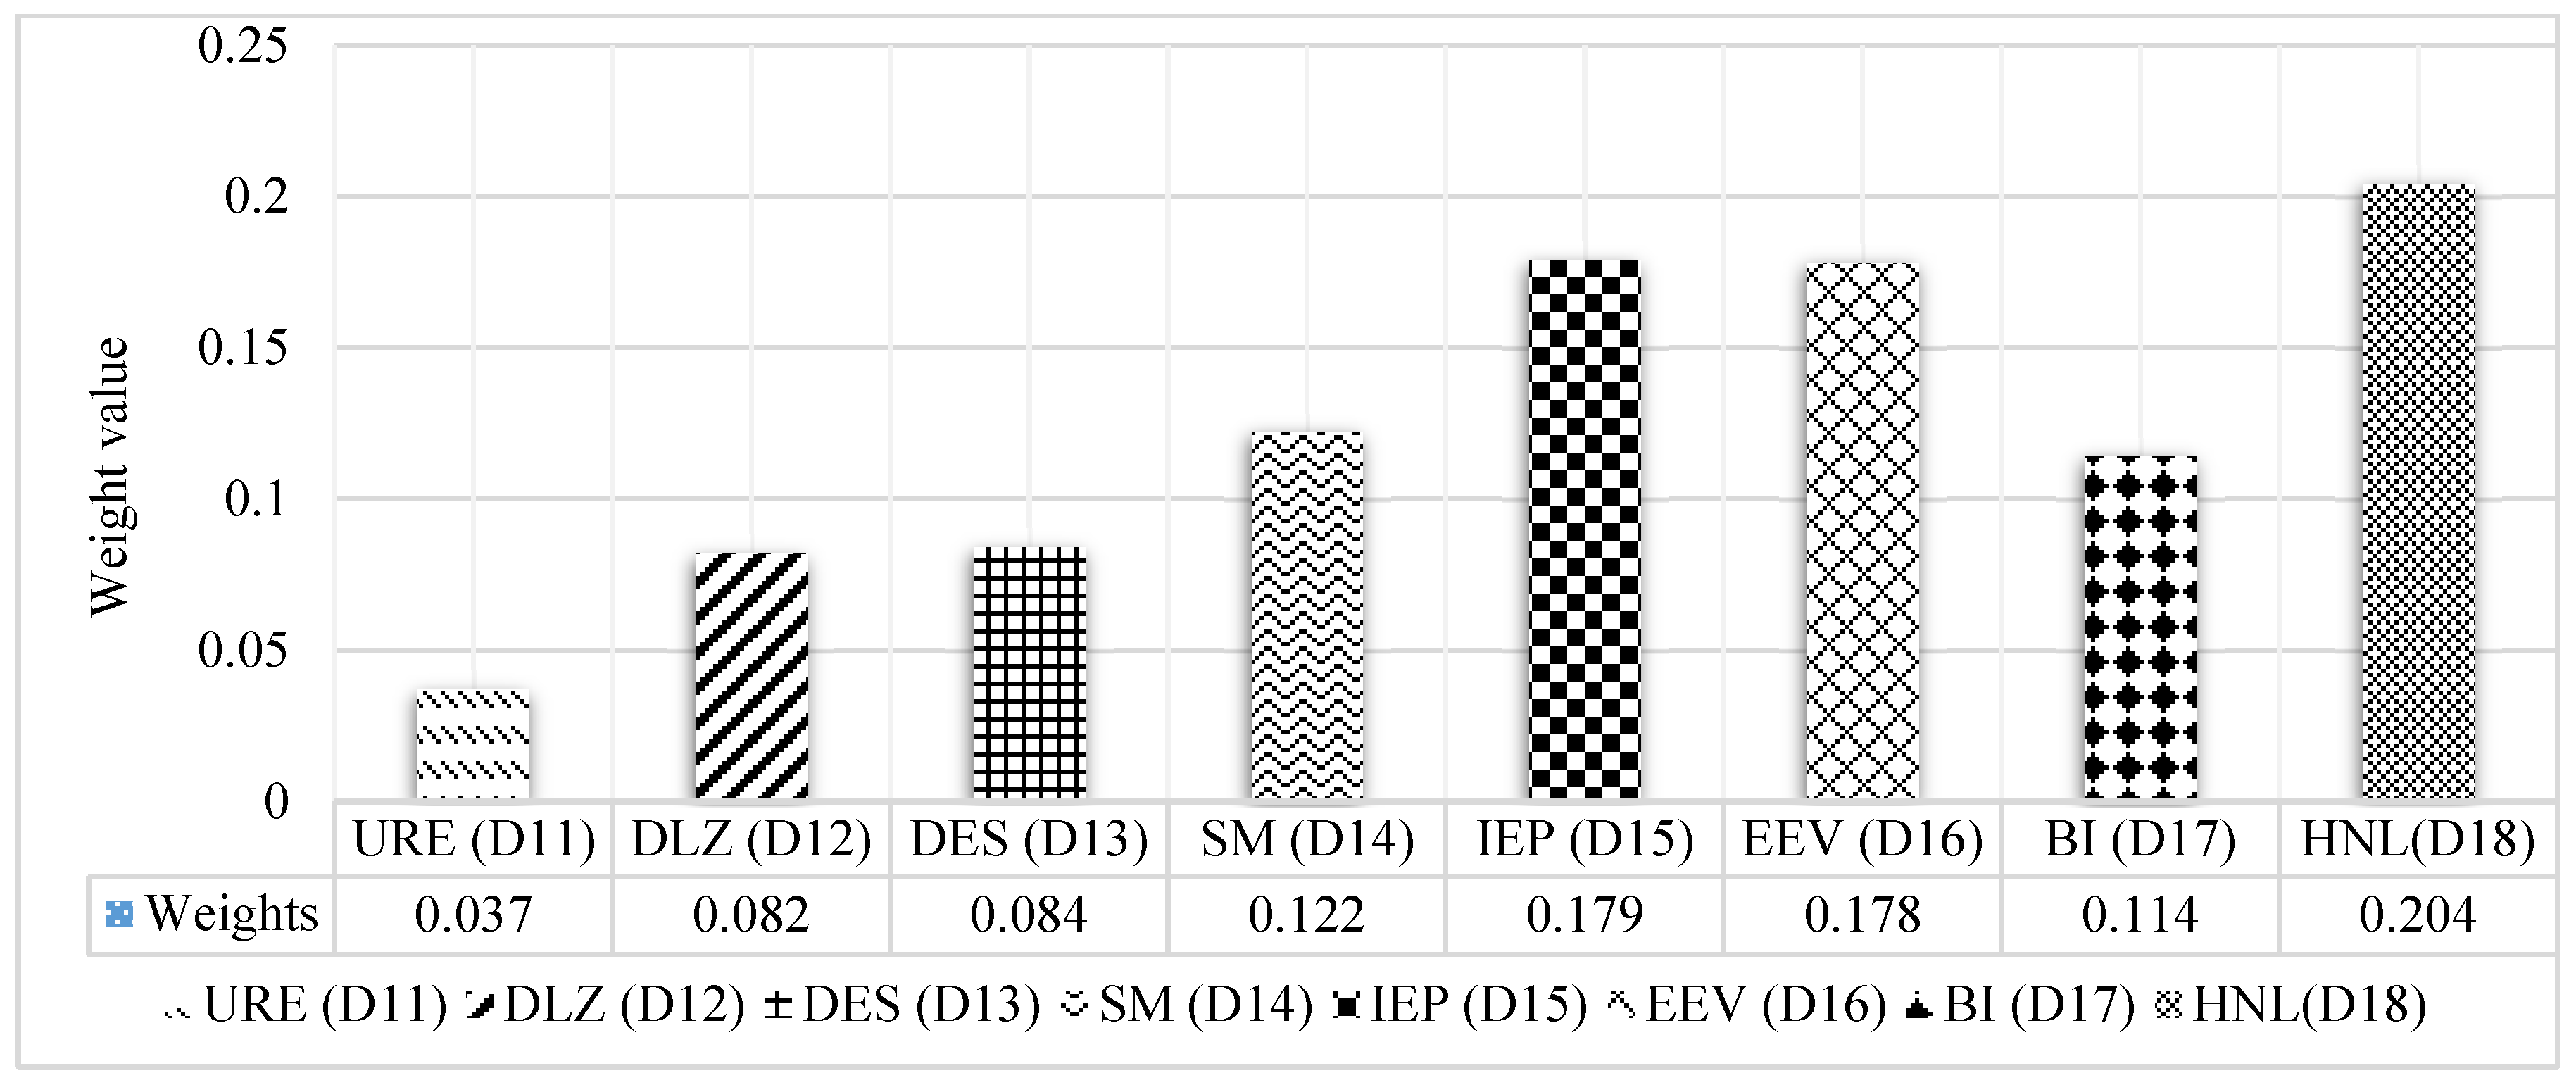
3.1. Energy Efficiency Dimension EED ()
3.1.1. Use Renewable Energy URE ()
3.1.2. Design of Lighting Zoning DLZ ()
3.1.3. Design of Electrical Sub-metering DES ()
3.1.4. Sustainable Maintenance SM ()
3.1.5. Improved Energy Performance IEP ()
3.1.6. Energy Efficiency Verification EEV ()
3.1.7. Building Isolation BI ()
3.1.8. Harvesting Natural Light HNL ()
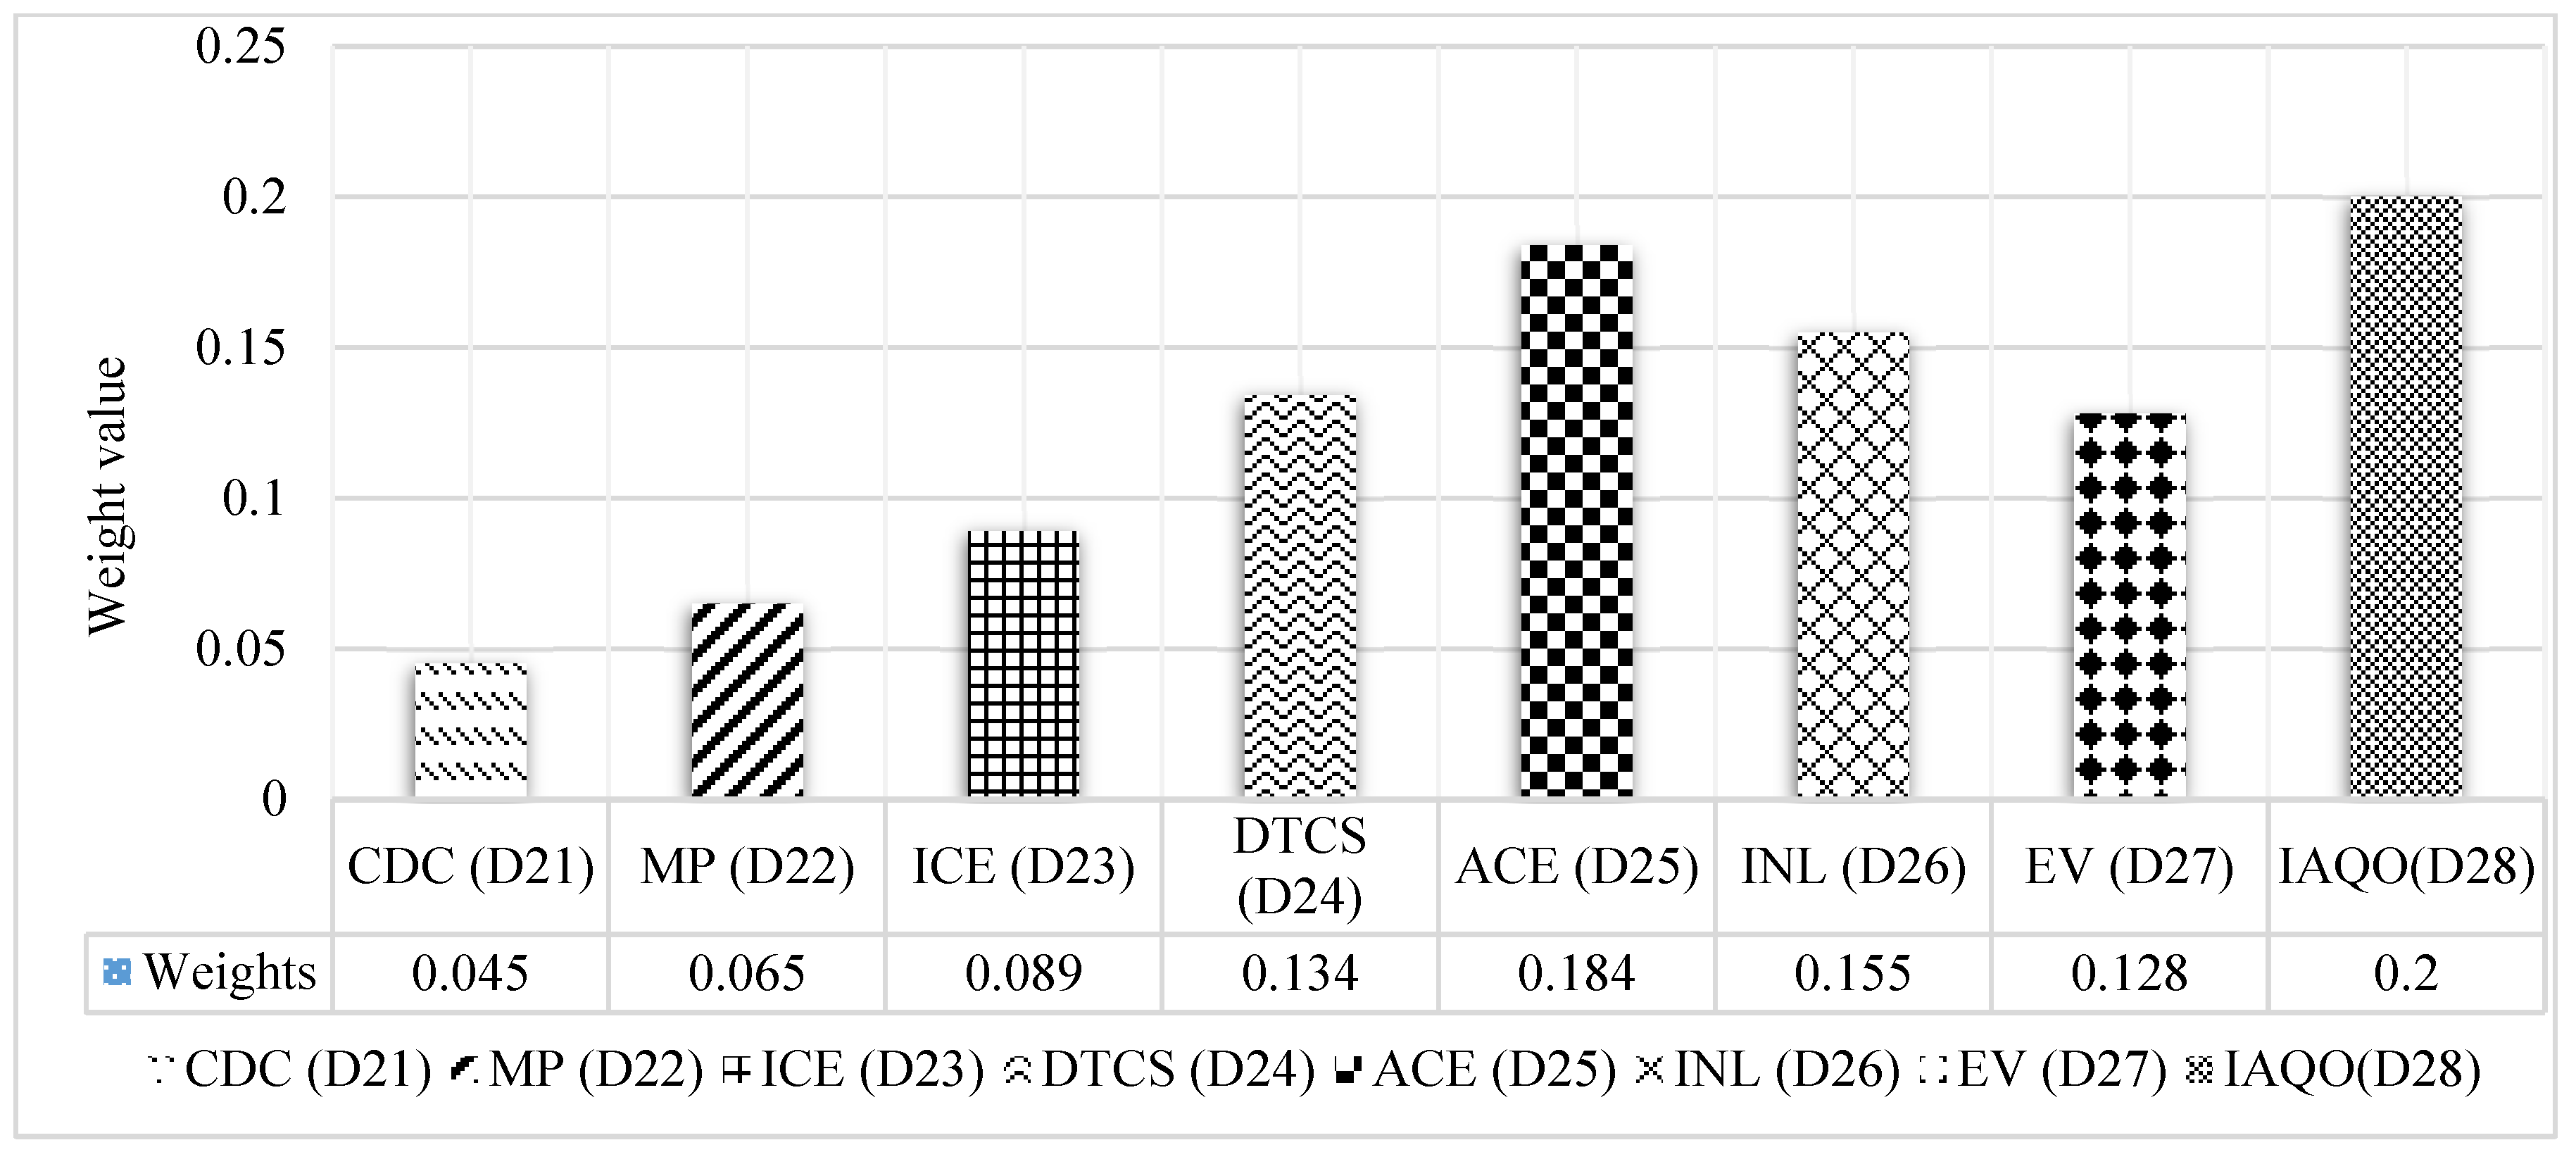
3.2. Indoor Environmental Quality Dimension IEQD ()
3.2.1. Dioxide Control CDC ()
3.2.2. Mold Prevention MP ()
3.2.3. Industrial Chemical Exposure ICE ()
3.2.4. Design of Thermal Comfort Systems DTCS ()
3.2.5. Air Change Effectiveness ACE ()
3.2.6. Internal Noise Levels INL ()
3.2.7. External Views EV ()
3.2.8. Indoor Air Quality before and during Occupancy IAQO ()
3.3. Sustainable Site Planning and Management Dimension SSPMD ()
3.3.1. Site Selection and Planning SSP ()
3.3.2. Construction Pollution Control CPC ()
3.3.3. Development Density and Community Connectivity DDCC ()
3.3.4. Green Vehicles GV ()
3.3.5. Public Transportation Plan and Transportation Access PTPTA ()
3.3.6. Greenery and Roof Design GRD ()
3.3.7. Storm Design SD ()
3.3.8. Building User Manual BUM ()
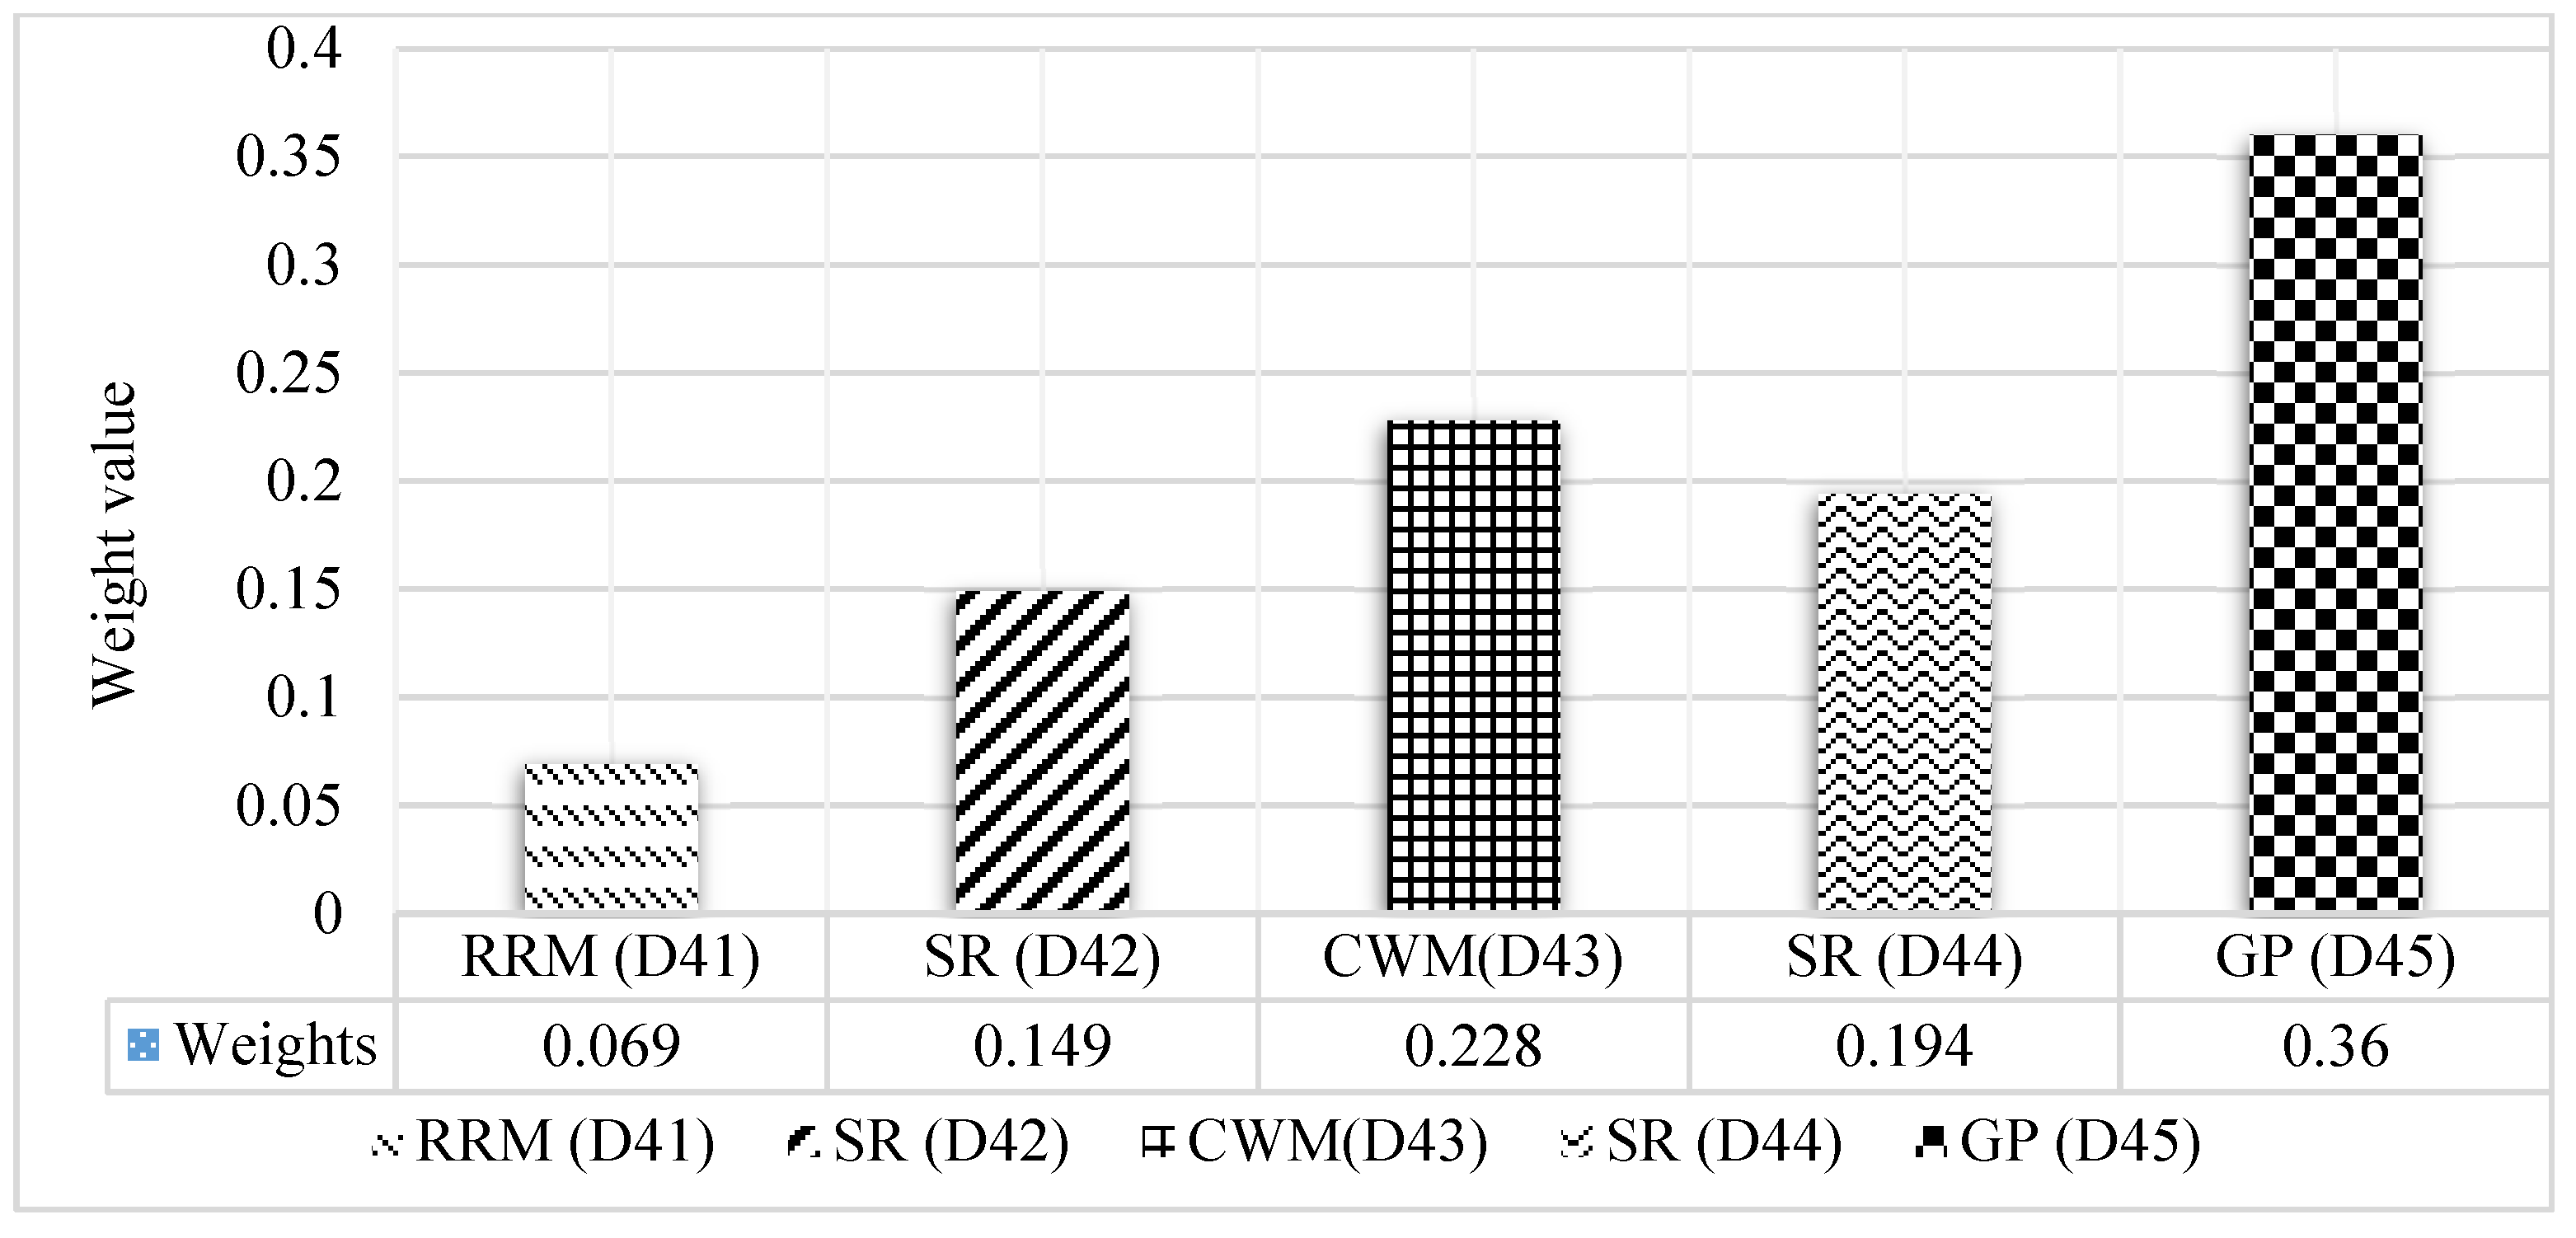
3.4. Materials and Resources Dimension MRD ()
3.4.1. Reused and Recycled Materials RRM ()
3.4.2. Sustainable Resources SR ()
3.4.3. Construction Waste Management CWM ()
3.4.4. Storage of Recyclable SR ()
3.4.5. Green Products GP ()
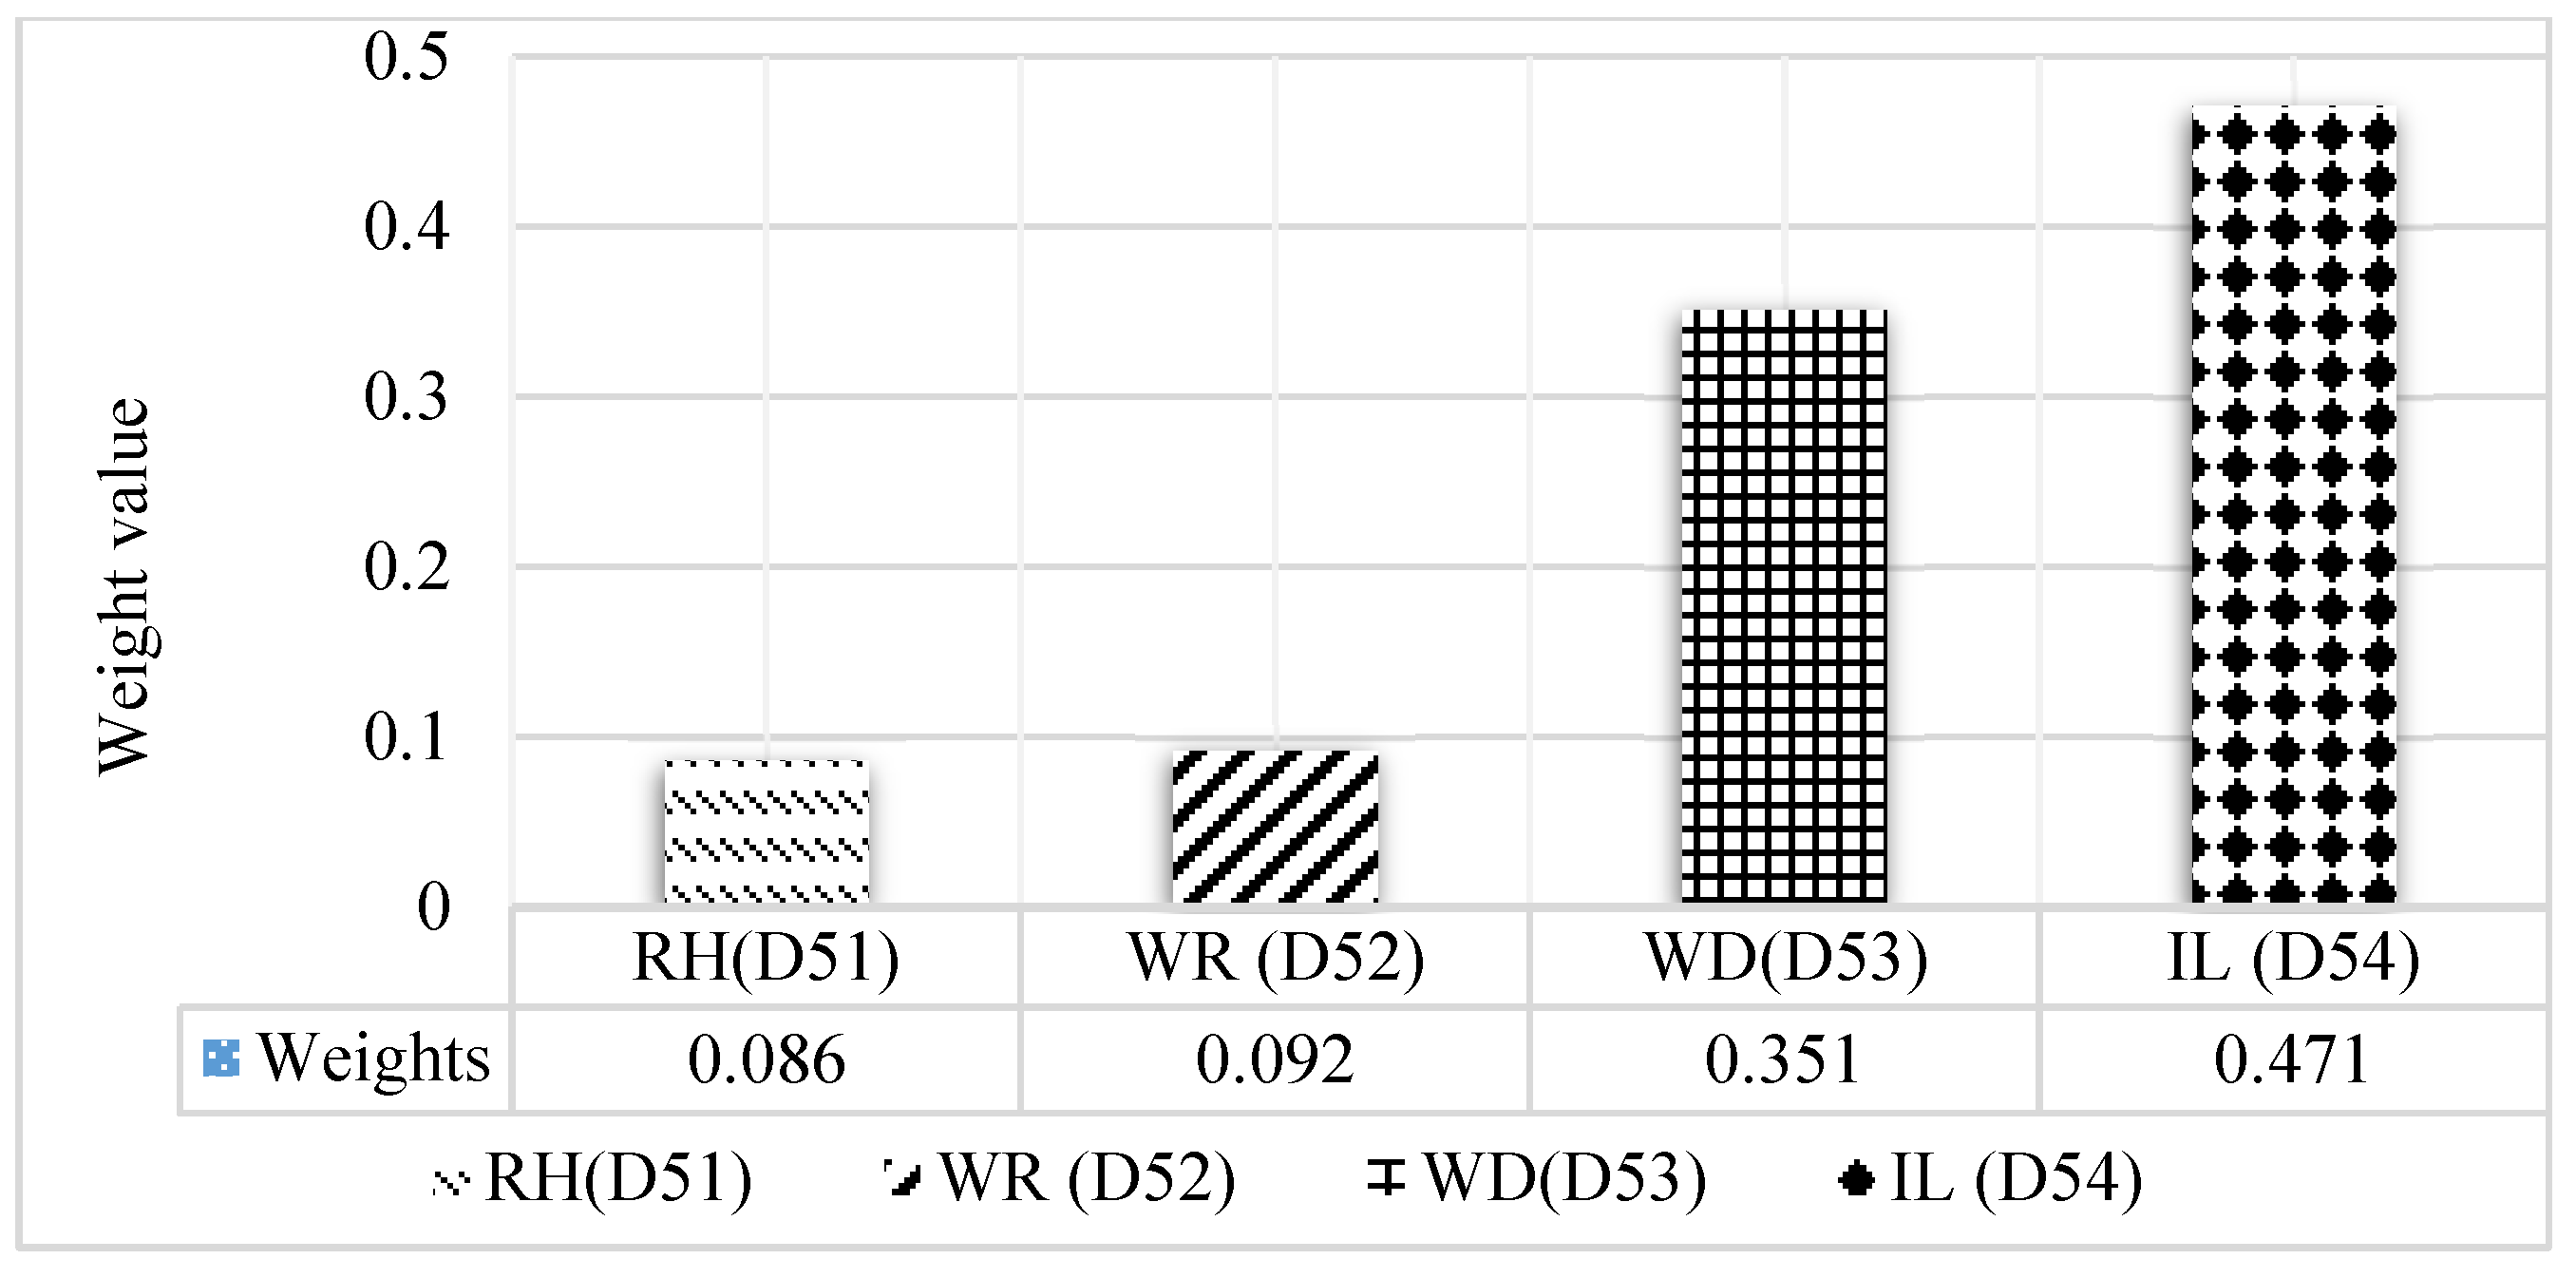
3.5. Water Efficiency Dimension WED ()
3.5.1. Rainwater Harvesting RH ()
3.5.2. Water Recycling WR ()
3.5.3. Water Reduction WD ()
3.5.4. Irrigation/Landscaping IL ()
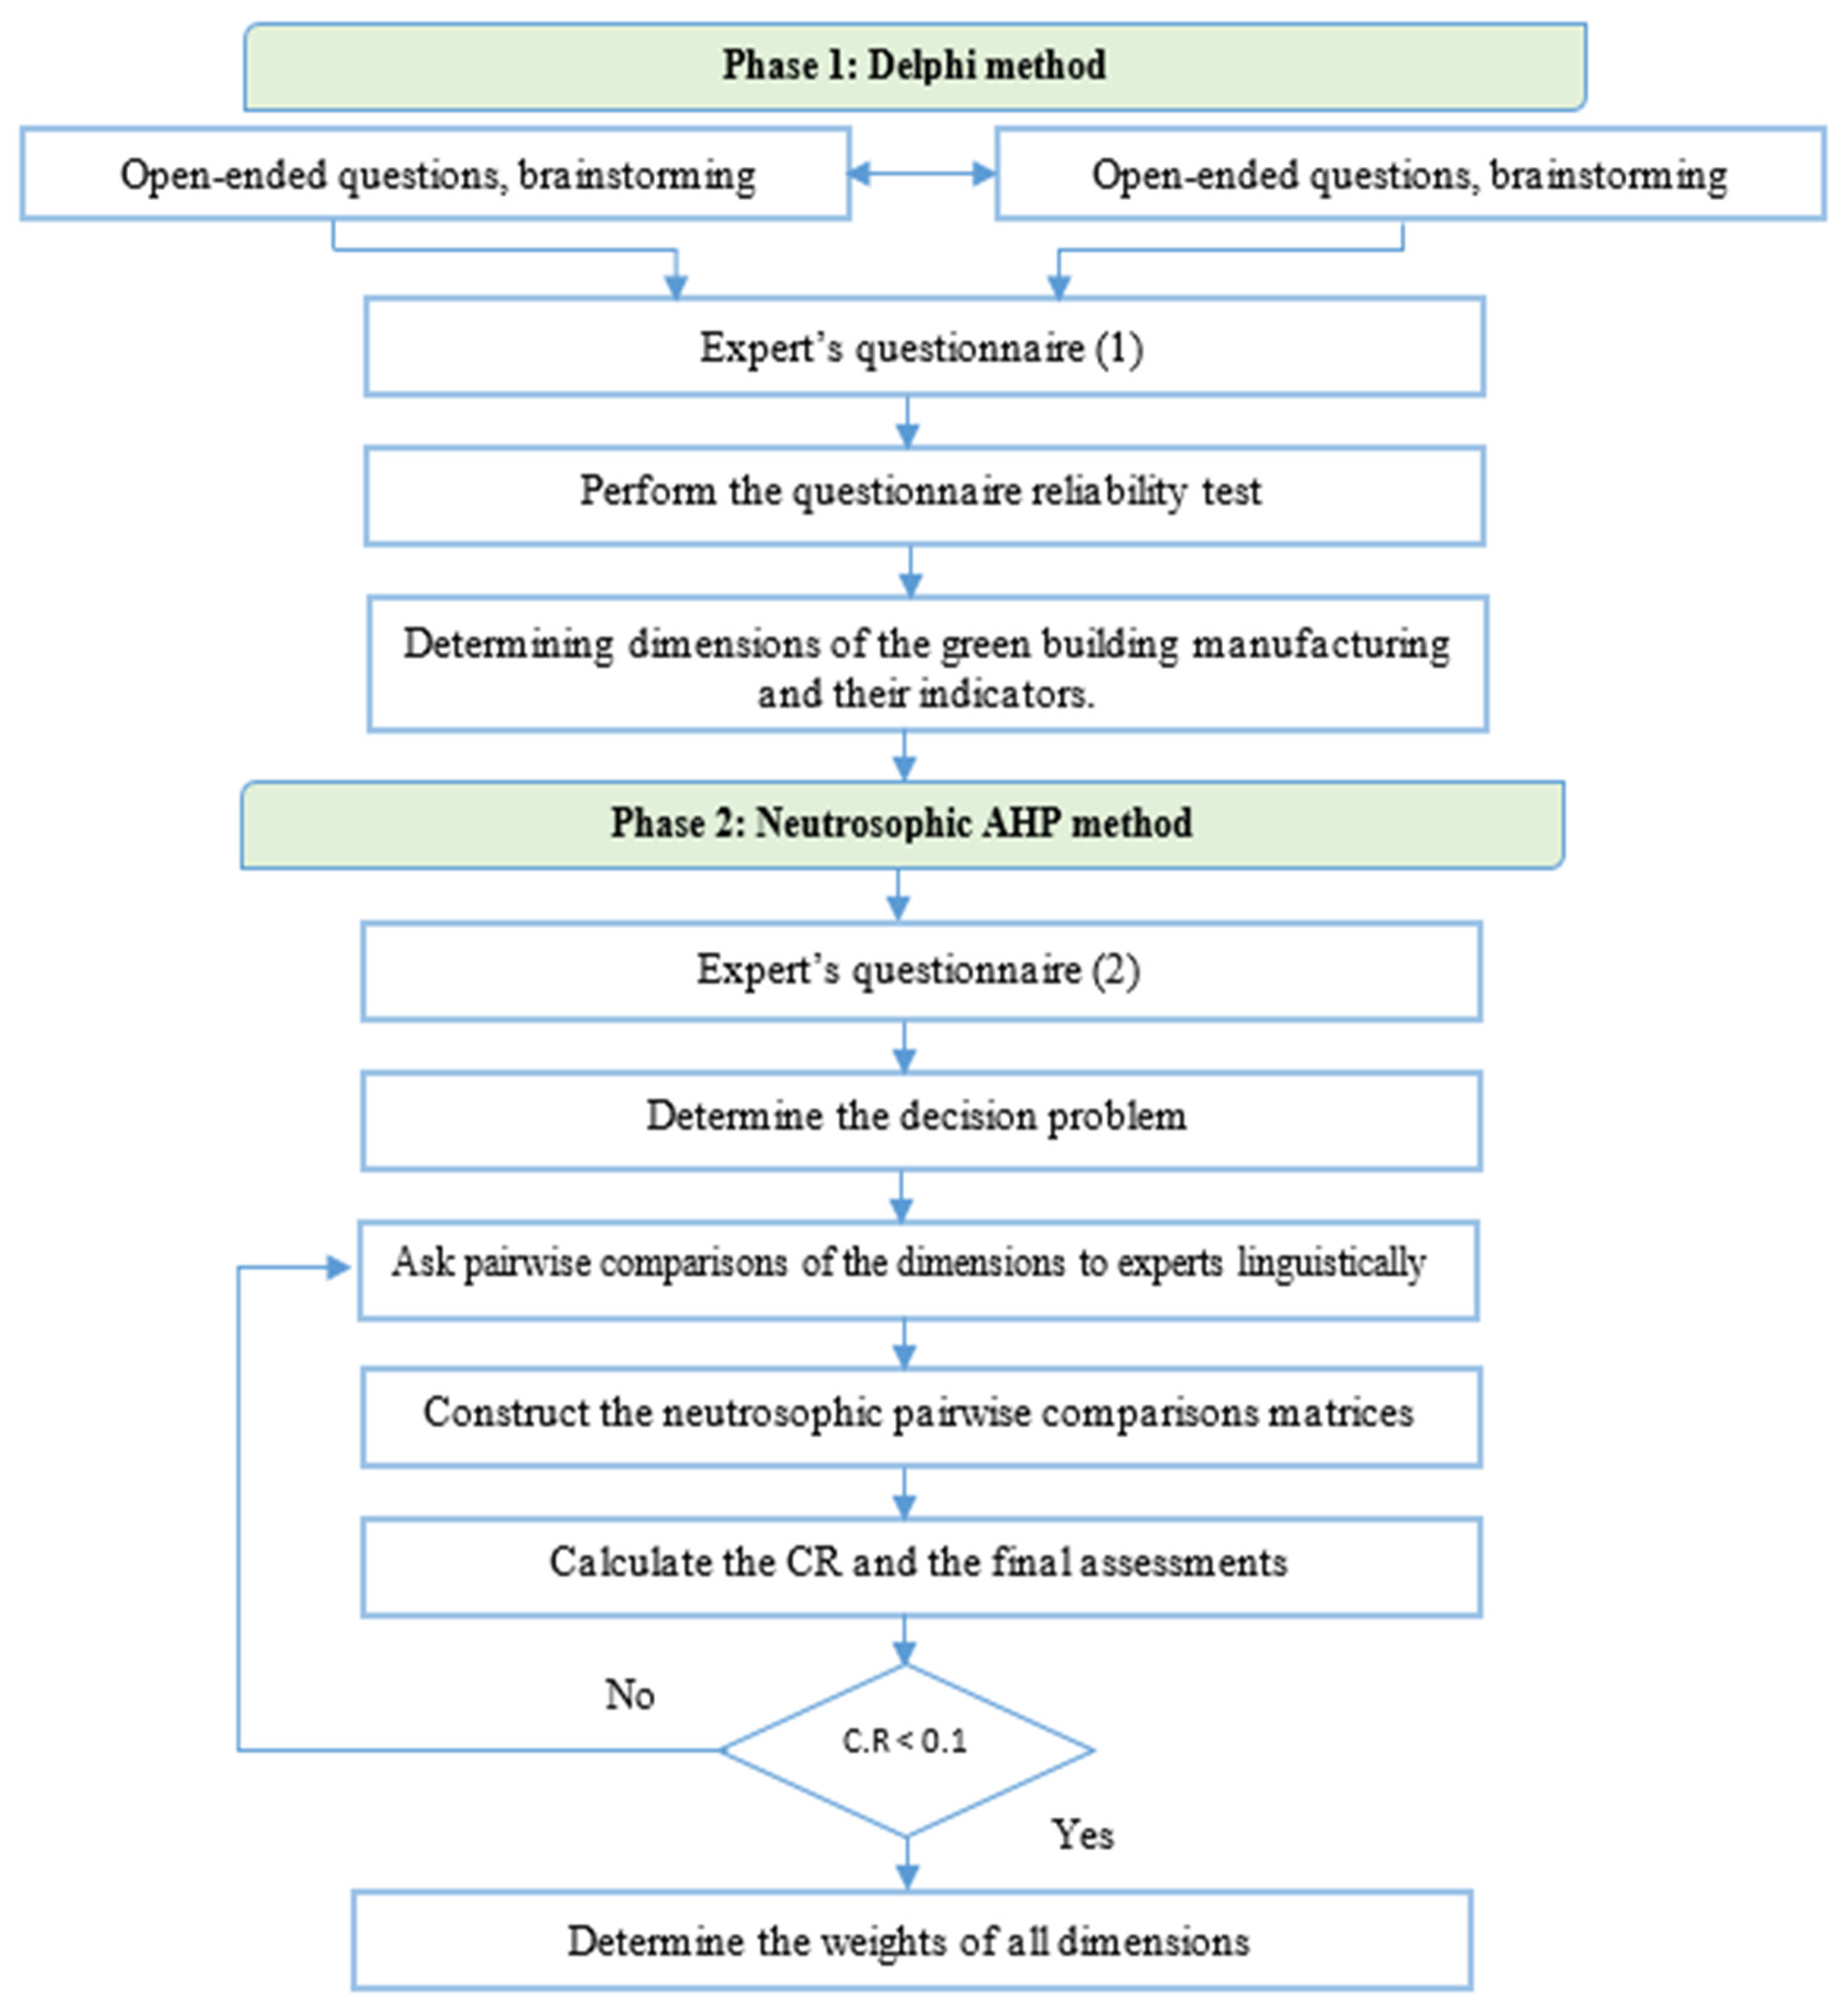
4. Research Methodology
4.1. Experts Selection
4.2. Neutrosophic Delphi Method
4.3. Neutrosophic AHP Method
5. Calculation of Neutrosophic AHP Model
5.1. Application of the Suggested Framework
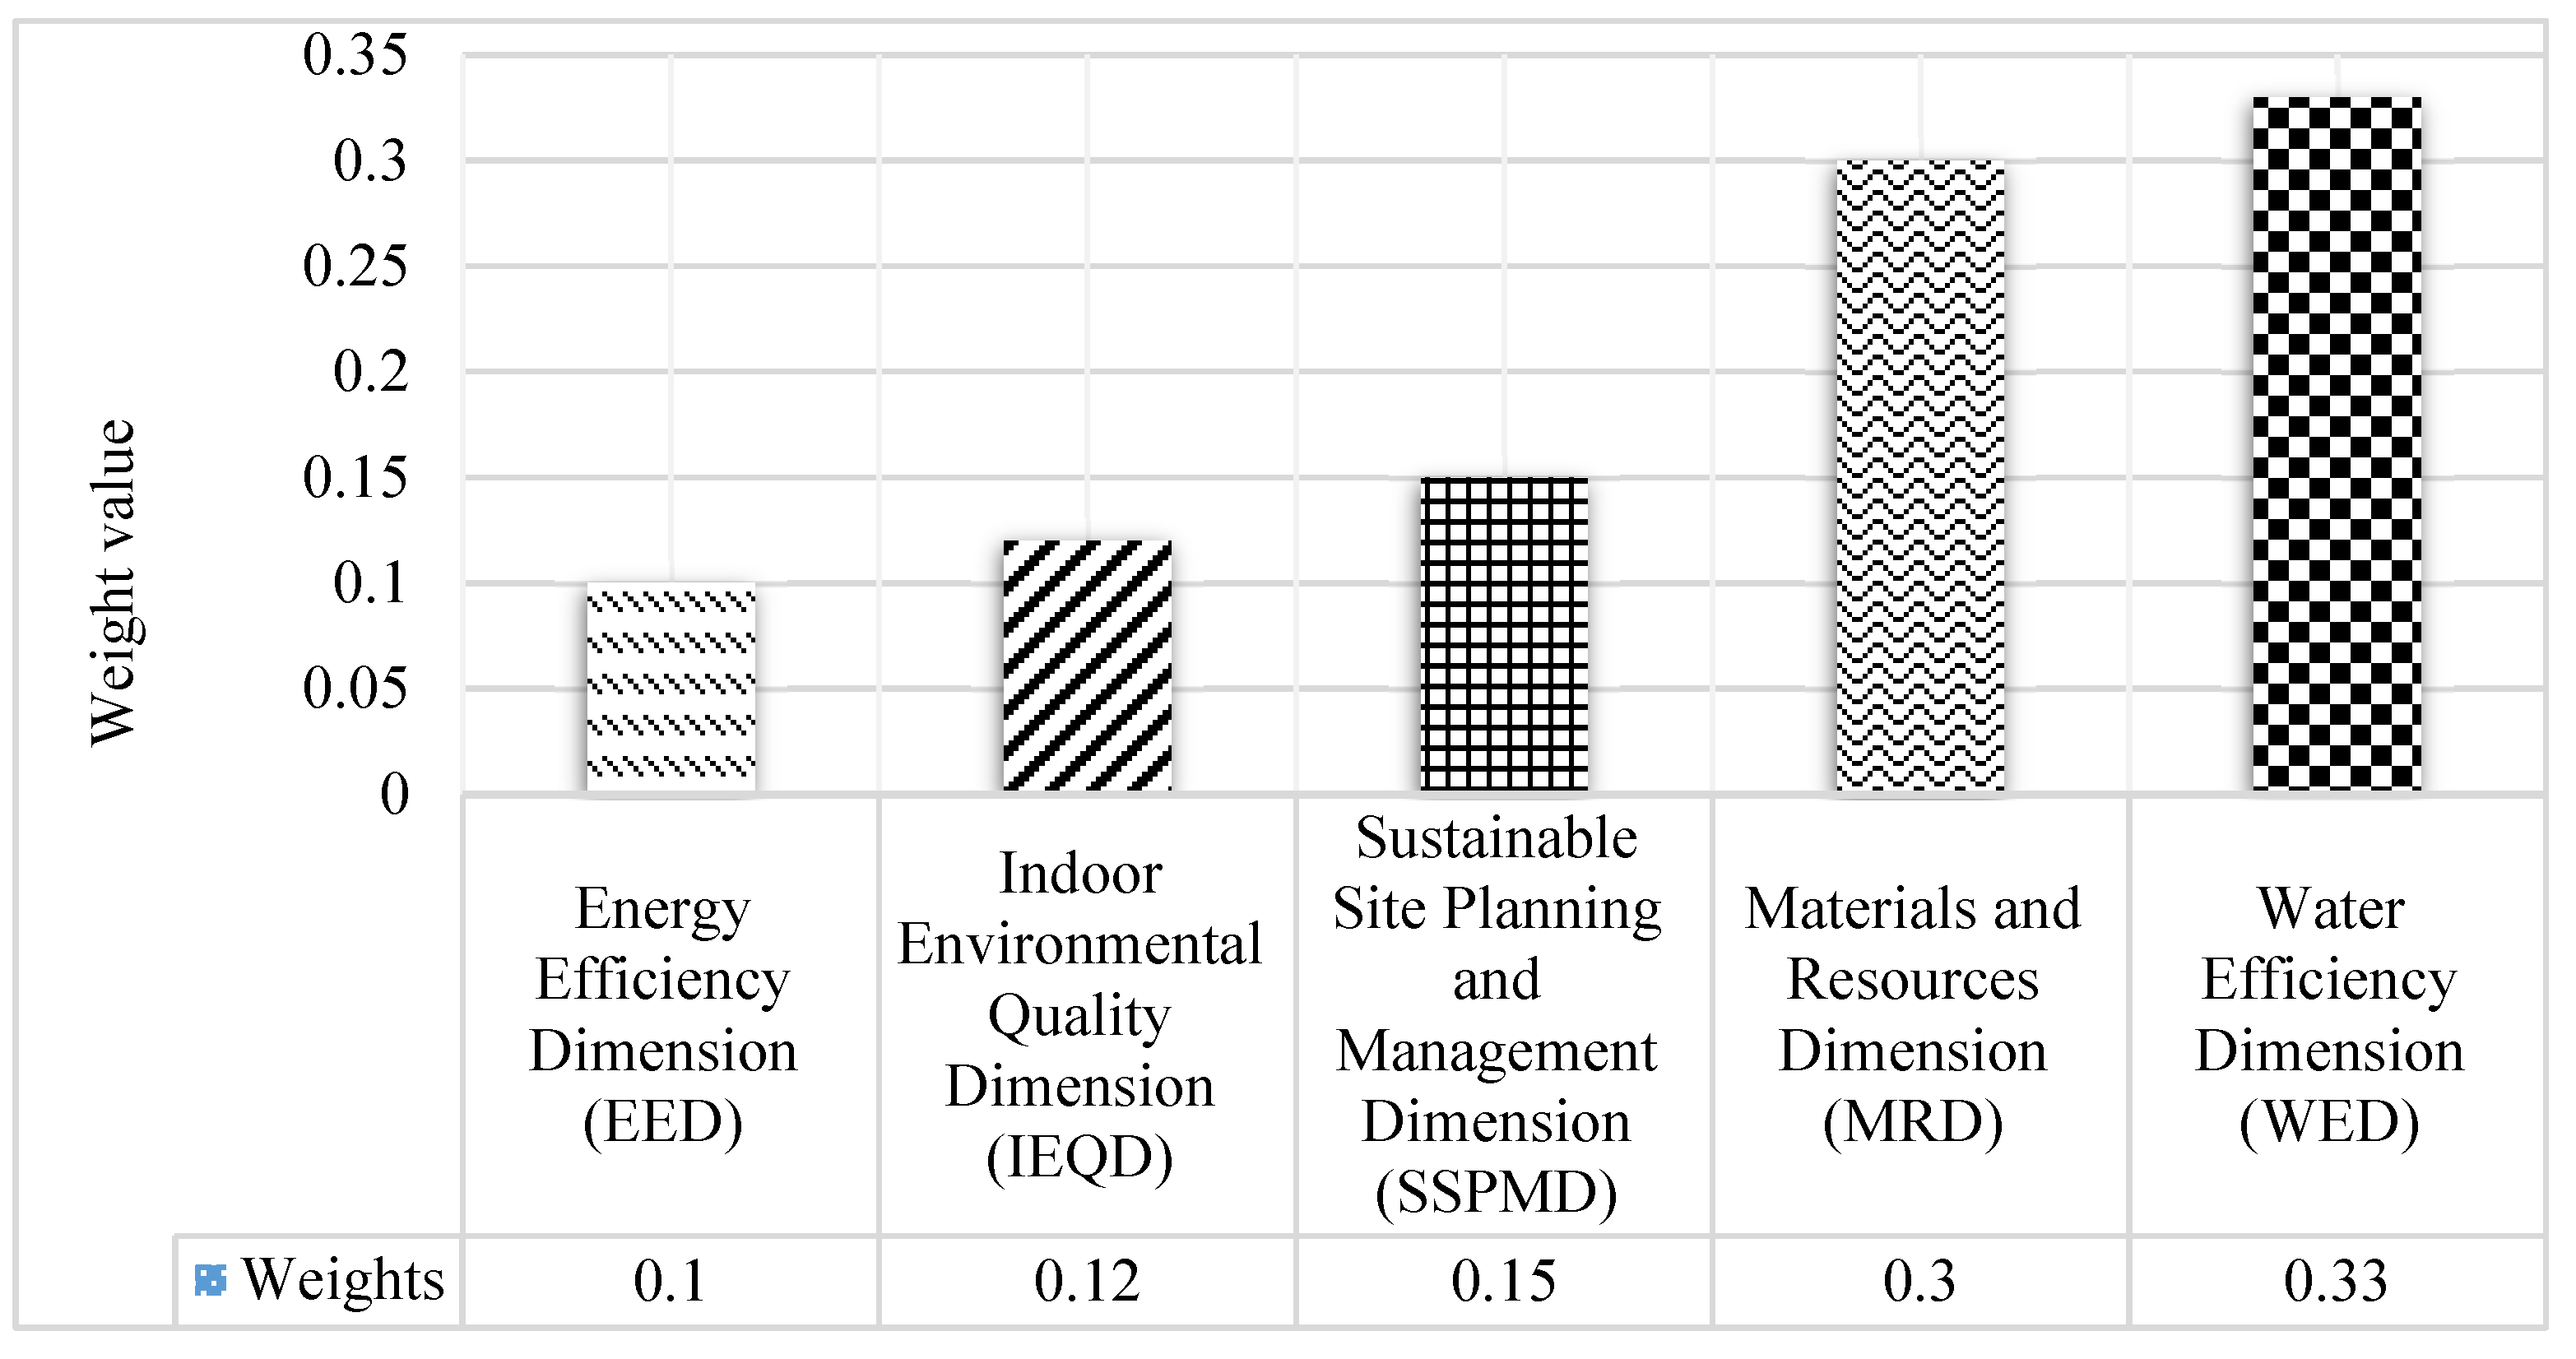
5.2. Results Analysis
6. Managerial Implications
- The proposed neutrosophic–AHP approach is applied based on the information gathered using the Delphi method to analyze the dimensions and indicators of GB construction that benefit architects, engineers, environmentalists, and stakeholders.
- The developed framework helps stakeholders and specialists to study the concepts of sustainable development related to GBs and to become acquainted with the points of view, mechanisms and pillars, methodological dimensions, principles, and goals and indicators of sustainable development before starting the work of the various designs.
- The approach helps identify the concepts of global sustainability in architecture while linking it with the concepts of local architecture, in order to produce an architecture that originates from the environment in which it is built and is not alien to it, aiding user acceptance.
- The proposed approach deals with identifying the main dimensions of GB construction in developing countries and their indicators through questionnaires that were conducted with 40 experts in various fields related to the field of sustainable GB construction. Five main dimensions and 33 indicators have been identified, covering all aspects of GB construction.
- The proposed approach tackled the problem of individual decisions by using collective decisions and collecting the necessary data through questionnaires that were divided into two parts, the first part is to define the indicators and dimensions for GB construction, and the second part is to collect the opinions of experts and their evaluations of the indicators and dimensions to classify and arrange them according to importance.
- The proposed approach provides the possibility of reflecting on the ambiguity in expert views and the linguistic imprecision of the problem of GB construction in developing countries under the neutrosophic environment, as well as describing a high degree of uncertainty in the process of generating evaluations and opinions.
- Defining the most important dimensions and indicators that must be taken into account when constructing GBs to achieve the main goal that the whole world is striving for, which is to achieve sustainable development with a balance between environmental, social, and economic development.
7. Summary and Conclusions
Author Contributions
Funding
Institutional Review Board Statement
Informed Consent Statement
Data Availability Statement
Ethical Approval
Conflicts of Interest
Appendix A

| Indicators | URE () | |||||||
|---|---|---|---|---|---|---|---|---|
| URE () | ــ | LS | HLS | SS | LS | PS | IS | LS |
| DLZ () | 1/LS | ــ | IS | PS | HLS | LS | HRS | EP |
| DES () | 1/HLS | 1/IS | ــ | HLS | SS | LS | PS | IS |
| SM () | 1/SS | 1/PS | 1/HLS | ــ | IS | SS | HRS | HRS |
| IEP () | 1/LS | 1/HLS | 1/SS | 1/IS | ــ | HRS | EP | EP |
| EEV () | 1/PS | 1/LS | 1/LS | 1/SS | 1/HRS | ــ | EP | HLS |
| BI () | 1/IS | 1/HRS | 1/PS | 1/HRS | 1/EP | 1/EP | ــ | PS |
| HNL () | 1/LS | 1/EP | 1/IS | 1/HRS | 1/EP | 1/HLS | 1/PS | ــ |
| Indicators | ||||
|---|---|---|---|---|
| URE () | ــ | |||
| DLZ () | 1/ | ــ | ||
| DES () | 1/ | 1/ | ــ | |
| SM () | 1/ | 1/ | 1/ | ــ |
| IEP () | 1/ | 1/ | 1/ | 1/ |
| EEV () | 1/ | 1/ | 1/ | 1/ |
| BI () | 1/ | 1/ | 1/ | 1/ |
| HNL () | 1/ | 1/ | 1/ | 1/ |
| Weights | 0.037 | 0.082 | 0.084 | 0.122 |
| Indicators | IEP () | EEV () | BI () | HNL () |
| URE () | ||||
| DLZ () | ||||
| DES () | ||||
| SM () | ||||
| IEP () | ــ | |||
| EEV () | 1/ | ــ | ||
| BI () | 1/ | 1/ | ــ | |
| HNL () | 1/ | 1/ | 1/ | ــ |
| Weights | 0.179 | 0.178 | 0.114 | 0.204 |
| Indicators | CDC () | |||||||
|---|---|---|---|---|---|---|---|---|
| CDC () | ــ | IS | HLS | SS | LS | PS | IS | LS |
| MP () | 1/IS | ــ | IS | IS | HLS | LS | HRS | HRS |
| ICE () | 1/HLS | 1/IS | ــ | HLS | SS | HRS | SS | IS |
| DTCS () | 1/SS | 1/IS | 1/HLS | ــ | IS | SS | HRS | HRS |
| ACE () | 1/LS | 1/HLS | 1/SS | 1/IS | ــ | HRS | EP | EP |
| INL () | 1/PS | 1/LS | 1/HRS | 1/SS | 1/HRS | ــ | EP | LS |
| EV () | 1/IS | 1/HRS | 1/SS | 1/HRS | 1/EP | 1/EP | ــ | PS |
| IAQO () | 1/LS | 1/HRS | 1/IS | 1/HRS | 1/EP | 1/LS | 1/PS | ــ |
| Indicators | CDC () | MP () | ICE () | DTCS () |
|---|---|---|---|---|
| CDC () | ــ | |||
| MP () | 1/ | ــ | ||
| ICE () | 1/ | 1/ | ــ | |
| DTCS () | 1/ | 1/ | 1/ | ــ |
| ACE () | 1/ | 1/ | 1/ | 1/ |
| INL () | 1/ | 1/ | 1/ | 1/ |
| EV () | 1/ | 1/ | 1/ | 1/ |
| IAQO () | 1/ | 1/ | 1/ | 1/ |
| Weights | 0.045 | 0.065 | 0.089 | 0.134 |
| Indicators | ACE () | INL () | EV () | IAQO () |
| CDC () | ||||
| MP () | ||||
| ICE () | ||||
| DTCS () | ||||
| ACE () | ــ | |||
| INL () | 1/ | ــ | ||
| EV () | 1/ | 1/ | ــ | |
| IAQO () | 1/ | 1/ | 1/ | ــ |
| Weights | 0.184 | 0.155 | 0.128 | 0.200 |
| Indicators | SSP () | CPC () | DDCC () | GV () | PTPTA () | GRD () | SD () | BUM () |
|---|---|---|---|---|---|---|---|---|
| SSP () | ــ | HLS | HLS | SS | LS | PS | IS | HLS |
| CPC () | 1/HLS | ــ | IS | HLS | HLS | LS | HRS | EP |
| DDCC () | 1/HLS | 1/IS | ــ | HLS | SS | LS | PS | IS |
| GV () | 1/SS | 1/HLS | 1/HLS | ــ | IS | HLS | HLS | HRS |
| PTPTA () | 1/LS | 1/HLS | 1/SS | 1/IS | ــ | HRS | EP | EP |
| GRD () | 1/PS | 1/LS | 1/LS | 1/HLS | 1/HRS | ــ | EP | HLS |
| SD () | 1/IS | 1/HRS | 1/PS | 1/HLS | 1/EP | 1/EP | ــ | PS |
| BUM () | 1/HLS | 1/EP | 1/IS | 1/HRS | 1/EP | 1/HLS | 1/PS | ــ |
| Indicators | SSP () | CPC () | DDCC () | GV () |
|---|---|---|---|---|
| SSP () | ــ | |||
| CPC () | 1/ | ــ | ||
| DDCC () | 1/ | 1/ | ــ | |
| GV () | 1/ | 1/ | 1/ | ــ |
| PTPTA () | 1/ | 1/ | 1/ | 1/ |
| GRD () | 1/ | 1/ | 1/ | 1/ |
| SD () | 1/ | 1/ | 1/ | 1/ |
| BUM () | 1/ | 1/ | 1/ | 1/ |
| Weights | 0.038 | 0.082 | 0.080 | 0.129 |
| Indicators | PTPTA () | GRD () | SD () | BUM () |
| SSP () | ||||
| CPC () | ||||
| DDCC () | 1/ | |||
| GV () | ||||
| PTPTA () | ــ | |||
| GRD () | 1/ | ــ | ||
| SD () | 1/ | 1/ | ــ | |
| BUM () | 1/ | 1/ | 1/ | ــ |
| Weights | 0.156 | 0.178 | 0.139 | 0.198 |
| Indicators | RRM () | SR () | CWM () | SR () | GP () |
|---|---|---|---|---|---|
| RRM () | ــ | PS | LS | SS | LS |
| SR () | 1/PS | ــ | IS | PS | HRS |
| CWM () | 1/LS | 1/IS | ــ | SS | |
| SR () | 1/SS | 1/PS | 1/ | ــ | IS |
| GP () | 1/LS | 1/HRS | 1/SS | 1/IS | ــ |
| Indicators | RRM () | SR () | CWM () | SR () | GP () |
|---|---|---|---|---|---|
| RRM () | ــ | ||||
| SR () | 1/ | ــ | |||
| CWM () | 1/ | 1/ | ــ | ||
| SR () | 1/ | 1/ | 1/ | ــ | |
| GP () | 1/ | 1/ | 1/ | 1/ | ــ |
| Weights | 0.069 | 0.149 | 0.228 | 0.194 | 0.360 |
| Indicators | RH () | WR () | WD () | IL () |
|---|---|---|---|---|
| RH () | ــ | PS | LS | SS |
| WR () | 1/PS | ــ | SS | HLS |
| WD () | 1/LS | 1/SS | ــ | |
| IL () | 1/SS | 1/HLS | 1/SS | ــ |
| Indicators | RH () | WR () | WD () | IL () |
|---|---|---|---|---|
| RH () | ــ | |||
| WR () | 1/ | ــ | ||
| WD () | 1/ | 1/ | ــ | |
| IL () | 1/ | 1/ | 1/ | ــ |
| Weights | 0.086 | 0.092 | 0.351 | 0.471 |
References
- Gismondi, M. Historicizing transitions: The value of historical theory to energy transition research. Energy Res. Soc. Sci. 2018, 38, 193–198. [Google Scholar] [CrossRef]
- Hewitt, E.; Oberg, A.; Coronado, C.; Andrews, C. Assessing “green” and “resilient” building features using a purposeful systems approach. Sustain. Cities Soc. 2019, 48, 101546. [Google Scholar] [CrossRef]
- Bhowmik, C.; Bhowmik, S.; Ray, A.; Pandey, K.M. Optimal green energy planning for sustainable development: A review. Renew. Sustain. Energy Rev. 2017, 71, 796–813. [Google Scholar] [CrossRef]
- Shad, R.; Khorrami, M.; Ghaemi, M. Developing an Iranian green building assessment tool using decision making methods and geographical information system: Case study in Mashhad city. Renew. Sustain. Energy Rev. 2017, 67, 324–340. [Google Scholar] [CrossRef]
- Geng, Y.; Ji, W.; Wang, Z.; Lin, B.; Zhu, Y. A review of operating performance in green buildings: Energy use, indoor environmental quality and occupant satisfaction. Energy Build. 2019, 183, 500–514. [Google Scholar] [CrossRef]
- Yadegaridehkordi, E.; Hourmand, M.; Nilashi, M.; Alsolami, E.; Samad, S.; Mahmoud, M.; Alarood, A.A.; Zainol, A.; Majeed, H.D.; Shuib, L. Assessment of sustainability indicators for green building manufacturing using fuzzy multi-criteria decision making approach. J. Clean. Prod. 2020, 277, 122905. [Google Scholar] [CrossRef]
- Steinemann, A.; Wargocki, P.; Rismanchi, B. Ten questions concerning green buildings and indoor air quality. Build. Environ. 2017, 112, 351–358. [Google Scholar] [CrossRef] [Green Version]
- Alhamwi, A.; Medjroubi, W.; Vogt, T.; Agert, C. GIS-based urban energy systems models and tools: Introducing a model for the optimisation of flexibilisation technologies in urban areas. Appl. Energy 2017, 191, 1–9. [Google Scholar] [CrossRef]
- Zhang, X.; Shen, L.; Zhang, L. Life cycle assessment of the air emissions during building construction process: A case study in Hong Kong. Renew. Sustain. Energy Rev. 2013, 17, 160–169. [Google Scholar] [CrossRef]
- Li, Q.; Long, R.; Chen, H.; Chen, F.; Cheng, X. Chinese urban resident willingness to pay for green housing based on double-entry mental accounting theory. Nat. Hazards 2019, 95, 129–153. [Google Scholar] [CrossRef]
- Li, Q.; Long, R.; Chen, H.; Chen, F.; Wang, J. Visualized analysis of global green buildings: Development, barriers and future directions. J. Clean. Prod. 2020, 245, 118775. [Google Scholar] [CrossRef]
- Zhang, X.; Wu, L.; Zhang, R.; Deng, S.; Zhang, Y.; Wu, J.; Li, Y.; Lin, L.; Li, L.; Wang, Y.; et al. Evaluating the relationships among economic growth, energy consumption, air emissions and air environmental protection investment in China. Renew. Sustain. Energy Rev. 2013, 18, 259–270. [Google Scholar] [CrossRef]
- Hurmekoski, E.; Pykäläinen, J.; Hetemäki, L. Long-term targets for green building: Explorative Delphi backcasting study on wood-frame multi-story construction in Finland. J. Clean. Prod. 2018, 172, 3644–3654. [Google Scholar] [CrossRef]
- Wu, P.; Song, Y.; Shou, W.; Chi, H.; Chong, H.-Y.; Sutrisna, M. A comprehensive analysis of the credits obtained by LEED 2009 certified green buildings. Renew. Sustain. Energy Rev. 2017, 68, 370–379. [Google Scholar] [CrossRef]
- Silvestre, B.S.; Ţîrcă, D.M. Innovations for sustainable development: Moving toward a sustainable future. J. Clean. Prod. 2019, 208, 325–332. [Google Scholar] [CrossRef]
- Esa, M.R.; Halog, A.; Rigamonti, L. Strategies for minimizing construction and demolition wastes in Malaysia. Resour. Conserv. Recycl. 2017, 120, 219–229. [Google Scholar] [CrossRef]
- Khalil, N.; Kamaruzzaman, S.N.; Baharum, M.R. Ranking the indicators of building performance and the users’ risk via Analytical Hierarchy Process (AHP): Case of Malaysia. Ecol. Indic. 2016, 71, 567–576. [Google Scholar] [CrossRef]
- Zarghami, E.; Azemati, H.; Fatourehchi, D.; Karamloo, M. Customizing well-known sustainability assessment tools for Iranian residential buildings using Fuzzy Analytic Hierarchy Process. Build. Environ. 2018, 128, 107–128. [Google Scholar] [CrossRef]
- Smarandache, F. Neutrosophy: Neutrosophic Probability, Set, and Logic: Analytic Synthesis & Synthetic Analysis; American Research Press: Santa Fe, NM, USA, 1998. [Google Scholar]
- Zadeh, L.A. Fuzzy sets. Inf. Control. 1965, 8, 338–353. [Google Scholar] [CrossRef] [Green Version]
- Atanassov, K.T. New operations defined over the intuitionistic fuzzy sets. Fuzzy Sets Syst. 1994, 61, 137–142. [Google Scholar] [CrossRef]
- Abdel-Basset, M.; Gamal, A.; Chakrabortty, R.K.; Ryan, M. A new hybrid multi-criteria decision-making approach for location selection of sustainable offshore wind energy stations: A case study. J. Clean. Prod. 2021, 280. [Google Scholar] [CrossRef]
- Amirghodsi, S.; Naeini, A.B.; Makui, A. An Integrated Delphi-DEMATEL-ELECTRE Method on Gray Numbers to Rank Technology Providers. IEEE Trans. Eng. Manag. 2020, 1–17. [Google Scholar] [CrossRef]
- Abdel-Basset, M.; Gamal, A.; Chakrabortty, R.K.; Ryan, M.J. Evaluation of sustainable hydrogen production options using an advanced hybrid MCDM approach: A case study. Int. J. Hydrogen Energy 2021, 46, 4567–4591. [Google Scholar] [CrossRef]
- Gan, X.; Fernandez, I.C.; Guo, J.; Wilson, M.; Zhao, Y.; Zhou, B.; Wu, J. When to use what: Methods for weighting and aggregating sustainability indicators. Ecol. Indic. 2017, 81, 491–502. [Google Scholar] [CrossRef]
- Saaty, T.L. How to handle dependence with the analytic hierarchy process. Math. Model. 1987, 9, 369–376. [Google Scholar] [CrossRef] [Green Version]
- Kahraman, C.; Cebeci, U.; Ruan, D. Multi-attribute comparison of catering service companies using fuzzy AHP: The case of Turkey. Int. J. Prod. Econ. 2004, 87, 171–184. [Google Scholar] [CrossRef]
- Leccese, F.; Salvadori, G.; Rocca, M.; Buratti, C.; Belloni, E. A method to assess lighting quality in educational rooms using analytic hierarchy process. Build. Environ. 2020, 168, 106501. [Google Scholar] [CrossRef]
- Abdel-Baset, M.; Chang, V.; Gamal, A.; Smarandache, F. An integrated neutrosophic ANP and VIKOR method for achieving sustainable supplier selection: A case study in importing field. Comput. Ind. 2019, 106, 94–110. [Google Scholar] [CrossRef]
- Sproedt, A.; Plehn, J.; Schönsleben, P.; Herrmann, C. A simulation-based decision support for eco-efficiency improvements in production systems. J. Clean. Prod. 2015, 105, 389–405. [Google Scholar] [CrossRef]
- Maruthi, G.D.; Rashmi, R. Green Manufacturing: It’s Tools and Techniques that can be implemented in Manufacturing Sectors. Mater. Today Proc. 2015, 2, 3350–3355. [Google Scholar] [CrossRef]
- Tian, G.; Zhang, H.; Feng, Y.; Jia, H.; Zhang, C.; Jiang, Z.; Li, Z.; Li, P. Operation patterns analysis of automotive components remanufacturing industry development in China. J. Clean. Prod. 2017, 164, 1363–1375. [Google Scholar] [CrossRef]
- Hanim, A.-R.S.; Novita, S.; Ariffin, R.G.R.; Ramayah, T. The impact of sustainable manufacturing practices on sustainability performance: Empirical evidence from Malaysia. Int. J. Oper. Prod. Manag. 2017, 37, 182–204. [Google Scholar] [CrossRef]
- Diaz-Elsayed, N.; Jondral, A.; Greinacher, S.; Dornfeld, D.; Lanza, G. Assessment of lean and green strategies by simulation of manufacturing systems in discrete production environments. CIRP Ann. 2013, 62, 475–478. [Google Scholar] [CrossRef] [Green Version]
- Govindan, K.; Diabat, A.; Madan Shankar, K. Analyzing the drivers of green manufacturing with fuzzy approach. J. Clean. Prod. 2015, 96, 182–193. [Google Scholar] [CrossRef]
- Stoycheva, S.; Marchese, D.; Paul, C.; Padoan, S.; Juhmani, A.; Linkov, I. Multi-criteria decision analysis framework for sustainable manufacturing in automotive industry. J. Clean. Prod. 2018, 187, 257–272. [Google Scholar] [CrossRef]
- Haider, H.; Hewage, K.; Umer, A.; Ruparathna, R.; Chhipi-Shrestha, G.; Culver, K.; Holland, M.; Kay, J.; Sadiq, R. Sustainability assessment framework for small-sized urban neighbourhoods: An application of fuzzy synthetic evaluation. Sustain. Cities Soc. 2018, 36, 21–32. [Google Scholar] [CrossRef]
- Mardani, A.; Zavadskas, E.K.; Streimikiene, D.; Jusoh, A.; Nor, K.M.D.; Khoshnoudi, M. Using fuzzy multiple criteria decision making approaches for evaluating energy saving technologies and solutions in five star hotels: A new hierarchical framework. Energy 2016, 117, 131–148. [Google Scholar] [CrossRef]
- Yu, W.; Li, B.; Yang, X.; Wang, Q. A development of a rating method and weighting system for green store buildings in China. Renew. Energy 2015, 73, 123–129. [Google Scholar] [CrossRef]
- Deif, A.M. A system model for green manufacturing. J. Clean. Prod. 2011, 19, 1553–1559. [Google Scholar] [CrossRef] [Green Version]
- Gumus, A.T. Evaluation of hazardous waste transportation firms by using a two step fuzzy-AHP and TOPSIS methodology. Expert Syst. Appl. 2009, 36, 4067–4074. [Google Scholar] [CrossRef]
- İnce, M.; Yiğit, T.; Işık, A.H. A hybrid AHP-GA method for metadata-based learning object evaluation. Neural Comput. Appl. 2019, 31, 671–681. [Google Scholar] [CrossRef]

| Experts | Number of Experts | Education | Positional Titles | Employment Position | Working Year |
|---|---|---|---|---|---|
| 3 | Master’s degree | Engineer | Project manager | >7 | |
| 5 | Master’s degree | Engineer | Architect | >10 | |
| 6 | Master’s degree | Engineer | General manager | >14 | |
| 5 | Master’s degree | Senior engineer | Engineering technologists | >16 | |
| 4 | Master’s degree | Senior engineer | Director of engineering | >14 | |
| 4 | Ph.D. Degree | Senior engineer | Sustainability program | >20 | |
| 4 | Ph.D. Degree | Senior engineer | Building environmental and environmental engineering | >18 | |
| 4 | Ph.D. Degree | Senior engineer | Energy assessments | >20 | |
| 5 | Ph.D. Degree | Senior engineer | Architect | >20 |
| Linguistic Terms | Abbreviation | Triangular Neutrosophic Number |
|---|---|---|
| Highly Low Significance | ||
| Low Significance | ||
| Simple Significance | ||
| Intermediate Significance | ||
| Primary Significance | ||
| Highly Robust Significance | ||
| Extremely prioritized |
| Dimensions | |||||
|---|---|---|---|---|---|
| EED () | ــ | HRS | PS | IS | HLS |
| IEQD () | 1/HRS | ــ | EP | LS | SS |
| SSPMD () | 1/PS | 1/EP | ــ | IS | PS |
| MRD () | 1/IS | 1/LS | 1/IS | ــ | HRS |
| WED () | 1/HLS | 1/SS | 1/PS | 1/HRS | ــ |
| Dimensions | |||||
|---|---|---|---|---|---|
| EED () | ــ | ||||
| IEQD () | 1/ | ــ | |||
| SSPMD () | 1/ | 1/ | ــ | ||
| MRD () | 1/ | 1/ | 1/ | ــ | |
| WED () | 1/ | 1/ | 1/ | 1/ | ــ |
| Weights | 0.10 | 0.12 | 0.15 | 0.30 | 0.33 |
| Dimensions | |||||||||||||||||
|---|---|---|---|---|---|---|---|---|---|---|---|---|---|---|---|---|---|
| Weight | 0.10 | 0.12 | |||||||||||||||
| Indicators | |||||||||||||||||
| Local weights | 0.037 | 0.082 | 0.084 | 0.122 | 0.179 | 0.178 | 0.114 | 0.204 | 0.045 | 0.065 | 0.089 | 0.134 | 0.184 | 0.155 | 0.128 | 0.200 | |
| Global weights | 0.003 | 0.008 | 0.008 | 0.012 | 0.017 | 0.017 | 0.011 | 0.020 | 0.005 | 0.007 | 0.010 | 0.016 | 0.022 | 0.018 | 0.015 | 0.024 | |
| Rank | 33 | 29 | 28 | 23 | 19 | 20 | 26 | 15 | 31 | 30 | 27 | 21 | 14 | 18 | 21 | 11 | |
| Dimensions | SSPMD () | MRD () | WED () | ||||||||||||||
| Weight | 0.15 | 0.30 | 0.33 | ||||||||||||||
| Indicators | |||||||||||||||||
| Local weights | 0.038 | 0.082 | 0.080 | 0.129 | 0.156 | 0.178 | 0.139 | 0.198 | 0.069 | 0.149 | 0.228 | 0.194 | 0.360 | 0.086 | 0.092 | 0.351 | 0.471 |
| Global weights | 0.005 | 0.012 | 0.012 | 0.019 | 0.023 | 0.026 | 0.021 | 0.030 | 0.020 | 0.044 | 0.068 | 0.058 | 0.108 | 0.028 | 0.030 | 0.115 | 0.155 |
| Rank | 32 | 24 | 25 | 17 | 13 | 10 | 12 | 7 | 16 | 6 | 4 | 5 | 3 | 9 | 8 | 2 | 1 |
Publisher’s Note: MDPI stays neutral with regard to jurisdictional claims in published maps and institutional affiliations. |
© 2021 by the authors. Licensee MDPI, Basel, Switzerland. This article is an open access article distributed under the terms and conditions of the Creative Commons Attribution (CC BY) license (https://creativecommons.org/licenses/by/4.0/).
Share and Cite
Abdel-Basset, M.; Gamal, A.; Chakrabortty, R.K.; Ryan, M.; El-Saber, N. A Comprehensive Framework for Evaluating Sustainable Green Building Indicators under an Uncertain Environment. Sustainability 2021, 13, 6243. https://doi.org/10.3390/su13116243
Abdel-Basset M, Gamal A, Chakrabortty RK, Ryan M, El-Saber N. A Comprehensive Framework for Evaluating Sustainable Green Building Indicators under an Uncertain Environment. Sustainability. 2021; 13(11):6243. https://doi.org/10.3390/su13116243
Chicago/Turabian StyleAbdel-Basset, Mohamed, Abduallah Gamal, Ripon K. Chakrabortty, Michael Ryan, and Nissreen El-Saber. 2021. "A Comprehensive Framework for Evaluating Sustainable Green Building Indicators under an Uncertain Environment" Sustainability 13, no. 11: 6243. https://doi.org/10.3390/su13116243