Abstract
Forests constitute a key component of the Earth system but the sustainability of the forest reserves in the semi-arid zone is a real concern since its vegetation is very sensitive to the climate fluctuation. The understanding of the mechanisms for the vegetation–climate interaction is poorly studied in the context of African Sahel. In this study, the characteristics of the vegetation response to the fluctuations of precipitation and temperature is determined for the forest reserve of Fina. Rainfall estimates, air temperature and NDVI were re-gridded to a same spatial resolution and standardized with respect to their respective long-term mean. Lag-correlations analysis was used to estimate lag times between changes of climate variables and vegetation response at both seasonal and interannual bases. Results show increasing tendency of NDVI started from the 1990s coinciding the recovery of the rainfall from the 1980s drought, and the obtained correlation (r = 0.66) is statistically significant (p value < 0.01). The strongest responses of vegetation to rainfall and temperature fluctuations were found after 30 and 15 days, respectively. Moreover, at a shorter time lag (e.g., 15 days), more pronounced vegetation responses to both rainfall and temperature were found in agriculturally dominated land while at a longer time lag (e.g., 30 days), a stronger response was observed in Bare-dominated land. The vegetation response to the climate fluctuation is modulated by the land-use/cover dynamics.
1. Introduction
The Sahel is a sub-region of sub-Saharan Africa stretching between about 12° and 18° latitude north and characterized by the transition from the arid conditions of the Sahara-desert and the humid climate from the Guinea coast. The sub-region is undergoing serious impacts of climate variability with high fluctuations in the vegetation [1]. The vegetation–climate interaction is very strong in semi-arid zone as the Sahel. Since 1950, the population in Africa had quadrupled and is projected to quadruple again until the end of the twenty-first century [2]. Enormous population growth and urbanization contribute as factors to alter the ecosystems specially forest [3]. The understanding of the mechanisms of the vegetation–climate interaction remains a challenge, and it is poorly studied in the context of African Sahel.
The tropical semi-arid zone receives a large amount of net radiation and water vapor, and consequently, intense heat and humidity fluxes dominate the interactions between soil and the lower atmosphere [4]. Furthermore, feedbacks of land-surface–atmosphere had been studied over tropical South America at interannual timescales demonstrating linkages among surface air temperature, specific humidity, volumetric soil water content, precipitation and evaporation [5].
Climate change constitutes a shift in meteorological conditions that last for a long period of time usually centuries while climate variability is a short-term fluctuation happening year to year [6]. The United Nations Intergovernmental Panel on Climate Change [7] defines climate variability as ‘any change in climate over time, whether due to natural variability or as a result of human activity’. In sub-Saharan Africa, subsistence agriculture, which is the backbone of economic activity for the majority of the people, is threatened by impacts of long- and short-term climate variability. Existing forest reserves act as buffer zones to reduce the negative impact of climate variability on community livelihoods through regulating the overall ecosystem functionality. Hence, it is crucial to understand the impact of climate variability on existing forest vegetation reserves in order to implement mitigation measures and adaptation strategies for communities to improve their resilience and livelihood conditions. Existing forest reserves are essential in regulating ecosystem functionality through the reduction in CO2 emissions as a result of deforestation. Since forests are altered by both natural and human pressure, it become more complex to evaluate the response of vegetation change from the climate fluctuations. Indeed, the forest reserve of Fina is one of the natural reserves in Mali with limited human activities [3]. Thus, this reserve constitutes a good case for quantifying the extent that vegetation responses to the climate fluctuation.
Forest vegetation is very sensitive to climatic fluctuations and has strong control over the flow of water, carbon and energy between land and atmosphere [8]. It is expected that this flow would alter with the changing climate and rainfed agriculture that is prevalent in Mali. In recent decades, there has been an increased interest to study the effects of climatic change, mainly rainfall and temperature, on existing forest vegetation distribution and ecosystem functions. It is generally agreed that most ecosystems on earth have been modified to various degrees by human disturbance and climate change [3].
Prolonged drought is the greatest threat to livelihoods and ecosystems in forest reserves of Mali and is a leading driver to desertification when combined with increasing human pressure on land resources. Mali is among the fastest growing countries in sub-Saharan Africa with an annual population growth rate of nearly 3% [9] resulting in the conversion of an estimated 100,000 hectare of land each year to cope with the rising food needs according to the Convention on Biological Diversity [10]. The study area, Fina forest reserve of the ‘Boucle de Baoulé’, was very rich in biodiversity thirty years ago and is declining toward degradation in recent years. Studies highlighted that the alteration of the vegetation in Fina forest reserve [1] resulted from a climate deterioration effect (which is drought) and high pressure associated with agricultural and pastoral activities. The vegetation in the Fina forest reserve suffered from effects of the 1980s drought [1] and partially recovered since then due to the presence of good rain (mean annual rainfall 1100 mm). However, the impact of that partial recovery in the rainfall [11] on the trend of the vegetation cover in Fina reserve is not well established. Thus, there is a need to study the relationship of rainfall and climate variability on the vegetation index of the forest reserve in order to provide informed and targeted guidance to decision makers for forest reserve protection.
Many authors [12,13,14] used NDVI to study the response of vegetation dynamics to climate variability. This relation is evaluated at every scale from local to global scales and the results showed a strong relationship between rainfall and vegetation index. Furthermore, various studies obtained positive correlation between vegetation and rainfall for 10 days, month, seasonal and interannual data across the world [14]. Hence, the interaction between vegetation dynamics with climate variability is unavoidable in global change studies according to [15,16].
Studies revealed that land degradation and desertification continue to be the most significant environmental issues in semi-arid area of China, and the vegetation within the transition region is more sensitive to climate change and human activities [17]. Over the Australia mainland, a study revealed that climate conditions had important influences on vegetation growth, and there were also effects of temporal lags of plants growth to climate factors. Results of this previous study show that Western Australia responds to climate factors at long time scales, however to Eastern Australia at short time-scales (with mean value of 6.6 months in totally areas). Moreover, vegetation growth in Australia’s coastal areas is mainly influenced by solar radiation, while precipitation and solar radiation jointly play important roles in central Australia [18]. The response of vegetation to changes in air temperature and precipitation was investigated in a semi-arid zone of Northern China. The lag length of vegetation growth in response to temperature and precipitation was shorter in agriculture areas (~2 months) than the forest-dominant area (3–4 months lag length) [18].
Predicting vegetation response to precipitation and temperature anomalies, particularly during droughts, is of great importance in semi-arid regions, because ecosystem and hydrologic processes depend on vegetation conditions. Vegetation responses to precipitation and temperature were investigated in 10 ecological regions within the semi-arid zone of the Colorado River Basin [19]. This previous study revealed high correlations between lagged Standardized Precipitation Index time series and standardized NDVI: from a 1-month lag in the warm deserts to 2 months in Semi-Arid Highlands and three months in the Plateaus.
A previous study [20] indicated that the water balance is directly influenced by the fluctuation of precipitation and temperature causing changes in soil moisture regime which, in turn, influences plant growth. It is established that in the semi-arid region, the correlation between NDVI and precipitation is highest for a multi-month average and NDVI is controlled by soil moisture in the concurrent month [21]. In addition, temperature has a negative influence on vegetation growth [12]. Many studies have reported on the relationship between rainfall and NDVI, but few touched the lag correlation between them. Similar to rainfall, air temperature’s effect on NDVI was assessed by many authors, but there was few or no studies on the lag correlation between climate factors and vegetation. It was also observed that interannual relationship was assessed while studies omitted the recovered period of vegetation from natural events as drought.
Climate conditions have important influences on vegetation growth, and the effects of temporal lags of plants growth to climate fluctuation are obvious. Predicting vegetation changes due to variations of climate requires a fundamental understanding of lag times between changes in climate and vegetation response. Furthermore, understanding the responses of vegetation dynamics to climate fluctuations at seasonal and multi-annual scales is essential for modeling the mechanisms of terrestrial ecosystem behavior, predicting future vegetation growth, and thus for guiding environmental protection organizations to formulate a reasonable climate policy for climate change. Indeed, vegetation growth is impacted by climate conditions of several consecutive previous periods. Lag time correlations were used to estimate lag times where the vegetation index showed maximum response to precipitation and temperature variability. Findings from this study help to choose appropriate aggregation time of NDVI and climate variables (precipitation and air temperature) for designing accurate climate-based vegetation dynamics models and thus contribute to improving vegetation predictive models using scenarios based on changing climate and variability. Focusing on the Fina forest reserve, the objective of this paper is to determine how NDVI is correlated to rainfall and temperature with the goal of understanding the response of vegetation to the fluctuation of these climate variables. This study addresses three key questions: first, how does vegetation respond to annual rainfall variability? Secondly, at which lag time do vegetations give maximum response to the intra-seasonal fluctuations of precipitation and temperature? Thirdly, are the vegetation response to climate strongly modulated by the land-use/cover dynamics?
2. Materials and Methods
2.1. Study Area
2.1.1. Location and Site Characteristics
The forest reserve of Fina is located in Kita local administration [22], between 13°10′–13°40′ N latitude and 9°30′–9°50′ W longitude (Figure 1). Fina forest reserve covers an area of 136,000 hectare. Rainy season occurs from Mai to October with a maximum rainfall in August. The forest reserve is located between isohyets 800 and 900 mm with an annual mean temperature of 35 °C. The hydrographic in the reserve are an affluent of the Senegal River, Baoulé, and its effluent Kénié (Figure 1b). The soils fertility is relatively weaker and silty texture, which leads to compaction and erosion in the aquifer [23].
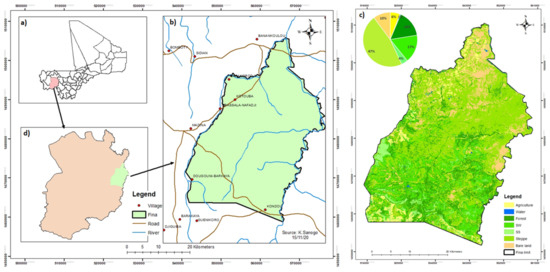
Figure 1.
Map of Mali (a) showing the administrative department of Kita with the indication of the forest reserve of Fina (d). Panel (b) refers to the geographical map of reserve, and panel (c) refers to land-use map with the percentage of land-use and land-cover classes.
2.1.2. Land-Use Map
The study area is classified into seven classes of land uses and covers [3,24]: agriculture, water, bare land, steppe, savanna woodland, shrub savanna and forest. This classification is obtained from 2017 Landsat-8 image, using the maximum-likelihood method, which has the advantage of providing a consistent approach to parameter estimation problems. This method has approximate normal distributions and approximate sample variances that can be used to generate confidence bounds and hypothesis tests for the parameters. Furthermore, the maximum-likelihood method is widely used for the analysis of land-use land cover. Regarding accuracy of the method, the KAPPA is evaluated to 91%. As indicated in Figure 1c, steppe occupied the greatest area among all land-use class with 47%. Steppe cover is characterized by grassy formations, comprising a discontinuous herbaceous carpet and mainly of annual species, sometimes with the presence of woody plants. The woody has low density and height lower than ten meters. Mostly, it is found in the driest zones, with the accesses of the deserts of the Sahara. The smallest area is water body (1%), followed by shrub savannah and agriculture with 4 and 6% respectively.
The stone plateau, characterized by shallow soils, and bushfire effect are aggregated to bare land (10%). Savanna woodland and forest have covered areas of 17% and 16% of the total area. In Figure 1c, it is clearly observed that 83% of Fina forest reserve is occupied by vegetation, while only 17% of water, agriculture and bare land. Most of the agricultural land are located to the northwest and southwest part of the forest reserve.
2.2. Data Description
2.2.1. Rainfall and Air Temperature Data
The African Rainfall Climatology version 2 (ARC2) dataset was used for this study, and it consists of daily data with a spatial domain of 40° S to 40° N in latitude, and 20° W to 55° E in longitude encompassing the African continent from January 1983 to the present. The ARC2 rainfall product consists of blended product obtained by incorporating rain-gauge data, geostationary IR data, and polar-orbiting microwave satellite data [25,26]. The rain-gauge data were firstly spatialized and interpolated onto a 0.1° × 0.1° grid over Africa using the methods of inverse distance weighting. The authors of [11] used many rain gauges data of west Africa to validate ARC2 rainfall products, and significant correlations were found for stations in the Sahel. The land surface temperature from MODIS through its Aqua sensor was used. These data were 1 km spatial resolution, and 8 days composites were available from 2002 to 2017.
2.2.2. Normalized Difference Vegetation Index (NDVI)
The Normalized Difference Vegetation Index (NDVI) uses the red and near-infrared bands of the electromagnetic spectrum for analyses of live green vegetation or not. NDVI is an index which depends on the percentage ground cover of vegetation, ground water, and the amount of biomass. NDVI derived from satellite data is an important indicator that is used to analyze vegetation dynamics and its response to climate variability worldwide [27]. This index is also used to monitor the spatiotemporal vegetation dynamics and eco-climatological studies. Its value ranges between −1 (water bodies) and 1 (dense vegetation). The conventional formula used to compute is as follows:
where NIR and RED denote spectral reflectance in the near-infrared (800–1000 nm) and red (620–750 nm) portions of the electromagnetic spectrum, respectively.
Two distinct datasets of NDVI were acquired from Global Inventory Modelling and Mapping Studies (GIMMS) for the period of 1983–2005 and from Moderate Resolution Imaging Spectroradiometer (MODIS) for the period of 2006–2017 (Table 1).

Table 1.
Description of climate variables, vegetation index and land images used.
2.3. Methods of Analysis
2.3.1. Data Preprocessing
Climatic parameters were downloaded from NOAA website in NetCDF format then processed using R software. The ARC2 product was used to calculate 15 day, monthly, and annual mean rainfall. Fifteen day and monthly mean temperature are calculated form the data derived from MODIS. The land-cover map was produced from Landsat 8 data using maximum-likelihood classification. With the two products of NDVI being at different resolutions, the MODIS NDVI had been transformed and regridded to the resolution of GIMMS data. The two data were standardized with respect to their respective before concatenating them for time series analysis.
2.3.2. Standardized Anomaly
In order to properly compare variables with different scales and units, all data had been standardized with respect to their respective long term mean and standardized deviation. Data had been rescaled by calculating anomalies with respect to their respective long term mean and by standardizing them by their respective standardized deviation (Equation (2)). Thus, there are Standardized Precipitation Index (SPI), standardized normalized difference vegetation index (sNDVI) and maximum temperature index. The method used for calculation of the Standardized Precipitation Index (SPI) and standardized NDVI (sNDVI) is described in [28]. The formulation of the standardization is given by:
where:
x: data series
σ: standard deviation of the whole data series
μ: mean value of the whole data series
Z: standardized anomalies of a year.
2.3.3. Lag-Correlation Analysis
Lag correlation refers to the correlation between two time series shifted in time relative of one to another. Lag correlation is important in studying the relationship between rain fall, temperature and vegetation for two reasons. Firstly, one series may have a delayed response to the other series or perhaps a delayed response to a common stimulus that affects both series. Secondly, the response of one series to the other series or an outside stimulus may be “smeared” in time, such that a stimulus restricted to one observation elicits a response at multiple observations. The simple correlation coefficient between the two series properly aligned in time is inadequate for characterizing the relationship in such situations. In the present study, the lag correlation is established between vegetation index and climate variation at lag 0, lag 1, lag 2 and lag 3, vegetation being led by precipitation and temperature.
Vegetation growth is mainly influenced by climate variables such as temperature, precipitation and solar radiation [29]. Changes in these climate variables have great impacts on vegetation dynamics. However, local vegetation changes also may create feedback on local climate [30,31]. Time-lag-correlation analysis is used to determine common oscillations and significant lags in vegetation response to seasonal and annual precipitation and temperature changes.
The nature of relationship between vegetation and precipitation and air temperature was assessed at various time scales using climate variables leading lag-correlation analysis. The approach consists of determining the lag times between changes in climate variables and the response of vegetation. On an annual basis, time series are produced by averaging the annual mean value over the study domain, and correlation was established between sNDVI and SPI. On seasonal time scales, the lag-correlations were calculated from time-series of 15 day means of both area average and spatial indices.
3. Results
3.1. Spatial Distribution of Rainfall, Temperature and NDVI
Figure 2 shows the spatial variation of the long-term mean of the annual value of rainfall, temperature and vegetation in Fina reserve. Rainfall shows strong spatial variation decreasing from south to north. This observed rainfall gradient is typically the characteristic of West African monsoon which carried moisture from the Gulf of Atlantic Ocean to the sub-region and decrease in intensity northward. The spatial variation of NDVI showed higher vegetation cover in the southern part of the map. The northwest and central part of the forest reserve exhibited lower vegetation index as a result of the pressure induced by agricultural activities, charcoal exploitation and the shallow soils characteristics in some areas. Bare land areas showed a very limited canopy, and it appeared on hill area over the northeast part of the reserve. The NDVI index which depends to reflectance of different vegetation types and steppe class showed lower vegetation index. Temperature varied from 28 to 43 °C with an average of 35 °C. Higher temperature was observed in the northern area, while the lower value was recorded in the southern part of the forest reserve. The variation of vegetation and temperature was in opposite direction as high temperature increased the evapotranspiration, inducing loss in the water available for plant. In sum, the observed distribution of NDVI (maximal in the south and minima in north) is significantly explained by the rainfall precipitation pattern, which is abundant in the south and weak in the north. However, the south–north gradient of the NDVI is in negative agreement with the temperature distribution, which is higher northward.
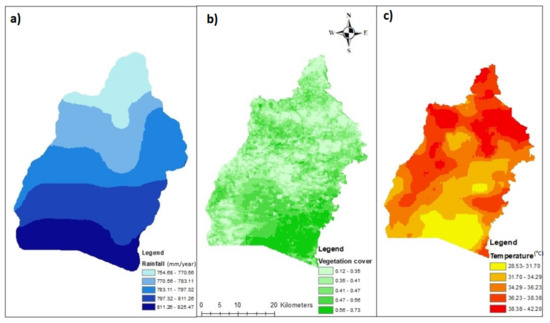
Figure 2.
Maps showing the spatial distribution of rainfall (a), NDVI (b) and temperature (c) over Fina reserve.
3.2. Vegetation Year-to-Year Response to Rainfall Variability
The annual rainfall exhibits strong inter-annual variability and the years of the entire 1980s and half of the 1990s recorded lower than the normal rainfall. This period is known as the Sahel drought which has affected the entire ecosystem across the whole sub-region. During this dry period, vegetation had seriously declined by the negative water budget that resulted from low rainfall and high evapotranspiration. After this period, some partial recovery is observed in the rainfall amount which started around 1998. The 2000s decade recorded higher than normal rainfall except for the years 2006 and 2007, which recorded rainfall amount below normal.
Figure 3 depicts also the time series of vegetation index variation which showed a weaker vegetation cover on the 1980s and 1990s. The NDVI was below normal during the period from 1983 to 2000. It appeared that the vegetation had recovered three years later after the starting of the rainfall recovery. This period corresponded to the regreening of the vegetation over the entire Sahel.
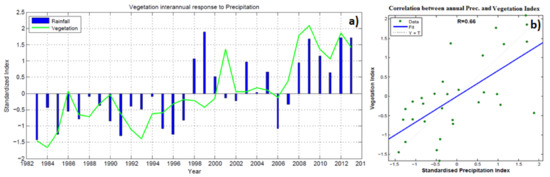
Figure 3.
Time series (a) and linear regression (b) of NDVI and standardized precipitation index from 1983 to 2013 over the Fine forest reserve.
The time series of vegetation and rainfall standardized index (Figure 3) highlighted the strong dependence of vegetation on the rainfall fluctuation. It reveals the weaker resilience capacity of vegetation to drought conditions which are caused by the excessive evapotranspiration under the dry and warm climate conditions of the Sahel. However, after the prolonged period of drought, three years (1998–2000) were sufficient to regenerate the vegetation growth. A positive 3-year lag relationship existed between annual rainfall variability and vegetation growth in the study area, which is remarkably important to consider for any conservation strategies that enhance biodiversity in Fina forest reserve.
The variability of annual rainfall has a major contribution to the interannual dynamics of vegetation in Fina reserve. The linear correlation is evaluated to r = 0.66 and exceeds 99% level of significance. In the semi-arid region under the high temperature and high evapotranspiration, the amount of water available to the plant is strongly influenced by the input rainfall. The variability of annual rainfall constitutes of the primer factor of the annual vegetation dynamics in Fina forest reserve.
3.3. Seasonal Response of Vegetation to Rainfall and Air Temperature Fluctuations
The seasonal variability of the biweekly mean value of rainfall and NDVI for the period of 2006–2013 is indicated in Figure 4. The rainfall amount is very low from November to April, and the NDVI shows a very weak pattern during this dry season accompanied by an excessive high temperature. High vegetation cover appears during the rainy season with the occurrence of rainfall from May to October. The maximum value of rainfall occurred in early August coinciding with the minimum of the temperature while the vegetation index showed a maximum value one month later in September. The lag-correlation analyses involved lag 0 (for the covariation), lag 1 (SPI is two weeks ahead on sNDVI), lag 2 (SPI being four weeks ahead on sNDVI) and lag 3 (SPI being six weeks ahead on sNDVI).
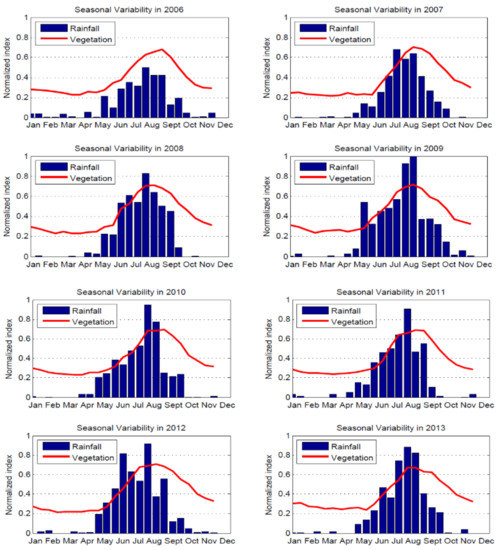
Figure 4.
Seasonal variation of monthly rainfall (histogram) and vegetation index (red line) for individual years from 2006 to 2013.
3.3.1. Relationship between Rainfall and Vegetation at Seasonal
Vegetation and rainfall exhibit similar seasonal pattern (Figure 4) in terms of climatological mean, but from one year to another, the two seasonal patterns may present some discordance. This was observed in 2012 (Figure 4) where the weaker amount of rain in July was not reported in the variation of NDVI.
In addition, in 2007, the peak of rainfall occurred early in July, and consequently, the vegetation index reached its maximum in August. The analysis presented in Figure 4 indicates a lag of two bi-weeks (one month) between the peak of rainfall and vegetation, as the peak of vegetation occurred one month later than the peak of rainfall. Vegetation growth increases progressively and then became stable around August–September. As it reaches its peak then, it starts decreasing in response to the retreat of rains.
The spatial lag correlation between the seasonal vegetation index and rainfall are seen in maps of Figure 5. Correlation coefficients are evaluated between the standardized values SPI and sNDVI from 1983 to 2017. The coefficients from lag-correlation varied from 0.61 to 0.81 for lag 0 and 0.88–0.91; 0.64–0.82 and 0.23–0.50 for lag 1, lag 2 and lag 3, respectively. Lag 2 showed the highest correlation between rainfall and vegetation index.
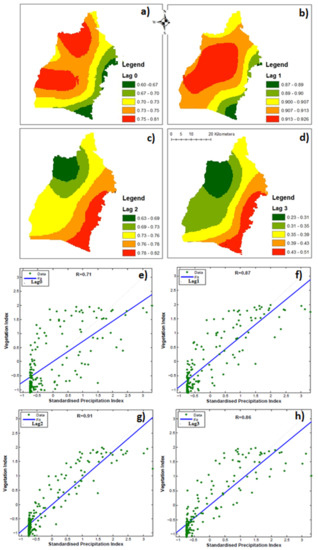
Figure 5.
Maps (a–d) are spatial lag-correlation, and scatterplots (e–h) are temporal lag-correlation between rainfall and NDVI.
For lag 0 and 1, the spatial distribution of the correlation coefficients indicates high correlation in Eastern part of the reserve, which decreases westward; however, the opposite is observed for lag 2 and 3.
Scatterplots in Figure 5 depict the regression line and the correlation coefficients between sNDVI and standardized precipitation index from 1983 to 2017. A high relationship is found between vegetation index and SPI at seasonal scale as vegetation growth is driven by rainfall amount with respect of the seasonal rainy season.
The highest correlation is observed at lag 2 (one month lag). These results revealed that the maximum response of vegetation to rainfall occurred with two bi-weeks (one month) accumulation of rain. The finding is consistent with the one-month delay observed between the peak of the rainfall (early August) and the peak of vegetation index (in September). The inspection of the lag 2 correlation map (Figure 5) revealed stronger response of vegetation to rainfall over the western part of the reserve where forest constituted the dominant land-cover category. At lag 1, the correlation coefficients are stronger in the eastern part of the reserve dominated by agricultural land.
The southeastern border of Fina reserve is limited by a river where low correlation is observed at lag 0 and 1. Indeed, the relationship between vegetation growth and rainfall is a function of soil characteristics. Reserve area with stone and shallow soil as well cultivated soils exhibit a fast response of rainfall (lag 0 and 1) and the response decrease as the lag increases. This observation suggests that these land categories have limited capacity of water retention compared to forest. Furthermore, in the forest area, vegetation shows higher correlation with rainfall at longer lag due to the capacity of soils to accumulate moisture.
3.3.2. Relationship between Vegetation and Temperature
The analysis in Figure 6 represents the seasonal cycle of maximum temperature and NDVI. In the study area the maximum air temperature ranges from 32 to 38 °C. The analysis shows that the highest value of maximum temperature is observed from March to mid-April, while the lowest value of maximum temperature was recorded in August. Furthermore, high value of temperature steadily rises from September to October and declines from November to February, coinciding with the harmattan period in Mali. The seasonal relationship between NDVI and temperature is represented by individual year from 2006 to 2013. Negative relationship exists between air temperature and vegetation index at seasonal time scale. The lowest temperature is recorded in August coinciding with the well-greening state of the vegetation. The highest temperature is observed in April, and the vegetation index presents the lowest value. The temperature during the period from March to May is very high with less moisture in the atmosphere. At this period, the vegetation is strongly degraded, whereas during the rainy season the atmosphere is very moist. As a result, the air temperature drops down, and the vegetation grows remarkably with lower stress from higher temperature and reduced soil evaporation, which in turn results in higher soil moisture storage. Therefore, there is a negative correlation between vegetation and temperature (i.e., scatterplots of Figure 7). Furthermore, the analysis indicated that temperature is a major impacting factor for plant growth with negative effect during the rainy season. The seasonal variation of temperature contributes strongly to NDVI change only at specific times of the growing season.
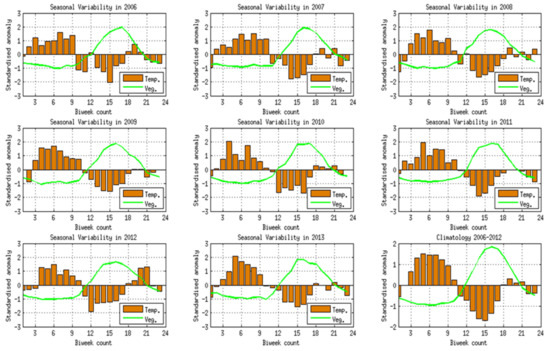
Figure 6.
Seasonal variation of biweekly maximum temperature (histogram) and vegetation index (green line) for individual years from 2006 to 2013.
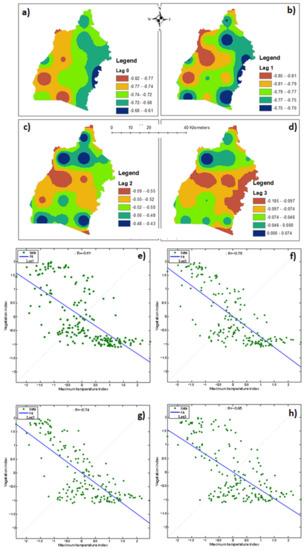
Figure 7.
Maps (a–d) are spatial lag-correlation and scatter-plots (e–h) are temporal lag-correlation between maximum temperature and NDVI.
The scatterplots (Figure 7) show strong negative correlation between the seasonal variations of vegetation in response to temperature fluctuation. The lag 0 correlation gives a coefficient of −0.67 significant at 0.01 level. Lag 1, lag 2 and lag 3 show correlation coefficients of 0.75, 0.74 and 0.65, respectively. All coefficients are statistically significant (p-value < 0.01). The maximum correlation coefficient is observed at lag 1. This observation highlighted the presence of high response of vegetation to the variation of maximum temperature after a period of two weeks. Values are expressly higher in areas surrounding by villages in the western part of the reserve.
The spatial distribution of the correlation coefficient between vegetation and temperature is shown on maps of Figure 7. The scatterplots showed negative correlation between temperature and vegetation at all lags. The highest correlation observed at lag 1 (two weeks later) suggests that the maximum vegetation gives maximum response to temperature fluctuation after the two weeks lag. The inspection of the Lag1-correlation map revealed a stronger response of vegetation to temperature over the western part of the reserve where agricultural land constitutes the dominant land-use category. The vegetation in central and eastern forest of the reserve shows stronger response to temperature later after one month (lag 2). The western area of the reserve, the nearby rural area and agriculture land are the most vulnerable to temperature variation.
4. Discussion
It is obvious that forests constitute a key component of the Earth system; however, in the context of climate change, the sustainability of the forest reserves in the the African semi-arid zone is a real concern since its vegetation is very sensitive to climatic fluctuations [32]. The understanding of the mechanisms driving vegetation dynamics under climate conditions has great scientific socioeconomic advantage, but such complex interactions [33] are poorly studied in the context of the African Sahel.
Results highlighted the spatial difference for the dominant potential climatic constraints on plant growth as indicated by the spatial heterogeneity of correlation map. Similar results had been shown by previous study, where maximum and minimum temperature had different impacts on vegetation growth in the Northern Hemisphere [34,35]. Furthermore, response of vegetation to climate has a temporal lag, as arid and humid vegetation respond to drought on short time scales, whereas, semiarid and sub-humid vegetation respond to drought on long time scales [36]. Over the Australia mainland, the NDVI typically lags behind soil moisture by one month [37].
The increasing tendencies of the NDVI obtained in the forest reserve of Fina confirm previous regional-scale findings that revealed increases in vegetation cover in the growing season across most parts of the Sahel in 2000s [1]. The vegetation dynamics and local rainfall are intrinsically linked, and vegetation dynamics could provide information about climatic state, such as drought conditions. This can explain the use of NDVI for predictions and impact assessments of disturbances such as drought [34,38].
Rainfall is the most important constraint to vegetation growth in the semi-arid zone. The variability of annual rainfall is a prime factor of the inter-annual vegetation dynamics, and the coefficients of correlation obtained are slightly higher than the correlation found by previous studies at a regional scale over western [39,40,41]. This difference in the correlation may be interpreted by the scale difference when comparing western Sahel region to the catchment scale of the forest reserve of Fina.
In this study, the maximum correlation between the biweekly values of NDVI and precipitation is found for a lag 2 period (one month), revealing that the vegetation gives a maximum response to rainfall fluctuation after one month. This finding is in line with a previous study suggesting that NDVI during the growing season is influenced by rain-fall not only in the concurrent month but also rainfall accumulated in the preceding months [1]. This aspect is strongly supported by trends in soil moisture variation that indicate an accumulated lag in preceding months. Furthermore, other findings from investigation of relationship between rainfall and vegetation Index by using NO-AA/AVHRR Satellite Images [42] revealed that the best correlation between NDVI and rainfall is one month lag-time. However, it has been demonstrated that the response of NDVI to rainfall in the semi-aid region is not linear [43]. The response tends to be stronger within the condition of limited water availability, as more significant correlation between vegetation and rainfall variability from denoised time series was associated to the Amazon drought [44]. In addition, the low capacity of water retention of soils can explain the significance of the vegetation response to the rainfall fluctuation [45,46].
The negative correlation between NDVI and maximum temperature could have resulted from the direct inhibition of photosynthesis or the inhibition of plant growth due to water stress or the association of lower temperatures with cloud cover during precipitation events. The present analysis cannot distinguish the causes of the observed negative correlation between vegetation growth and air temperature fluctuation. Results which are in line with several previous studies [11] revealed that the vegetation response to the variation of air temperature is maximal after two weeks period.
Results regarding the negative correlation between NDVI and air temperature are arguable since previous study [19] in similar semi-arid climatic condition revealed that temperature anomalies were negatively correlated to NDVI in the lower river basin of Colorado and positively correlated in the upper river basin of Colorado.
These results corroborate with the study on the response of vegetation to changes in air temperature, and precipitation was investigated in a semi-arid zone of Northern China where the lag length of vegetation growth in response to temperature and precipitation was shorter in agriculture areas (~2 months) than the forest-dominant area (3–4 months lag length) [18].
This study has contributed to a better understanding of the inter-annual between vegetation and climatic variables in local scale. The relationship between vegetation growth and rainfall is a function of soil characteristics. Reserve area with stone and shallow soil as well cultivated soils exhibit a fast response of rainfall (lag 0 and 1), and the response decreases as the lag increases. This observation suggests that these land categories have limited capacity of water retention compared to forest. Furthermore, in forest area, vegetation shows higher correlation with rainfall at longer lag due to the capacity of soils to accumulate moisture. Nevertheless, further study incorporating soils data is recommendable since NDVI was found to be controlled by soil moisture of the concurrent month [15,16].
Previous studies [47,48] indicated the complexity and the significance of the relationship between the NDVI and various climate variables (rainfall, maximum temperature and minimum temperature etc.). To argue in the same way as other authors [49], more understanding on vegetation response to climate factors is required. We suggest further analysis involving the interactions between temperature, precipitation and other factors (such as evapotranspiration and soil moisture), which are more closely related to the NDVI throughout the season.
5. Summary
Applying a lag-correlation approach between fluctuations of vegetation and climate variables at both seasonal and inter-annual bases, the present study has determined the characteristics of the vegetation response to the fluctuations of precipitation and temperature for the forest reserve of Fina, and the results are examined in the context of the existing land-use/-cover classification of the forest reserve. The conclusions of this study are as follows:
On an annual time scale, the study revealed increasing tendency of vegetation cover started from the 1990s coinciding to the recovery of the West Sahelian rainfall from the 1980s drought. Strong relationship is found between the annual rainfall and NDVI, and the obtained correlation (r = 0.66) exceeds the 99% level of significant (p-value < 0.01). On a seasonal time-scale, the strongest responses of vegetation to rainfall and temperature fluctuations were found at 30 and 15-day lag, respectively. Moreover, at shorter time lags (15 days), more pronounced vegetation responses to both rainfall and temperature were found in agricultural dominated land, while at longer time lags (30 days), a stronger response was observed in Bare-dominated land.
Indeed, human activities within the forest as agriculture and forest exploitation are found to be a factor contributing to the vulnerability of the forest vegetation to the fluctuation of rainfall and temperature. In sum, the modulation of vegetation response to the climate fluctuation by land-use/-cover categories is obvious in Fina forest reserve; nevertheless, the study of this land surface process contributes to the understanding of vegetation–climate interactions which could be used by natural resource planners in the protection of forest reserves.
Author Contributions
All authors have substantially contributed to the paper. Data curation, K.S.; formal analysis, S.S.; methodology, S.S.; supervision, A.A. and A.B.; validation, B.Z.B.; writing—original draft, K.S. All authors have read and agreed to the published version of the manuscript.
Funding
This research received no external funding.
Institutional Review Board Statement
Not applicable.
Informed Consent Statement
Not applicable.
Data Availability Statement
Special recognition goes to USGS Earth Resources Observation & Science Center (EROS) for the free provision of LANDSAT images for this work. The ARC2 rainfall product was developed par climate prediction center (CPC) in response to the need for higher-resolution operational daily rainfall estimates to support the humanitarian aid programs of the U.S. Agency for International Development (USAID)/Famine Early Warning Systems Network (FEWS-NET). The NDVI data used are created within the framework of the Global Inventory Monitoring and Modeling System (GIMMS) project and Moderate Resolution Imaging Spectroradiometer (MODIS). All the products were available through the web site of IRI http://iridl.ldeo.columbia.edu/SOURCES (accessed on 3 April 2021).
Acknowledgments
Authors thank the International Science Programme (ISP/IPPS) through the Laboratoire d’Optique de Spectroscopie et des Sciences de l’Atmosphere (LOSSA) at the Faculty of Sciences and Technology for the use of their data and facilities. This work was supported by the CGIAR program on Water, Land and Ecosystem (WLE) and the Africa Research in Sustainable Intensification for the Next Generation (Africa RISING) project in Mali. The authors are very grateful to the financial support provided by the International Water Management Institute (IWMI) and the United States Agency for Development (USAID) through the International Institute of Tropical Agriculture (IITA).
Conflicts of Interest
The authors declare no conflict of interest.
References
- Herrmann, S.M.; Anyamba, A.; Tucker, C.J. Recent trends in vegetation dynamics in the African Sahel and their relationship to climate. Glob. Environ. Chang. 2005, 15, 394–404. [Google Scholar] [CrossRef]
- United Nations Development Programme. Human Development Report; UNDP: New York, NY, USA, 2015. [Google Scholar]
- Diallo, H.; Bamba, I.; Sabas, B.Y.S.; Visser, M.; Ballo, A.; Mama, A.; Bogaert, J. Effets combinés du climat et des pressions anthropiques sur la dynamique évolutive de la végétation d’une zone protégée du Mali (Réserve de Fina, Boucle du Baoulé). Sécheresse 2011, 22, 97–107. [Google Scholar]
- Wohl, E.; Barros, A.; Brunsell, N.; Chappell, N.A.; Coe, M.T.; Giambelluca, T.W.; Goldsmith, S.T.; Harmon, R.S.; Hendrickx, J.M.H.; Juvik, O.J.; et al. The hydrology of the humid tropics. Nat. Clim. Chang. 2012, 2, 655–662. [Google Scholar] [CrossRef]
- Bedoya-Soto, J.M.; Poveda, G.; Sauchyn, D. New Insights on Land Surface-Atmosphere Feedbacks over Tropical South America at Interannual Timescales. Water 2018, 10, 1095. [Google Scholar] [CrossRef]
- De Steiguer, J.E.; Burroughs, W.J. Climate Change: A Multidisciplinary Approach. Environ. Hist. 2002, 7, 134–135. [Google Scholar] [CrossRef]
- IPCC. Fourth Assessment Report (AR4) on Climate Change 2007: Synthesis Report; Technical Report; The Intergovernmental Panel on Climate Change: Geneva, Switzerland, 2007. [Google Scholar]
- Rousvel, S.; Armand, N.; Andre, L.; Tengeleng, S.; Alain, T.S.; Armel, K. Comparison between Vegetation and Rainfall of Bioclimatic Ecoregions in Central Africa. Atmosphere 2013, 4, 411–427. [Google Scholar] [CrossRef]
- UNESA. World Urbanization Prospects: The 2003 Revision, Sales No. E.04.XIII.6; UNESA Population Division: New York, NY, USA, 2005. [Google Scholar]
- McNeely, J.A. Human dimensions of invasive alien species. Convention on Biological Diversity News. January/March 2001. Available online: https://www.cbd.int/doc/newsletters/news-letter-01-03-2001.pdf (accessed on 21 April 2021).
- Sanogo, S.; Fink, A.H.; Omotosho, J.A.; Ba, A.; Redl, R.; Ermert, V. Spatio-temporal characteristics of the recent rainfall recovery in West Africa. Int. J. Clim. 2015, 35, 4589–4605. [Google Scholar] [CrossRef]
- Adepoju, K.; Adelabu, S.; Fashae, O. Vegetation Response to Recent Trends in Climate and Landuse Dynamics in a Typical Humid and Dry Tropical Region under Global Change. Adv. Meteorol. 2019, 2019, 4946127. [Google Scholar] [CrossRef]
- Georganos, S.; Abdi, A.M.; Tenenbaum, D.E.; Kalogirou, S. Examining the NDVI-rainfall relationship in the semi-arid Sahel using geographically weighted regression. J. Arid Environ. 2017, 146, 64–74. [Google Scholar] [CrossRef]
- Dagnachew, M.; Kebede, A.; Moges, A.; Abebe, A. Effects of Climate Variability on Normalized Difference Vegetation Index (NDVI) in the Gojeb River Catchment, Omo-Gibe Basin, Ethiopia. Adv. Meteorol. 2020, 2020, 8263246. [Google Scholar] [CrossRef]
- Ning, W.; Liu, W.; Lin, W.; Song, X. NDVI variation and its responses to climate change on the northern loess plateau of China from 1998 to 2012. Adv. Meteorol. 2015, 2015, 725427. [Google Scholar] [CrossRef]
- Huang, C.; Li, Y.; Liu, G.; Zhang, H.; Liu, Q. Recent climate variability and its impact on precipitation, temperature, and vegetation dynamics in the Lancang River headwater area of China. Int. J. Remote Sens. 2014, 35, 2822–2834. [Google Scholar] [CrossRef]
- Qi, Y.; Wang, J.; Yan, C.; Xu, Z. Vegetation Dynamics in Arid and Semi-Arid Ecotone: A Case Study in Yanchi County. In Proceedings of the IGARSS 2008—2008 IEEE International Geoscience and Remote Sensing Symposium, Boston, MA, USA, 8–11 July 2008. [Google Scholar]
- Wu, Y.; Zhang, X.; Fu, Y.; Hao, F.; Yin, G. Response of Vegetation to Changes in Temperature and Precipitation at a Semi-Arid Area of Northern China Based on Multi-Statistical Methods. Forests 2020, 11, 340. [Google Scholar] [CrossRef]
- Cañón, J.; Domínguez, F.; Valdes, J.B. Vegetation responses to precipitation and temperature: A spatiotemporal analysis of ecoregions in the Colorado River Basin. Int. J. Remote Sens. 2011, 32. [Google Scholar] [CrossRef]
- Wang, J.; Rich, P.M.; Price, K.P. Temporal responses of NDVI to precipitation and temperature in the central Great Plains, USA. Int. J. Remote Sens. 2003, 24, 2345–2364. [Google Scholar] [CrossRef]
- Farrar, T.J.; Nicholson, S.E.; Lare, A.R. The influences of soil type on the relationships between NDVI, rainfall, and soil moisture in semiarid Botswana. II. NDVI response to soil moisture. Remote Sens. Environ. 1994, 50, 121–133. [Google Scholar] [CrossRef]
- Nasi, R. La Végétation du Centre Régional D’Endémisme Soudanien au Mali. Etude de la forêt Des Monts Mandingues ET Essai de SynthèSE. Ph.D. Thesis, Université de Paris-Sud, Paris, France, 1994. [Google Scholar]
- Coulibaly, T.; Heringa, A.C.; Wijingaarden, W. Région du Baoulé: Environnement et végétation. Projet Recherche pour l’utilisation rationnelle du gibier au Sahel. Aust. Range Land J. 1988, 9, 14–20. [Google Scholar]
- Sanogo, K.; Abdulkadir, A.; Okhimamhe, A.A.; Diakité, C.H. Spatio-temporal Change in Land Use and Land Cover: Implications for Conservation of Fina Faunal Reserve in Mali. NJTR 2015, 10. [Google Scholar] [CrossRef]
- Love, T.B.; Kumar, V.; Xie, P.; Thiaw, W. A 20-year daily Africa precipitation climatology using satellite and gauge data. In Proceedings of the 84th AMS Annual Meeting, Seattle, WA, USA, 11–15 January 2004. [Google Scholar]
- Novella, N.S.; Thiaw, W.M. African Rainfall Climatology Version 2 for famine early warning systems. J. Appl. Meteor. Climatol. 2013, 52, 588–606. [Google Scholar] [CrossRef]
- Nicholson, S. On the question of the “recovery” of the rains in the West African Sahel. J. Arid Environ. 2005, 63, 615–641. [Google Scholar] [CrossRef]
- Wilks, D.S. Empirical Distributions and Exploratory Data Analysis. In Statistical Methods in the Atmospheric Sciences; Academic Press, Inc.: San Diego, CA, USA, 1995. [Google Scholar]
- Nemani, R.R.; Keeling, C.D.; Hashimoto, H.; Jolly, W.M.; Piper, S.C.; Tucker, C.J.; Myneni, R.B.; Running, S.W. Climate-Driven Increases in Global Terrestrial Net Primary Production from 1982 to 1999. Science 2003, 300, 1560–1563. [Google Scholar] [CrossRef]
- Jiang, B.; Liang, S. Improved vegetation greenness increases summer atmospheric water vapor over Northern China. J. Geophys. Res. Atmos. 2013, 118, 8129–8139. [Google Scholar] [CrossRef]
- Bonan, G.B. Forests and Climate Change: Forcings, Feedbacks, and the Climate Benefits of Forests. Science 2008, 320, 1444–1449. [Google Scholar] [CrossRef]
- Kalisa, W.; Igbawua, T.; Henchiri, M. Assessment of climate impact on vegetation dynamics over East Africa from 1982 to 2015. Sci. Rep. 2019, 9. [Google Scholar] [CrossRef] [PubMed]
- Wang, X.; Piao, S.; Ciais, P.; Li, J.; Friedlingstein, P.; Koven, C.; Chen, A. Spring temperature change and its implication in the change of vegetation growth in North America from 1982 to 2006. Proc. Natl. Acad. Sci. USA 2011, 108, 1240–1245. [Google Scholar] [CrossRef]
- Singh, R.P.; Roy, S.; Kogan, F. Vegetation and temperature condition indices from NOAA AVHRR data for drought monitoring over India. Int. J. Remote Sens. 2003, 24, 4393–4402. [Google Scholar] [CrossRef]
- Peng, S.; Piao, S.; Ciais, P.; Myneni, R.B.; Chen, A.; Chevallier, F.; Dolman, A.J.; Janssens, I.A.; Penuelas, J.; Zhang, G.; et al. Asymmetric effects of daytime and night-time warming on Northern Hemisphere vegetation. Nat. Cell Biol. 2013, 501, 88–92. [Google Scholar] [CrossRef] [PubMed]
- Vicente-Serrano, S.M.; Gouveia, C.; Camarero, J.J.; Beguería, S.; Trigo, R.; López-Moreno, J.I.; Azorin-Molina, C.; Pasho, E.; Lorenzo-Lacruz, J.; Revuelto, J.; et al. Response of vegetation to drought time-scales across global land biomes. Proc. Natl. Acad. Sci. USA 2013, 110, 52–57. [Google Scholar] [CrossRef]
- Wu, N.; Zhao, X.; Zhao, W.; Tang, B.; Xu, W. Response of vegetation to temperature, precipitation and solar radiation time-scales: A case study over mainland Australia. In Proceedings of the 2014 IEEE Geoscience and Remote Sensing Symposium, Quebec City, QC, Canada, 13–18 July 2014. [Google Scholar]
- Singh, D. Evaluation of long-term NDVI time series derived from Landsat data through blending with MODIS data. Atmósfera 2011, 25, 43–63. [Google Scholar]
- Fensholt, R.; Rasmussen, K.; Kaspersen, P.; Huber, S.; Horion, S.; Swinnen, E. Assessing land degradation/recovery in the African Sahel from long-term Earth observation based primary productivity and precipitation relationships. Remote Sens. 2013, 5, 664–686. [Google Scholar] [CrossRef]
- Anyamba, A.; Edwin, W.; Compton, J.; Tucker, P.J.; Small, L. Thirty-two Years of Sahelian Zone Growing Season Non-Stationary NDVI3g Patterns and Trends. Remote Sens. 2014, 6, 3101–3122. [Google Scholar] [CrossRef]
- MEA. Rapport National sur L’état de L’environnement 2009; Ministère de l’Environnement et de l’Assainissement: Paris, France, 2010.
- Hashemi, S.A. Investigation of Relationship between Rainfall and Vegetation Index by Using NOAA/AVHRR Satellite Images. World Appl. Sci. J. 2011, 14, 1678–1682. [Google Scholar]
- Propastin, P.; Kappas, M. Spatial Response of Vegetation to Precipitation in Dry Lands of Kazakhstan: Combination of Remote Sensing Data with Climate Records. Int. J. Nat. Eng. Sci. 2008, 2, 139–146. [Google Scholar]
- Zhao, W.; Zhao, X.; Zhou, T.; Wu, D.; Tang, B.; Wei, H. Climatic factors driving vegetation declines in the 2005 and 2010 Amazon droughts. PLoS ONE 2017, 12, e0175379. [Google Scholar] [CrossRef]
- Qiu, B.; Li, W.; Zhong, M.; Tang, Z.; Chen, C. Spatio-temporal analysis of vegetation variability and its relationship with climate change in China. Geo. Spat. Inf. Sci. 2014, 17, 170–180. [Google Scholar] [CrossRef]
- Bao, G.; Qin, Z.; Bao, Y.; Zhou, Y.; Li, W.; Sanjjav, A. NDVI-Based Long-Term Vegetation Dynamics and Its Response to Climatic Change in the Mongolian Plateau. Remote Sens. 2014, 6, 8337–8358. [Google Scholar] [CrossRef]
- Bradley, R.C. The effects of climatic factors on vegetation dynamics of tall-grass and short grass cover. Geocarto Int. 2000, 15, 33–38. [Google Scholar]
- Xu, Y.; Yang, J.; Chen, Y. NDVI-based vegetation responses to climate change in an arid area of China. Theor. Appl. Clim. 2015, 126, 213–222. [Google Scholar] [CrossRef]
- Srivastava, S.K.; Jayaraman, V.; Nageswara Rao, P.P.; Manikiam, B.; Chandraskehar, G. Inter-linkages of NO-AA/AVHRR derived integrated NDVI to seasonal precipitation and transpiration in dryland tropics. Int. J. Remote Sens. 1997, 18, 2931–2952. [Google Scholar] [CrossRef]
Publisher’s Note: MDPI stays neutral with regard to jurisdictional claims in published maps and institutional affiliations. |
© 2021 by the authors. Licensee MDPI, Basel, Switzerland. This article is an open access article distributed under the terms and conditions of the Creative Commons Attribution (CC BY) license (https://creativecommons.org/licenses/by/4.0/).