Abstract
Leak detection and repair (LDAR) plays an important role in controlling the fugitive emission of volatile organic compound (VOC) from chemical enterprises. At present, many policies and standards issued in China have set clear requirements for implementing LDAR in the pharmaceutical industry. In this study, the LDAR work of nine typical pharmaceutical enterprises was selected for analysis to allow investigation of the characteristics of VOC emissions from leaking equipment components. Some suggestions for controlling VOC are proposed to provide a reference for managing the fugitive emissions of VOC from pharmaceutical enterprises. The results showed that the number of equipment components used by the pharmaceutical enterprises ranged from several thousand to more than 20,000, which is lower than that in oil refining and coal chemical enterprises. The predominant leaky component was the flange, which accounted for 56.31% of the total, followed by connectors (21.51%) and valves (18.53%). Light liquid medium components accounted for the largest proportion of equipment (52.83%) on average, followed by gas medium components (45.52%, on average). Heavy liquid medium components, which are rarely used in pharmaceuticals, accounted for only 1.65%. The average leak ratio of the components in the pharmaceutical industry was approximately 0.99%. The leak ratio of the open-ended line was much higher than that of other types of components, reaching an average of 5.00%, while that value was only 0.92% for the flange, despite the numbers and proportion of them that were in use. The total annual VOC leakage from the nine pharmaceutical enterprises studied in this work was 20.11 tons, with an average of 2.23 tons per enterprise and an average of 0.22 kg/a per equipment component. Flanges, connectors, and valves were the top three contributors to leakage, generating 39.17%, 38.72%, and 16.79% of the total, respectively, and a total proportion of 94.68%. Although the number of pumps accounted for only 0.15% of the components, it generated 1.94% of the leakage. In terms of different production processes, the greatest unit product leakage came from the bulk production of chemicals used for pharmaceuticals, reaching 0.085 t/a. The production from traditional Chinese medicine enterprises was the lowest (0.011 t/a), which was only 12.80% of the leakage from the bulk production of chemicals for drugs. The leakage of VOC from the equipment components in the nine enterprises was reduced, to varying degrees, using LDAR. The overall reduction ratio was between 23.55% and 67.72%, with an average of 44.02%. The reduction in leakage was relatively significant after the implementation of LDAR; however, there is still room for improvement. Pharmaceutical enterprises should improve their implementation of LDAR and reduce VOC leakage by reducing the number of inaccessible components used and increasing the repair ratio of leaky components. Controlling the source of component leakage, which should be emphasized, can be realized by cutting down the number of components used, adopting low-leakage equipment, and putting anti-leakage measures in place.
1. Introduction
In recent years, great efforts have resulted in continuous improvement of the air quality in China [1,2]. However, ozone (O3) and haze pollution remain serious issues. In 2019, the number of days on which O3 and PM2.5 were primary pollutants accounted for 41.8% and 45.0%, respectively, of the total polluted days [3,4,5]. Volatile organic compound (VOC) are the key precursors of O3 and PM2.5 [6,7,8], and effective reduction of VOC emissions is essential for preventing the generation of O3 and PM2.5, and thus protecting blue skies [9,10,11,12].
VOC emissions have both anthropogenic and natural sources [13,14,15,16]. In urban areas, the contribution of anthropogenic emissions is relatively greater than that of natural sources [17,18,19]. Research shows that emissions of industrial VOC account for more than half of anthropogenic VOC emissions in China [20,21,22], with road traffic and biomass combustion being the other main contributors to anthropogenic emissions [23,24,25,26,27]. The pharmaceutical industry, a branch of the fine organic chemicals industry, is one of the key industries for VOC emissions. The use of solvents in this industry means that leakage from production equipment can result in fugitive VOC emissions, which is an important form of VOC emissions from the pharmaceutical industry [28,29,30]. According to a study of VOC emissions from synthetic organic chemical manufacturing industry facilities, equipment leakage accounts for 40–60% of the total VOC emissions from a plant [31]. Chinese national standards and policy documents such as the Emission Standard of Air Pollutants for Pharmaceutical Industry (GB37823-2019) have considered leak detection and repair (LDAR) technology as a basic but important measure for controlling fugitive VOC emissions from the pharmaceutical industry.
This study focuses mainly on the characteristics of VOC leakage in the pharmaceutical industry via comprehensive analysis of LDAR data from nine typical pharmaceutical enterprises. The purpose of this study is to support the control of VOC emissions resulting from equipment leakage under the newest policy requirements, thereby paving the way for controlling fugitive VOC emissions from the pharmaceutical industry.
2. Overview of VOC Emissions in the Pharmaceutical Industry
According to the Industrial Classification for National Economic Activities (GB/T 4754-2017), the pharmaceutical industry (C27) includes the production of chemical bulk drug (C271), production of chemical drug preparation (C272), processing of Chinese herbal pieces (C273), production of traditional Chinese medicine (C274), production of veterinary medicine (C275), manufacturing of biological pharmaceutical products (C276), production of hygienic materials (C277), and production of medicine excipients (C278). At present, China is a major global producer of pharmaceuticals, with approximately 8000 enterprises that can produce more than 1600 kinds of chemical bulk drugs and more than 4000 kinds of pharmaceutical preparations [32].
The main production technologies used by the pharmaceutical industry include fermentation, extraction, chemical synthesis, preparation of chemical drug, bioengineering, and those used to produce traditional Chinese medicine; all of these are characterized by a wide range of raw and auxiliary materials, complex production processes, and various forms of emissions and gas components. VOC emissions come mainly from enterprises that manufacture chemical and biological pharmaceuticals, with emissions from chemical bulk drug production processes (including fermentation and chemical synthesis) being relatively large and those from prepared products being relatively small. In terms of the production processes, fugitive VOC emissions were found to be caused by leaks from centrifugal separation, filtration, vacuum, solvent recovery, and drying equipment; of these, pipeline components were found to be particularly significant, accounting for more than 70% of the total fugitive emissions [33,34]. The primary VOC emitted include strong carcinogens such as trichloroethylene, benzene, and formaldehyde; highly toxic materials such as acrolein and dimethyl sulfate; photochemically active substances such as methylbenzene, xylene, dimethyl sulfoxide, and tetrahydrofuran; and other substances including methanol and dichloromethane [35,36].
3. Requirements to Control VOC Leaks from Equipment
LDAR is a universal method for controlling VOC emissions from leaking equipment. LDAR has been adopted to control emission leaks from petrochemical equipment in the United States (US) since the early 1980s [37]. Next, the European Union proposed that member states use LDAR, which it regarded as the best available technology for controlling VOC, in petrochemical enterprises in the 1990s. In 1990, the US Clean Air Act Amendments forced petrochemical and chemical enterprises to implement LDAR technology; in the 15 subsequent years, the VOC emissions of these industries in the US decreased by 63% and 56%, respectively [38,39]. Implementing LDAR contributed greatly to the reduction of fugitive VOC emissions in chemical enterprises. In 1998, the US issued the Pharmaceuticals Production Industry: National Emission Standards for Hazardous Air Pollutants (63 FR 50279) guidelines, which explicitly required the use of LDAR for all pipe fittings and equipment that came into contact with hazardous air pollutants (HAPs); this was a way of preventing leaks in the pharmaceutical industry. However, LDAR implementation for equipment leaks occurred relatively late in China. The policies and standard documents related to LDAR implementation by the pharmaceutical industry that are currently available were sorted into chronological order and are presented, along with their specific implementation requirements, in Table 1.

Table 1.
National and local requirements for the implementation of LDAR by the pharmaceutical industry in China.
4. Characteristics of VOC Emissions Derived from Equipment Leaks
In China, the regions of Jiangsu, Zhejiang, Guangdong, Jiangxi, and Shanghai all have relatively developed pharmaceutical industries and are also where LDAR was implemented early. Considering the availability of LDAR data from these regions, as well as the representativeness of the type and scale of the products made in each, nine pharmaceutical enterprises that implemented LDAR technology and that were based in these above regions were selected for this research. Their products included chemical bulk drugs, pharmaceutical intermediates, preparation of chemical drugs, biotin, Chinese herbal pieces, and Chinese patent medicines; the scale of production ranged from 30 to 230 t/a (Table 2). The data used in the subsequent analysis in this study are all from the 2019 LDAR implementation records from these nine enterprises.
Table 2.
Production scales and types of products made by the enterprises investigated in this study.
4.1. Basic Situation
4.1.1. Number of Components
According to the statistics from the nine enterprises (Table 3), the number of equipment components ranges from several thousand to more than 20,000, with a minimum of 3521, a maximum of 22,436, and an average of 10,908. The difference might be associated with different production mechanisms.
Table 3.
Number and distribution of equipment components in the nine enterprises investigated in this study.
Components for which routine detection is difficult due to physical factors such as spatial distance, being buried, and narrow dimensions, all of which are known as hard-to-detect components, and those unavailable for routine detection owing to safety factors such as radiation and isolation are called dangerous-to-detect components; all of these are collectively referred to as inaccessible components. There were marked differences in the number and proportion of inaccessible components used among the nine enterprises. The maximum and minimum numbers of inaccessible components were 1594 and 128, respectively, and their proportions ranged from 3.17% to 9.51%. The proportion of inaccessible components is one of the indicators used to evaluate the level of LDAR implementation by an enterprise. According to the Guide for Leak Detection and Repair in Petrochemical Enterprises, issued by the Chinese Ministry of Ecology and Environment in 2015, the inaccessible components in new equipment should not exceed 3%. Therefore, a higher inaccessible percentage implies that the enterprises are not implementing the requirements of the official regulations well, and their level of LDAR implementation still needs to be improved. Inaccessible components were not included in the analysis in the following discussion because there were no actual detection data for them.
The pharmaceutical industry has relatively few components compared with other typical industries that require the implementation of LDAR (Figure 1, with data from [40]), including the oil refining and coal chemical industries, but slightly more components than the paint and pesticide manufacturing industries. In general, more components means more potential emissions. Therefore, in addition to the oil refining and coal chemical industries, the control of leakage from the pharmaceutical industry should receive corresponding attention.

Figure 1.
Comparison of the numbers of components in typical industries that require the implementation of LDAR technology.
4.1.2. Distribution of Different Types of Components in Nine Pharmaceutical Enterprises
The distribution of different types of components in the nine enterprises investigated in the study was statistically analyzed (Table 4, Figure 2). In general, flanges are the primary components, accounting for 56.31% of the total components; they are followed by connectors and valves, which account for 21.51% and 18.53%, respectively, of the total. Together, these three account for 96.35% of the total and are the predominant components in terms of the total quantity. Other components, namely, open-ended lines, agitators, pumps, and others, account for 2.97%, 0.26%, 0.26%, and 0.15%, respectively, of the total.
Table 4.
Number of different types of equipment components in the nine enterprises investigated in this study.
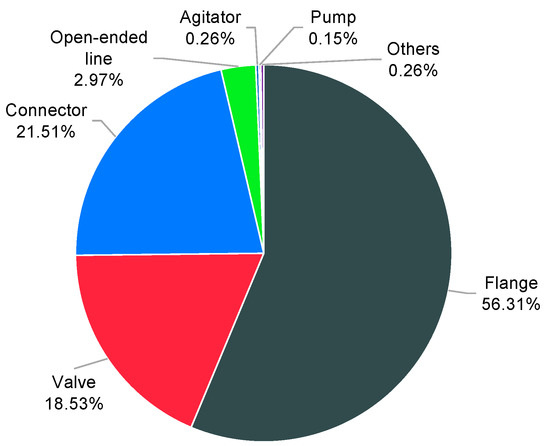
Figure 2.
Proportions of different types of components, of the total, in the nine enterprises investigated in this study.
The media of the equipment components included gas and both light and heavy liquids. According to the Guide for Leak Detection and Repair in Petrochemical Enterprises, the term gas refers to VOC-related materials in a gaseous state under normal processing conditions. Light liquids refer to materials in a liquid state under normal processing conditions at a vapor pressure greater than 0.3 kPa (at 20 °C) and VOC with a mass fraction greater than 20%. Heavy liquids refer to VOC-related materials other than gas and light liquids.
The proportions of liquid and gas components were similar in terms of types of media. The light liquid, gas, and heavy liquid components used by the nine enterprises accounted for 52.83%, 45.52%, and 1.65%, respectively, of the total components. The distribution of the components for different types of media in different enterprises is shown in Figure 3.

Figure 3.
Distribution of components for different types of media in the nine enterprises investigated in this study.
4.2. Leak Characteristics
4.2.1. Leak Ratio
Overall Leak Ratio
Leak ratio is an important indicator of the equipment leak management level in an enterprise and the effectiveness of LDAR implementation. It refers to the percentage of leaking components in a certain equipment type out of the total number of components of this type (the components referred to here are those whose threshold concentration for leakage is higher than the standard specified value; in China, it is 2000 μmol/mol for gas and light liquids, and 500 μmol/mol for heavy liquids).
Table 5 lists the leak ratio data for the components used in the nine enterprises investigated in this study. The leak ratios of VOC from these enterprises ranged from 0.11% to 2.43% with an average of 0.99%. This means that 1 out of 100 components, on average, is leaking. Combined with the type of components shown in Table 4, enterprises C, D, and E have higher leak ratios while there were no distinctly predominate leaking components. This might be due to the complex production processes.
Table 5.
Leak statistics for the nine enterprises investigated in this study.
Leak Ratios of Different Types of Component
The average leak ratios of the different types of components in the nine enterprises were analyzed (Figure 4). The leak ratio of open-ended lines, with an average of 5.0%, was much higher than that of other types of components. Among the other types of components, pumps had the next highest leak ratio at 1.62%, followed by connectors (0.98%) and flanges (0.92%). The average leak ratios of agitators and other equipment types were close to zero; therefore, they are not shown in Figure 4.
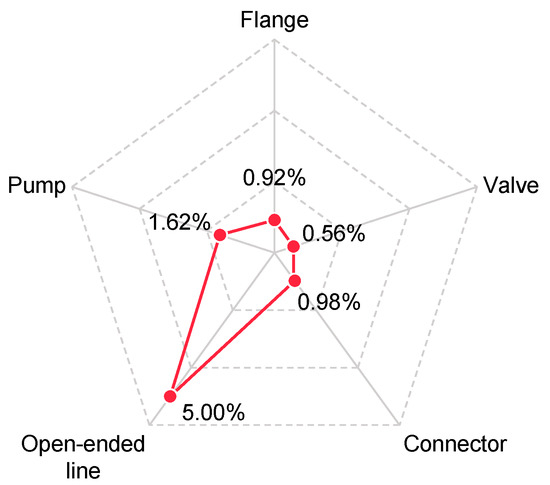
Figure 4.
Average leak ratios of different types of component.
According to these analyses, although flanges accounted for 56.31% of the total components in the equipment used in the enterprises studied, their leak ratio was only 0.92%. In contrast, the leak ratio of open-ended lines was as high as 5.0%, although they made up only 2.97% of the components. Batch reactors are commonly used in the pharmaceutical industry. Fluctuation of leak ratio can be understood but the detailed control of leakage should be based on the products or processes.
4.2.2. Leakage Levels
Overall Leak Levels
At present, the correlation equation method, which was introduced in the US, is widely used to calculate the level of VOC leakage in China. The correlation equation method is based on the interval distribution of the actual detected concentration of material that gets leaked from each component (Equation (1)). It uses a piecewise function to calculate the leakage levels for each component and then obtains the total leakage level by summing these.
where:
- e = Emission rate of VOC for a specific type of equipment (kg/h)
- SV = Concentration of leakage detected by the instruments (μmol/mol)
- e0,i = Default zero emission rate of equipment i (kg/h)
- ep,i = Pegged emission rates of equipment i (kg/h)
- ef,i = Correlation equation of equipment i (kg/h)
The specific calculation parameters for the emission rates and correlation equation can be found in the “Emissions Estimation Protocol for Petroleum Refineries” guidance document [41].
The annual levels of VOC that leaked from the accessible components of the nine enterprises studied were calculated using the correlation equation method (Figure 5). The value obtained for the annual total was 20.11 tons, with an average of 2.23 tons per enterprise and an average single component leakage level of 0.22 kg. A study showed that the single component leakage level in the paint manufacturing industry was 0.18 kg/a [40], so the average leakage per component in the pharmaceutical industry is slightly higher than that in the paint manufacturing industry.

Figure 5.
Quantity of materials leaked from the nine enterprises investigated in this study.
Levels of Leakage from Different Types of Equipment
The contributions to VOC leakage from different types of components are shown in Figure 6. Flanges and connectors contributed the most, with leakage proportions of 39.17% and 38.72%, respectively, followed by valves (16.79%). The large contributions from flanges, connectors, and valves are caused by the high quantities of these that are used in the enterprises studied. According to the above analysis, they made up a total of 96.35% of contributions, with a total leakage proportion of 94.68%. The major causes of emissions from flanges, connectors, and valves were seal or gasket failures due to normal wear or improper maintenance.

Figure 6.
Contribution of different types of equipment to leaks from the nine enterprises investigated in this study.
Open-ended lines, agitators, pumps, and other types of components contributed 5.33% of the leakage. It is particularly noteworthy that the number of pumps accounts for only 0.15% of the components, which is so low as to be almost negligible, while they contribute 1.94% of the leaks.
Levels of Leakage from Enterprises Manufacturing Different Types of Products
The levels of VOC leakage per unit of product output in the nine enterprises investigated in the study were also analyzed (Figure 7). As the output from enterprise A includes 190 tons of chemical bulk drug and 40 tons of pharmaceutical intermediates annually, the leakage amounts cannot be allocated to different product lines. Therefore, it was not included in the analysis. Among the enterprises producing different types of products, VOC leakage per unit product output was highest for chemical bulk drug production, at an average of 0.085 t/a, while the same value was lowest for enterprises producing traditional Chinese medicine, at an average of 0.011 t/a. The latter accounted for only 12.80% of the former. The average VOC leakages per unit product output of enterprises producing preparation of chemical drug, pharmaceutical intermediates, and biotin were 0.033, 0.016, and 0.024 t/a, respectively. Obviously, the leakage from chemical drug production should be a priority for control.
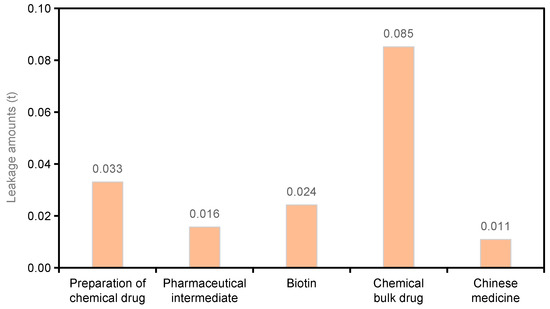
Figure 7.
VOC leakage per unit product output of enterprises manufacturing different types of products (t/a).
4.3. Repair and Emission Reduction
Repair refers to an immediate remedial operation to eliminate leaks within a specified time. If the first repair fails, other methods are required to eliminate leaks within a specified time. At present, repair methods commonly used in China and abroad include fastening bolts, replacing parts, installing pipe caps, applying sealant, and adding leakage prevention clamps. The methods used are determined according to the degree of leakage, component type, and production conditions. According to the Emission Standard of Air Pollutants for Pharmaceutical Industry (GB37823-2019), when a leak is detected, the first repair should be carried out within 5 days and substantive repairs should be completed within 15 days.
The leak repair and emission reduction ratios of the enterprises are shown in Figure 8. As shown in Figure 8, the leak repair ratios of the nine enterprises investigated in this study ranged from 78.29% to 100%. However, the emission reduction ratios after the repairs were very varied among the nine enterprises, with a maximum of 67.72%, minimum of 23.55%, and an average of 44.02%. In general, the higher the repair ratio, the higher the reduction in VOC emission ratio.
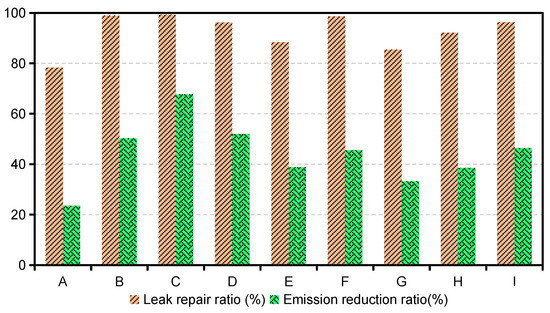
Figure 8.
Leak repair ratios and emission reduction ratios for the nine different enterprises investigated in this study.
5. Control Suggestions
Based on the above analyses and data on VOC leak control in China and other countries, the following are some suggestions for controlling VOC leaks from equipment components in the pharmaceutical industry.
5.1. Promote the Implementation of Quality LDAR
This study indicates that the lowest proportion of inaccessible components among the nine pharmaceutical enterprises investigated was 3.17% while the highest was 9.51%. Considering the high proportion of inaccessible components, it is suggested that ways to reduce this should include detecting leaks from inaccessible components using the Smart-LDAR [42] method or extension rod method. Meanwhile, the leak repair ratio should be improved continuously to ensure that repairing of leaks has an effect and reduces leakage as much as possible. The current average leakage reduction among the nine enterprises after the implementation of LDAR technology was 44.02%, which is significant. However, compared with the 56% reduction in VOC emissions after the implementation of LDAR technology in the chemical industry in the US, it seems that VOC leakage from the equipment components in the pharmaceutical industry can be reduced further [36].
5.2. Emphasize Controlling Sources of Leaks
At present, the implementation of LDAR technology has a particular emphasis in Chinese standards and regulations; however, there are hardly any effective and constructive requirements for controlling the source of VOC leaks from equipment components. Suggestions for how to remedy this in the pharmaceutical industry are as follows.
First, once the safety of production is ensured, the quantity of equipment or components should be reduced by optimizing new units during the design stage or the systems used by the current units during maintenance.
Second, low (no) leakage equipment should be used when new equipment (such as canned motor, magnetic, diaphragm, bellows, and double-face mechanical seal pumps with a seal isolation fluid pressure that is higher than the process pressure) is built or replaced.
Third, leak prevention measures (including the use of blind flanges, covers, plugs, and secondary valves of an appropriate size for open-ended lines with the highest leak ratio) should be used on current equipment.
6. Conclusions
In China, the pharmaceutical industry is key to controlling the emissions of VOC, and the implementation of LDAR technologies therein has been regulated by national standards to control fugitive VOC emissions from this industry. The characteristics of VOC leaks from the equipment components of nine pharmaceutical enterprises were analyzed in this study. The conclusions are as follows.
First, the number of equipment components used by the pharmaceutical enterprises ranged from several thousand to more than 20,000, numbers that are much lower than those in the oil refining and coal chemical industries. Among the different types of components, flanges were dominant, accounting for 56.31% of the total. This was followed by connectors and valves, which accounted for 21.51% and 18.53% of the total, respectively. The total proportion of these three components was 96.35%. In terms of the different types of media used in the components, the greatest proportion used a light liquid medium, at an average of 52.83%, followed by gas medium components (which had an average proportion of 45.52%). Heavy liquid media are rare in the pharmaceutical industry, and components using these accounted for only 1.65% of the total.
Second, the average leak ratio of components of equipment in pharmaceutical enterprises was approximately 0.99%; this meant that 1 out of every 100 components leaked. Among the different types of components, the leak ratio of open-ended lines was much higher than that of other components at an average of 5.00%. Although flanges made up the largest proportion of components, their leak ratio was relatively low at only 0.92%.
Third, the total annual VOC leakage from the nine pharmaceutical enterprises investigated in the study was 20.11 tons, with an average of 2.23 tons per enterprise, and an average of 0.22 kg per component. In terms of the types of components, flanges, connectors, and valves were the top three contributors to leaks, at 39.17%, 38.72%, and 16.79%, respectively, of the total; together, they accounted for 94.68%. Their marked contributions to leakage were directly related to their high proportions among the total number of components. It is particularly noteworthy that the number of pumps accounted for only 0.15% while their contribution to leakage accounted for 1.94% of the total. For the different production processes, the production of chemical bulk drugs had the highest number of leaks per unit product, reaching 0.085 t/a, while that of traditional Chinese medicine production was the lowest (0.011 t/a); the latter was only 12.80% of the former.
Fourth, the implementation of LDAR reduced the levels of VOC leaking from equipment components from the nine enterprises to varying degrees. The overall reduction ratio was between 23.55% and 67.72%, with an average of 44.02%. Despite the significant reduction in leakage after the implementation of LDAR technology, further reductions should be promoted.
Finally, pharmaceutical enterprises should pay more attention to improving the LDAR quality by reducing the number of inaccessible components they use and improving the repair ratio of leaking components as ways to reduce VOC leakage. It is also suggested that they emphasize controlling leaks at the source by reducing the number of components in equipment, adopting low-leakage equipment, and implementing anti-leak measures to prevent leaks from leaving their sources.
Author Contributions
Conceptualization, G.X. and G.Z.; methodology, G.Z.; software, B.F.; validation, G.Z. and B.F.; formal analysis, G.Z.; investigation, B.F.; resources, G.Z. and G.X.; data curation, B.F.; writing—original draft preparation, G.Z.; writing—review and editing, G.Z., B.F. and G.X.; visualization, G.Z.; supervision, G.X.; project administration, G.X.; funding acquisition, G.X. All authors have read and agreed to the published version of the manuscript.
Funding
This research was funded by Shanghai Committee of Science and Technology, grant number 19DZ1205000 and 20dz1204000.
Institutional Review Board Statement
Not applicable.
Informed Consent Statement
Not applicable.
Data Availability Statement
The data presented in this study are available on request from the corresponding author.
Conflicts of Interest
The authors declare no conflict of interest.
References
- Chan, C.K.; Yao, X. Air pollution in mega cities in China. Atmos. Environ. 2008, 42, 1–42. [Google Scholar] [CrossRef]
- Wang, T.; Wei, X.L.; Ding, A.J.; Poon, C.N.; Lam, K.S.; Li, Y.S.; Chan, L.Y.; Anson, M. Increasing surface ozone concentrations in the background atmosphere of Southern China, 1994–2007. Atmos. Chem. Phys. 2009, 9, 6217–6227. [Google Scholar] [CrossRef]
- Ma, Z.; Xu, J.; Quan, W.; Zhang, Z.; Lin, W.; Xu, X. Significant increase of surface ozone at a rural site, north of eastern China. Atmos. Chem. Phys. 2016, 16, 3969–3977. [Google Scholar] [CrossRef]
- Verstraeten, W.W.; Neu, J.L.; Williams, J.E.; Bowman, K.W.; Boersma, F.K. Rapid increases in tropospheric ozone production and export from China. Nat. Geosc. 2015, 8, 690–695. [Google Scholar] [CrossRef]
- Derwent, R.G.; Jenkin, M.E.; Saunders, S.M.; Pilling, M.J.; Simmonds, P.G.; Passant, N.R.; Dollard, G.J.; Dumitrean, P.; Kent, A. Photochemical ozone formation in north west Europe and its control. Atmos. Environ. 2003, 37, 983–1991. [Google Scholar] [CrossRef]
- Dechapanya, W.; Eusebi, A.; Kimura, Y.; Allen, D.T. Secondary organic aerosol formation from aromatic precursors.1.Mechanisms for individual hydrocarbons. Environ. Sci. Technol. 2003, 37, 3662–3670. [Google Scholar] [CrossRef]
- Giakoumi, A.; Maggos, T.; Michopoulos, J.; Helmis, C.; Vasilakos, C. Pm2.5 and volatile organic compounds (vocs) in ambient air: A focus on the effect of meteorology. Environ. Monit. Assess. 2009, 152, 83–95. [Google Scholar] [CrossRef] [PubMed]
- Cai, C.J.; Geng, F.H.; Tie, X.X.; Yu, Q.; An, J. Characteristics and source apportionment of VOCs measured in Shanghai, China. Atmos. Environ. 2010, 44, 5005–5014. [Google Scholar] [CrossRef]
- Yen, C.H.; Horng, J.J. Volatile organic compounds (VOCs) emission characteristics and control strategies for a petrochemical industrial area in middle Taiwan. J. Environ. Sci. Health A 2009, 44, 1424–1429. [Google Scholar] [CrossRef] [PubMed]
- Zhang, G.F. Application and development trend of leak detection and repair (LDAR). Chin. J. Environ. Eng. 2016, 10, 4621–4627. [Google Scholar]
- Hang, C.Y.; Zhao, X.; Shan, Y.H.; Zhang, X.Y.; Ying, T.B.; Zhang, C.L.; Lin, Y.S. A Review of Researches on Atmospheric VOCs Monitoring Technique and Pollution Characteristics in China. J. Ecol. Rural Environ. 2018, 34, 114–123. [Google Scholar]
- Chen, L. Summary of VOCs Waste Gas Treatment Technology in Chemical Industry. Henan Chem. Ind. 2018, 35, 3–6. [Google Scholar]
- Hu, X.Y.; Liu, H.; Wang, N.Y.; Wang, C.; Chuai, Y. Industrial VOCs Emission in Qinhuangdao. Environ. Sci. 2018, 39, 543–550. [Google Scholar]
- Lu, B.; Huang, C.; Lu, Q.; Yang, Q.; Jing, B.L.; Xia, Y.; Tang, W.; Gu, Z.P. Emission Inventory and Pollution Characteristics of Industrial VOCs in Hangzhou, China. Environ. Sci. 2018, 39, 533–542. [Google Scholar]
- Liu, J.; Wang, X.Y.; Yang, W.; Guo, F.Y.; Wu, L.D. Emission Characteristics and Environmental Impact of VOCs in Tianjin Lingang Petrochemical Enterpris. Res. Environ. Sci. 2018, 31, 215–220. [Google Scholar]
- Yuan, B.; Shao, M.; Lu, S.H.; Wang, B. Source profiles of volatile organic compounds associated with solvent use in Beijing, China. Atmos. Environ. 2010, 44, 1919–1926. [Google Scholar] [CrossRef]
- Piccot, S.D.; Watson, J.J.; Jones, J.W. A global inventory of volatile organic compound emissions from anthropogenic sources. J. Geophys. Res. Atmos. 1992, 97, 9897–9912. [Google Scholar] [CrossRef]
- Wei, W.; Wang, S.; Chatani, S.; Klimont, Z.; Cofala, J.; Hao, J. Emission and speciation of non-methane volatile organic compounds from anthropogenic sources in China. Atmos. Environ. 2008, 42, 4976–4988. [Google Scholar] [CrossRef]
- Duan, J.; Tan, J.; Liu, Y.; Shan, W.; Hao, J. Concentration, sources and ozone formation potential of volatile organic compounds (VOCs) during ozone episode in Beijing. Atmos. Res. 2008, 88, 25–35. [Google Scholar] [CrossRef]
- Berenjian, A.; Chan, N.; Malmiri, H.J. Volatile organic compounds removal methods: A review. Am. J. Biochem. Biotechnol. 2012, 4, 220–229. [Google Scholar]
- Ke, J.; Li, S.; Zhao, D.F. The application of leak detection and repair program in VOCs control in China’s petroleum refineries. J. Air Waste Manag. Assoc. 2020, 70, 862–875. [Google Scholar] [CrossRef]
- Stefan, S.; Matthew, H.; Terri, L.; Ken, B.; Stephen, C.; George, F.C.; Doug, J.; Jersey, G.R.; Zhang, C.; Mairs, H.L. Aerially guided leak detection and repair: A pilot field study for evaluating the potential of methane emission detection and cost-effectiveness. J. Air Waste Manag. Assoc. 2019, 69, 71–88. [Google Scholar]
- The Intergovernmental Panel on Climate Change. Working Group I: The Scientific Basis: 4.2.3.2 Volatile Organic Compounds (VOCs). 2000. Available online: https://archive.ipcc.ch/ipccreports/tar/wg1/140.htm (accessed on 10 April 2021).
- He, Z.; Wang, X.; Ling, Z.; Wang, Z. Contributions of different anthropogenic volatile organic compound sources to ozone formation at a receptor site in the Pearl River Delta region and its policy implications. Atmos. Chem. Phys. 2019, 19, 8801–8816. [Google Scholar] [CrossRef]
- Cheng, Z.; Wang, S.; Fu, X.; Watson, J.G.; Jiang, J.; Fu, Q.; Chen, C.; Xu, B.; Yu, J.; Chow, J.C.; et al. Impact of biomass burning on haze pollution in the Yangtze River delta, China: A case study in summer 2011. Atmos. Chem. Phys. 2014, 14, 4573–4585. [Google Scholar] [CrossRef]
- Karagulian, F.; Belis, C.A.; Dora, C.; Prüss-Ustün, A.M.; Bonjour, S.; Heather, A.; Amann, M. Contributions to cities’ ambient particulate matter (PM): A systematic review of local source contributions at global level. Atmos. Environ. 2015, 120, 475–483. [Google Scholar] [CrossRef]
- Chen, J.; Li, C.; Ristovski, Z.; Milic, A.; Gu, Y.; Islam, M.S.; Wang, S.; Hao, J.; Zhang, H.; He, C.; et al. A review of biomass burning: Emissions and impacts on air quality, health and climate in China. Sci. Total Environ. 2016, 579, 1000–1034. [Google Scholar] [CrossRef]
- Li, L.Y.; Xie, S.D.; Zeng, L.M.; Wu, R.; Jing, L. Characteristics of volatile organic compounds and their role in ground-level ozone formation in the Beijing-Tianjin-Hebei Region, China. Atmos. Environ. 2015, 113, 247–254. [Google Scholar] [CrossRef]
- Cheremisinoff, N.P. Pollution Control Handbook for Oil and Gas Engineering; John Wiley & Sons: Hoboken, NJ, USA, 2016. [Google Scholar]
- Curry, R. Approval and Promulgation of Implementation Plans; Texas; Revision to Control of Air Pollution from Volatile Organic Compounds. Alternative Leak Detection and Repair Work Practice. Available online: https://www.federalregister.gov/documents/2015/02/26/2015-03588/approval-and-promulgation-of-implementation-plans-texas-revision-to-control-of-air-pollution-from (accessed on 25 May 2021).
- Siegell, J.H. Exploring VOC Control Options. Chem. Eng. 1996, 103, 92–96. [Google Scholar]
- Du, J.J.; Qiang, N.; Zeng, P.; Long, H.Y.; Wang, J.C. The interpretation of “emission standard of air pollutants for pharmaceutical industry” (GB 37823—2019). Environ. Monit. Forewarn. 2020, 12, 1–8. [Google Scholar]
- Li, Y.W.; Zhang, G.F.; Chen, Y.H.; An, J.Y. Study on typical cases of equipment leak detection and repair project in chemical Industry. Shanghai Chem. Ind. 2017, 42, 22–25. [Google Scholar]
- Ding, D.W.; Jia, R.Z.; Zhu, S.J. Discussion on the application of relevant standards for leakage detection and repair (LDAR). Saf. Health Environ. 2018, 18, 86–89. [Google Scholar]
- Peng, Y.; Ji, S.; Zhao, Z.W.; Zheng, X.C.; Huang, H.Y. Research and evaluation recommendation on management system of leak detection and repair technology. Modern Chem. Ind. 2017, 37, 10–14. [Google Scholar]
- US Environmental Protection Agency. Leak Detection and Repair: A Best Practices Guide; US EPA: Washington, DC, USA, 2007.
- Wu, J.L.; Zou, C.; Wu, S.H. Calculation of VOCs source intensity and application of LDAR technology in petrochemical industry. Environ. Sci. Man. 2017, 42, 121–125. [Google Scholar]
- Chris, H.; Roger, M.; Julius, B. The experience in using LDAR for monitoring fugitive emissions of Volatile Organic Compounds with special reference to RasGas’ experience. Proc. Ann. Gas Process. Symp. 2010, 14, 51–58. [Google Scholar]
- Zhang, X.Y.; Gao, F.; Lv, J.W. Theoretical and empirical study on technologies of VOC LDAR. Environ. Sci. Man. 2017, 42, 138–142. [Google Scholar]
- Zhang, G.F.; Fei, B.; Xiu, G.L. Application research of leak detection and repair (LDAR) technology in paint manufacturing industry. Paint Coat. Ind. 2020, 50, 63–68. [Google Scholar]
- US EPA. Emissions Estimation Protocol for Petroleum Refineries Version 3. 2015. Available online: http://www.epa.gov/sites/production/files/2020-11/documents/protocol_report_2015.pdf (accessed on 10 April 2021).
- Epperson, D.; Lev-On, M.; Taback, H.; Siegell, J.; Ritter, K. Equivalent leak definitions for smart LDAR (leak detection and repair) when using optical imaging technology. Air Repair 2007, 57, 1050–1060. [Google Scholar] [CrossRef] [PubMed][Green Version]
Publisher’s Note: MDPI stays neutral with regard to jurisdictional claims in published maps and institutional affiliations. |
© 2021 by the authors. Licensee MDPI, Basel, Switzerland. This article is an open access article distributed under the terms and conditions of the Creative Commons Attribution (CC BY) license (https://creativecommons.org/licenses/by/4.0/).