Article

Post-Treatment of the Effluent from Anaerobic Digestion of the Leachate in Two-Stage SBR System Using Alternative Carbon Sources

by
Katarzyna Bernat
*,
Dorota Kulikowska
,
Magdalena Zielińska
,
Magdalena Zaborowska
,
Irena Wojnowska-Baryła
and
Magdalena Łapińska
Department of Environmental Biotechnology, University of Warmia and Mazury in Olsztyn, Sloneczna St. 45G, 10-709 Olsztyn, Poland
*
Author to whom correspondence should be addressed.
Sustainability 2021, 13(11), 6297; https://doi.org/10.3390/su13116297
Submission received: 13 May 2021 / Revised: 27 May 2021 / Accepted: 29 May 2021 / Published: 2 June 2021
(This article belongs to the Special Issue Wastewater Treatment and Solid Waste Management)

Abstract

:
Although anaerobic digestion (AD) enables biogas production and facilitates renewable electricity production, its effluent must be post-treated before discarding it into the environment. However, during AD designing, the post-treatment step is often overlooked. This paper presents the kinetics and efficiency of nitrogen removal from effluent after AD of leachate from the aerobic stabilization of the organic fraction of municipal solid waste. A two-stage SBR system was used. An ammonium oxidation rate of 15.5 mg N-NH4/(L·h) ensured a 98% nitrification efficiency (I stage). For denitrification (II stage), alternative carbon sources (ACS) (molasses, crude glycerine, or distillery stillage) were used. Two volumetric exchange rates (n) were tested: 0.35 1/d (COD/N-NO3 ratio of 8) and 0.5 1/d (COD/N-NO3 of 7). With all ACS and COD/N-NO3 ratios, almost 100% of nitrate was denitrified; at the COD/N-NO3 of 8, biodegradable organics remained in the effluents. At the COD/N-NO3 of 7, the denitrification removal rates were lower (29.6-45.1 mg N-NOx/(L·h)) than at the ratio of 8 (72.1–159.5 mg N-NOx/(L·h)), because of temporal nitrite accumulation. The highest nitrate removal rates were obtained with molasses, the lowest with a distillery stillage. Considering the nitrate removal rate and the effluent COD concentration, molasses was recommended as the most effective carbon source for AD effluent treatment at the COD/N-NO3 of 7.

1. Introduction

Wastewater with high organics concentrations (usually from thousands to tens of thousands of mg per liter), such as dairy wastewater, wastewater from meat processing, or wastewater from the vegetable and fruit industry, can be used as a substrate for effective biogas production via anaerobic digestion (AD). Recently, as a potential substrate for AD, leachate from aerobic stabilization of the organic fraction of municipal solid waste (OFMSW) has been considered. Aerobic stabilization is the second stage in mechanical-biological waste treatment and one of the most commonly used methods of OFMSW management. Leachate is a waste by-product of this process, and its composition is similar to that of leachate from young landfills. Due to its high concentration of biodegradable organic compounds, leachate can be subjected to biological AD. This can take place in reactors with anaerobic granular sludge [1], particularly in up-flow anaerobic sludge blanket (UASB) reactors or similar reactors with modifications.
AD has the advantages of high organics removal efficiency and high biogas productivity, however, effluent from AD still contains high concentrations of organics. For example, Couras et al. [2] showed that, although removal efficiency of organics (expressed as COD (chemical oxygen demand)) in UASB treating dairy wastewater ranged from 75% to 90%, the effluent still contained 1.5 g COD/L. Similarly, Musa et al. [3] noted that, during anaerobic treatment of cattle slaughterhouse wastewater (15 g COD/L, 6 g BOD5/L (biochemical oxygen demand (BOD)) in a UASB under mesophilic conditions (35 °C), the organics concentration in the effluent was still above 1.4 g COD/L. The high pollutant concentrations in the effluent from AD mean that, before entering the environment, effluent from AD must be post-treated, usually in aerobic conditions, e.g., in an activated sludge process, fluidized bed reactors, trickling filters, aerated lagoons, wetlands, or with membrane technology.
Many authors have reported successfully treating effluent from AD, particularly regarding organics removal. For example, Kwarciak-Kozłowska and Bień [4] treated wastewater from the dairy industry via a combination of methane fermentation in a UASB reactor and ultrafiltration as a post-treatment step. In the anaerobic stage, the effectiveness of organics removal was 73.8% of COD, 81.2% of BOD, and 76% of total organic carbon (TOC), meaning that the effluent contained 1053 mg COD/L, 329 mg BOD/L, and 288 mg TOC/L. Post-treatment ensured the removal of an additional 72%, 63%, and 67% of the remaining COD, BOD, and TOC, respectively. Tufaner [5] tested the treatment of UASB effluent (1000 mg COD/L, 170 mg BOD5/L, total Kjeldahl nitrogen (TKN) 80 mg TKN/L, 5 mg Ptot/L) via surface flow and a vertical flow wetland (hybrid wetland with duckweed), removing 80 and 93% of COD and BOD5, and about 92–98% of total phosphorus and total nitrogen. It should be emphasized that, in this case, the UASB effluent contained relatively low nitrogen and phosphorus concentrations. However, in the anaerobic treatment of some kinds of wastewater or leachate, the effluents are very rich in nitrogen compounds, containing up to hundreds of milligrams per liter. For example, the effluent from a UASB reactor treating landfill leachate (COD 7856–22,500 mg/L, total nitrogen (TN) 839–1390 mg/L) had not only a high COD concentration (950 mg COD/L), but also high ammonium concentrations, up to 300 mg N-NH4/L [6].
Although AD of leachate from aerobic stabilization of OFMSW enables high biogas productivity, its effluent contains a high concentration of both organics and nitrogen and must be post-treated before discarding to the environment. However, this post-treatment step is often overlooked during AD design. In this study, post-treatment technology of the effluent after AD, that has not been treated before, was proposed: a two-stage sequencing batch reactor (SBR) system with nitrification and denitrification. Taking into account the low ratios of COD/TKN and BOD/TKN in the AD effluent, for efficient nitrogen removal, organic waste as external carbon sources was proposed.
It is known that carbon sources that can potentially support denitrification can be categorized as (1) pure chemicals like methanol, ethanol, acetate, glucose, butanol, etc.; (2) purified agricultural or industrial by-products; (3) raw industrial/agricultural by-products, such as corn syrup, molasses, brewery waste, and other process wastes; (4) sludge fermentation products; and (5) others, such as hydrogen, methane, and H2S [7]. The first group is called conventional carbon sources, and the other groups are referred to as alternative carbon sources (ACS). Due to differences in the composition of ACS, their suitability for denitrification should be verified based on technological research results. This was done in this study for the first time for the treatment of the effluent after AD of leachate from aerobic stabilization of OFMSW. The suitability of the ACS is determined by the availability of a high concentration of biodegradable organic compounds and a low nitrogen concentration in the effluent.
Summarizing, in the present study, for treatment of the effluent after AD of the leachate originated from aerobic stabilization of OFMSW, a two-stage SBR system (I stage—nitrification, II stage—denitrification) was used. As the effluent from nitrifying reactors contained a low concentration of easily biodegradable organic compounds, organic waste as an alternative external carbon source (beet molasses, crude glycerine, distillery stillage) was added for effective nitrogen removal. These ACSs have not been tested before for the treatment of the effluent after AD as used in the present study. Based on the denitrification rate and efficiency, as well as the ACS concentration remaining in the effluent, the most suitable carbon sources and the COD/N ratio were selected for nitrogen removal from the effluent after AD. Additionally, the kinetics of organics removal, nitrification, and denitrification were determined.

2. Materials and Methods

2.1. The Effluent after AD as a Substrate

In the present study, the effluent after AD of the leachate was used as a substrate. Before that, the leachate that originated from aerobic stabilization of the OFMSW (size fraction of 0–80 mm being mechanically separated at a mechanical–biological treatment plant) was used for methane production during anaerobic fermentation (another study). After methane fermentation, the effluent still contained high pollutant concentrations (Table 1) and therefore needed further treatment. Its BOD7/COD ratio of 0.35 indicated that the organics in the effluent after AD were moderately biodegradable and could be biologically treated with the activated sludge method. However, the low ratios of COD/TKN (i.e., 3.1) and BOD7/TKN (i.e., 1.1) indicated that the organics concentrations were too low for denitrification; therefore, for effective nitrogen removal, external carbon sources were added.

2.2. Process Configuration

For post-treatment of the effluent from AD, a two-stage SBR system (I stage—nitrification, and II stage—denitrification) was proposed.

2.2.1. I Stage—Nitrification

Nitrification was carried out in two identically operated reactors; each had a working volume of 5 L and was equipped with a magnetic stirrer and a fine bubble aeration system. As an inoculum, activated sludge from the aerobic chamber from a municipal wastewater treatment plant (MWTP) (for 178,000 people equivalent) with an enhanced nutrients removal was used. In nitrifying reactors, the concentration of activated sludge (as mixed liquor volatile suspended solids (MLSS)) was maintained at 4.0 g MLSS/L (solids retention time (SRT) was ca. 20 d). Each reactor cycle lasted 24 h and included filling (5 min), mixing and aeration (23 h), sedimentation, and decantation (55 min). DO concentration was maintained at 2–3 mg O2/L. The I stage was carried out at 20 ± 2 °C for 80 days with a gradually increasing volumetric exchange ratio (n) from 0.1 1/d to 0.3 1/d. The effluent from both reactors was collected for denitrifying stage only when n was 0.3 1/d (when nitrate was the main product of nitrification). The composition of the effluent after nitrification is shown in Table 1. The use of two parallel nitrifying reactors ensured a sufficient amount of wastewater for the II stage.

2.2.2. II Stage—Denitrification

The effluent after nitrification was introduced to denitrifying SBRs. The process was carried out at 20 ± 2 °C for 80 days in three parallel anoxic reactors (working volume of 2.5 L) that were covered and equipped with stirrers. The reactors were inoculated with activated sludge from the denitrification chamber of the MWTP mentioned above. The denitrifying biomass was maintained at 4.0 g MLSS/L (SRT was ca. 10 d). After the adaptation period, in which the n was subsequently increased, the main experiment was performed at the n of 0.35 1/d and the COD/N-NO3 of 8, then the n was increased to 0.5 1/d and the COD/N-NO3 decreased to 7. The reactors cycle lasted 24 h and included: filling (5 min), mixing (21 h), aeration (1 h) sedimentation, and decantation (55 min).
After nitrification, the effluent had a low content of easily biodegradable organic compounds (BOD7 of 5.5 mg O2/L), hence the addition of an external carbon source was required. In the present study, three different organic carbon sources were used: beet molasses (M), crude glycerine (CG), or distillery stillage (DS).
The beet molasses was obtained from the sugar manufacturing plant. The main component of the molasses was saccharose (>50%). The solution of molasses was prepared by dissolving 260 g of molasses in 1 L of distilled water, resulting in a COD concentration of 200 g COD/L. Crude glycerine, a waste by-product, was obtained from a biodiesel production plant. Its main component was glycerol (80–85%), followed by ash (NaCl, <7%), M.O.N.G. (non-glycerol organic matter, <2%), and methanol (<0.5%), and the remaining amount was made up of water (product specification from Biodiesel Manufacturing Plant, Poland). In the present study, the solution of crude glycerine was prepared by dissolving ca. 226 g of crude glycerine in 1 L of distilled water, for a COD concentration of 200 g COD/L. The distillery stillage was obtained from a plant that manufactures alcohol using sugar crops. It was composed of 45–50 g COD/L and 0.8 g/L of volatile fatty acids (VFA). The stillage was added directly to the reactor, without dilution.
All the carbon sources have very high organics content (as COD) and high BOD/COD ratios (ca. 0.6), which means they are easily biodegradable. To ensure the appropriate COD/N-NO3 ratios, calculated amounts of carbon sources were supplied to the effluent after nitrification. This effluent was immediately added to the denitrifying reactors. The N in the ratios was expressed as N-NO3 because nitrate was the main form of nitrogen in the effluent after nitrification. Based on the previous studies, when waste carbon sources were used for denitrification, the COD/N-NO3 ratio was established as 8; then, it was decreased to 7.

2.3. Analytical Methods

In the effluents after leachate methane fermentation, after nitrification, and after denitrification, the following characteristics were determined: alkalinity and pH after titration with a potentiometric method (dosimat Titroline), and concentrations of organics expressed as chemical oxygen demand (COD) (cuvette tests LCK 514, Hach, Germany), biochemical oxygen demand after 7 days (BOD7) (DIN EN 1899-1/EN 1899-2 EPA method using OxiTop WTW Wissenschaftlich-Technische Werksträtten GmbH), orthophosphate (with ascorbic acid and ammonium molybdate), total Kiejdahl nitrogen (TKN), ammonium (N-NH4) (both by distillation with titration, Büchi), nitrite (N-NO2) (cuvette tests LCK 342, Hach), and nitrate (N-NO3) (cuvette tests LCK 340, Hach). Before determination, the samples were filtered with a 0.45 micron filter. Measurements of mixed liquor suspended solids (MLSS) (after drying at 105 °C) and mixed liquor volatile suspended solids (MLVSS) (as lost after ignition at 550 °C) were made in the nitrifying and denitrifying reactors. The analyses were performed based on cuvette tests (Hach) and according to APHA [8].

2.4. Kinetics of Nitrification and Denitrification

Under steady-state conditions in the nitrifying reactors (n of 0.3 1/d), the kinetics of the changes in concentrations of ammonium, nitrite, nitrate, and COD during the SBR working cycle were determined. In the denitrification reactors, at both n 0.35 1/d 1 and 0.5 1/d, and at the COD/N-NO3 ratios of 8 and 7, respectively, the kinetics of denitrification and COD removal were determined. Denitrification kinetics were expressed in terms of nitrite removal and removal of the sum of nitrite and nitrate (N-NO2 and N-NO3).

3. Results and Discussion

3.1. I Stage—Nitrification of the Effluent after Anaerobic Treatment

In the nitrifying reactors, the n was increased for over 35 days from 0.1 1/d to the adjusted final value of 0.3 1/d, and then it was maintained at this level to the end of the experiment. The reactors were operated at ambient temperature (20 ± 2 °C), which ensures efficient nitrification. The average pollutant concentrations are shown in Figure 1. In the effluent from anaerobic digestion that was supplied to both nitrifying reactors, the organics concentration averaged 1530 mg COD/L. In the adaptation phase at the n of 0.1 1/d, the average COD concentration in the effluent from the nitrifying reactors was 167 mg COD/L, and this increased to 241 mg COD/L when the n of 0.3 1/d was attained (Figure 1).
As the organics concentration expressed as BOD7 was very low in the effluent from the nitrifying reactors, it can be assumed that the remained organics were in a difficult-to-degrade form, called the inert fraction. All the pollutant concentrations in the liquid were measured after it had been subjected to filtration; thus, the inert fraction of COD constituted soluble compounds that were unavailable to the microorganisms.
The total Kjeldahl nitrogen in the effluent after anaerobic digestion was around 500 mg TKN/L, of which ammonium nitrogen constituted 46%. During the adaptation phase, the TKN concentration in the effluent from the nitrifying reactors remained at 3.5 mg/L; then, at the n of 0.3 1/d, it remained stable at 5.6 mg TKN/L. This means that organic nitrogen, constituting more than half of the TKN, was converted into ammonium, which was simultaneously oxidized. As a result of biological ammonium transformation at increasing n, nitrite appeared during the adaptation period, indicating partial, incomplete nitrification.
Then, ammonium was completely oxidized, and nitrite was only a short-term intermediate product, which was converted to nitrate. During the period with the lowest n, the nitrite concentration reached up to 58 mg N-NO2/L, whereas nitrate made up the rest of the oxidized nitrogen forms generated from ammonium. However, in the effluent, the ammonium concentration was very low and did not exceed 3 mg N-NH4/L. At the adjusted n of 0.3 1/d, the concentration of nitrate increased to ca. 460 mg N-NO3/L, and no nitrite remained in the effluent from the nitrifying reactors (Figure 1).

3.2. Kinetics in Nitrifying Reactors

Figure 2 presents the changes in the concentrations of organic and nitrogen compounds that took place during the working cycle in the nitrifying reactors while the n of 0.3 1/d was maintained. As the pollutant concentrations from both reactors were similar, the average concentrations are shown (Figure 2). At the beginning of the reactor cycle, the COD concentration was 630 mg/L, including COD concentration from the organics remaining after the previous cycle and that from the influent. The COD concentration decreased most intensively during the first 4 h of the cycle, then it stabilized and remained at about 250 mg COD/L. Changes in the COD concentration followed 1st order kinetics, and the initial organics removal rate (rCOD) was 287.9 mg/(L·h).
It should be emphasized that the content of easily biodegradable compounds (BOD7) was very low, less than 5 mg/L, so the organics in the effluent after nitrification were resistant to biodegradation and consisted mainly of the inert fraction.
Ammonium oxidation proceeded according to zero-order kinetics. This means that the rate of ammonium removal rN-NH4 is equal to the kinetic constant of ammonium removal kN-NH4 and the process rate is constant over time and does not depend on the substrate concentration. The ammonium was completely oxidized in the first 4 h of the working cycle with a rate of 15.5 mg N-NH4/(L·h) (5.4 mg N-NH4/(g VSS·h). As a result of the n, the ammonium concentration at the beginning of the cycle was ca. 70 mg/L, which decreased to 3.8 mg/L, and then remained at this level until the end of the cycle. The decrease in ammonium concentration was accompanied by an increase in both nitrite and nitrate concentrations. The changes in nitrite concentrations also proceeded with zero-order kinetics. During the first 4 h of aeration, the rate of nitrite formation was around 14 mg N-NO2/(L·h). From 4 to 11 h of the working cycle, the nitrite concentration started to decrease at a rate of 7.8 mg N-NO2/(L·h). From the beginning of the cycle, the nitrate concentration continuously increased (the increase proceeded with first-order kinetics), and the initial rate of nitrate formation was around 30 mg N-NO3/(L·h).
Studies on the kinetics of nitrification of the effluent from the AD of the leachate from aerobic stabilization of OFMSW are scarce. Most of these studies have concerned nitrification in different types of wastewater or landfill leachate, including artificial ones. For example, in the study of Kulikowska et al. [9], nitrogen removal from municipal landfill leachate (with ammonium concentration of ca. 900 mg N-NH4/L) was carried out in a two-stage system, in which denitrification was preceded by nitrification. Similar to this study, during the adaptation period, nitrite was formed as an intermediate product of nitrification. However, the ammonium concentration in the effluent did not exceed 1 mg N-NH4/L, meaning that the effectiveness of nitrification was almost 100%. In the SBR cycle, the ammonium removal also proceeded according to zero-order kinetics, but the removal rate was 2-times higher, 31 mg N-NH4/(L∙h). Nitrite accumulated only temporarily. However, in the study of Kulikowska et al. [9], the main component of TKN was ammonium. Whereas, in this study, organic nitrogen prevailed (N-NH4/TKN ratio 0.46). The high share of organic nitrogen in TKN influenced the rate of ammonium removal. The lower rate of ammonium removal may have been caused by the simultaneous conversion of the organic nitrogen into ammonium. The low ratio of N-NH4/TKN in the effluent after AD may have resulted from the fact that TKN in the leachate from aerobic stabilization of OFMSW consisted of ca. 30% ammonium, which was stated also in a previous study [10]. Koc-Jurczyk and Jurczyk [11] treated old landfill leachate (4125 mg COD/L, 636 mg BOD5/L (BOD5/COD ratio of 0.15), 775 mg N-NH4/L and 850 mg TKN/L) in three SBRs, one contained suspended activated sludge, whereas two SBRs additionally contained foam carriers. The effectiveness of ammonium removal in the SBR with suspended activated sludge was 46.3%; however, it should be mentioned that in the influent, the concertation was ca. 800 mg N-NH4/L. In contrast to the present study, ammonium removal proceeded with first-order kinetics (the initial rate of the process was 50–68 mg N-NH4/(L∙h)).

3.3. II Stage—Denitrification of the Effluent from Nitrifying Reactors

During denitrification, n increased from 0.2 to 0.5 1/d. The reactors were operated at ambient temperature (20 ± 2 °C) for 80 days. As the COD concentration in the effluent after nitrification was low, and it was composed of mainly difficult-to-degrade organics, external carbon sources had to be added. The appropriate dosage of ACS as beet molasses, crude glycerine, or distillery stillage was supplied into the denitrifying reactors to ensure that the adjusted COD/N-NO3 ratio was maintained. At the n of 0.35 1/d, which was maintained until day 40 of the experiment, the COD/N-NO3 ratio was kept at 8. Then, at the n of 0.5 1/d, the ratio was decreased to 7.
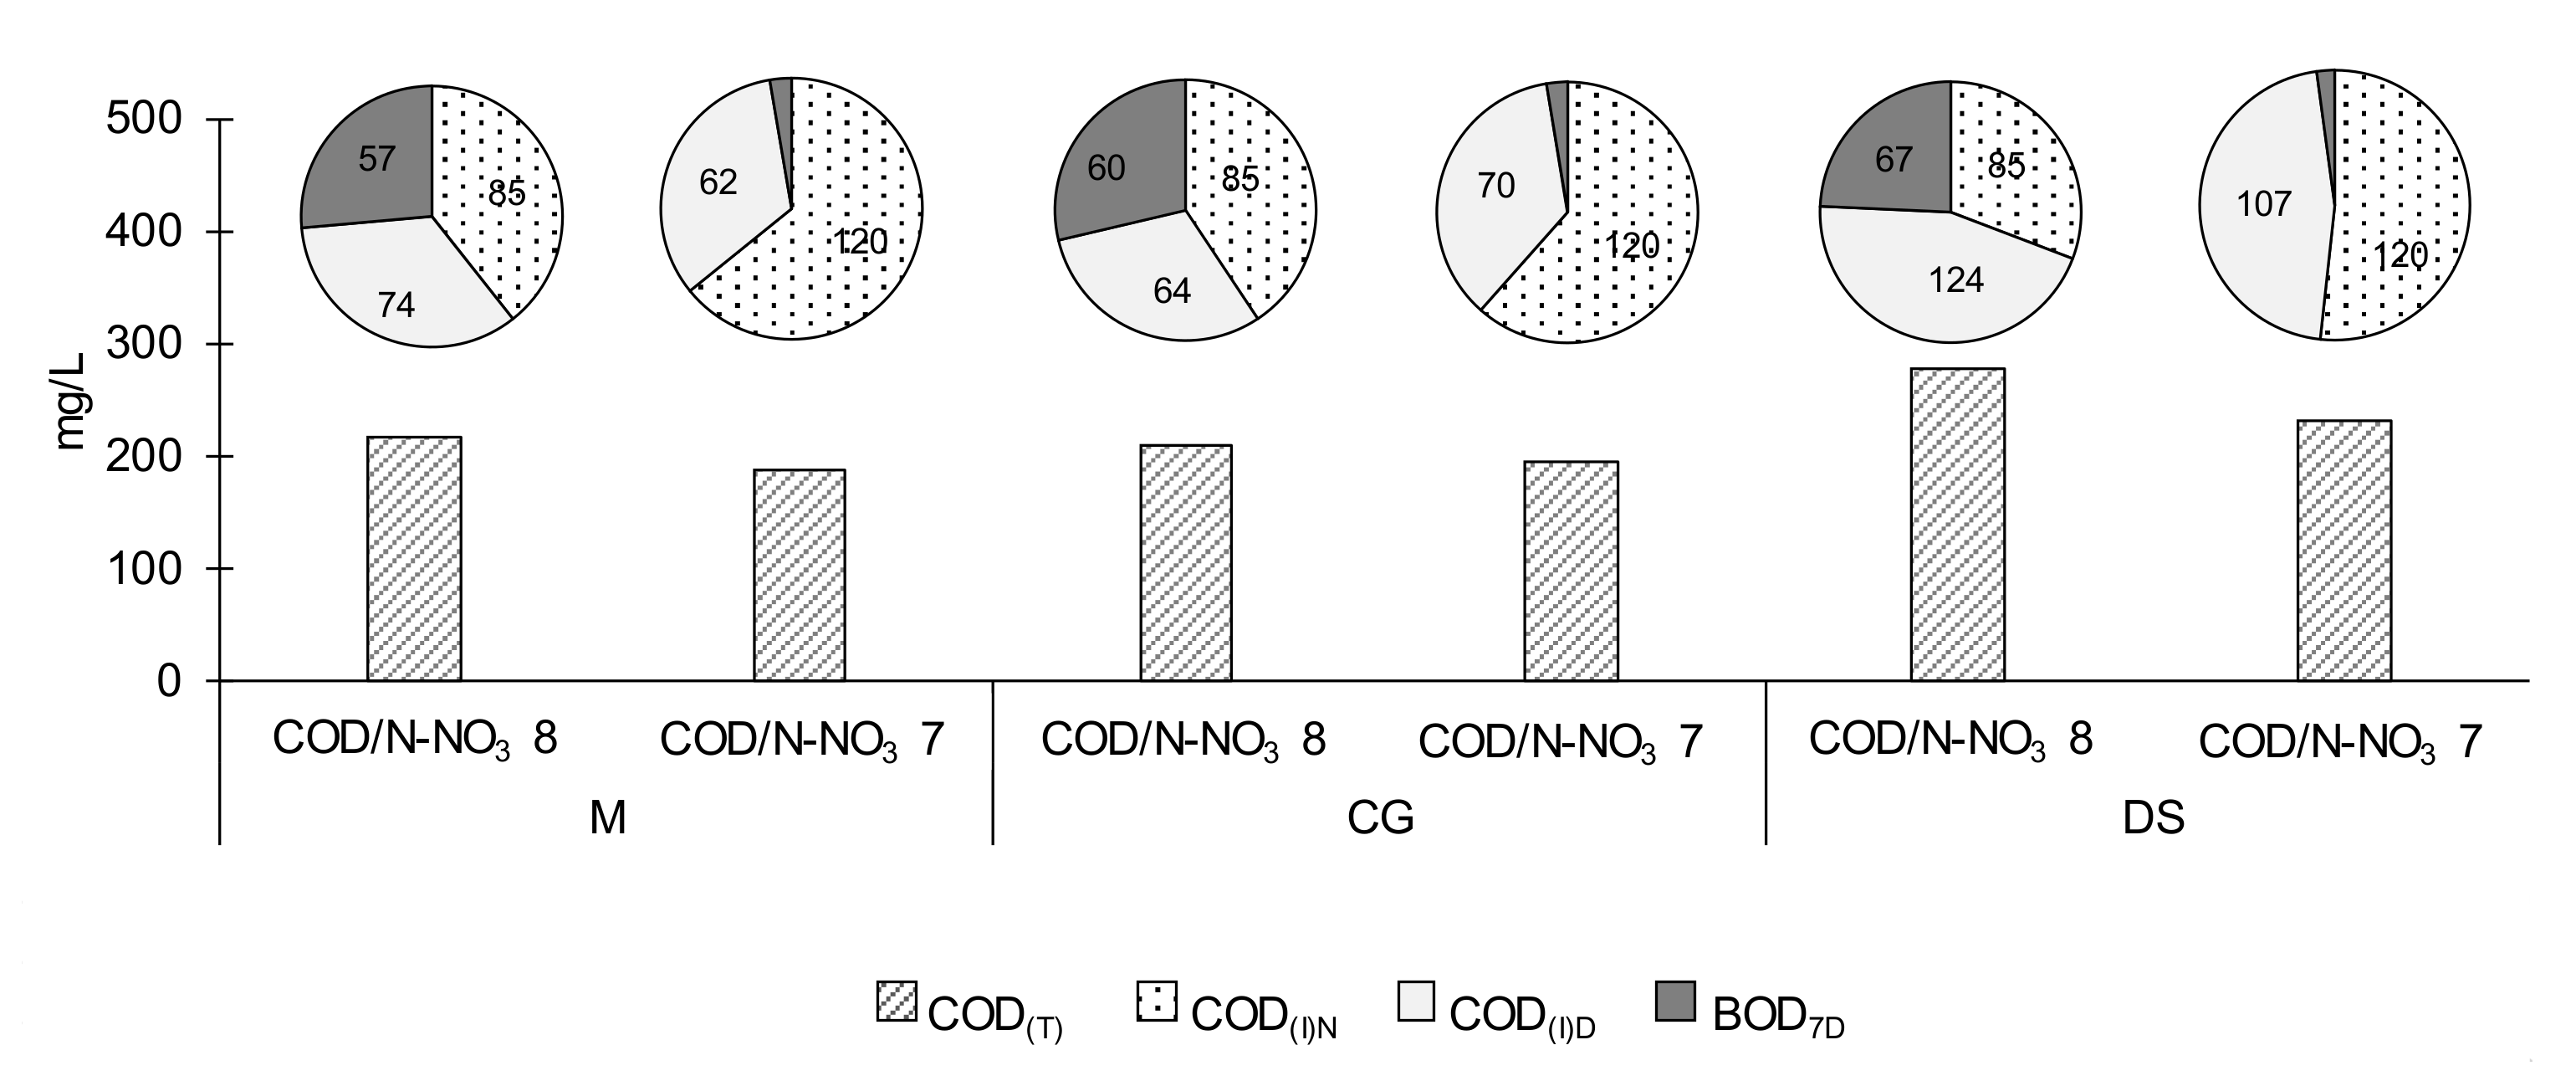
Figure 3 shows the COD concentrations in wastewater after denitrification. It was assumed that the total COD (CODT) comprises the organics introduced into the denitrifying reactor with wastewater after nitrification COD(I)N, and the organics remaining from ACS after denitrification, which were calculated as the sum of COD(I)D, and BOD7D.
The concentration of COD(I)N depended on the n in the denitrifying reactor. At the lower n of 0.35 1/d, the concentration of organics as COD(I)N was ca. 85 mg COD/L, whereas at the higher n of 0.5 1/d, it was proportionally higher, ca. 120 mg COD/L. These organics can be assumed to be the difficult-to degrade inert fraction because of their negligible content of BOD after nitrification. The remaining COD concentration depended on the COD/N-NO3 ratio used during the denitrification step. At a COD/N-NO3 ratio of 8, easily biodegradable compounds were present in the effluent after denitrification, indicating that, although a part of the organics was easily available to the microorganisms, they were not used for denitrification. For this reason, the COD/N-NO3 ratio was decreased to 7 at the higher n of 0.5 1/d. Under those conditions, the effluent had a negligible content of BOD, and all the COD consisted of the inert fraction of the organic compounds. Taking into consideration all of the COD fractions, including BOD, and the type of ACS used as the carbon source, it can be concluded that the effluent concentrations of COD were higher at the larger COD/N-NO3 ratio. Regardless of the COD/N-NO3 ratio, the COD concentration in the effluent after denitrification was highest when distillery stillage was used. When beet molasses or crude glycerine were used, the effluent COD content was lower, and it did not differ between these two carbon sources.
Regardless of the COD/N-NO3 ratio and the external carbon source that was used, the sum of the concentrations of nitrates and nitrites in the effluent did not exceed 1 mg/L. This means that waste carbon sources, with COD/N-NO3 ratios of 8 and 7, ensured effective denitrification. Similar results were obtained by Shao et al. [12]. The authors stated that for denitrification with waste sludge alkaline fermentation liquid as the external carbon source, the optimal was a C/N ratio of 7. They reported that the nitrate removal efficiency was 96.4%, and no nitrite accumulation was found.
Figure 4 presents the changes in the concentrations of nitrogen compounds that took place during the working cycle in the denitrifying reactors while maintaining the n of 0.35 1/d and the COD/N-NO3 ratio 8, or the n of 0.5 1/d and the COD/N-NO3 ratio of 7. At the COD/N-NO3 ratio of 7, nitrite accumulation during denitrification was substantial, but this was not as noticeable at the higher COD/N-NO3 ratio.
The high nitrite accumulation influenced the rate of denitrification (the decrease in the concentration of all oxidized forms of nitrogen, calculated as the sum of nitrite and nitrate, rN-NOx) and the time for complete removal of nitrite and nitrate during the cycle. This time extended when the nitrite accumulation was more substantial. Irrespective of the COD/N-NO3 ratio, the decrease in the concentration of all oxidized forms of nitrogen (as the sum of nitrite and nitrate) followed zero-order kinetics.
With an excess of organic compounds, i.e., at the COD/N-NO3 ratio of 8, the oxidized forms of nitrogen were removed very quickly (for no longer than 2 h of the cycle). The highest rate of nitrite and nitrate removal, 160 mg N-NOx/(L·h) (57 mg N-NOx/(g VSS·h)), was observed when beet molasses was used. The removal rate was 1.67 times lower with crude glycerine, and it was lowest with distillery stillage (72 mg N-NOx/(L·h); 26 mg N-NOx/(g VSS·h)). The rate of nitrite and nitrate removal decreased when the COD/N-NO3 ratio was decreased to 7, and the n was concurrently increased, causing the nitrate content at the beginning of the cycle to be higher (225 mg N-NO3/L vs. 160 mg N-NO3/L). Similar to what was observed at the higher COD/N-NO3 ratio, the rate of nitrite and nitrate removal at the lower COD/N-NO3 ratio was highest (45 mg N-NOx/(L·h); 16 mg N-NOx/(g VSS·h)) when beet molasses was used the carbon source, and lowest when distillery stillage was used (30 mg N-NOx/(L·h); 11 mg N-NOx/(g VSS·h)). With these respective alternative carbon sources, the time for complete removal of nitrite and nitrate during the cycle ranged from 5 h to more than 8 h. This would affect the total length of the cycle in denitrifying reactors.
The effect of the external carbon source on the kinetics of denitrification has been also reported by other authors, but during nitrogen removal from synthetic or municipal wastewater, not from AD effluent. For example, Horova et al. [13] analyzed the effect of ethanol, glycerol, molasses, and whey on nitrate removal from highly contaminated synthetic wastewater (1500 mg N-NO3/L; COD/N ratio 4). They showed that the time necessary for complete removal of total nitrogen was 8.3 h for ethanol and whey, 7.1 h for molasses, and 10.4 h for glycerol. However, in all cases, the formation of nitrite was observed after ca. 5 h, and the maximum concentration reached 544 mg N-NO2/L with ethanol and ca. 400 mg N-NO2/L with whey and molasses. The lowest nitrite accumulation, 200 mg N-NO2/L, was with glycerol. The N-NOx removal rates ranged from 58.2 mg/(g VSS·h) to 62.3 mg/(g VSS·h). These values were similar to the values obtained in the present study when beet molasses was used as a carbon source, at a COD/N-NO3 ratio of 8.
In another study, Smyk and Ignatowicz [14] tested molasses as an external carbon source during municipal wastewater treatment in SBR reactors. They found that after the addition of molasses, COD concentration increased and the COD/TKN ratio also increased from 4.5 to 5.3, resulted in a higher efficiency of nitrogen (by 6%) and ammonium (by 0.8%) removal than in the reactor with no supplementation of the additional carbon source. The use of molasses caused a decrease in the nitrate concentration in the effluent [14]. Guo et al. [15] found that at the COD/N-NO3 ratio of 7–8, the effectiveness of denitrification in synthetic wastewater supplemented by fermentation liquid and waste sludge thermal hydrolysate was 92.3 and 98.9%, respectively. The COD/N-NO3 ratio was similar to that used in the present study, but in contrast, no nitrite accumulation was observed.
Based on the changes in concentrations of organic compounds, measured as COD, the removal rates and the rate constants were determined (Figure 5). The decrease in the concentrations of COD followed first-order kinetics, and thus, in this case, the initial rate of COD removal could be determined. Similar to what was observed with the oxidized forms of nitrogen, the organics were removed quickly at the COD/N-NO3 ratio of 8, and the time needed for complete COD removal did not exceed 4 h. After this time, the COD concentration remained on the same level. When the COD/N-NO3 ratio decreased to 7, the initial COD concentration at the beginning of the cycle increased because the n was concurrently increased. Irrespective of the COD/N-NO3 ratio, the rate of organics removal was highest when beet molasses was used as a carbon source, and lowest when distillery stillage was used.
As can be seen in Figure 5, the removal rates of both the oxidized forms of nitrogen and the organics depended on the type of carbon source used in the denitrifying stage. It was found that, at the COD/N-NO3 ratio of 8, the rates were higher than at the COD/N-NO3 ratio of 7. Regardless of the COD/N-NO3 ratio, the highest rates were observed with beet molasses and the lowest with distillery stillage. At the COD/N-NO3 ratio of 8, the rate of denitrification with distillery stillage was 55% and 75% lower in comparison with molasses and crude glycerine. At the COD/N-NO3 ratio of 7, it was 65% and 74% lower, respectively. Distillery stillage is a waste product from the production of ethyl alcohol from substrates that are rich in simple and complex sugars. Although distillery stillage has high concentrations of biodegradable organic compounds, these compounds are mostly present in the form of suspended solids [16]. Therefore, they require a longer period of degradation before their assimilation by microorganisms. Similar results with distillery stillage as a source of organic carbon were reported in a study on post-denitrification of effluent (NO2-/NO3- ratio of 0.45) from the treatment of nitrogen-rich digester supernatant, in which an initial lag-phase during NOx removal was observed [17]. In a study by Miao et al. [18], the denitritation rates with the use of distillery stillage were like those observed during denitritation with the use of other complex carbon sources, such as starch. In the study presented here, it can be concluded that denitrification with distillery stillage was limited by the biodegradability level of this carbon source because, after the denitrification stage, the highest contribution of COD came from the external carbon source that was not utilized in nitrite/nitrate reduction (almost half of total COD).

4. Conclusions

It was shown that the effluent after AD of leachate from aerobic stabilization of OFMSW, which has not been treated before, can be effectively post-treated in the SBR two stage-system. In the first stage, nitrification enabled all ammonia nitrogen to be oxidized; however, for effective denitrification, an external carbon source was needed. All proposed alternative carbon sources ensured to achieve low nitrite and nitrate concentration in the effluent (below 1 mg/L). However, at the COD/N-NO3 ratio of 8, the effluent contained biodegradable organics (as BOD). At the COD/N-NO3 ratio of 7, although nitrite accumulation during denitrification was substantial (which decreased the rate of denitrification and concurrently extended the time for complete N-NOx removal during the cycle), the time needed for N-NOx removal did not exceed 5 h (beet molasses) or 8 h (distillery stillage). Moreover, in the effluent, BOD concentration was negligible. Considering the denitrification efficiency, the concentrations of organics in the effluent, and the high rate of denitrification, which means the SBR cycle could be substantially shortened, beet molasses was found to be the most useful of the ACS for N-NOx removal from the effluent after AD of leachate from aerobic stabilization of OFMSW.

Author Contributions

Conceptualization, K.B., D.K.; methodology, M.Z. (Magdalena Zaborowska), M.Ł.; formal analysis, K.B., M.Z. (Magdalena Zielińska); investigation, M.Z. (Magdalena Zaborowska), M.Ł.; data curation, K.B., I.W.-B.; writing—original draft preparation, K.B., D.K., I.W.-B., M.Z. (Magdalena Zielińska); writing—review and editing, K.B., D.K., I.W.-B., M.Z. (Magdalena Zielińska); visualization, M.Z. (Magdalena Zaborowska), M.Ł.; supervision, K.B., I.W.-B.; project administration, K.B.; funding acquisition, K.B. All authors have read and agreed to the published version of the manuscript.

Funding

The research was funded by the National Science Centre, Poland (Grant No. 2016/21/B/NZ9/03625).

Institutional Review Board Statement

Not applicable.

Informed Consent Statement

Not applicable.

Data Availability Statement

Not applicable.

Conflicts of Interest

The authors declare no conflict of interest.

References

  1. Tauseef, S.M.; Abbasi, T.; Abbasi, S.A. Energy recovery from wastewaters with high-rate anaerobic digesters. Renew. Sustain. Energy Rev 2013, 19, 704–741. [Google Scholar] [CrossRef]
  2. Couras, C.S.; Louros, V.L.; Gameiro, T.; Alves, N.; Silva, A.; Capela, M.I.; Arroja, L.M.; Nadais, H. Anaerobic degradation of dairy wastewater in intermittent UASB reactors: Influence of effluent recirculation. Environ. Technol. 2015, 36, 2227–2238. [Google Scholar] [CrossRef] [PubMed]
  3. Musa, M.A.; Idrus, S.; Hasfalina, C.M.; Daud, N.N.N. Effect of organic loading rate on anaerobic digestion performance of mesophilic (UASB) reactor using cattle slaughterhouse wastewater as substrate. J. Environ. Res. Public Health 2018, 15, 2220. [Google Scholar] [CrossRef] [PubMed] [Green Version]
  4. Kwarciak-Kozłowska, A.; Gałwa-Widera, M.; Bień, J. The Application of Integrated System in Dairy Wastewater Treatment. Rocz. Ochr. Sr. 2018, 20, 602–615. [Google Scholar]
  5. Tufaner, F. Post-treatment of effluents from UASB reactor treating industrial wastewater sediment by constructed wetland. Environ. Technol. 2020, 41, 912–920. [Google Scholar] [CrossRef] [PubMed]
  6. Sun, H.W.; Wang, S.Y.; Zhang, S.J.; Yang, Q.; Hou, H.X.; Peng, Y.Z. Advanced nitrogen removal via nitrite from landfill leachate with high nitrogen concentration and kinetics of denitritation. Huanjing Kexue 2010, 31, 129–133. [Google Scholar] [PubMed]
  7. Onnis-Hayden, A.; Gu, A.Z. Comparisons of organic sources for denitrification: Biodegradability, denitrification rates, kinetic constants and practical implication for their application in WWTPs. Proc. WEF 2008, 17, 253–273. [Google Scholar] [CrossRef]
  8. Greenberg, A.E.; Clesceri, L.S.; Eaton, A.D. Standard Methods for the Examination of Water and Wastewater, 18th ed.; APHA: Washington, DC, USA, 1992. [Google Scholar]
  9. Kulikowska, D.; Bernat, K.; Konopka, K. Kinetics of denitrification with crude glycerine as a carbon source in landfill leachate treatment. Desalin. Water Treat. 2018, 116, 112–118. [Google Scholar] [CrossRef] [Green Version]
  10. Bernat, K.; Zaborowska, M.; Zielińska, M.; Wojnowska-Baryła, I.; Ignalewski, W. Biological treatment of leachate from stabilization of biodegradable municipal solid waste in a sequencing batch biofilm reactor. Int. J. Environ. Sci. Technol. 2021, 18, 1047–1060. [Google Scholar] [CrossRef]
  11. Koc-Jurczyk, J.; Jurczyk, Ł. Biological treatment of landfill leachate at elevated temperature in the presence of polyurethane foam of various porosity. Clean–Soil Air Water 2017, 45, 1500264. [Google Scholar] [CrossRef]
  12. Shao, M.; Guo, L.; She, Z.; Gao, M.; Zhao, Y.; Sun, M.; Guo, Y. Enhancing denitrification efficiency for nitrogen removal using waste sludge alkaline fermentation liquid as external carbon source. Environ. Sci. Pollut. Res. 2019, 26, 4633–4644. [Google Scholar] [CrossRef] [PubMed]
  13. Horová, D.; Bezucha, P.; Růžičková, I. Effect of carbon source and nitrate concentration on denitrification of high-nitrate wastewater. Environ. Prot. Eng. 2020, 46, 73–89. [Google Scholar]
  14. Smyk, J.; Ignatowicz, K. The influence of molasses on nitrogen removal in wastewater treatment with activated sludge. J. Ecol. Eng. 2017, 18, 199–203. [Google Scholar] [CrossRef] [Green Version]
  15. Guo, L.; Guo, Y.; Sun, M.; Gao, M.; Zhao, Y.; She, Z. Enhancing denitrification with waste sludge carbon source: The substrate metabolism process and mechanisms. Environ. Sci. Pollut. Res. 2018, 25, 13079–13092. [Google Scholar] [CrossRef] [PubMed]
  16. Mohana, S.; Acharya, B.K.; Madamwar, D. Distillery spent wash: Treatment technologies and potential applications. J. Hazard. Mater. 2009, 163, 12–25. [Google Scholar] [CrossRef] [PubMed]
  17. Cydzik-Kwiatkowska, A.; Zielińska, M. Waste-organics supported treatment of nitrogen-rich digester supernatant. J. Water Process Eng. 2020, 37, 101385. [Google Scholar] [CrossRef]
  18. Miao, J.; Zhao, Y.; Wu, G. Effect of organic carbons on microbial activity and structure in denitrifying systems acclimated to nitrite as the electron acceptor. Int. Biodeterior. Biodegrad. 2017, 118, 66–72. [Google Scholar] [CrossRef]
Figure 1. The average concentrations of COD and nitrogen compounds in the influent and effluent from parallel nitrifying reactors (I stage) at increasing volumetric exchange ratio (n).
Sustainability 13 06297 g001
Figure 2. Changes in organics (COD) and nitrogen compounds (N-NH4, N-NO2, N-NO3) during the working cycle in nitrifying reactors (the average values from parallel reactors are presented); the rates and the constant rates are given.
Sustainability 13 06297 g002
Figure 3. The COD concentrations in wastewater after denitrification (column chart) involving the distribution into the particular organics compounds present in the effluent after nitrification (COD(I)N), and the organics remaining from ACS after denitrification, which were calculated as the sum of COD(I)D and BOD7D; the subscribe (I) can be assumed to be the difficult-to degrade inert fraction of organics (M beet molasses, CG crude glycerine, DS distillery stillage).
Sustainability 13 06297 g003
Figure 4. Changes in the nitrite concentration (ac), a sum of nitrite and nitrate (df), COD concentration (gi) during the working cycle in the denitrifying reactors at the COD/N-NO3 ratio 8 (A) and 7 (B, B1, B2) with different carbon sources: beet molasses (a,d,g), crude glycerine (b,e,h) and distillery stillage (c,f,i).
Sustainability 13 06297 g004
Figure 5. Relationships between the type of carbon source and the removal rates of the oxidized forms of nitrogen (N-NOx) and organics (COD) depending on the COD/N-NO3 ratio.
Sustainability 13 06297 g005
Table 1. Characteristics of effluent after methane fermentation and after the nitrification stage.
CharacteristicsUnitsInfluent to the Nitrifying Stage
(Effluent after Methane Fermentation)
The Effluent after Nitrification (I Stage)
Alkalinitymeq/L73.809.34
pH8.449.08
CODmg/L1529.5214.5
BOD7mg/L532.15.6
BOD7/COD0.350.03
TKNmg/L498.55.2
N-NH4mg/L226.83.1
P-PO4mg/L15.44.9
N-NO2mg/L0
N-NO3mg/L456.0
COD/TKN3.141.7
BOD7/TKN1.11.1
Publisher’s Note: MDPI stays neutral with regard to jurisdictional claims in published maps and institutional affiliations.

