1. Introduction
Drawing on Fazzari et al. (1988) [
1], the recent literature has focused on the difficulties of gathering financial resources in the capital market, paying particular attention to the identification of constrained companies and their main characteristics [
2]. According to this evidence, firms’ access to the financial markets and the successful collection of the funds needed is affected by market dynamics and imperfections [
3,
4] or exogenous shocks [
5]. This condition might be negatively amplified by asymmetric information between parties and moral hazards [
6,
7,
8], which are even more significant if we consider SMEs, since the probability of being under financial constraint depends on a firm’s size [
9,
10,
11]. Therefore, it might prove too difficult or excessively costly for SMEs to finance investments and/or other managerial decisions using external resources and, consequently, companies could adopt internal resources if they are available [
12,
13] or, alternatively, trade credits [
14,
15,
16,
17]. Among managerial decisions, the payment of dividends represents one of the most important. On the one hand, the board of directors must decide whether to distribute the company’s earnings to its shareholders, which sends a positive signal to new investors on the market [
18,
19], decreasing the information asymmetries between firm management and shareholders [
20]. On the other hand, the same managers must consider the negative impact of payouts on internal liquidity, which could be amplified if the company is financially constrained [
21,
22]. Hence, we can expect a trade-off between these two opposing forces and, according to the recent literature, the importance of sending a positive signal seems to prevail, i.e., financially constrained firms tend to pay dividends to their shareholders [
23,
24], even if this policy might be financially unsustainable. Nevertheless, these results could rely on the specific socio-economic environment under investigation, as well as the companies’ access to the capital market.
Our work contributes to the exploration of this matter by investigating the Italian manufacturing of SMEs and analyzing the relation between the payment of dividends and credit rating. In particular, controlling for internal and external characteristics that could amplify financial constraints, we estimate the odds that the companies will pay out dividends according to their credit rating classes, testing the hypothesis that financial constraints matter in the dividend payout policies of Italian manufacturing SMEs (H
1). These rating classes are good proxies for financial constraints, reflecting the expected difficulties companies might encounter in accessing external financial resources depending on their financial health [
25,
26,
27].
Ceteris paribus, our findings show a positive relation between credit rating class and dividend payouts, meaning that, as financial constraints decrease, companies are ever more likely to pay out dividends. Accordingly, access to external financial resources matters in the dividend payout policies of Italian manufacturing SMEs, even though such payouts may represent an opportunity to improve firm reputation on the market, attracting future investors.
The manuscript is organized as follows.
Section 2 presents an overview of the current literature on measures of financial constraints.
Section 3 sets out the empirical strategy pursued and the case study under investigation (i.e., the Italian private limited SMEs). Finally,
Section 4 illustrates the results of the empirical analysis, while
Section 5 offers some conclusions.
2. Measures of Financial Constraints
According to Carreira and Silva (2010) [
2], there is no consensus on how to investigate whether companies are under financial constraints. Some scholars have proposed ad-hoc indexes based on financial information, e.g., the Kaplan and Zingales index, the Hadlock and Pierce index and the Whited and Wu index [
28]. In detail, the Kaplan and Zingales index is based on cash flow, market value, debt, dividends and cash holdings, each scaled by total assets [
29]. The Hadlock and Pierce index is based on size, size-squared and age [
10], while the Whited and Wu index is based on cash flow to assets, payment of dividends, long-term debt to total assets, size, sales growth and industry sales growth [
30]. Other researchers have focused on credit rating, examining both its absence (e.g., [
31,
32]) and its estimation (e.g., [
25,
26,
33]). In the former case, the authors highlight the expected constraints due to information asymmetries between parties on the public capital market (i.e., a higher price to collect the necessary financial resources), while in the latter case, the authors emphasize the solvency of companies, stratifying access to external resources according to their capacity to pay their obligations. This is exactly the approach adopted in this work; that is to say, credit rating score is used to estimate the expected financial constraints of SMEs on the capital market, assuming that the difficultness in accessing these resources rely on their solvency.
3. Methods and Data
The authors examine the relation between private limited SMEs’ payment of dividends and credit ratings in the Italian manufacturing industry between 2015 and 2019 (more than 250,000 observations) by merging two main sources of information: AIDA (Bureau van Dijk’s database) and CERIS Rating (CNR-IRCrES’s database). Note that, according to the EU Commission Recommendation No. 2003/361, we identify SMEs as firms with fewer than 250 employees and annual turnover below or equal to 50 million euros. The former contains financial and administrative information about Italian manufacturing companies, and current literature has widely attempted to investigate financial constraints (e.g., [
5,
13]), while the latter proposes the evaluation of their solvency through credit rating scores [
34]. In particular, following Falavigna (2012) [
34], CERIS Rating estimates the scores by means of a neural networks algorithm on the basis of key information extracted from the companies’ financial statements: total receivables due from shareholders, total tangible assets, total current assets, total shareholders’ funds, total provisions for risks and charges, total payables, total value of production, total production costs, and total financial charges. The decision to adopt this specific panel (2015–2019) relies on the availability of data, and, even if the analysis is limited to 5 years, we have the opportunity to investigate the last trend in this specific industrial environment.
Table A1 in
Appendix A presents an overview of the sample under investigation, showing the number of SMEs according to year and NACE codes.
The Italian manufacturing industry is an interesting case study for several reasons. On the one hand, Italy has one of the largest segments of SMEs in the world and an extremely high percentage of micro firms, which usually do not have access to the capital market due to a higher asymmetry level [
35]. Moreover, Italy has suffered from the sovereign debt crisis and the consequent banking crisis since 2011, and, despite the relevant expansive monetary intervention of the European Central Bank, Italian firms have increased their difficultness in accessing to bank credit [
36].
In particular, considering the
i-th active (private limited) SME, we study several logistic multivariate regression models (pooled sample) that take the following forms:
According to the proposed approach, the dependent variable of these models is DIV, which is a dummy variable equal to 1 if the company pays dividends at time t, 0 otherwise. In particular, considering positive profit at time t − 1, we estimate whether SMEs paid dividends comparing the variation of legal reserves between time t and t − 1, since, according to current law, dividends could be either paid or allocated to these reserves. Considering the control variables, Model A adopts:
The credit rating is given as a letter, representing each enterprise’s financial reliability in the short term [
38]. This method subdivides enterprises into 8 classes, each of which indicates a specific situation of default or non-default risk, as illustrated in
Table 1. The taxonomy of CERIS Rating follows the assessment system of Standard and Poor’s, with rating classes ranging from D (highest expected insolvency) to AAA (lowest expected insolvency).
Then, Model B expands the initial model by adding some internal and external characteristics, which could raise asymmetric information and companies’ difficultness on the capital market. On the one hand, coherent with the approach proposed by D’Amato (2020) [
5], we adopt a standard set of firm-specific variables that are widely used in the literature on SMEs’ dynamics and financial constraints:
STR, which is equal to total net fixed assets to total assets at time t − 1 (log transformation) and represents the assets structure of the observation, as well as relative collaterals;
SAL, which is equal to total sales at time t − 1 (log transformation) and represents the size of the observation;
AGE, which is a continuous variable indicating the seniority of the observation at time t (log transformation);
LIQ, which is an index equal to current financial and operating activities (i.e., cash and trade credits in the short-term) divided by current debts at time t − 1 (log transformation), representing the liquidity of the observation and its capacity to pay out dividends using its internal resources (note that we consider short-term credits and debts to estimate this index, i.e., maturing within 1 year.).
On the other hand, coherently with Agostino and Trivieri (2014) [
35], we introduce some additional control variables to detect for heterogeneity at sectorial level and to account for dualism in the degree of socio-economic development:
INDU, which is a matrix of 24 dummy variables equal to 1 if the productivity sector (2-digit code) belongs to the selected NACE sector at time t, 0 otherwise;
AREA, which is a matrix of 5 dummy variables equal to 1 if the observation is located in that NUTS 1 geographical macro area at time t (i.e., North West, North East, Center, South, and Islands), 0 otherwise.
Coherent with Czarnitzki and Hottenrott (2011) [
25,
26], the internal control variables are lagged by 1 year (i.e.,
CR,
STR,
SAL and
LIQ), which at least partially accounts for simultaneity issues concerning these variables [
37]. Moreover, banks and other financial institutions grant access to financial resources according to the most recent information available, extracted from the latest official financial statements (i.e., referring to the previous year). Lastly, in order to collect more robust results, we look at the
Median Absolute Deviation (
MAD) to detect and then drop the outliers [
39].
Table 2 shows some descriptive statistics, considering both the dependent variable (
DIV) and the main internal control variables (
CR,
SAL,
STR,
AGE and
LIQ).
Table 3 presents more detailed statistics regarding our sample, i.e., the percentage of companies that proceeded (or did not proceed) with the payment of dividends at time
t according to their credit rating at time
t − 1. Observing these statistics, we can detect a positive relation between the financial health of our companies (i.e., credit rating) and the actual payment of dividends. The econometric model tests this relation further, controlling for internal characteristics and external environmental variables.
4. Results
Table 4 reports the results of the econometric models, denoting the coefficients and the robust standard errors in parenthesis, as well as the relative
p-value (adopted software: Stata 13.1). According to Wald Chi Square statistics, all the models are statistically significant, i.e., at least one of the regression coefficients is not equal to zero (
Prob > chi2 equal to 0.0000). The overall pseudo R-squared is quite interesting, ranging between 19% (Model A) and 21% (Model B). Lastly, according to the correlation between the error term and the control variables (see
Table A2 in
Appendix A), there are not relevant endogeneity issues [
40].
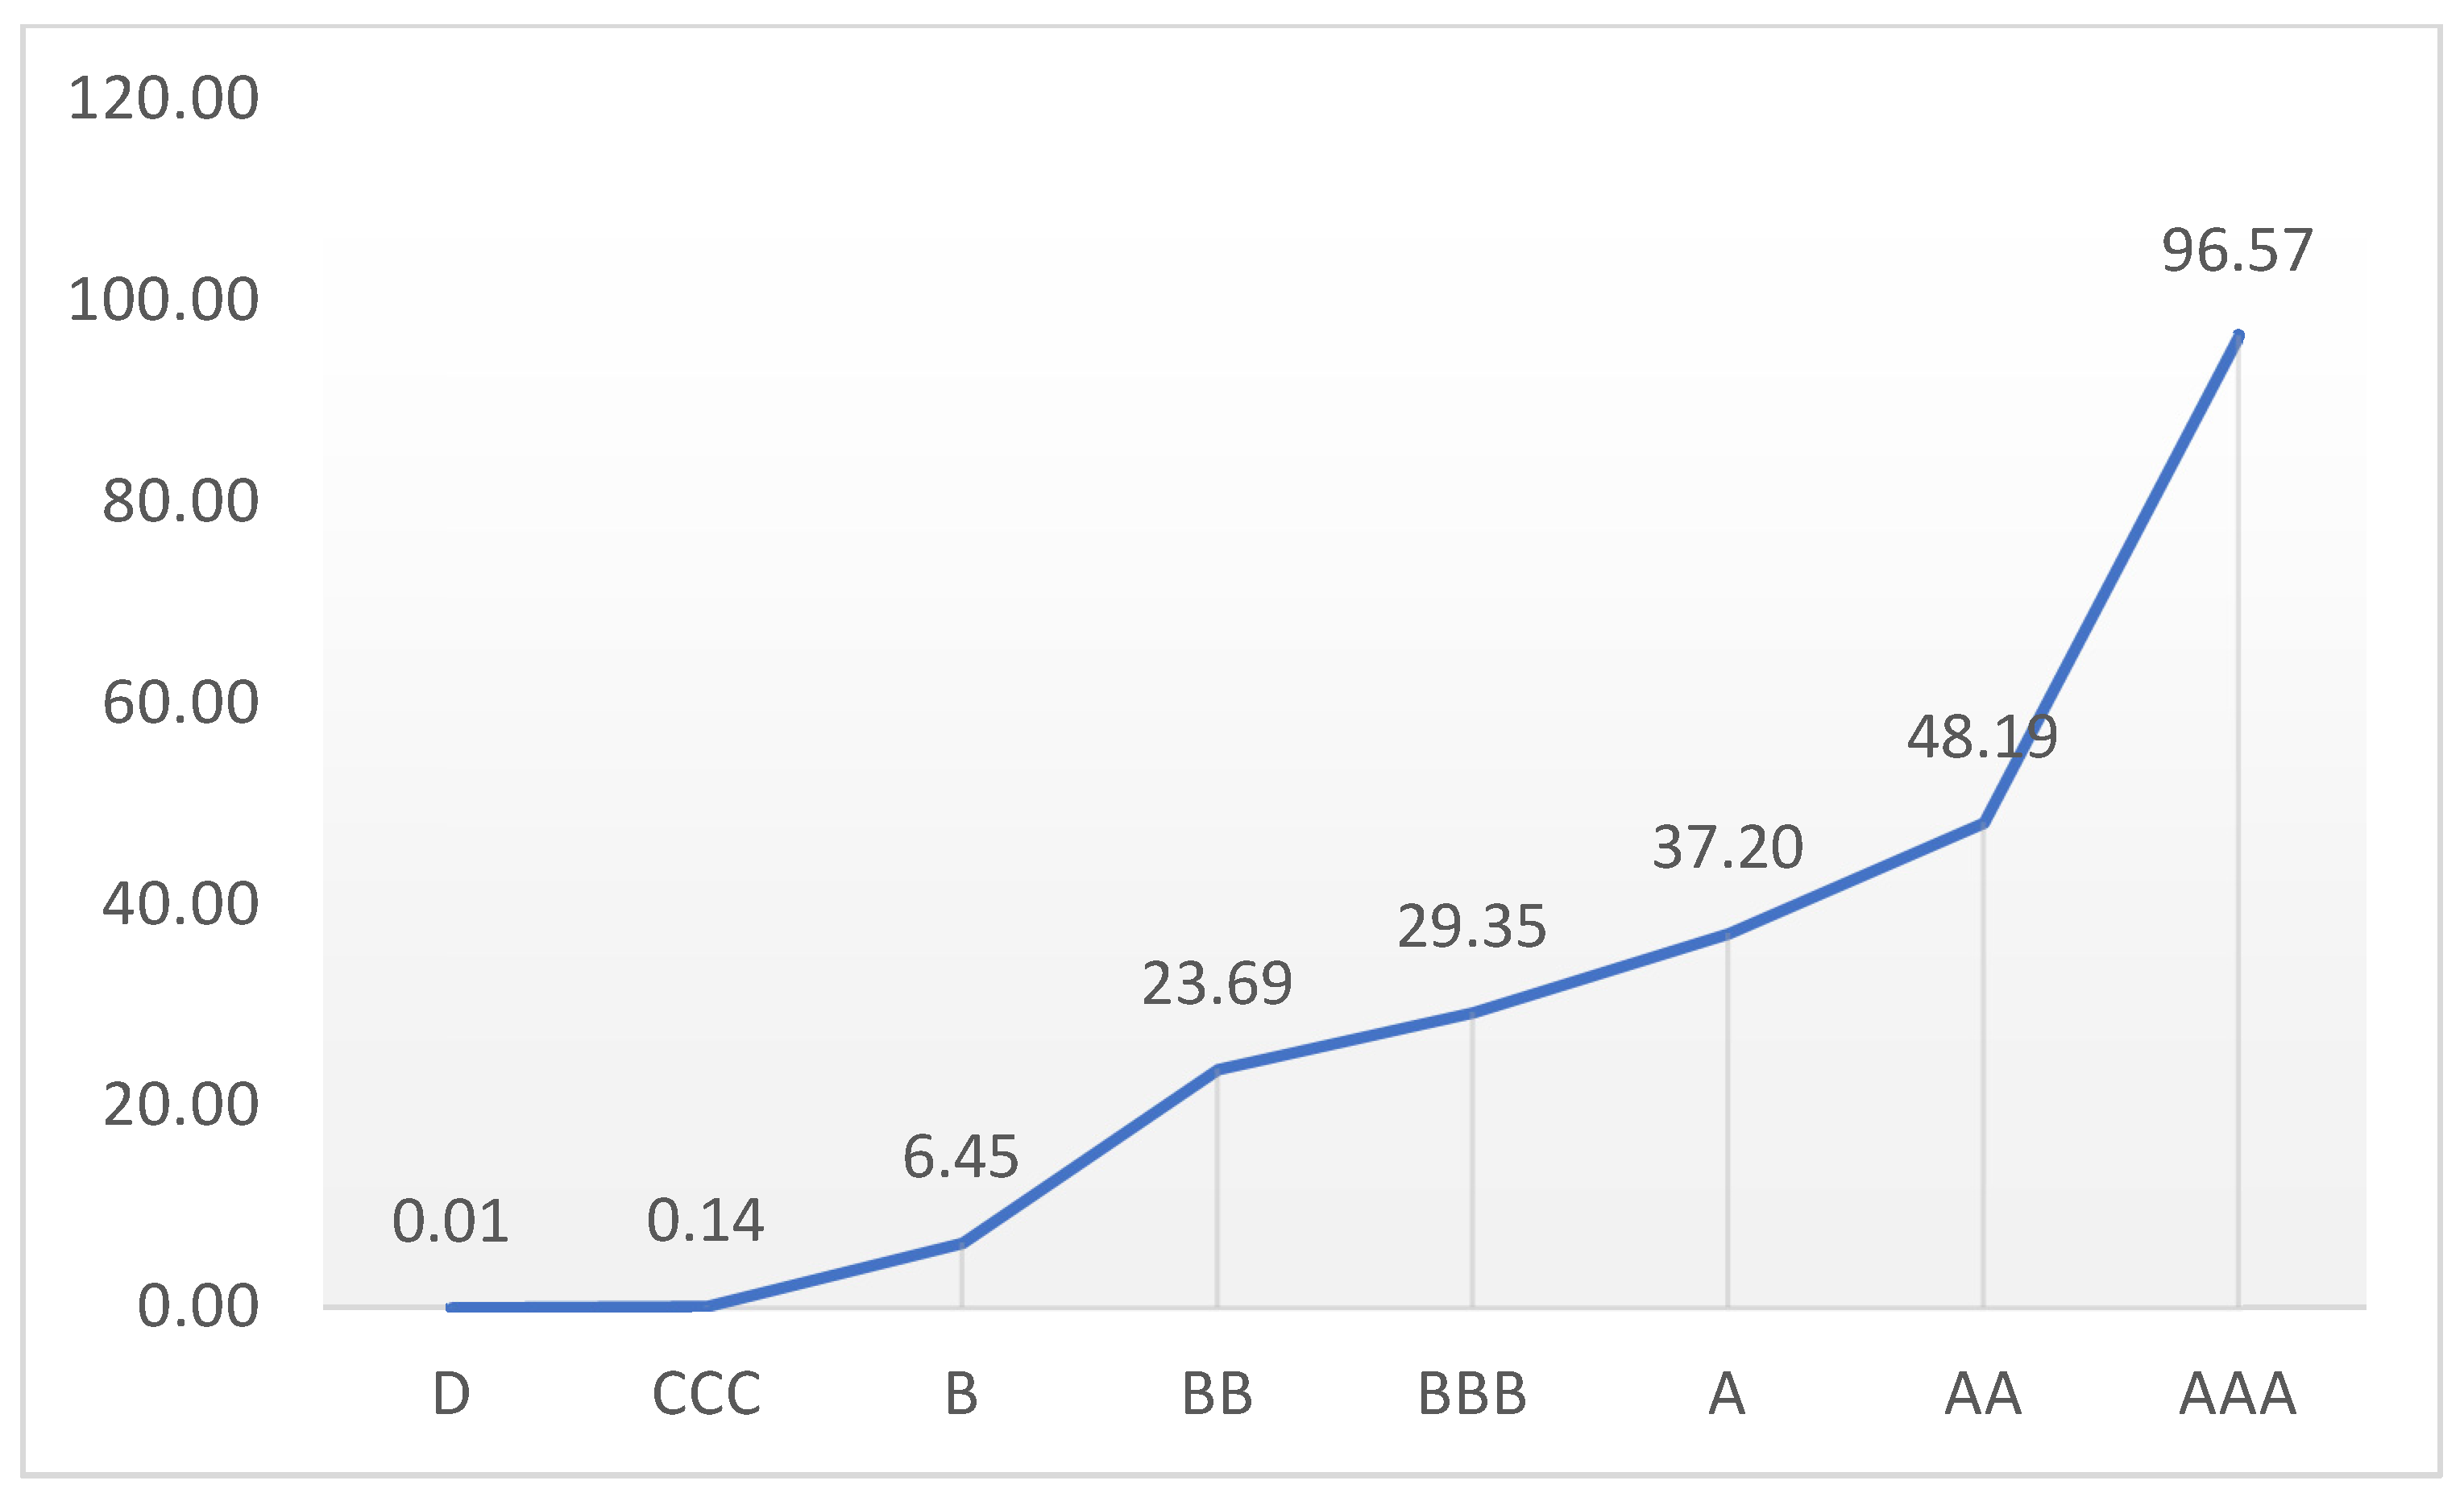
The coefficients of the credit rating scores are all statistically significant (
p-value < 0.01) and coherent among the different models. In particular, ceteris paribus, our results suggest that, as the companies’ financial health increases (i.e., moving from rating class D to AAA), the odds that they will pay out dividends to their shareholders also increase. Considering the coefficients estimated in Model B,
Figure 1 further clarifies these results, plotting the expected odds ratios of the companies paying out dividends according to their credit rating. What about the other key variables?
According to results and adopting relative marginal effects,
ceteris paribus, for one instant change in internal liquidity (i.e., raising the independent variable by one unit), the change in probability of paying dividends increases by 1.79% (
p-value < 0.01), while, considering size and asset structure, the probability increases, respectively, by 7.51% and 0.39% (
p-value < 0.01). These results confirm that firms’ size can support the access to external financial resources [
10], increasing the probability of paying dividends, while internal liquidity is fundamental to support managerial decisions in SMEs [
13]. However, looking at the firms’ seniority, we can identify the signaling effect. Indeed, ceteris paribus, the change in the probability of paying dividends for one instant change in seniority decreases by 6.23% (
p-value < 0.01); that is to say, younger SMEs use to pay dividends.
Hence, according to the collected results, we cannot reject the hypothesis that financial constraints and the relative difficulty of access to external resources matters in the dividend payout policies of Italian manufacturing SMEs (H1), even though such payouts may represent an opportunity to improve firm reputation on the market. Focusing on the proposed “amplification factors”, younger SMEs appear interested in signaling their expected profitability to attract future investors and/or to support the future requests of external financial resources on the capital market, even if there could be difficultness in performing such payments.
4.1. Robust Test
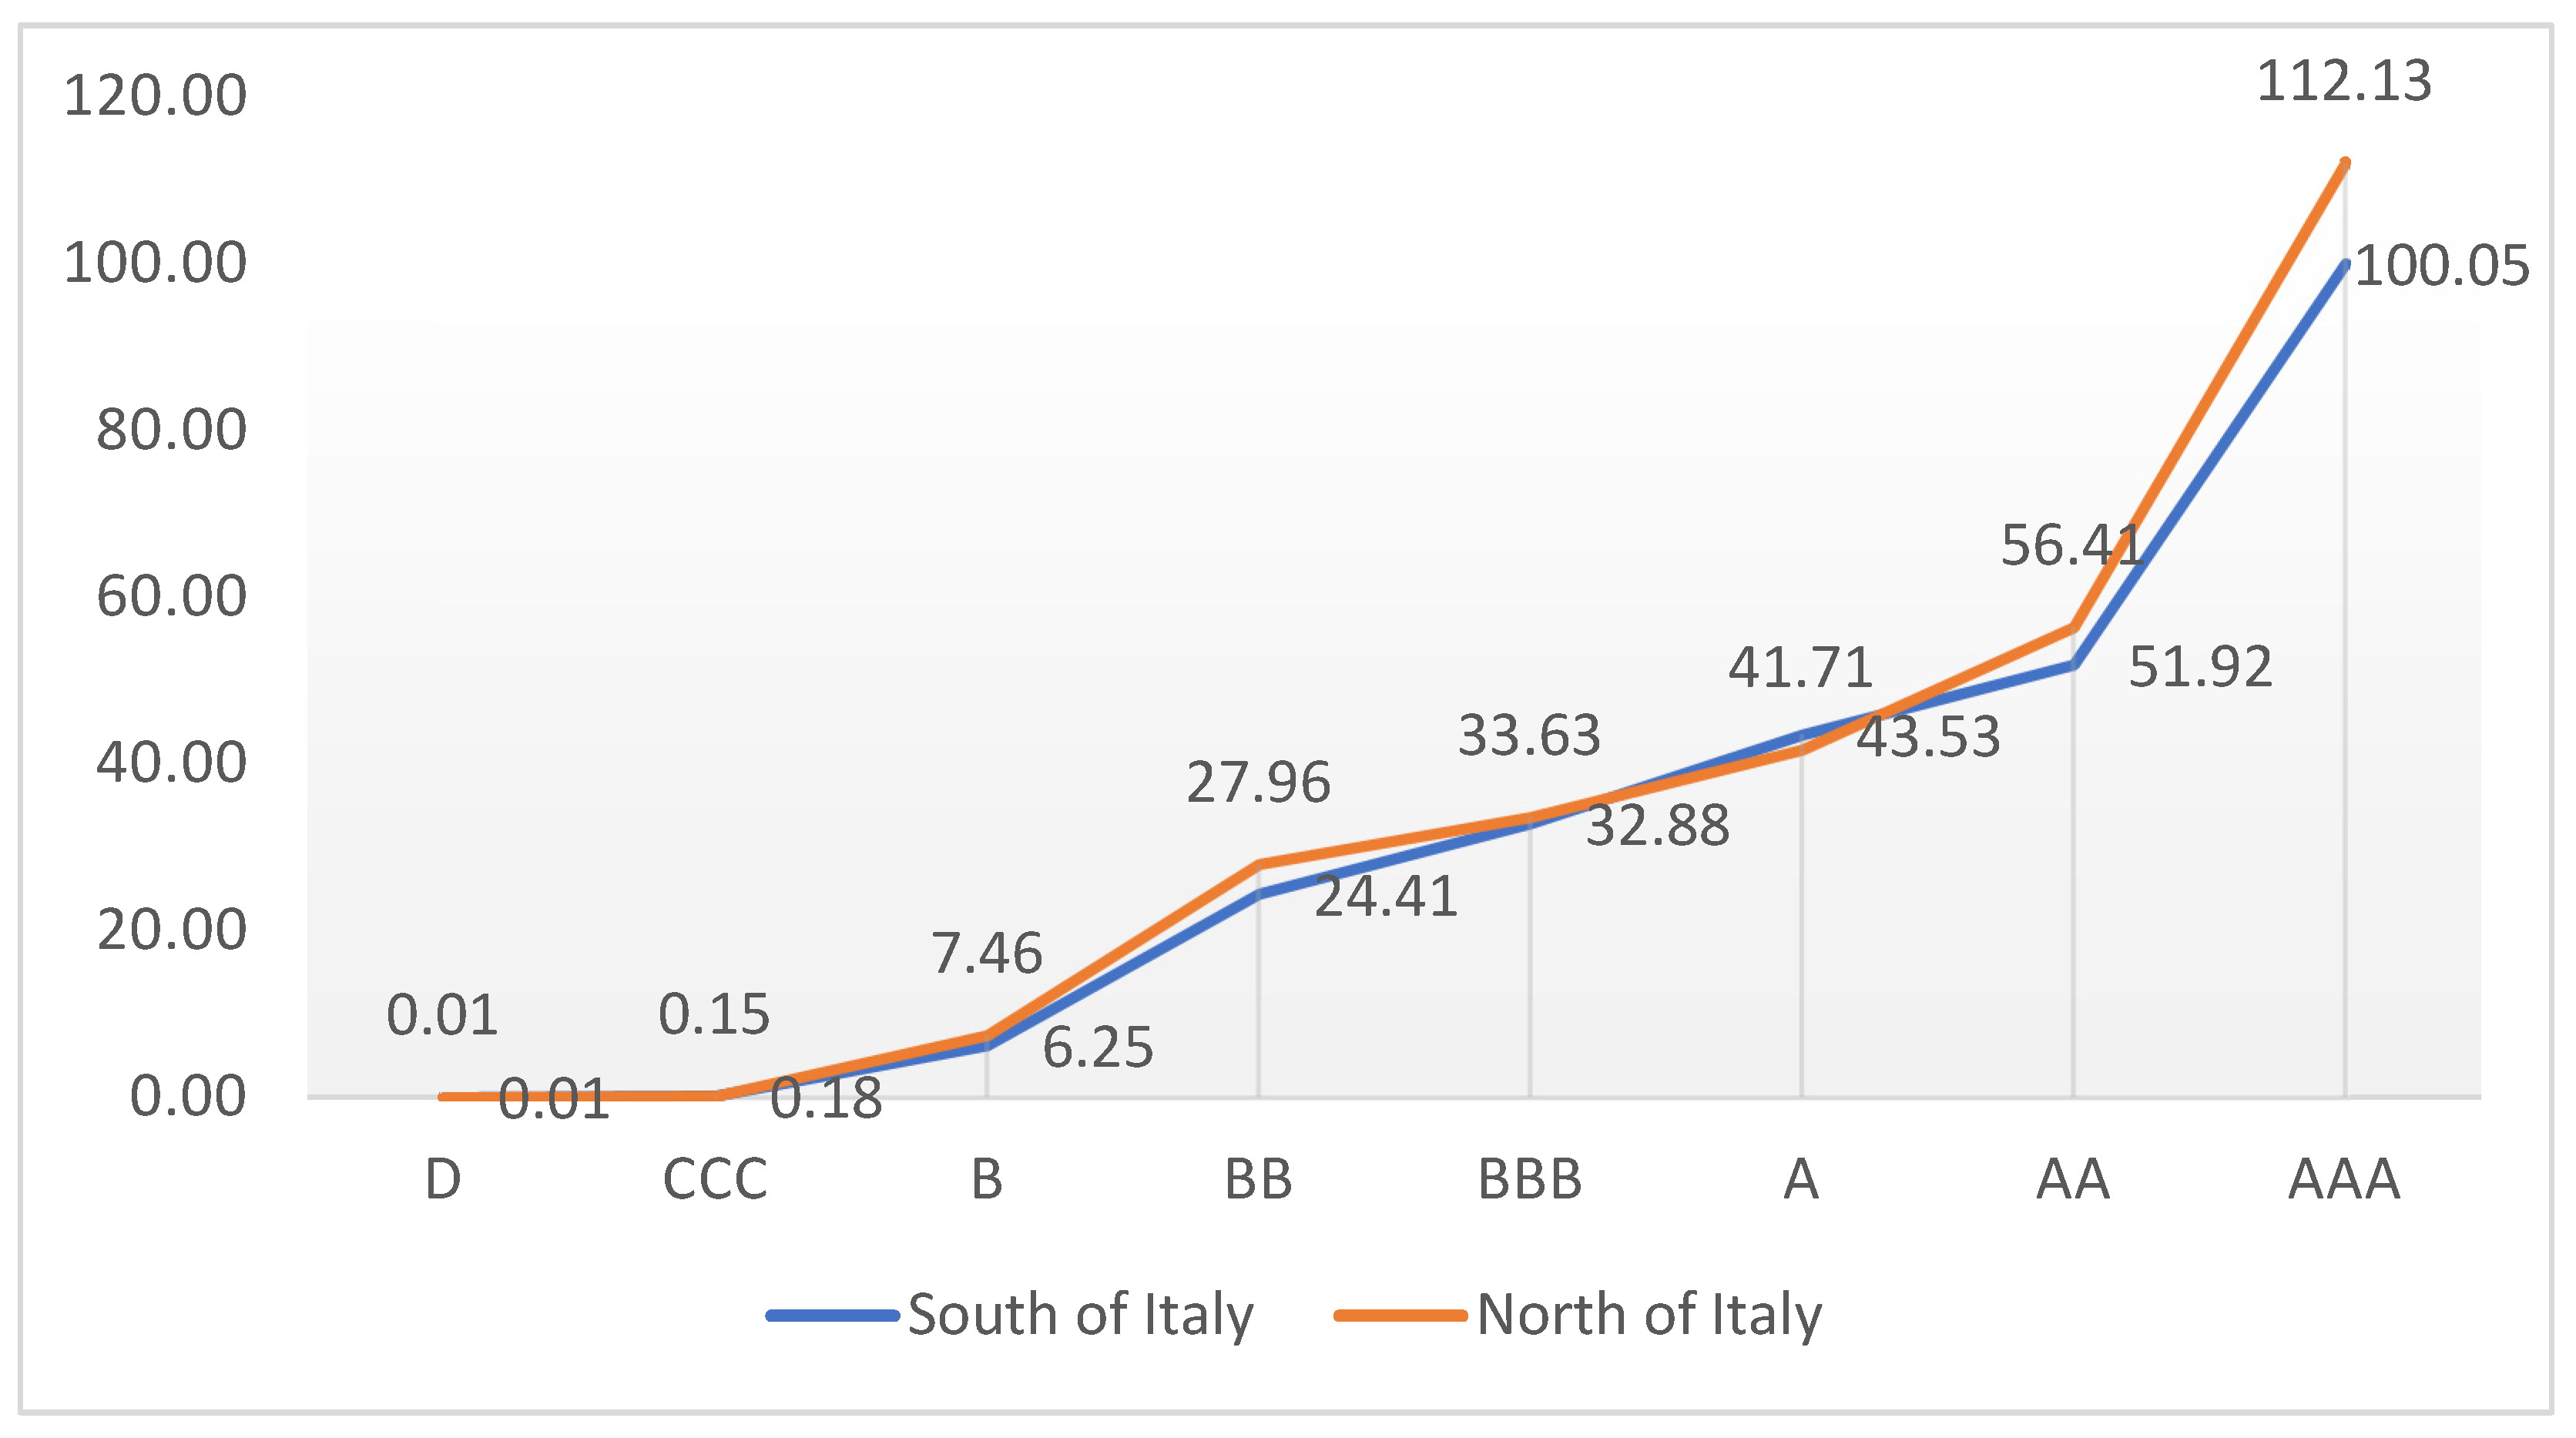
Table 5 presents micro analysis as a robust test, considering Models A and B with, respectively, all manufacturing SMEs located in the North and in the South of Italy. Coherent with the previous results, the table reports both the coefficients and the robust standard errors in parenthesis, as well as the relative
p-value (adopted software: Stata 13.1). The North of Italy is the Italian geographical macro area with the best-performing institutional system and the highest access to the capital market, while the lowest one characterizes the South of Italy [
41]. Focusing on these areas, we have the opportunity to test the main national results against those of the most dynamic and competitive environment in the country (i.e., the North of Italy) and the most underdeveloped one (i.e., the South of Italy), collecting evidence that ought to be even more robust.
According to these results, our evidence is rather robust, since we can observe coherent statistically significant relations across the two geographical areas. Indeed, analyzing both the North and the South of Italy and the behavior of companies located in these two specific geographical areas, as the companies’ financial health increases (i.e., moving from rating class D to AAA), the odds that they will pay out dividends to their shareholders also increase.
Figure 2 further confirms the previous results, plotting the expected odds ratios of the SMEs paying out dividends according to their credit rating (coefficients estimated in Model B).
Finally,
Table A3 in the
Appendix A proposes an OLS multivariate regression models (pooled sample), considering the entity of these dividends as a dependent variable (log transformation), and confirming the previous results.
Note that the reproducibility of our results is possible if readers have access to AIDA, which is Bureau van Dijk’s dataset on the Italian manufacturing industry, and specific authorization is required since the data are protected by property rights. Lastly, when readers have extracted all the necessary information (i.e., total receivables due from shareholders, total tangible assets, total current assets, total shareholders’ funds, total provisions for risks and charges, total payables, total value of production, total production costs, and total financial charges), following Falavigna (2012) [
34], they can reproduce the CERIS Rating scores.
4.2. Limits and Alternative Hypothesis
This work focuses on private limited SMEs, which trade their shares infrequently and could have little need to signal to investors through dividend increases. Accordingly, the reader might argue it is natural that companies with financial constraints could have little incentive to pay dividends to signal to investors. Hence, the finding that the dividend signaling effect is small in these firms could not be particularly surprising, and the collected results might be explained by the life-cycle hypothesis [
42,
43]. On the one hand, companies in the early stages of growth have a high demand for capital, so they are willing to grow by investing in investment proposals with a positive net present value instead of paying it out even if they are profitable. On the other hand, companies in the mature stage have fewer investment opportunities than growing companies, which might result in lower profit reinvestment rates, lower profitability, and lower growth potential. Accordingly, the need for payout increases due to concerns about the accumulation of free cash flow in the company, and, in addition, as corporate profitability stabilizes corporate risk declines, the importance of retained earnings for sudden capital needs decreases.
Hence, if we assume that credit ratings are good proxies of SMES’ maturity and stability, the positive relationship between these scores and dividend payout policy could be successfully explained by the life-cycle hypothesis. Nevertheless, if we assume that the size of our observations is a better proxy of SMES’ maturity and stability (i.e., SMEs’ total sales), we can confirm the suggested life-cycle hypothesis (positive coefficient, which is statistically significant), as well as the hypothesis of the negative impact of financial constraint on the decision to pay dividends. New data, if available, could shed new light on these alternative hypotheses, which could be the best proxy to represent SMES’ maturity and stability.
Lastly, considering the transferability of these results and their applicability to other realities, we have to highlight the presence of clear limits in this work. Indeed, this manuscript is considering the investigation of a very peculiar sample of firms (i.e., the Italian SMEs) and their specific environment. The behavior of these SMEs could be affected by the socio-economic and cultural values of this specific environment, as well as by institutional conditions. Hence, particular attention should be adopted in the replicability of our predictions in alternative markets with different values and/or conditions.
5. Conclusions
According to Brav et al. (2005) [
44], investigations on dividend payout policy focus on issues such as the role of taxes and agency considerations, as well as on the reason young firms prefer not to pay dividends [
45] while others still pay substantial dividends [
46]. Even if the current literature is widespread, according to Driver et al. (2020) [
47], there is no single encompassing theory of dividend payout, and this work aims to shed new light on financial constraints and at investigate the signaling hypothesis.
Financially constrained companies might decide to proceed with dividend payouts, even though their access to external financial resources is restricted, because such a decision sends a positive signal to investors [
23,
24]. This work focuses on the relation between the payment of dividends and credit ratings, testing the link between these two variables and shedding new light on the aforementioned corporate dynamics. In detail, our analysis contributes to the debate on the matter by examining the determinants of dividend payouts in terms of credit rating, stratifying firms according to their short-term solvency (i.e., 1 year) and confirming the existence of a positive relation between the payment of dividends and the firms’ financial health. Our evidence points to the fact that, ceteris paribus, a company classified as AAA has odds of paying dividends 96.57 times greater than a company classified as D or CCC—and these odds start to drop as the firms’ solvency decreases.
Hence, the Italian SMEs classified in the lowest credit rating classes are those with the lowest expected probability of paying dividends, confirming the evidence that financial constraints matter in the dividend payout policy of this specific industry, as well as firms’ desire to maintain their financial sustainability. Hence, these results are consistent with Chen and Wang (2012) [
21] and Pathan et al. (2016) [
22], even if there is also evidence to support the signaling theory. Indeed, younger SMEs seem interested in signaling their expected profitability to attract future investors and/or to support the future requests of external financial resources on the capital market, even if there could be difficultness in performing such payments.
The next directions of our research in this specific area concern the investigation of public limited companies, focusing on the expected differences with respect to private limited SMEs. In particular, we would like to investigate whether heterogeneity exists in firms’ behaviors under financial constraints according to their legal status, as well as their size. Moreover, we plan to investigate other dynamics related to financial constraints and dividend payout policy (e.g., tax avoidance behaviors and other opportunistic strategies to survive on the market with limited access to the capital market).


