
Evaluating the Impact of Sight Distance and Geometric Alignment on Driver Performance in Freeway Exits Diverging Area Based on Simulated Driving Data


Abstract
:1. Introduction
2. Calculation Method
2.1. Concept Load
2.2. Calculation of the Radius
2.2.1. Left Circular Curve
2.2.2. Right Circular Curve
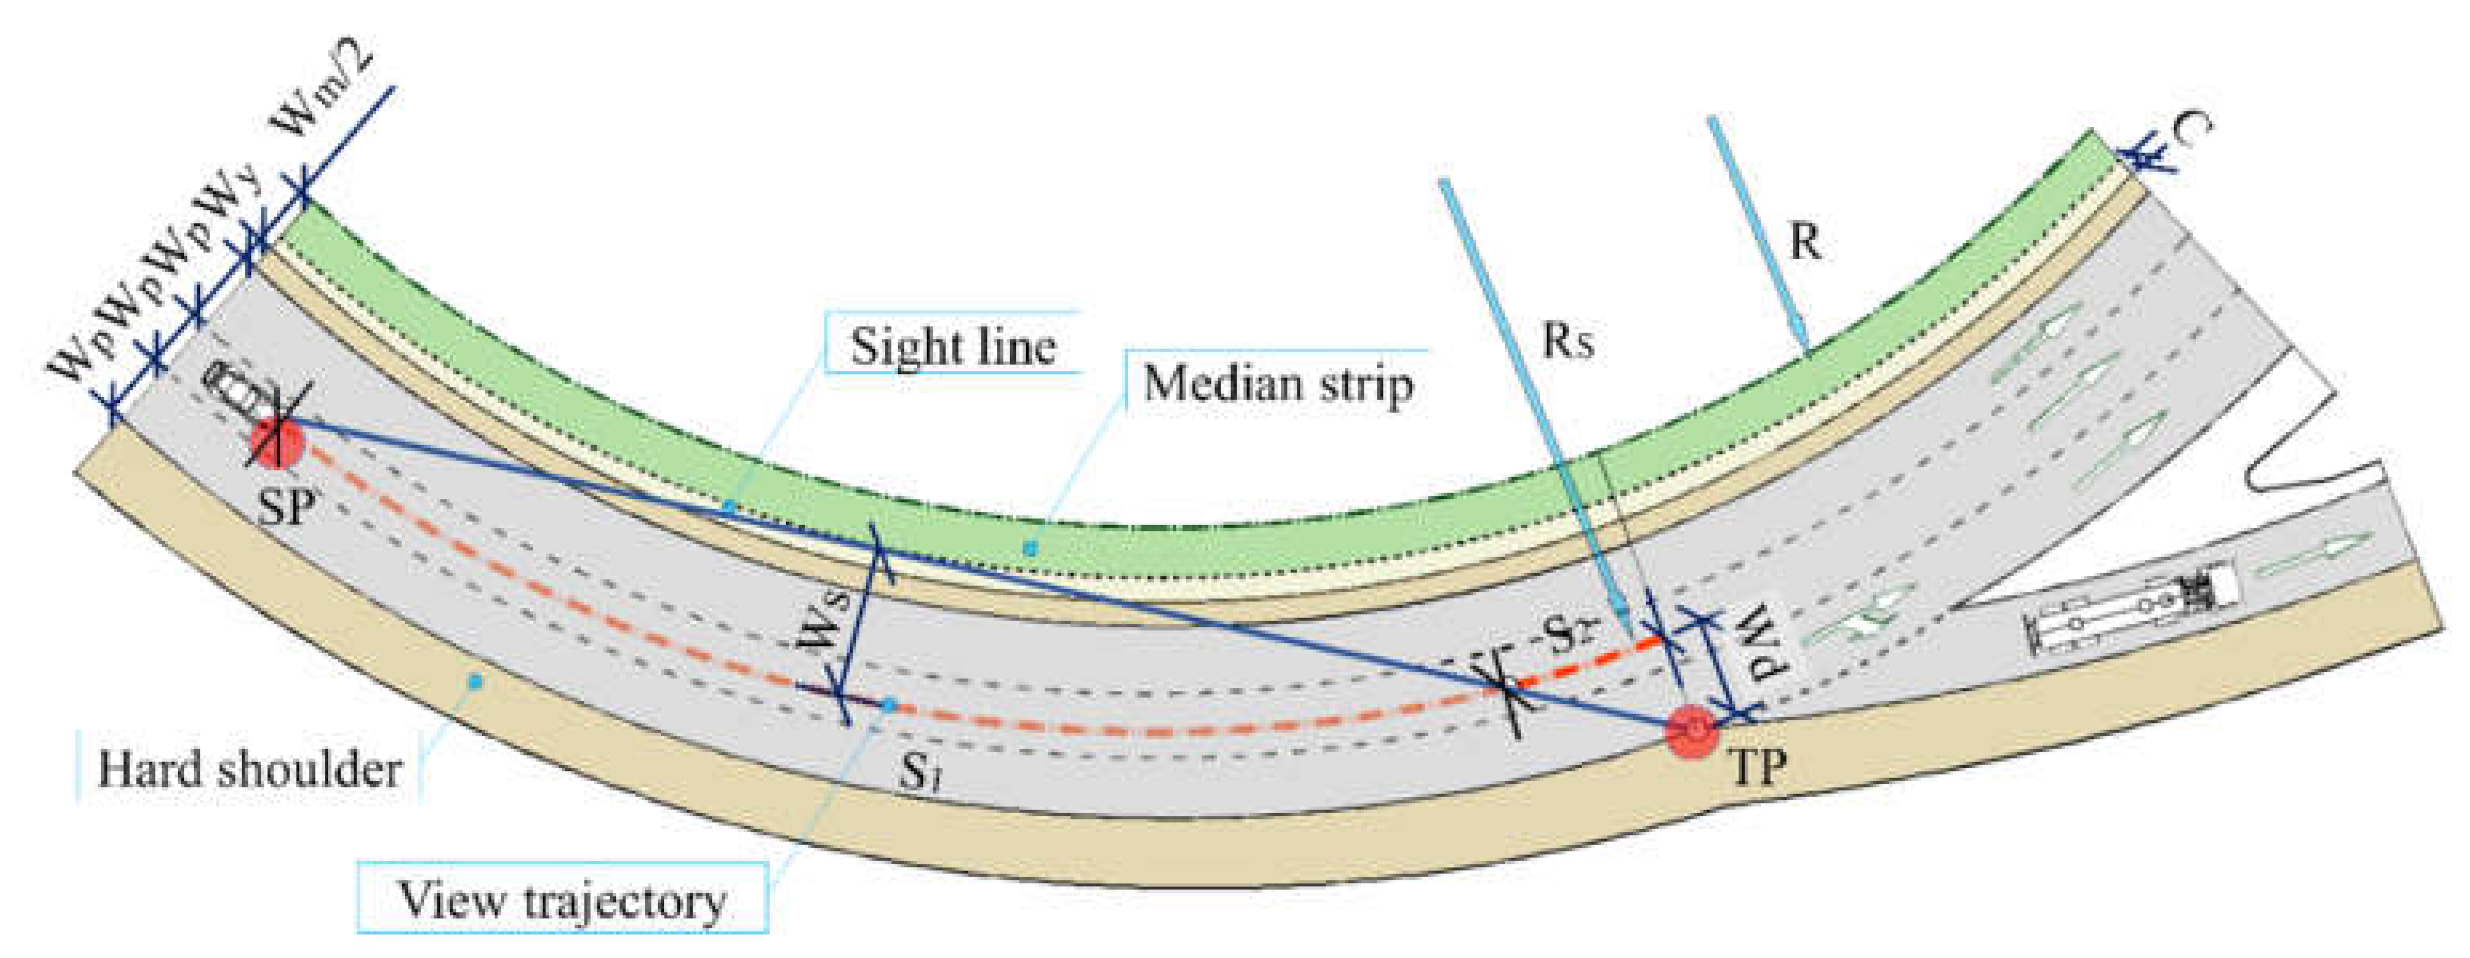
2.3. The Position of Viewpoint
3. Materials and Methods
3.1. Participants
3.2. Driving Simulator
3.3. Driving Scenarios and Environment
3.4. Experimental Design
3.5. Procedure
4. Analysis and Results
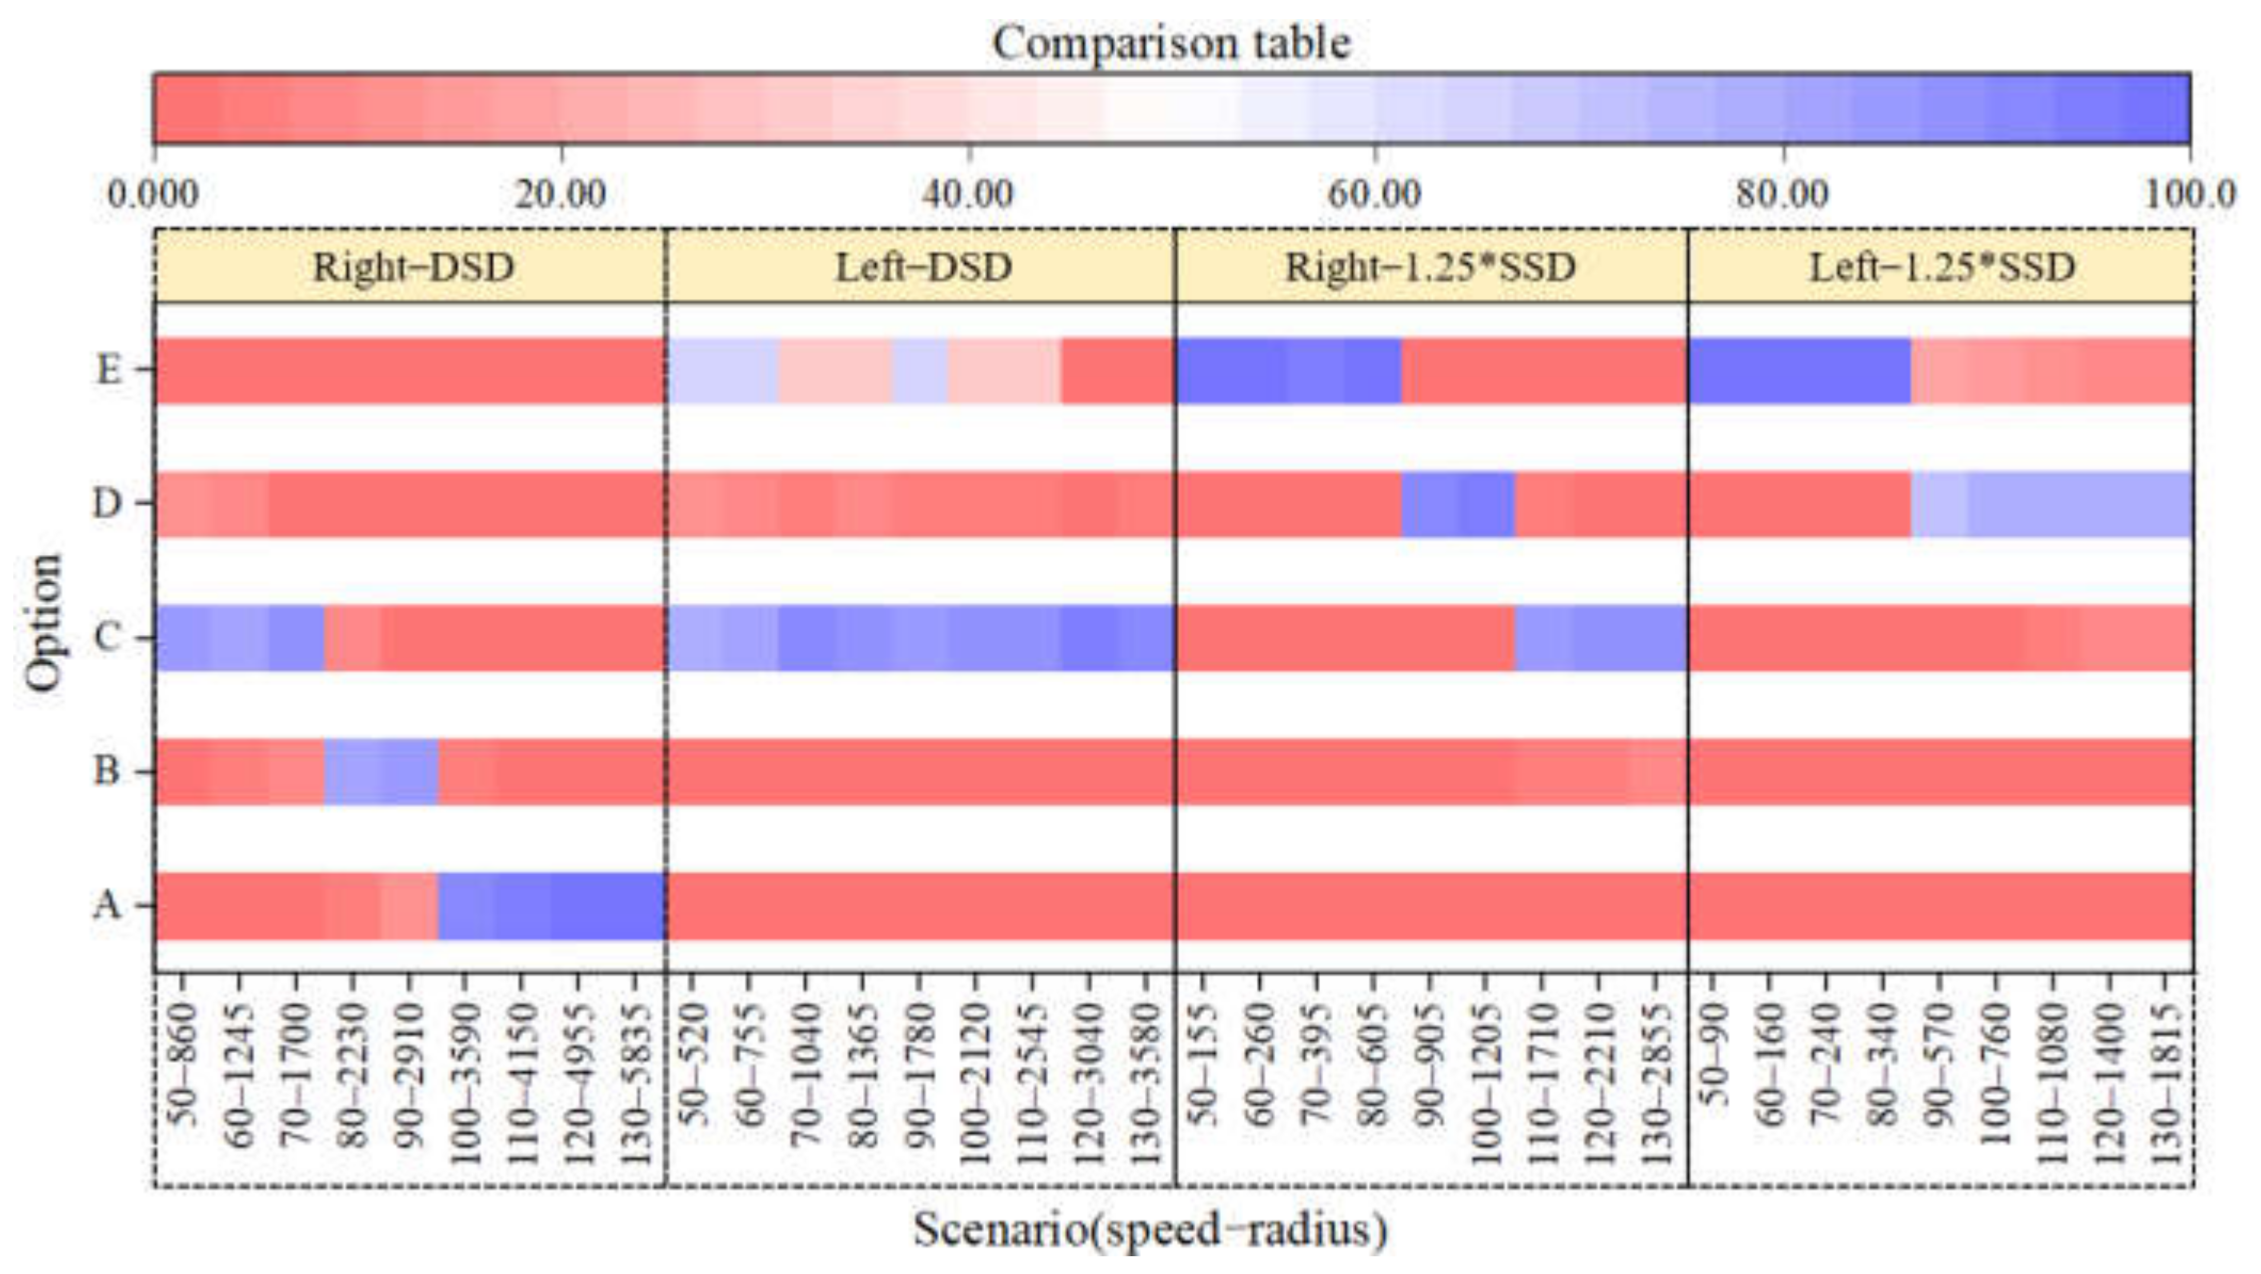
4.1. Thermodynamic Chart
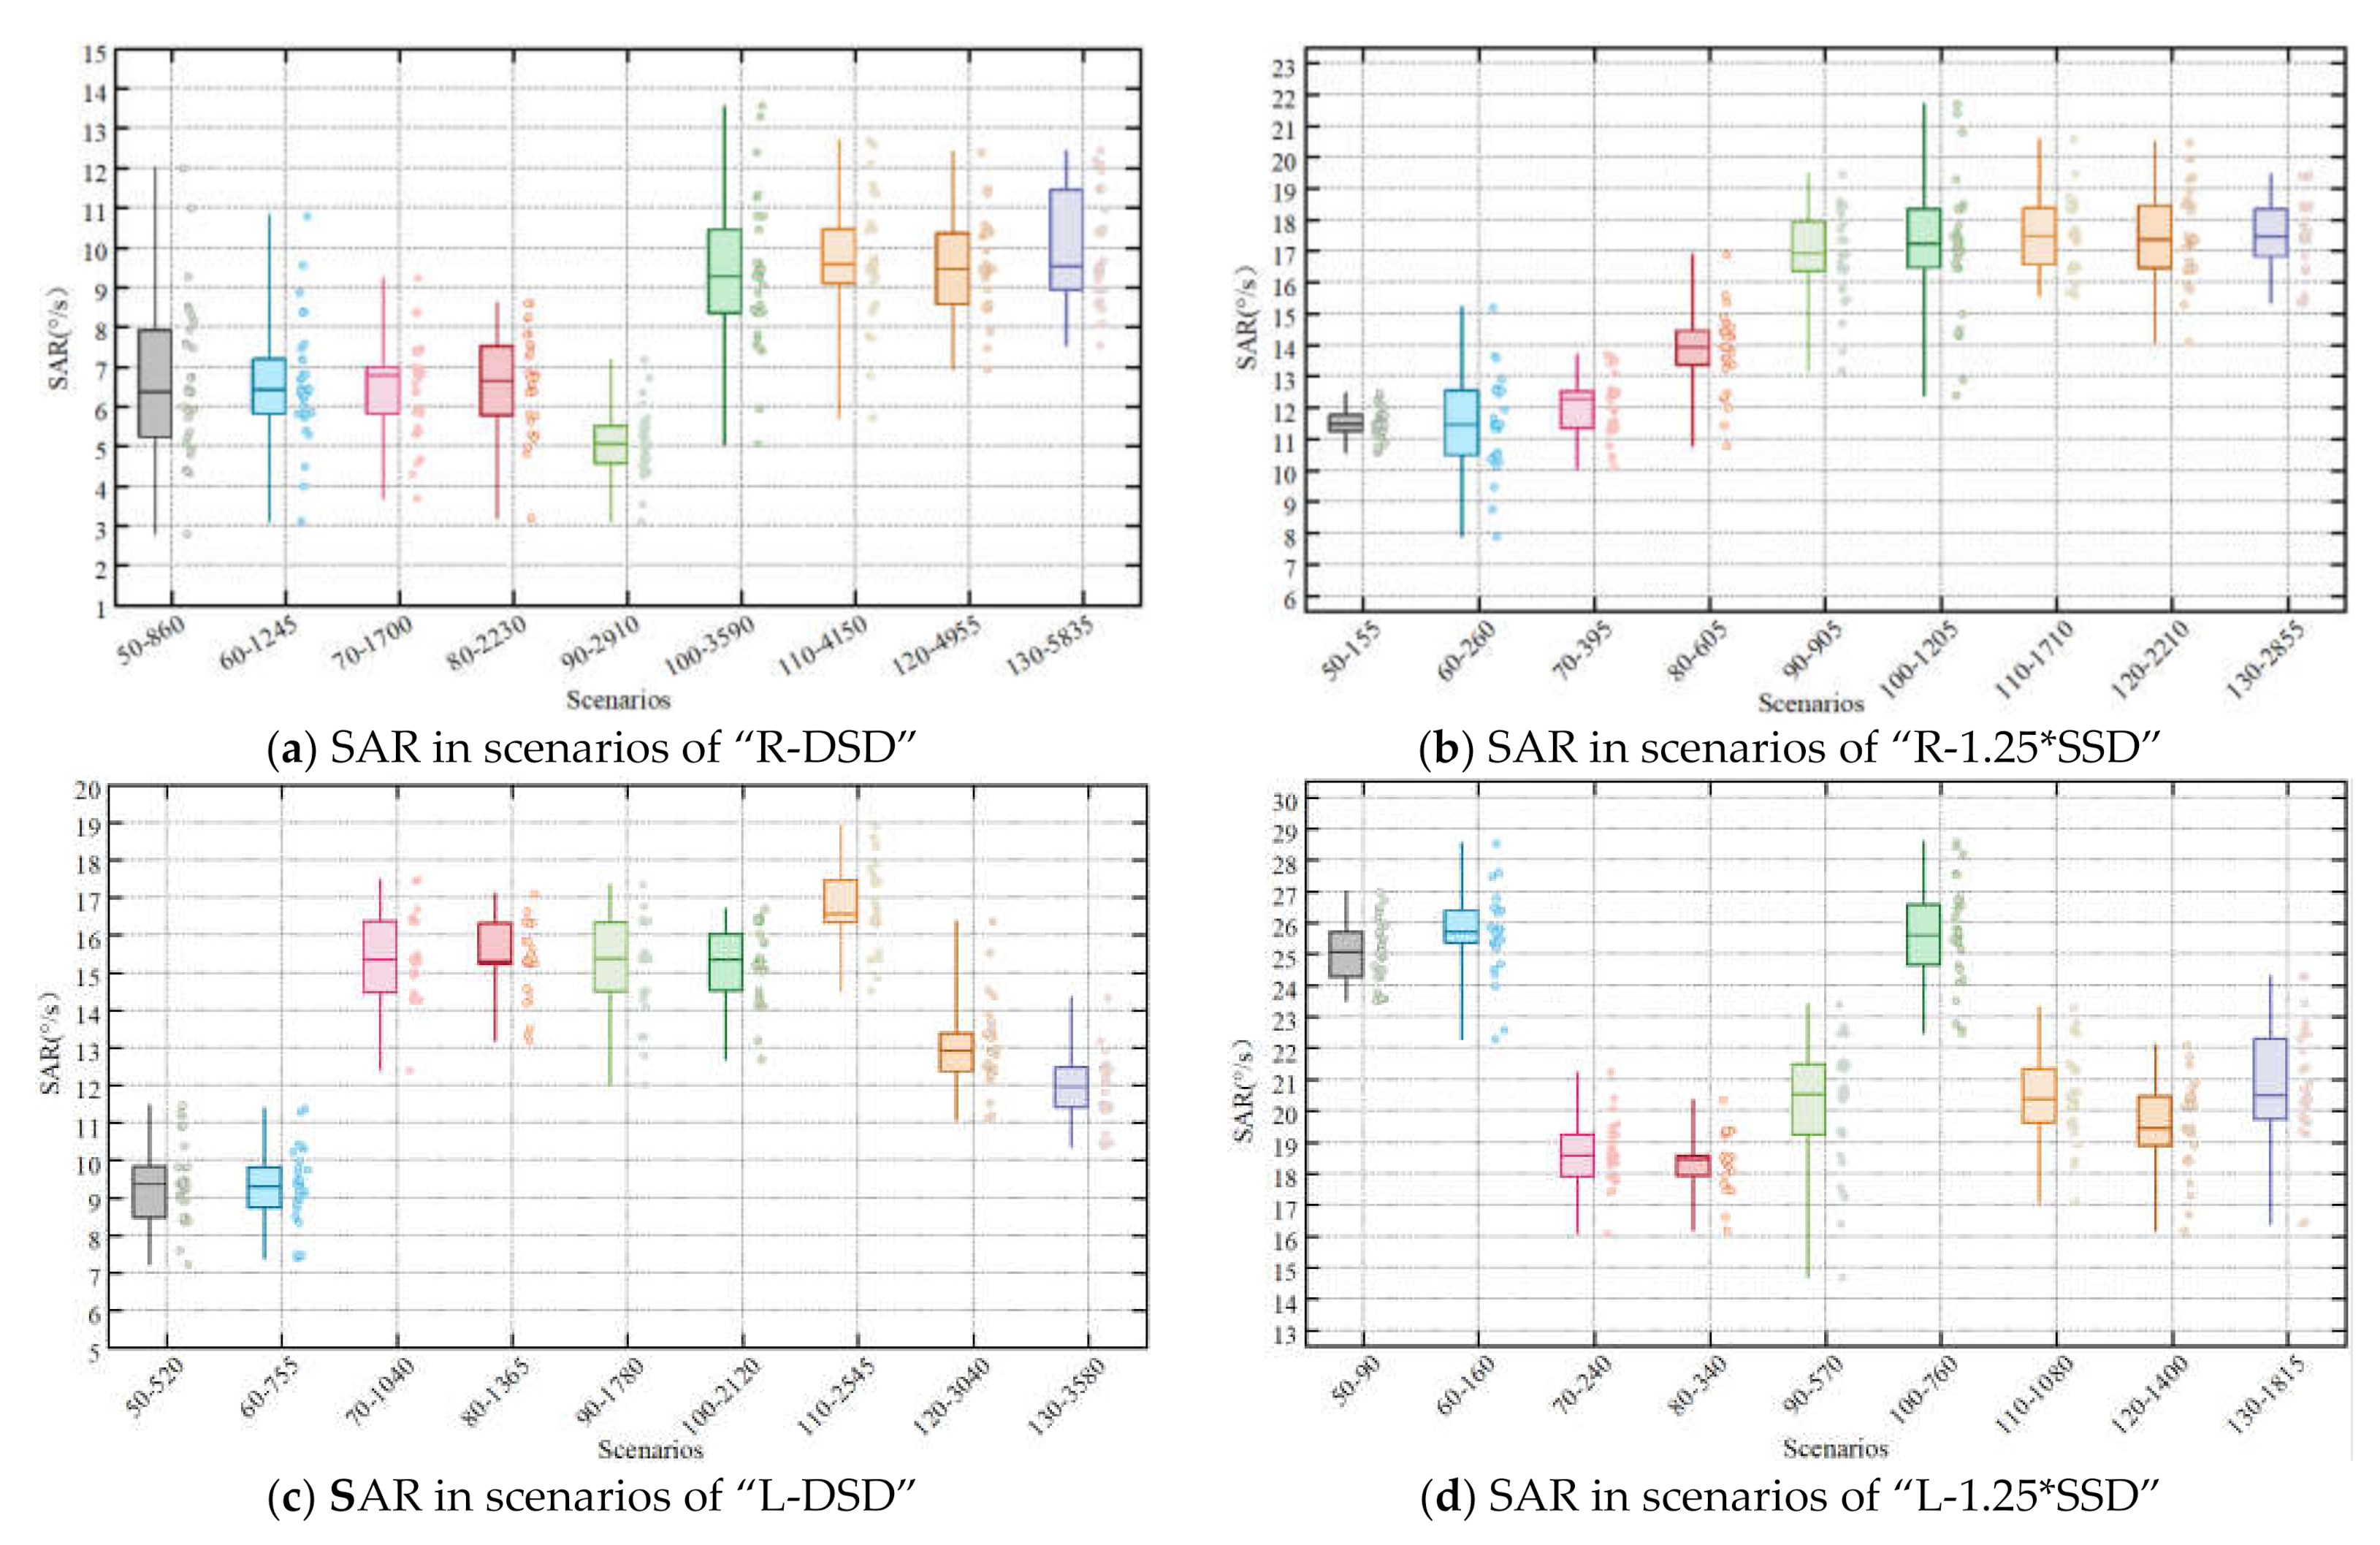
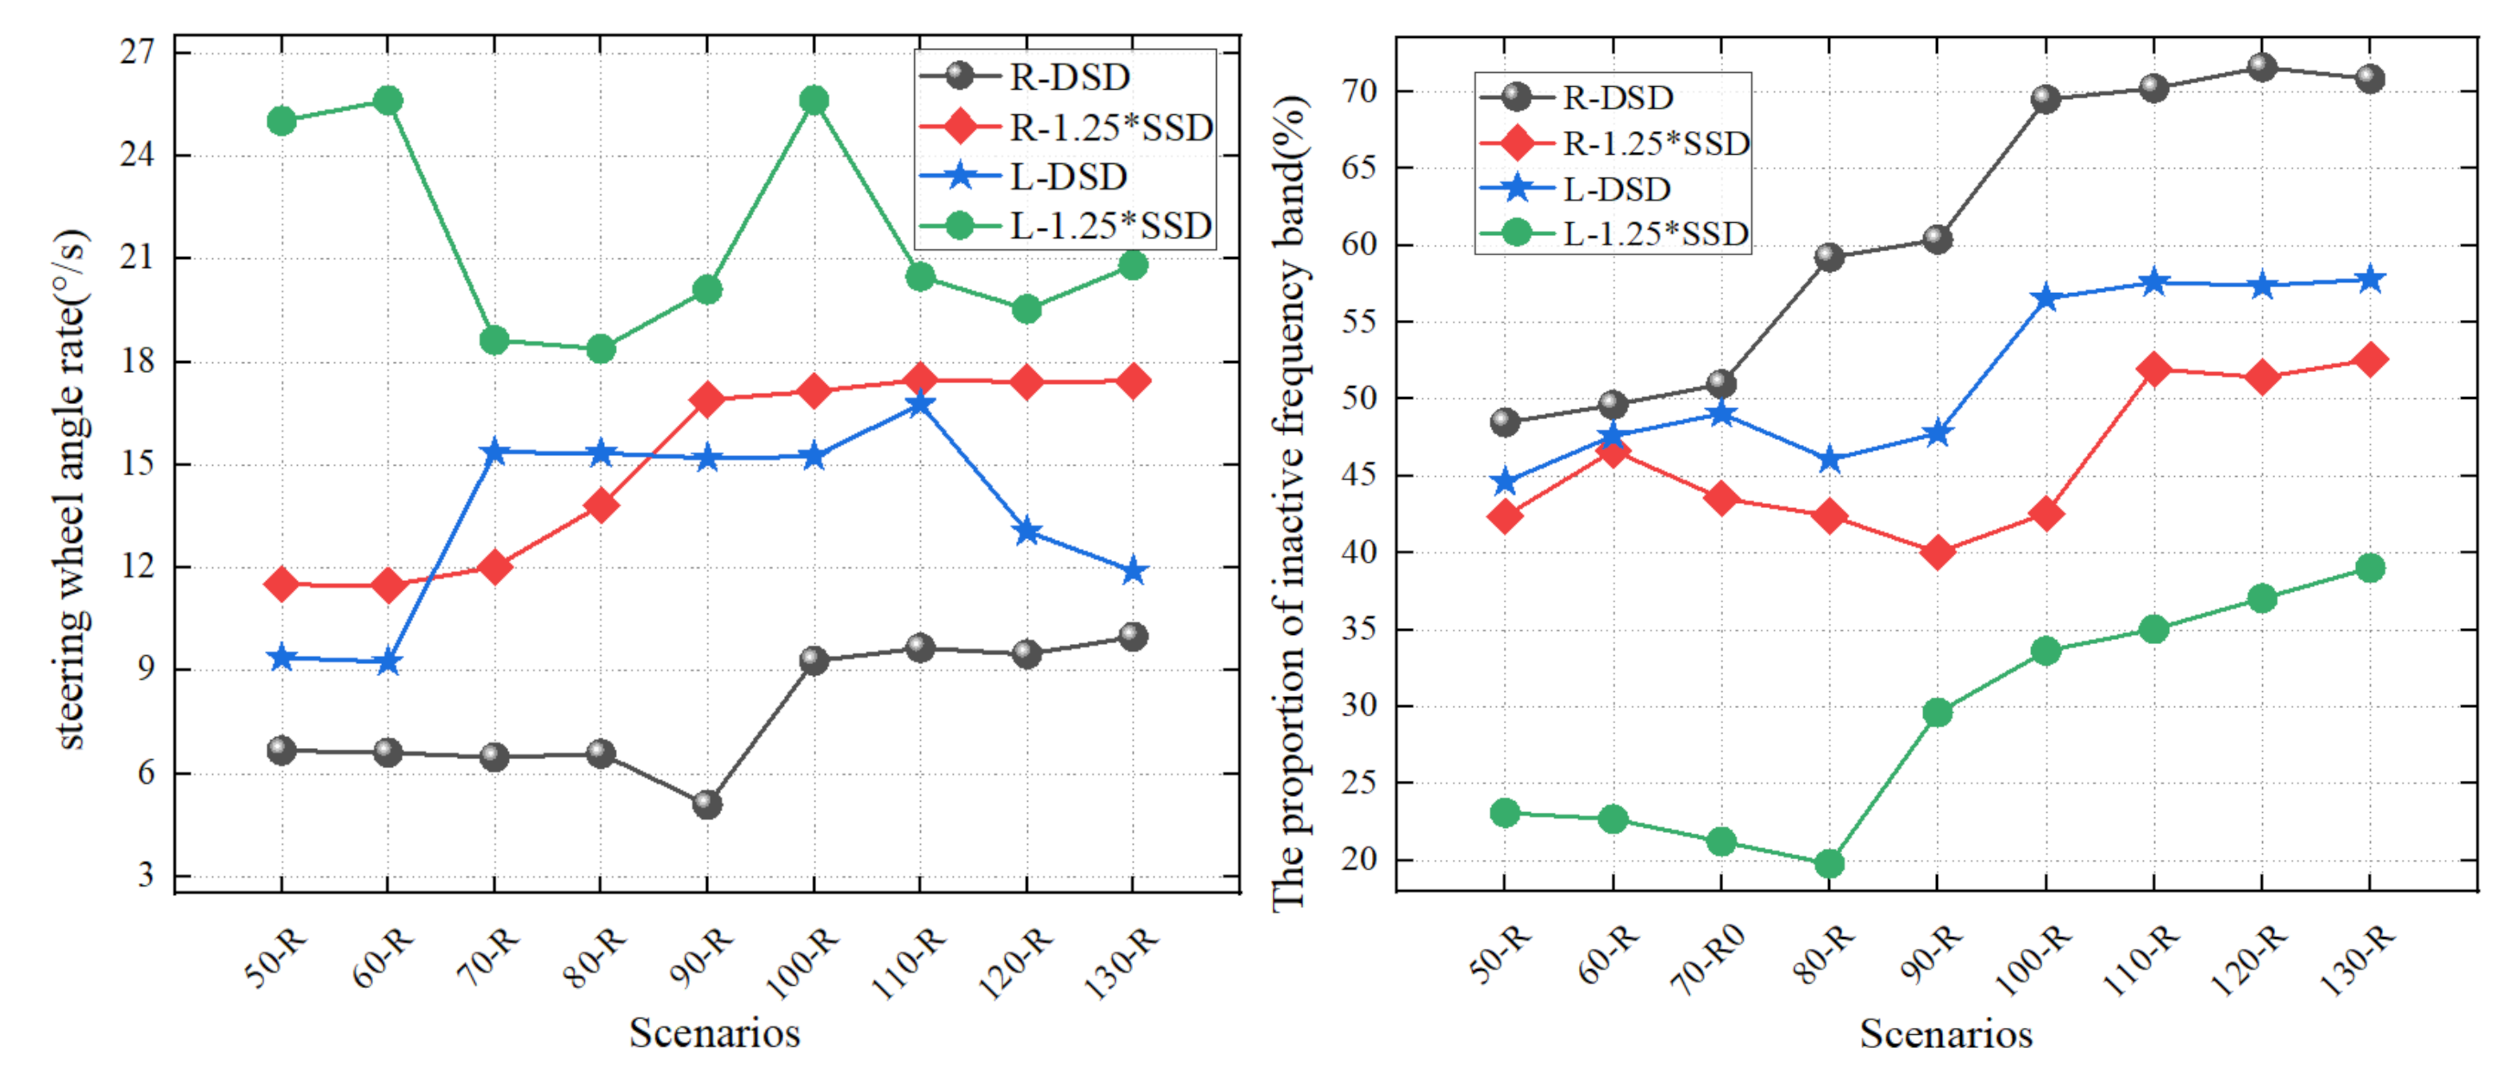
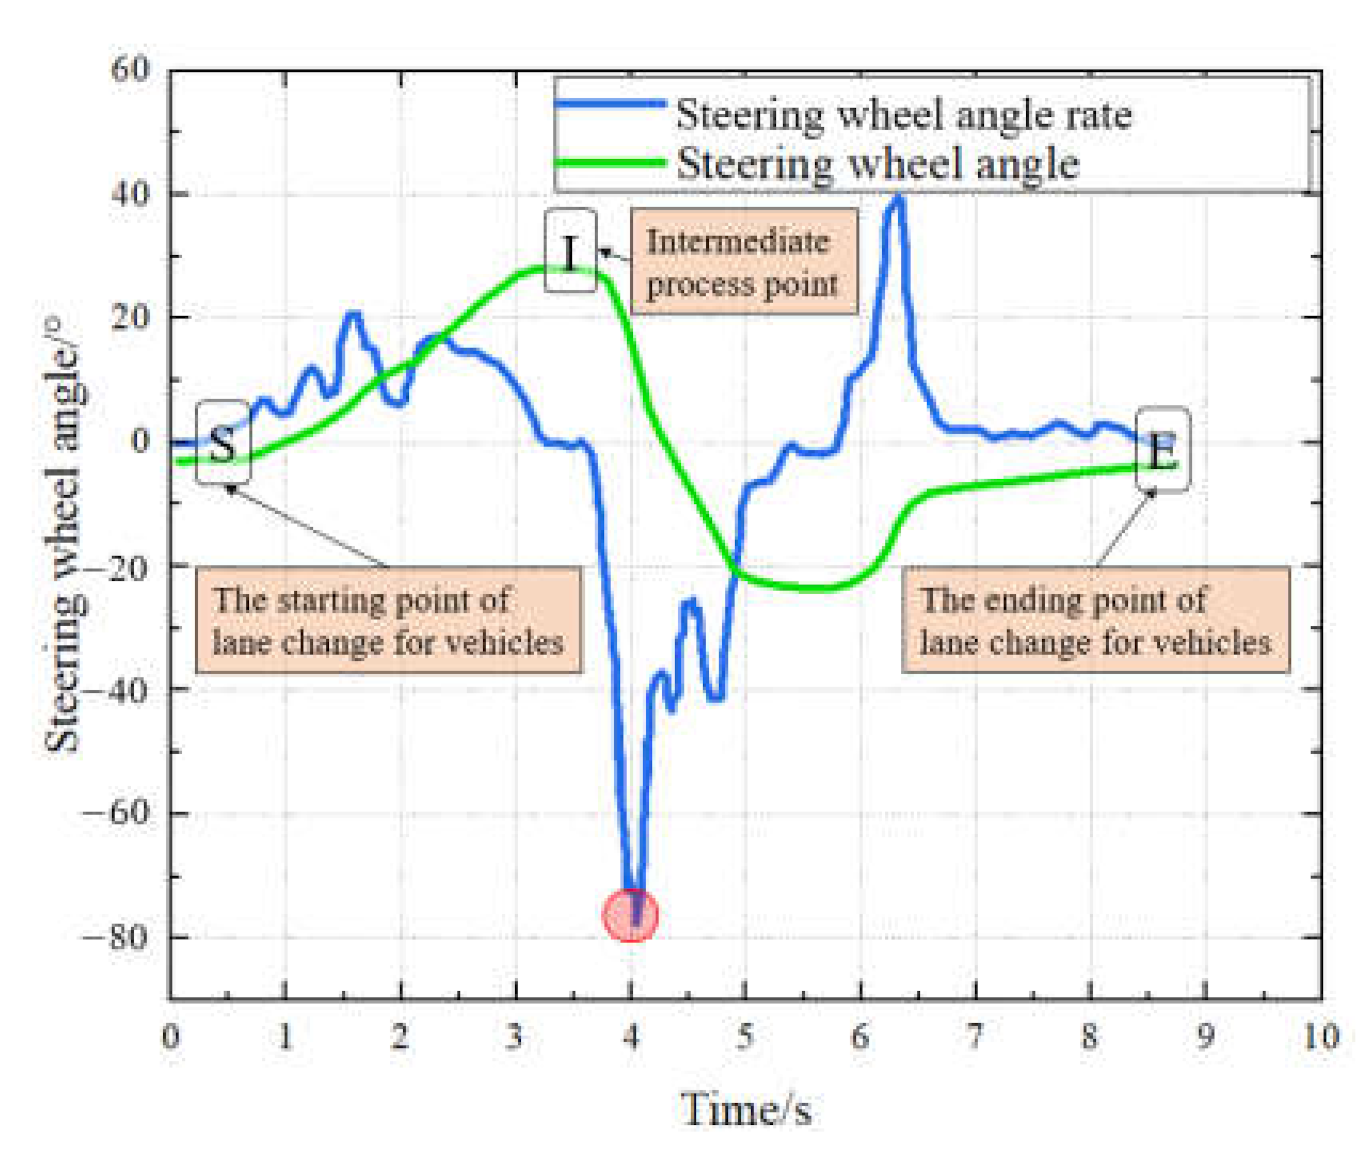
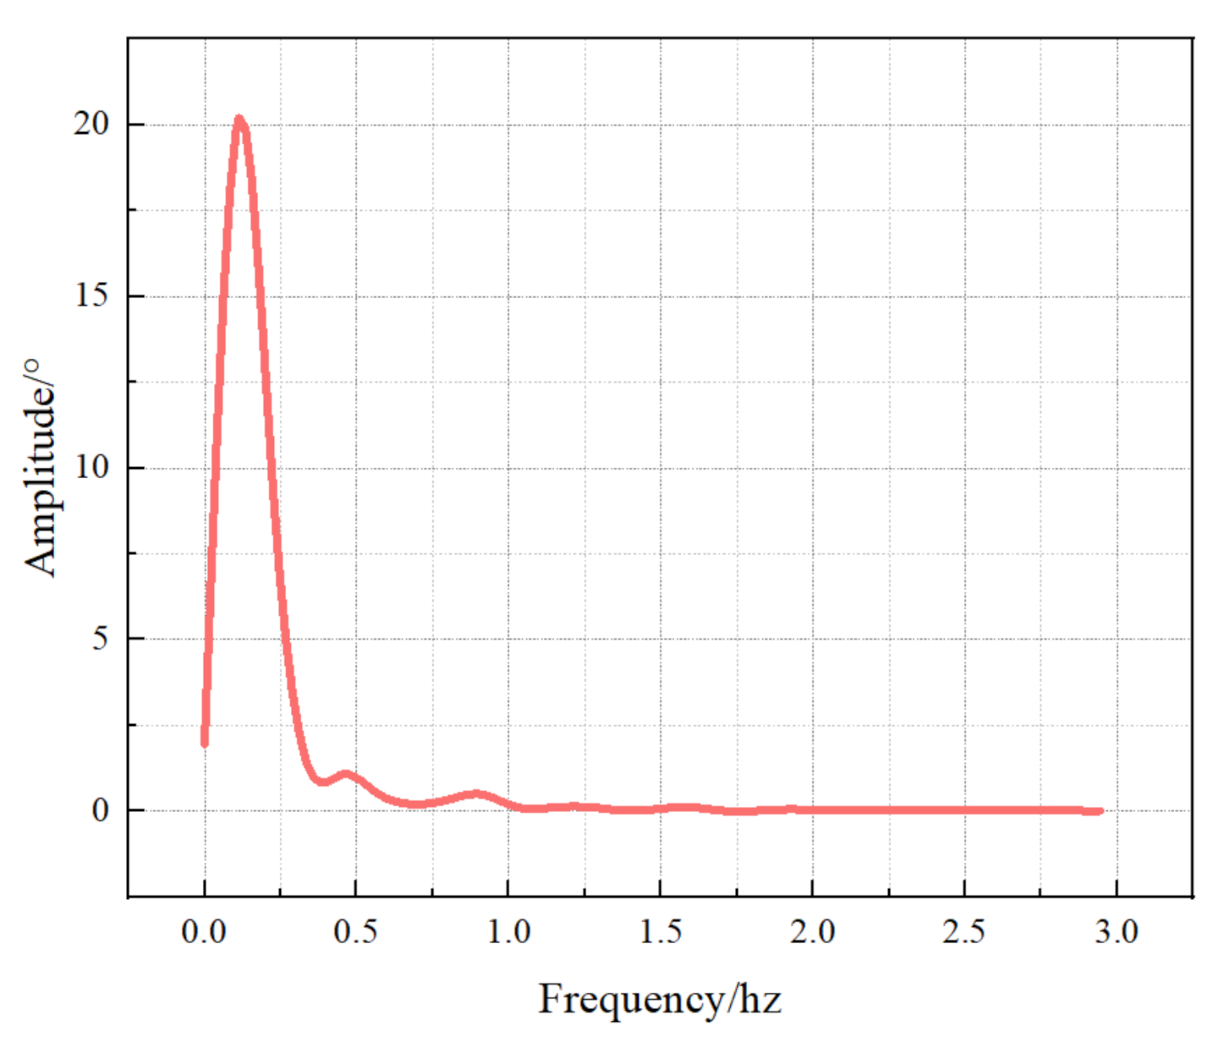
4.2. Steering Wheel Angle Rate and Steering Wheel Angle Frequency Domain
5. Discussion
6. Conclusions
- When driving at the exit of a diverging area that satisfies the DSD, the driver’s manipulation difficulty and driving load can be reduced. It can help the driver better leave the main line.
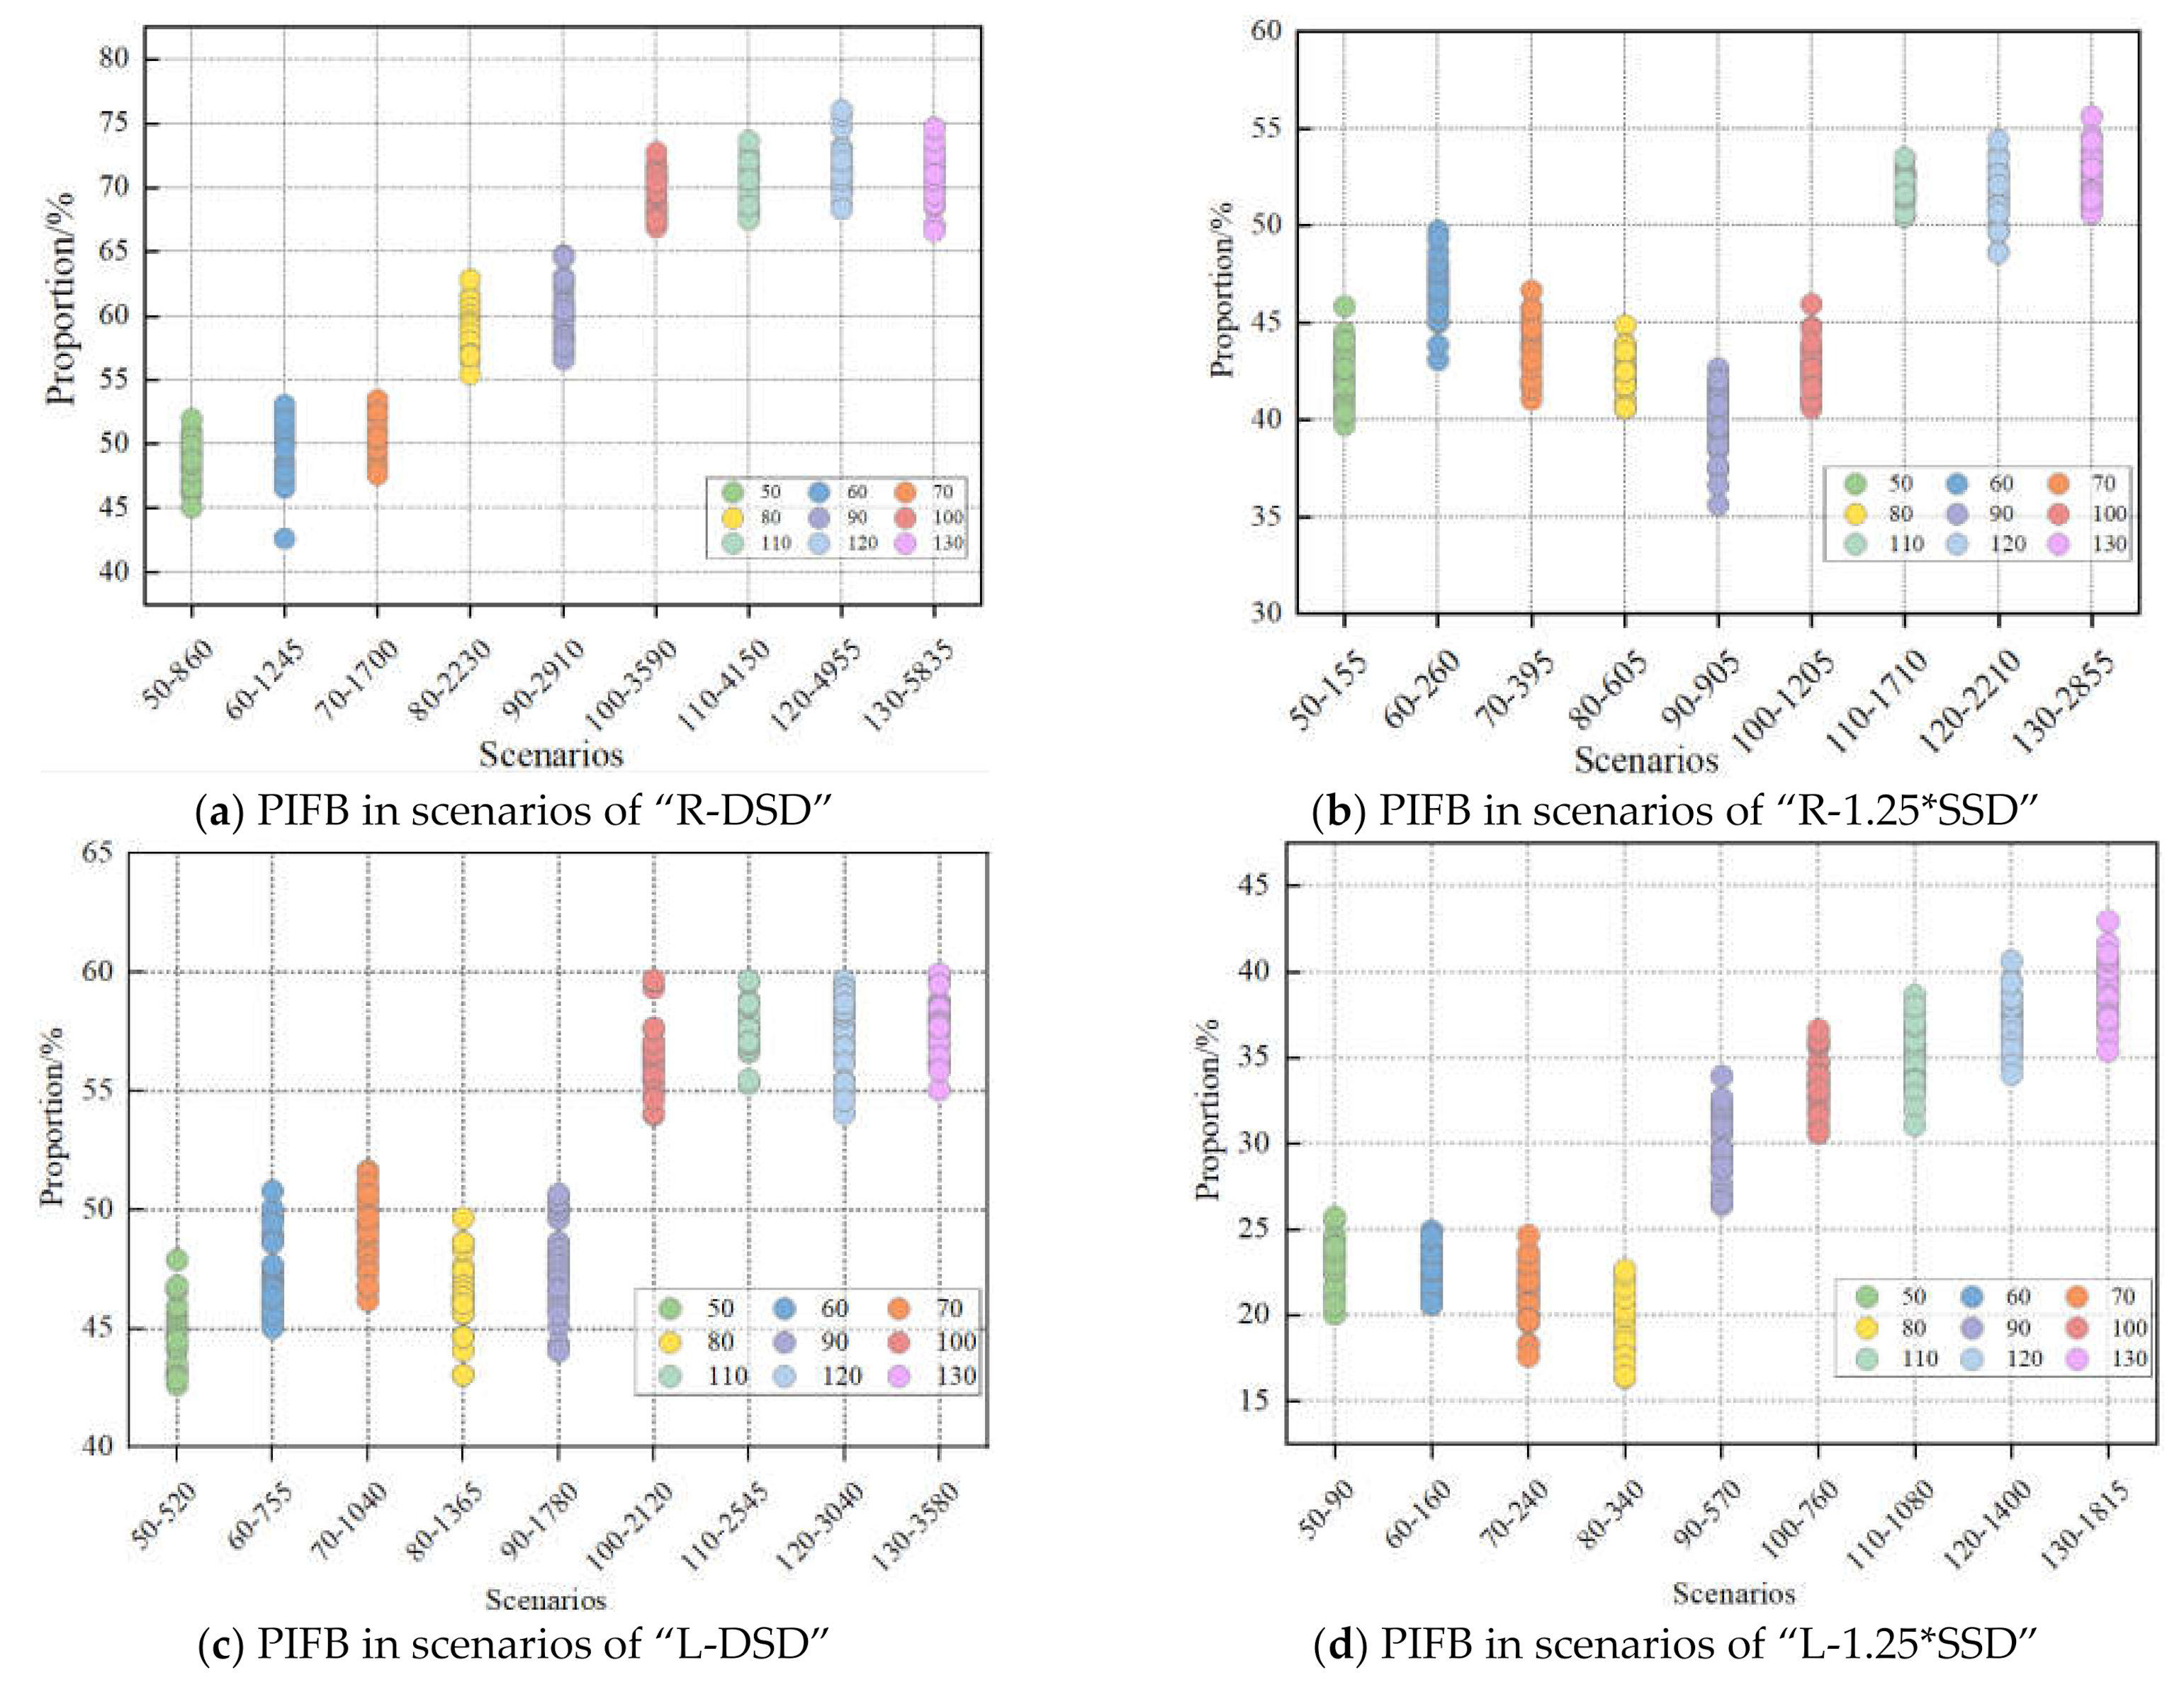
- When driving on a circular curve that satisfies the DSD, regardless of the speed, the SAR of the vehicle is the lowest when changing lanes and the PIFB accounts for the largest proportion. In terms of driving safety, it is recommended that the main line at the exit of a diverging area needs to meet the DSD. Compared to a left circular curve, the driving index on a right circular curve is more ideal. The left circular curve does not meet driving expectations.
- According to the subjective questionnaire, most participants stated that it was more comfortable to drive at the exit of a freeway diverging area that meets the DSD. Moreover, almost all of the participants thought that driving on a right circular curve was more comfortable than driving on a left circular curve. The subjective evaluation further confirms the conclusion drawn from the simulation experiment data.
- It may be problematic to treat the minimum radius and sight distance requirements of left and right circular curves equally. Taking 1.25 times the SSD in the diverging area may also aggravate the occurrence of traffic crashes.
- In summary, this paper discusses the impact of 1.25 times the SSD and the DSD at the exit of a freeway diverging area on driving safety. The results indicate that it is more favorable for a driver to operate calmly and ensure the safety of driving at an exit that satisfies the DSD. However, our experimental design did not consider the influence of the longitudinal alignment of the road on the driving of the driver. In future research, we will improve this aspect of the design.
Author Contributions
Funding
Institutional Review Board Statement
Informed Consent Statement
Data Availability Statement
Conflicts of Interest
References
- Lan, C.; Li, J.; Chimba Msce, E.D. Statistical Evaluation of Motorcycle Crash Injury Severities by Using Multinomial Models. In Transportation Research Board; Transportation Research Board of the National Academies of Sciences: Washington, DC, USA, 2006. [Google Scholar]
- Wang, Z.; Chen, H.; Lu, J.J. Exploring Impacts of Factors Contributing to Injury Severity at Freeway Diverge Areas. Transp. Res. Rec. J. Transp. Res. Board 2009, 2102, 43–52. [Google Scholar] [CrossRef]
- Hauer, E. Statistical Road Safety Modeling. Transp. Res. Rec. J. Transp. Res. Board 2004, 1897, 81–87. [Google Scholar] [CrossRef]
- Mccartt, A.T.; Northrup, V.S.; Retting, R.A. Types and characteristics of ramp-related motor vehicle crashes on urban in-terstate roadways in Northern Virginia. J. Saf. Res. 2004, 35, 107–114. [Google Scholar] [CrossRef] [PubMed]
- Janson, B.N.; Awad, W.H.; Robles, J.; Kononov, J.; Pinkerton, B. Truck Accidents at Freeway Ramps: Data Analysis and High-Risk Site Identification. J. Transp. Stat. 1998. Available online: https://rosap.ntl.bts.gov/view/dot/5394 (accessed on 21 March 2021).
- Zf, A.; Yl, A.; Hl, B.; Wjk, B.; Wz, A.; Kw, A.; Sl, A. Driving anger in China: A case study on professional drivers. Transp. Res. Part. F Traffic Psychol. Behav. 2016, 42, 255–266. [Google Scholar]
- Feng, Z.; Yang, M.; Ma, C.; Kang, J.; Lei, Y.; Huang, W.; Huang, Z.; Zhan, J.; Zhou, M.; Ma, X. Driving anger and its rela-tionships with type A behavior patterns and trait anger: Differences between professional and non-professional drivers. PLoS ONE 2017, 12, e189793. [Google Scholar] [CrossRef] [Green Version]
- Xu, S.-X.; Liu, T.-L.; Huang, H.-J.; Liu, R. Mode choice and railway subsidy in a congested monocentric city with endogenous population distribution. Transp. Res. Part. A Policy Pract. 2018, 116, 413–433. [Google Scholar] [CrossRef]
- Chen, F.; Peng, H.; Ma, X.; Liang, J.; Hao, W.; Pan, X. Examining the safety of trucks under crosswind at bridge-tunnel section: A driving simulator study. Tunn. Undergr. Space Technol. 2019, 92, 103034. [Google Scholar] [CrossRef]
- Chen, F.; Chen, S. Injury severities of truck drivers in single- and multi-vehicle accidents on rural highways. Accid. Anal. Prev. 2011, 43, 1677–1688. [Google Scholar] [CrossRef]
- Chen, H.; Liu, P.; Lu, J.J.; Behzadi, B. Evaluating the safety impacts of the number and arrangement of lanes on freeway exit ramps. Accid. Anal. Prev. 2009, 41, 543–551. [Google Scholar] [CrossRef]
- Zahabi, M.; Machado, P.; Lau, M.Y.; Deng, Y.; Pankok, C., Jr. Driver performance and attention allocation in use of logo signs on freeway exit ramps—ScienceDirect. Appl. Ergon. 2017, 65, 70–80. [Google Scholar] [CrossRef]
- Guerrieri, M.; Mauro, R.; Tollazzi, T. Turbo-Roundabout: Case Study of Driver Behavior and Kinematic Parameters of Light and Heavy Vehicles. J. Transp. Eng. Part. A Syst. 2019, 145, 05019002. [Google Scholar] [CrossRef]
- Bared, J.; Powell, A.; Kaisar, E.; Jagannathan, R. Crash Comparison of Single Point and Tight Diamond Interchanges. J. Transp. Eng. 2005, 131, 379–381. [Google Scholar] [CrossRef]
- Lundy, R.A. The Effect of Ramp Type and Geometry on Accidents. Highw. Res. Record 1967. Available online: https://trid.trb.org/view/108765 (accessed on 21 March 2021).
- Garnowski, M.; Manner, H. On factors related to car accidents on German Autobahn connectors. Accid. Anal. Prev. 2011, 43, 1864–1871. [Google Scholar] [CrossRef]
- Sarhan, M.; Hassan, Y.; El Halim, A.O.A. Safety performance of freeway sections and relation to length of speed-change lanes. Can. J. Civ. Eng. 2008, 35, 531–541. [Google Scholar] [CrossRef]
- Zhu, T.; Xu, J.; Yang, X.; Bai, Y. Factors contributing to urban expressway entrance and exit safety. In Proceedings of the 6th Advanced Forum on Transportation of China (AFTC 2010), Beijing, China, 16 October 2010; pp. 65–71. [Google Scholar] [CrossRef]
- Park, H.; Son, B.; Kim, H. Development of accident prediction models for freeway interchange ramps. J. Korean Soc. Transp. 2007, 25, 123–135. [Google Scholar]
- Yang, Z.; Zhibin, L.; Pan, L.; Liteng, Z. Exploring contributing factors to crash injury severity at freeway diverge areas using ordered probit model. Procedia Eng. 2011, 21, 178–185. [Google Scholar] [CrossRef] [Green Version]
- Liu, P.; Chen, H.; Lu, J.J.; Cao, B. How Lane Arrangements on Freeway Mainlines and Ramps Affect Safety of Freeways with Closely Spaced Entrance and Exit Ramps. J. Transp. Eng. 2010, 136, 614–622. [Google Scholar] [CrossRef]
- Venkataraman, N.; Shankar, V.; Ulfarsson, G.F.; Deptuch, D. A heterogeneity-in-means count model for evaluating the effects of interchange type on heterogeneous influences of interstate geometrics on crash frequencies. Anal. Methods Accid. Res. 2014, 2, 12–20. [Google Scholar] [CrossRef]
- Kim, T.Y.; Kim, K.H.; Park, B.H. Accident models of trumpet interchange S-type ramps using by Poisson, negative binomial regression and ZAM. Ksce J. Civ. Eng. 2011, 15, 545–551. [Google Scholar] [CrossRef]
- Lu, J.J.; Lu, L.; Liu, P.; Chen, H.; Guo, T. Safety and Operational Performance Evaluation of Four Types of Exit Ramps on Florida’s Freeways. 2010. Available online: https://rosap.ntl.bts.gov/view/dot/18046 (accessed on 21 March 2021).
- Chen, H.; Liu, P.; Behzadi, B.; Lu, J. Impacts of Exit Ramp Type on the Safety Performance of Freeway Diverge Areas. In Proceedings of the Transportation Research Board 87th Annual Meeting, Washington, DC, USA, 13–17 January 2008. [Google Scholar]
- Chen, H.; Lee, C.; Lin, P.-S. Investigation Motorcycle Safety at Exit Ramp Sections by Analyzing Historical Crash Data and Rider’s Perception. J. Transp. Technol. 2014, 4, 107–115. [Google Scholar] [CrossRef] [Green Version]
- Huang, L.; Zhao, X.; Li, Y.; Ma, J.; Yang, L.; Rong, J.; Wang, Y. Optimal design alternatives of advance guide signs of closely spaced exit ramps on urban expressways. Accid. Anal. Prev. 2020, 138, 105465. [Google Scholar] [CrossRef] [PubMed]
- Liang, G.; Yin, Y.; Zhang, N.; Li, R.; Wu, Y.; Li, Y. Vibration Effect Produced by Raised Pavement Markers on the Exit Ramp of an Expressway. J. Adv. Transp. 2019, 2019, 1–12. [Google Scholar] [CrossRef] [Green Version]
- Cirillo, J.A.; Dietz, S.K.; Beatty, R.L. Analysis and modeling of relationships between accidents and the geometric and traffic characteristics of the interstate system. Highw. Delin. 1969. Available online: https://trid.trb.org/view/114990 (accessed on 21 March 2021).
- Shen, Q.; Zhao, Y.; Yang, S.; Cao, H. Analysis of Main Line Shape Index in Exit Area of Special Interchange Based on Decision Sight Distance. J. Saf. Environ. 2015, 15, 89–92. [Google Scholar]
- Mcgee, H.W. Decision sight distance for highway design and traffic control requirements. Transport. Res. Rec. 1979, 736, 11–13. [Google Scholar]
- Lerner, N. Age and driver perception-reaction time for sight distance design requirements. In Proceedings of the 1995 Compendium of Technical Papers, Institute of Transportation Engineers 65th Annual Meeting, Denver, CO, USA, 5–8 August 1995. [Google Scholar]
- Bassan, S. Decision Sight Distance Review and Evaluation. Traffic Eng. Control. 2011, 52, 23–26. [Google Scholar]
- Ho, G.; Rozental, J.; Majstorovic, S. Decision Sight Distance for Freeway Exit Ramps—A Road Safety Perspective. Available online: https://trid.trb.org/view/1434910 (accessed on 22 March 2021).
- Gargoum, S.A.; El-Basyouny, K. Analyzing the ability of crash-prone highways to handle stochastically modelled driver demand for stopping sight distance. Accid. Anal. Prev. 2020, 136, 105395. [Google Scholar] [CrossRef]
- Gargoum, S.A.; Tawfeek, M.H.; El-Basyouny, K.; Koch, J.C. Available sight distance on existing highways: Meeting stopping sight distance requirements of an aging population. Accid. Anal. Prev. 2018, 112, 56–68. [Google Scholar] [CrossRef]
- Aashto. A Policy on Geometric Design of Highways and Streets; American Association of State Highway and Transportation Officials: Washington, DC, USA, 2011. [Google Scholar]
- Alexander, G.J.; Lunenfeld, H. Positive Guidance in Traffic Control; Driver Information Systems; US Department of Transportation, Federal Highway Administration, Office of Traffic Operations: Washington, DC, USA, 1975. [Google Scholar]
- Administration, F. Roads and the Environment: Public Roads and their Environment: The Environmental Policy of the Finnish National Road Administration; Espoo; The World Bank: Washington, DC, USA, 1997. [Google Scholar]
- Ma, Y.; Qi, S.; Zhang, Y.; Lian, G.; Chan, C.Y. Drivers’ Visual Attention Characteristics under Different Cognitive Work-loads: An On-Road Driving Behavior Study. Int. J. Env. Res. Pub. Health 2020, 17, 5366. [Google Scholar] [CrossRef]
- Stapel, J.; Mullakkal-Babu, F.A.; Happee, R. Automated driving reduces perceived workload, but monitoring causes higher cognitive load than manual driving. Transp. Res. Part. F Traffic Psychol. Behav. 2019, 60, 590–605. [Google Scholar] [CrossRef] [Green Version]
- Biswas, P.; Prabhakar, G. Detecting drivers’ cognitive load from saccadic intrusion. Transp. Res. Part. F Traffic Psychol. Behav. 2018, 54, 63–78. [Google Scholar] [CrossRef]
- Ahlstrom, C.; Kircher, K. Changes in glance behaviour when using a visual eco-driving system—A field study. Appl. Ergon. 2017, 58, 414–423. [Google Scholar] [CrossRef]
- Recarte, M.A.; Nunes, L.M. Mental workload while driving: Effects on visual search, discrimination, and decision making. J. Exp. Psychol. Appl. 2003, 9, 119–137. [Google Scholar] [CrossRef]
- Bassani, M.; Catani, L.; Salussolia, A.; Yang, C. A driving simulation study to examine the impact of available sight dis-tance on driver behavior along rural highways. Accid. Anal. Prev. 2019, 131, 200–212. [Google Scholar] [CrossRef]
- Bassani, M.; Hazoor, A.; Catani, L. What’s around the curve? A driving simulation experiment on compensatory strategies for safe driving along horizontal curves with sight limitations. Transp. Res. Part. F Traffic Psychol. Behav. 2019, 66, 273–291. [Google Scholar] [CrossRef]
- Djamasbi, S.; Siegel, M.; Tullis, T. Generation Y, web design, and eye tracking. Int. J. Hum. Comput. Stud. 2010, 68, 307–323. [Google Scholar] [CrossRef] [Green Version]
- Djamasbi, S.; Siegel, M.; Tullis, T.; Dai, R. Efficiency, Trust, and Visual Appeal: Usability Testing through Eye Tracking. In Proceedings of the 2010 43rd Hawaii International Conference on System Sciences, Honolulu, HI, USA, 5–8 January 2010. [Google Scholar]
- Seo, Y.W.; Chae, S.W.; Lee, K.C. The Impact of Human Brand Image Appeal on Visual Attention and Purchase Intentions at an E-commerce Website. Comput. Vis. 2012, 7198, 1–9. [Google Scholar]
- Macdonald, W.A.; Hoffmann, E.R. Review of Relationships Between Steering Wheel Reversal Rate and Driving Task Demand. Hum. Factors J. Hum. Factors Ergon. Soc. 1980, 22, 733–739. [Google Scholar] [CrossRef]
- McLean, J.R.; Hoffmann, E.R. Steering Reversals as a Measure of Driver Performance and Steering Task Difficulty. Hum. Factors J. Hum. Factors Ergon. Soc. 1975, 17, 248–256. [Google Scholar] [CrossRef]
- Siegmund, G.P.; King, D.J.; Mumford, D.K. Correlation of Steering Behavior with Heavy-Truck Driver Fatigue. SAE Tech. Pap. Ser. 1996, 105, 1547–1568. [Google Scholar] [CrossRef]
- Siegmund, G.P.; King, D.J.; Mumford, D.K. Correlation of Heavy-Truck Driver Fatigue with Vehicle-Based Control Measures. SAE Tech. Pap. Ser. 1995, 104, 441–468. [Google Scholar] [CrossRef]
- Ammoun, S.; Nashashibi, F.; Laurgeau, C. An analysis of the lane changing manoeuvre on roads: The contribution of in-ter-vehicle cooperation via communication. In Proceedings of the 2007 IEEE Intelligent Vehicles Symposium, Istanbul, Turkey, 13–15 June 2007. [Google Scholar]
- McCall, J.; Trivedi, M. Video-Based Lane Estimation and Tracking for Driver Assistance: Survey, System, and Evaluation. IEEE Trans. Intell. Transp. Syst. 2006, 7, 20–37. [Google Scholar] [CrossRef] [Green Version]
- Radke, R.J.; Andra, S.; Al-Kofahi, O.; Roysam, B. Image change detection algorithms: A systematic survey. IEEE Trans. Image Process. 2005, 14, 294–307. [Google Scholar] [CrossRef]
- Kasper, D.; Weidl, G.; Dang, T.; Breuel, G.; Tamke, A.; Wedel, A.; Rosenstiel, W. Object-Oriented Bayesian Networks for Detection of Lane Change Maneuvers. IEEE Intell. Transp. Syst. Mag. 2012, 4, 19–31. [Google Scholar] [CrossRef]
- Zheng, Y.; Hansen, J.H.L. Lane-Change Detection From Steering Signal Using Spectral Segmentation and Learning-Based Classification. IEEE Trans. Intell. Veh. 2017, 2, 14–24. [Google Scholar] [CrossRef]
- Yao, W.; Lin, Y.; Wang, C.; Zhao, H.; Zha, H. Automatic lane change data extraction from car data sequence. In Proceedings of the 17th International IEEE Conference on Intelligent Transportation Systems (ITSC), Qingdao, China, 8–11 October 2014; pp. 1894–1895. [Google Scholar]
- Lee, S.E.; Olsen, E.C.; Wierwille, W.W. A Comprehensive Examination of Naturalistic Lane-Changes. PsycEXTRA Dataset. 2004. Available online: https://rosap.ntl.bts.gov/view/dot/4191 (accessed on 22 March 2021).
- Fu, R.; Zhang, H.; Guo, Y.; Yang, F.; Lu, Y. Real-time estimation and prediction of lateral stability of coaches: A hybrid approach based on EKF, BPNN, and online autoregressive integrated moving average algorithm. IET Intell. Transp. Syst. 2020, 14, 1892–1902. [Google Scholar] [CrossRef]
- Daza, I.G.; Hernández, N.; Bergasa, L.M.; Parra, I.; Yebes, J.J.; Gavilán, M.; Quintero, R.; Llorca, D.F.; Sotelo, M.A. Drowsiness monitoring based on driver and driving data fusion. In Proceedings of the 2011 14th International IEEE Conference on Intelligent Transportation Systems (ITSC), Washington, DC, USA, 5–7 October 2011; pp. 1199–1204. [Google Scholar]
- Liu, R.; Wei, M.; Sang, N. Emergency obstacle avoidance trajectory tracking control based on active disturbance rejec-tion for autonomous vehicles. Int. J. Adv. Rob. Syst. 2020, 17. [Google Scholar] [CrossRef]


| Vehicle | Type | Small Cars | Medium Cars | Large Cars |
|---|---|---|---|---|
| /m | Weight/t | <4.5 | 4.5~12 | >12 |
| Sample quantity/unit | 134 | 101 | 117 | |
| p-value | 0.061 | 0.124 | 0.100 | |
| Sample average /m | 0.503 | 0.546 | 0.600 | |
| /m | 0.50 | 0.55 | 0.60 | |
| The second lane (Right circular curve) | Sample quantity/unit | 213 | 33 | 26 |
| Asymptotic Significance) (2-sided) | 0.200 | 0.200 | 0.200 | |
| Sample average /m | 1.034 | 0.998 | 0.610 | |
| Ds/m | 1.534 | 1.548 | 1.210 | |
| The second lane (Left circular curve) | Sample quantity/unit | 223 | 24 | 26 |
| Asymptotic Significance) (2-sided) | 0.162 | 0.122 | 0.075 | |
| Sample average /m | 0.778 | 0.543 | 0.513 | |
| Ds/m | 1.278 | 1.093 | 1.113 |
| Deflection | Design Speed (km/h) | DSD (m) | 1.25*SSD (m) | R Satisfying DSD (m) | R Satisfying 1.25*SSD (m) |
|---|---|---|---|---|---|
| Right | 50 | 195 | 81 | 860 | 155 |
| 60 | 235 | 106 | 1245 | 260 | |
| 70 | 275 | 131 | 1700 | 395 | |
| 80 | 315 | 163 | 2230 | 605 | |
| 90 | 360 | 200 | 2910 | 905 | |
| 100 | 400 | 231 | 3590 | 1205 | |
| 110 | 430 | 275 | 4150 | 1710 | |
| 120 | 470 | 313 | 4955 | 2210 | |
| 130 | 510 | 356 | 5835 | 2855 | |
| Left | 50 | 195 | 81 | 520 | 90 |
| 60 | 235 | 106 | 755 | 160 | |
| 70 | 275 | 131 | 1040 | 240 | |
| 80 | 315 | 163 | 1365 | 340 | |
| 90 | 360 | 200 | 1780 | 570 | |
| 100 | 400 | 231 | 2120 | 760 | |
| 110 | 430 | 275 | 2545 | 1080 | |
| 120 | 470 | 313 | 3040 | 1400 | |
| 130 | 510 | 356 | 3580 | 1815 |
| Scenarios | Speed/(km/h)- radius/s | Mean | Statistical | df | Sig. | Mean | Statistical | df | Sig. |
|---|---|---|---|---|---|---|---|---|---|
| SAR | SWA | ||||||||
| Right circular curve that meets DSD (R-DSD) | 50–860 | 6.675 | 0.961 | 30 | 0.336 | 20.364 | 0.967 | 30 | 0.466 |
| 60–1245 | 6.620 | 0.957 | 30 | 0.264 | 19.522 | 0.944 | 30 | 0.122 | |
| 70–1700 | 6.472 | 0.969 | 30 | 0.522 | 20.634 | 0.978 | 30 | 0.787 | |
| 80–2230 | 6.585 | 0.968 | 30 | 0.490 | 20.742 | 0.953 | 30 | 0.206 | |
| 90–2910 | 5.093 | 0.974 | 30 | 0.661 | 18.526 | 0.961 | 30 | 0.332 | |
| 100–3590 | 9.285 | 0.965 | 30 | 0.433 | 20.964 | 0.963 | 30 | 0.378 | |
| 110–4150 | 9.663 | 0.954 | 30 | 0.223 | 25.268 | 0.977 | 30 | 0.752 | |
| 120–4955 | 9.482 | 0.973 | 30 | 0.626 | 25.662 | 0.955 | 30 | 0.231 | |
| 130–5835 | 9.991 | 0.946 | 30 | 0.135 | 25.759 | 0.965 | 30 | 0.417 | |
| Right circular curve that meets 1.25 times SSD (R-1.25*SSD) | 50–155 | 11.510 | 0.979 | 30 | 0.816 | 21.747 | 0.986 | 30 | 0.957 |
| 60–260 | 11.486 | 0.964 | 30 | 0.407 | 22.407 | 0.965 | 30 | 0.431 | |
| 70–395 | 12.029 | 0.960 | 30 | 0.319 | 22.462 | 0.935 | 30 | 0.067 | |
| 80–605 | 13.824 | 0.961 | 30 | 0.346 | 34.339 | 0.951 | 30 | 0.189 | |
| 90–905 | 16.904 | 0.955 | 30 | 0.233 | 37.686 | 0.934 | 30 | 0.066 | |
| 100–1205 | 17.147 | 0.941 | 30 | 0.101 | 37.166 | 0.959 | 30 | 0.296 | |
| 110–1710 | 17.485 | 0.948 | 30 | 0.172 | 37.396 | 0.979 | 30 | 0.816 | |
| 120–2210 | 17.422 | 0.972 | 30 | 0.604 | 37.133 | 0.969 | 30 | 0.534 | |
| 130–2855 | 17.447 | 0.936 | 30 | 0.071 | 36.977 | 0.959 | 30 | 0.305 | |
| Left circular curve that meets DSD (L-DSD) | 50–520 | 9.380 | 0.952 | 30 | 0.192 | 20.401 | 0.981 | 30 | 0.860 |
| 60–755 | 9.260 | 0.961 | 30 | 0.331 | 21.373 | 0.959 | 30 | 0.294 | |
| 70–1040 | 15.369 | 0.940 | 30 | 0.092 | 30.571 | 0.935 | 30 | 0.068 | |
| 80–1365 | 15.346 | 0.933 | 30 | 0.059 | 28.390 | 0.969 | 30 | 0.523 | |
| 90–1780 | 15.200 | 0.932 | 30 | 0.058 | 37.096 | 0.970 | 30 | 0.552 | |
| 100–2120 | 15.250 | 0.937 | 30 | 0.079 | 33.396 | 0.974 | 30 | 0.672 | |
| 110–2545 | 16.769 | 0.969 | 30 | 0.521 | 30.943 | 0.973 | 30 | 0.645 | |
| 120–3040 | 13.060 | 0.933 | 30 | 0.061 | 28.610 | 0.961 | 30 | 0.345 | |
| 130–3580 | 11.907 | 0.940 | 30 | 0.094 | 28.658 | 0.939 | 30 | 0.086 | |
| Left circular curve that meets 1.25 times SSD (L-1.25*SSD) | 50–90 | 25.029 | 0.959 | 30 | 0.300 | 46.312 | 0.968 | 30 | 0.497 |
| 60–160 | 25.624 | 0.935 | 30 | 0.067 | 46.256 | 0.962 | 30 | 0.361 | |
| 70–240 | 18.636 | 0.960 | 30 | 0.317 | 40.467 | 0.970 | 30 | 0.562 | |
| 80–340 | 18.381 | 0.942 | 30 | 0.108 | 38.369 | 0.963 | 30 | 0.378 | |
| 90–570 | 20.106 | 0.943 | 30 | 0.111 | 40.357 | 0.983 | 30 | 0.901 | |
| 100–760 | 25.642 | 0.965 | 30 | 0.424 | 45.571 | 0.973 | 30 | 0.650 | |
| 110–1080 | 20.492 | 0.974 | 30 | 0.667 | 36.865 | 0.966 | 30 | 0.438 | |
| 120–1400 | 19.541 | 0.960 | 30 | 0.321 | 36.123 | 0.939 | 30 | 0.088 | |
| 130–1815 | 20.822 | 0.943 | 30 | 0.111 | 36.591 | 0.952 | 30 | 0.191 | |
| Deviation | R-DSD | L-DSD | ANOVA | ||||||||
|---|---|---|---|---|---|---|---|---|---|---|---|
| Index | SAR(°/s) | PIFB(%) | SAR(°/s) | PIFB(%) | SAR | PIFB | |||||
| Speed/(km/h) | Mean | SD | Mean | SD | Mean | SD | Mean | SD | |||
| 50 | 6.675 | 2.000 | 48.484 | 1.654 | 9.380 | 1.041 | 44.634 | 1.378 | F = 43.177 p ≤ 1.534 × 10⁻⁸ | F = 9 5.968 p ≤ 6.616 × 10⁻¹⁴ | |
| 60 | 6.620 | 1.555 | 49.627 | 2.314 | 9.260 | 1.025 | 47.618 | 1.559 | F = 60.218 p ≤ 1.547 × 10⁻¹⁰ | F = 15.537 p ≤ 2.202 × 10⁻⁴ | |
| 70 | 6.472 | 1.227 | 50.983 | 1.512 | 15.369 | 1.084 | 49.061 | 1.603 | F = 885.514 p ≤ 8.005 × 10−37 | F = 22.818 p ≤ 1.252 × 10⁻⁵ | |
| 80 | 6.585 | 1.241 | 59.217 | 1.797 | 15.346 | 0.967 | 46.072 | 1.644 | F = 930.143 p ≤ 2.092 × 10−37 | F = 873.385 p ≤ 1.165 × 10−36 | |
| 90 | 5.093 | 0.847 | 60.383 | 2.315 | 15.200 | 1.237 | 47.790 | 1.780 | F = 1363.148 p ≤ 5.494 × 10−42 | F = 557.646 p ≤ 1.940 × 10⁻³¹ | |
| 100 | 9.285 | 1.909 | 69.518 | 1.614 | 15.250 | 0.988 | 56.558 | 1.453 | F = 230.884 p ≤ 6.976 × 10⁻²² | F = 1067.441 p ≤ 4.791 × 10−39 | |
| 110 | 9.663 | 1.568 | 70.233 | 1.650 | 16.769 | 1.112 | 57.604 | 1.136 | F = 409.692 p ≤ 5.709 × 10⁻²⁸ | F = 1190.855 p ≤ 2.338 × 10−40 | |
| 120 | 9.482 | 1.182 | 71.605 | 1.845 | 13.060 | 1.130 | 57.336 | 1.427 | F = 143.575 p ≤ 2.511 × 10⁻¹⁷ | F = 1122.293 p ≤ 1.203 × 10−39 | |
| 130 | 9.991 | 1.353 | 70.845 | 2.074 | 11.907 | 0.868 | 57.806 | 1.306 | F = 42.556 p ≤ 1.841 × 10⁻⁸ | F = 848.414 p ≤ 2.565 × 10−36 | |
Publisher’s Note: MDPI stays neutral with regard to jurisdictional claims in published maps and institutional affiliations. |
© 2021 by the authors. Licensee MDPI, Basel, Switzerland. This article is an open access article distributed under the terms and conditions of the Creative Commons Attribution (CC BY) license (https://creativecommons.org/licenses/by/4.0/).
Share and Cite
Zhou, X.; Pan, B.; Shao, Y. Evaluating the Impact of Sight Distance and Geometric Alignment on Driver Performance in Freeway Exits Diverging Area Based on Simulated Driving Data. Sustainability 2021, 13, 6368. https://doi.org/10.3390/su13116368
Zhou X, Pan B, Shao Y. Evaluating the Impact of Sight Distance and Geometric Alignment on Driver Performance in Freeway Exits Diverging Area Based on Simulated Driving Data. Sustainability. 2021; 13(11):6368. https://doi.org/10.3390/su13116368
Chicago/Turabian StyleZhou, Xizhen, Binghong Pan, and Yang Shao. 2021. "Evaluating the Impact of Sight Distance and Geometric Alignment on Driver Performance in Freeway Exits Diverging Area Based on Simulated Driving Data" Sustainability 13, no. 11: 6368. https://doi.org/10.3390/su13116368
APA StyleZhou, X., Pan, B., & Shao, Y. (2021). Evaluating the Impact of Sight Distance and Geometric Alignment on Driver Performance in Freeway Exits Diverging Area Based on Simulated Driving Data. Sustainability, 13(11), 6368. https://doi.org/10.3390/su13116368