Article

A Fuzzy AHP-MAIRCA Model for Overtourism Assessment: The Case of Malaga Province

by
Josefa García Mestanza
1 and
Rim Bakhat
2,*
1
The University Institute of Tourism Intelligence Research of the University of Malaga (i3t), 29016 Málaga, Spain
2
Management Logistics and Applied Management Department, School of Economics Sciences, University of Abdel Malek Essaidi, Tangier 1373, Morocco
*
Author to whom correspondence should be addressed.
Sustainability 2021, 13(11), 6394; https://doi.org/10.3390/su13116394
Submission received: 17 April 2021 / Revised: 26 May 2021 / Accepted: 31 May 2021 / Published: 4 June 2021
(This article belongs to the Section Tourism, Culture, and Heritage)

Abstract

:
The unexpected outbreak of COVID-19 has placed the tourism sector in an unfavourable position. It has altered the reality of destinations worldwide, changing the paradigm of tourism and showing an unusual scenario within the tourism sector, the undertourism. This paper confirms how this global pandemic has put the Spanish tourism sector at a halt, making it essential to establish public–private response strategies that reactivate it and, in turn, avoid overtourism in the post-COVID-19 scenario. This is done to emphasise the necessity of embracing an adapted systematic approach that entails a realistic set of factors to quantitatively measure the impact of overtourism on the local community. In this sense, a fuzzy modified hybrid multi-criteria decision-making (MCDM) approach is proposed, combining the analytical hierarchy process (AHP) model, the multi-attribute ideal–real comparative analysis (MAIRCA) model, and the sensitivity analysis. The modified F-AHP model is used to identify the criteria importance. For the final ranking of the considered alternative municipalities, the modified F-MAIRCA is applied. To validate the applicability of the proposed approach, we designated the province of Malaga (Costa del Sol) as an empirical study. The findings show that the municipality of Nerja was the most affected by overtourism in the pre-pandemic scenario, and today it is found in undertourism. This calls for transformative decisions of fully engaged tourism policymakers and practitioners to thrive in the post-COVID-19 tourism scenarios in terms of sustainability.

1. Introduction

With over 70% of the borders of destinations closed to international tourism and restrictions on 100% of world destinations [1] and the socio-economic unparalleled impact caused by COVID-19, on a global scale, the pandemic has begun to make its effects tangible, reaching ‘zero tourism’ in most tourist destinations. The tourism sector is being hit hard by the health crisis with global shutdowns, thereby causing significant social and economic impacts. More than 90% of air traffic, more than 300 million jobs, as well as entire tourist destinations have been paralysed [2]. In this scenario, the estimated international tourist arrivals point to a decrease of between 60% and 80% to add losses to 1.20 trillion US dollars [3]. Strielkowski [4] confirmed that “the impact of the corona COVID-19 pandemic on the tourism industry is going to be devastating and similar but with a higher magnitude to what happened in the case of Severe Acute Respiratory Syndrome (SARS) IN 2002–2003”. Fuentes et al. [5] acknowledge that the pandemic will cause major economic impacts, leading to the steepest decline since the Great Economic Recession of 2008. The COVID-19 pandemic has put 75 million jobs at risk in travel and tourism [6] as the aviation passenger revenues drop USD 252 billion amidst the global restrictions [7] and dragging international travel to levels of 2012/2014 [6]. The aforementioned impact of the COVID-19 outbreak on tourism has not been enclosed to this, but sustainability is also on the verge of stalling as acclaimed by all, where ‘normality’ gave way to unsustainable scenarios of overtourism, despite the design and implementation of action plans focused on the search for the sustainable development of tourism.
After months of unprecedented disruption in the tourism sector, activity is beginning to restart in some regions, especially in destinations in the northern hemisphere [8]. The new situation breaks the inertia that the sector presented so far and has led to overtourism in some destinations. Amid all of this, the tourism industry was one of the vivid sectors in the world due to its driver for socio-economic development in the context of infrastructure, employment, and export benefits [9] as the European destinations, especially Mediterranean ones, experienced a notable increase, reaching 713 million tourist arrivals in 2018. Of the top ten world destinations that received 40% of total arrivals, Spain reached 7%, with 83 million international tourists. The tourism activity grew by 6% in southern and Mediterranean Europe, after an increase of 13% in the previous period [10]. In its extreme manifestation, the growth of tourism has certain negative impacts, and its implications are simply the epitome of poor tourism policies. Along with, Peters et al. [11] offered one of the most influential definitions of overtourism as “the situation in which the impact of tourism, at certain times and in certain locations, exceeds physical, ecological, social, economic, psychological, and/or political capacity thresholds”. The advent of overtourism produced limited condition for local communities, with the marked rejection of the visitor by the resident, leads to situations of dissatisfaction of the tourist’s expectations, by not allowing the interrelation with the local population of the visited destination [12,13,14]. An inconsistent loop ends in the decline of the destination if there are no real possibilities of changing governance processes by the application of far sustainable policies [15].
The COVID-19 outbreak has brought policymakers an exceptional chance to implement different strategies when it comes to overtourism evaluation [16]. Policymakers have to collaborate with well-targeted measures to solve the economic issues that imperil the retrieval from the COVID-19 crisis [17]. The COVID-19 pandemic is a global health crisis that involves environmental, economic, and social issues and restrains the sustainability development of the countries [18]. The orthodox models’ application, to assess overtourism, is no longer beneficial due to its limited set of perception [19]. Strategies to modulate the tourism industry require incremental inclusions and precise planning with a focus on pragmatic approaches [20]. Attention towards the adoption of holistic or hybrid methodologies has recently risen [21]. A review of Multi-Criteria Decision-Making (MCDM) techniques for sustainability issues is determined [22]. Scientifically, the application of numerical approaches based on operations research and mathematics enhances the consistency of the decision process, diminishes the subjectivity of the preference judgments, and contributes to the promise of the assessment that is realised [23]. The implementation of the Multi-Criteria Decision-Making (MCDM) approach could be a valid tactic for overtourism identification and assessment. From an operational view, the main contribution of this study is approached from a set of perceptions integrating the following dimensions:
  • Addressing the necessity for identifying the impact of overtourism on the local community employing decision science methodology, mainly MCDM, due to its consistency and reliability in empirical studies;
  • Considering an adapted two-module model for overtourism assessment that can positively contribute towards a reliable decision within the frame of sustainability of destination;
  • Filling the gaps by proposing an adapted approach that encompasses a fuzzy hybrid model, AHP-MAIRCA, to assist the tourism policymakers to identify overtourism and make optimal decisions in the future;
  • Empirically verifying the novel integrated model employing real data taken from experts working in the tourism industry in Malaga province.
With that aim, the paper is structured as follows: a comprehensive literature review of relevant existing studies is given in Section 2. In 
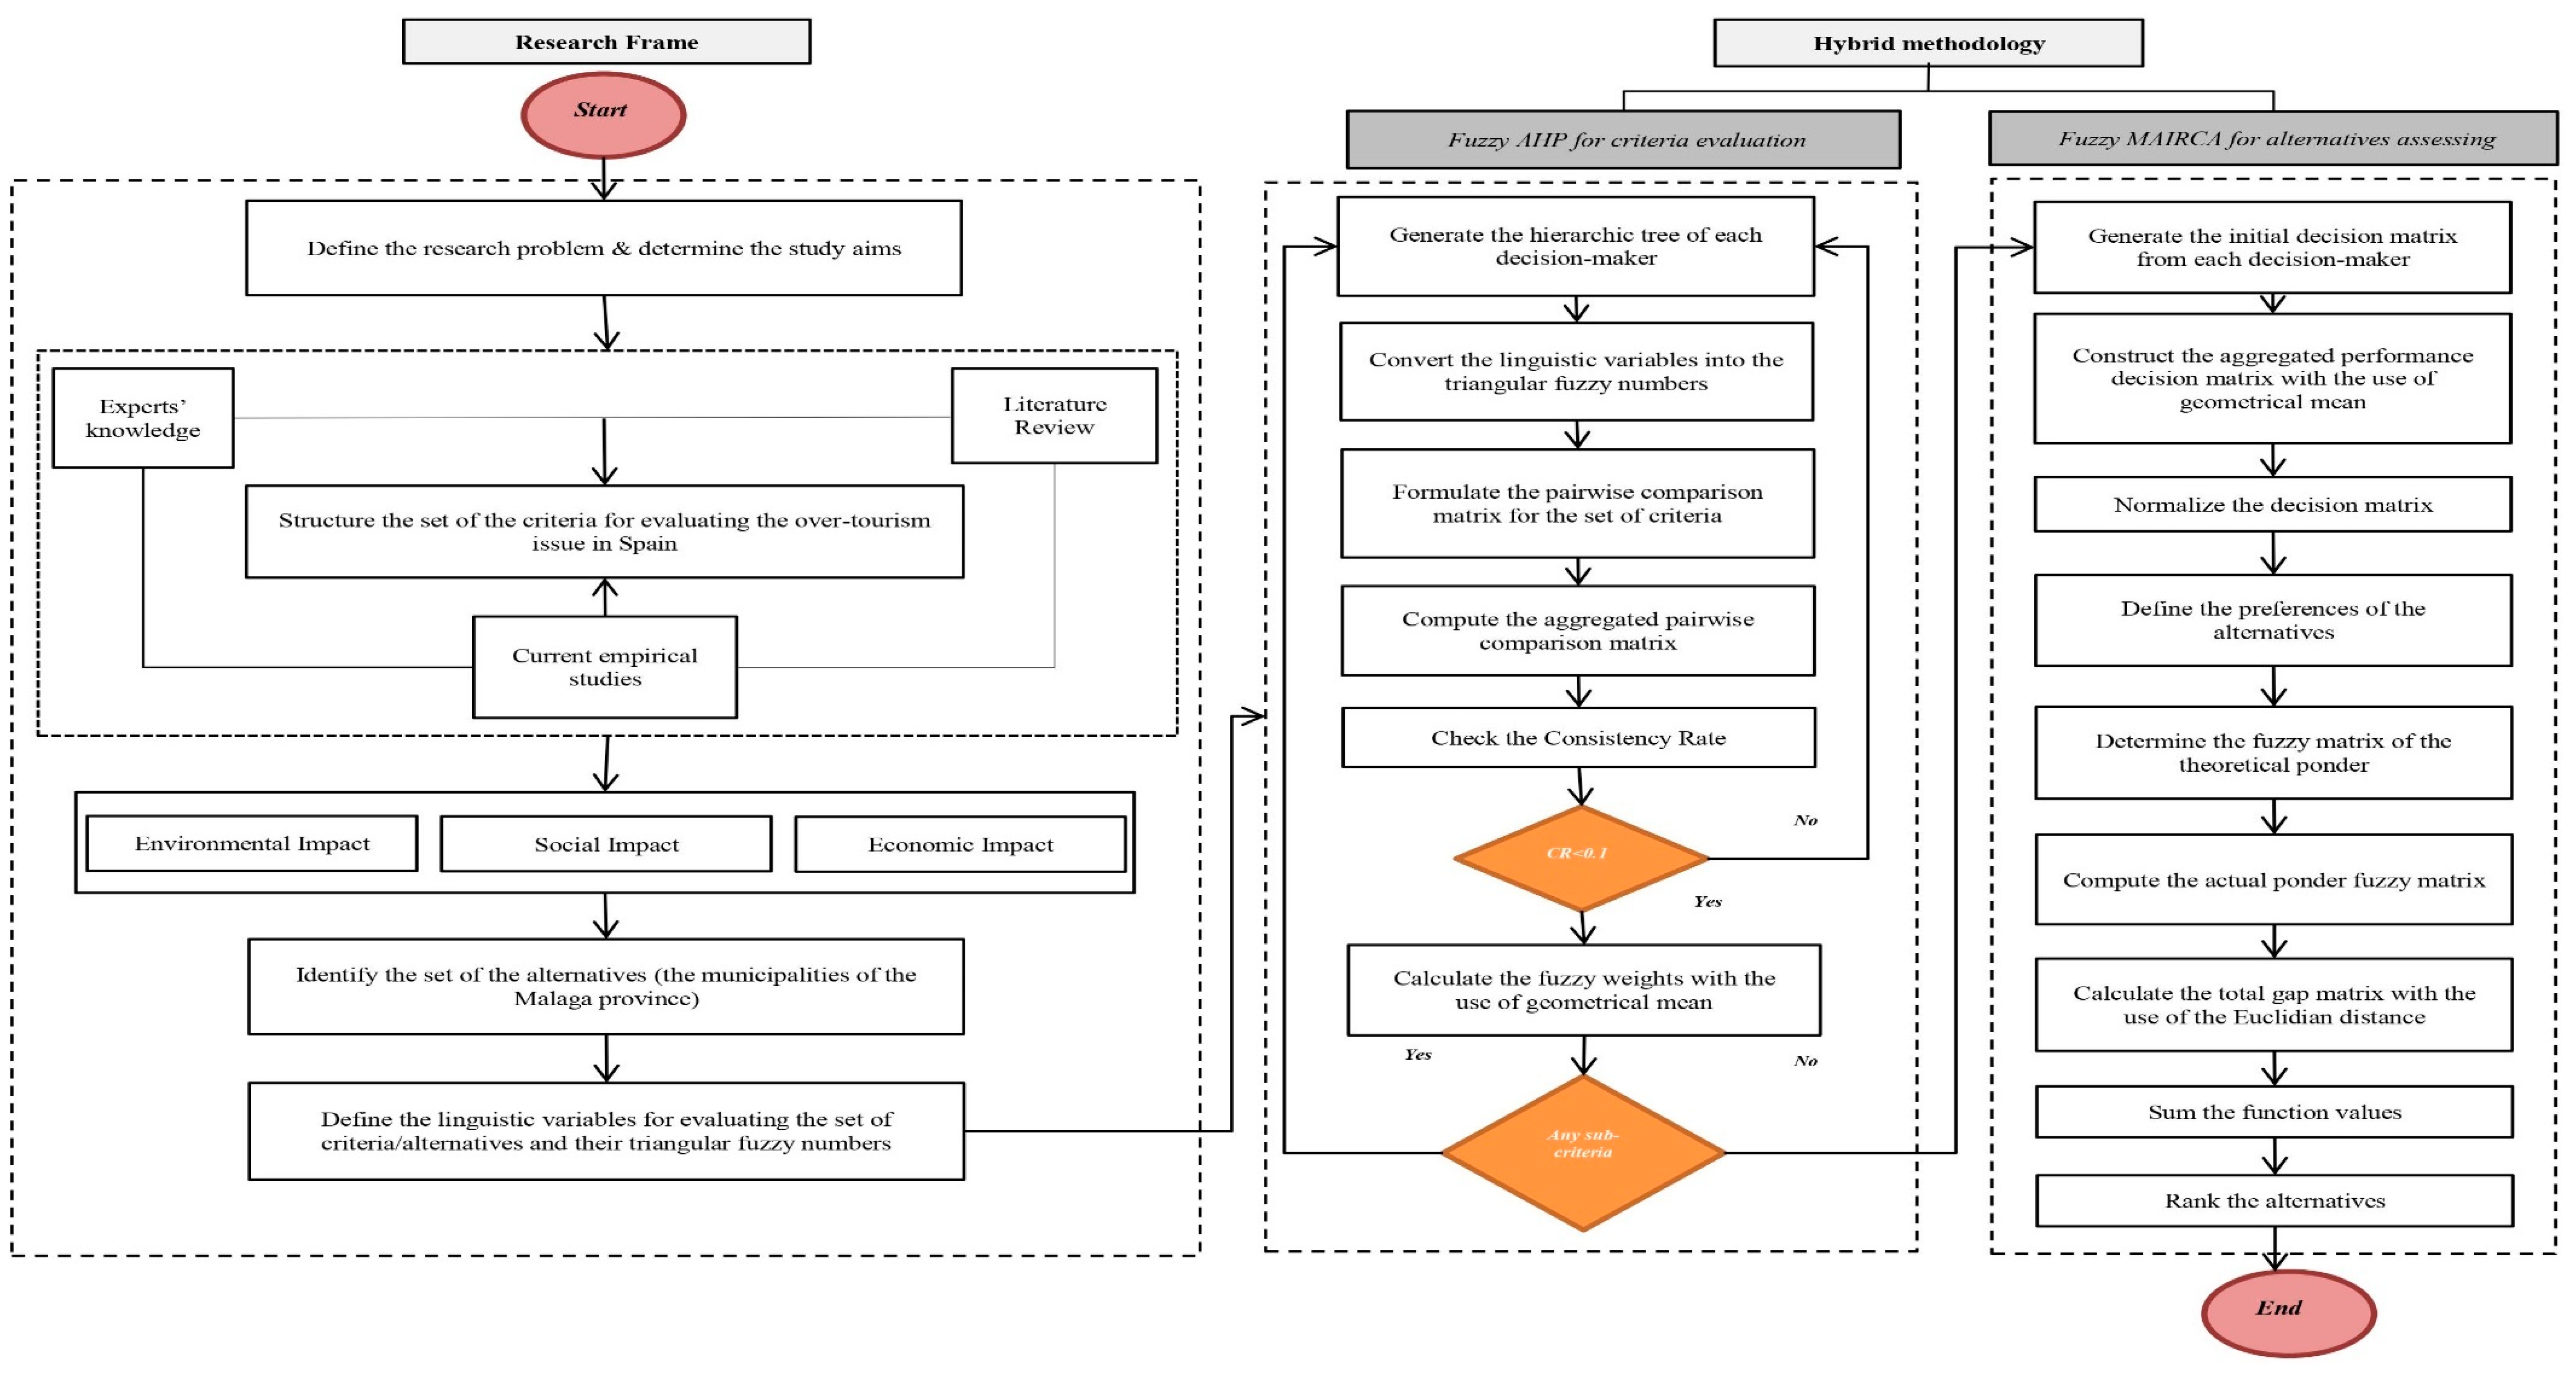
Section 3, a fuzzy hybrid model, combining AHP and MAIRCA model customised to the overtourism evaluation, is proposed. Section 4 entails a presentation of the numerical application, whereas Section 5 presents a discussion, sensitivity and comparative analysis. Finally, Section 6 presents conclusions, research boundaries, and directions of future studies.

2. Literature Review

2.1. Review of Prior Methodologies Used in the Tourism Industry

As this paper underpins tourism concerns, diverse methodologies have been employed in the tourism industry towards sustainable tourism management. The domain of Multi-Criteria Decision-Making (MCDM) has been significantly developed, thanks to the vast number of academic and scientific works dealing with the application of the specific decision by adopted models that pertain to the particular field. In addition, MCDM is a convenient methodology for solving complex problems due to its capacity to assess numerous alternatives employing a particular set of criteria. The main reason behind developing MCDM by scholars is to establish mathematical formulas aimed at facilitating the criteria evaluation and the selection of the most adequate alternative. Besides this, MCDM techniques have been applied to smooth the decision-making process in various business areas, having lately gained attention in the domain of tourism as presented in Table 1.
Heretofore, MCDM techniques have been applied in the tourism area to contribute and facilitate the policymaking process concerning diverse issues. The most common matter that occupied academic attention is the case of the selection of eco-tourism destinations. Hence, other authors investigated the theme of tourists’ behaviour by using MCDM methods [43,44]. The implementation of the best tourism planning strategies has been performed by applying MCDM techniques. However, it can be deduced from this review that there is no research that has been conducted on the MCDM approach to assess the overtourism phenomenon and its negative impact on the community. To our knowledge, most of the previous works used traditional approaches to analyse the overtourism issue and did not pay as enough attention to assessing its negative impacts with advanced numerical approaches [45,46,47,48]. In other words, there is a dearth of consistent works, and even developing a systematic model and examining the relative importance of overtourism has been ignored. As a solution to this problem, a need remains for developing a novel methodical model and offering an adapted version of the MCDM approach to suit the examination of overtourism as well as the analysis of its impact on the local community.
The increasing number of MCDM use in the past few decades has pushed scholars to develop and propose a range of various techniques to solve different sorts of complex problems in business. However, we cannot deny the fact that these developed techniques hold pros, cons, and limitations. Thus, it is compulsory to designate an adequate technique for the research problem that is being resolved [49]. The most prominent MCDM techniques are the analytic hierarchy process (AHP) method [50]; the analytic network process (ANP) method [51]; the complex proportional assessment of alternatives (COPRAS) method [52]; the preference ranking organization method for enrichment evaluation (PROMETHEE) method [53]; elimination et choix traduisant la réalité (ELECTRE) method [54]; VlseKriterijumska Optimizcija I Kaompromisno Resenje (VIKOR) method [55]; the technique for order performance by similarity to ideal solutions (TOPSIS) method [56], and so on. Additionally, there is a contemporary set of MCDM techniques that can deal with a broader range of complex problems, such as a new multi-attribute ideal–real comparative analysis (MAIRCA) method [57]; the step-wise weight assessment ratio analysis (SWARA) method [58]; the additive ratio assessment (ARAS) method [59]; the multi-objective optimization on basis of ratio analysis (MOORA) method [60]; the multi-objective optimization by ratio analysis plus the full multiplicative form (MULTIMOORA) method [61], and so forth. It is important to highlight that some of the aforesaid techniques are applied for calculating the weights of the criteria and some of them are used for prioritising the alternatives.
In the actual context of overtourism assessment, the analytic hierarchy process (AHP) is an appropriate technique of ‘measurement through pairwise comparisons’ and considered as one of the most resilient multiple criteria decision-making techniques [62]. The nature of the AHP method is analytical and allows the decision-makers to turn the abstract form of the problem into a constituent component throughout a ‘bottom-up from the alternatives to the criteria’ procedure. Due to its practicability, this study adopts the AHP technique to solve the research questions. Some studies highlighted the importance of this technique and described in detail the procedure of its application [63]. On the other hand, the Multi-attribute Ideal-Real Comparative Analysis (MAIRCA) was initially introduced by the Centre for Logistics Research at the University of Defence in Belgrade in 2014 [64], and it is a novel potential technique that can be softly merged with different MCDM techniques. The main purpose of selecting this method in this study is to determine the gap between ideal/real assessments, sum the gaps for each criterion in the decision matrix, and calculate the total gap for each alternative in the evaluation process. At the end of the evaluation process, the ranking of the alternatives depends on the obtained gap values, and the alternative with the lowest gap value is the best one in the filtration process and vice versa [65]. Advocating the effectiveness of the proposed methodology, the core challenge of the present paper is to give deep insights into assessing the overtourism issue in this exceptional situation of the pandemic and applying corresponding sustainable actions in the future.

2.2. Dimensions of Overtourism

Hitherto, overtourism is at a very early stage of research and often allied with the number of tourists’ arrival and the destination carrying capacity [66]. In practical terms, overtourism encompasses multidimensional push factors and entails other stakeholders like residents and local businesses. As tourism activity rises in a region, the negative impacts on the local area become evident [67]. This conforms to the definition provided by Mowforth [68]: “the result of carrying capacity measurements will always depend on the context of the situation being measured and that this context will vary not just with the physical and social environments, but also with the values of those asking the questions and establishing the conditions for measurement”. This involves that all destinations will know manifold capacities, not just in the context of the balance between different dimensions of carrying capacity but within these dimensions as well. However, at the time of realising this work, the number of international tourists arriving in Spain diminished by 64.3% compared to March 2019. The most touristic places in Spain, the Balearic Islands and Catalonia, registered a decline of 68% while the Canary Islands recorded a drop of over 66% in international arrivals and with a national average of almost 65% [69]. The COVID-19 outbreak has intensively affected one of the vivid sectors for the Spanish economy and had declined the tourism activity by 98% in March 2020 [70]. As a result, the estimated evolution of the output gap of the Spanish economy knows again a negative gap, registering rates close to −10% by 2020, which refers to the sudden change in the cyclical position of the national economy. The evolution of the output gap was gradually closed since 2013, when it reached its minimum, and in 2018 and 2019 reached slightly higher than their potential levels [69]. However, the Spanish government is drafting a budget policy that allows the reconstruction of the country and underpins economic recovery where the policy will lay the basis for economic, social, and environmental reform [69]. From this context, the criteria employed in this study were in the first place determined in line with a detailed comprehensive literature review [25,30,66,71,72,73,74,75,76,77] and then by 14 tourism experts’ approvals. Similarly, Peeters et al.’s [11] study also acknowledges that overtourism evaluation is deemed suitable by considering economic, social, and environmental dimensions. The designation process is categorised into three dimensions and the drivers leading to them are presented in Table 2.

3. Materials and Methods

3.1. Study Area

Malaga province is a seaside capital in southern Spain’s Andalusia autonomous community, also called Costa del Sol (Sun Coast) and it is in 6th place among 50 provinces and 2 autonomous cities by demographic size with a land area of 802.7 km2. The province is located in 37° north latitudes and 5° west longitudes. This coast has a Mediterranean climate with mild, relatively wet winters and hot and sunny summers. It has a warm climate and hardly any precipitation. The average maximum temperature in Costa del Sol is 28 °C in summer and 14 °C in winter. The water temperature is between 17 °C and 25 °C. Figure 1 describes the cartographic representation of the study area by the use of the software packaging Qgis, version 3.10.6.
In 2019 the population of Spain did not reach 46.5 million and the number of international tourists who visited Spain in that year was 83.7 million, generating 12.3% of GDP and 12.7% of employment [10]. According to the Ministry of Industry, Commerce and Tourism [78], the tourism sector became, after the economic crisis (2015–2019), one of the reliable strategic sectors. Andalusía is the first destination in terms of receiving foreigners worldwide. The annual number of visitors exceeds 29.5 million, more than triple the regional population and revenues reach 20.4 billion euros. According to the latest available data, the region has some 546,000 regulated accommodation places, of which around 250,000 are offered in the hotel category [79]. In Malaga, the number of foreign tourists who came to travel exceeded 12 million, which represents an increase of 3.4% compared to 2018 [80]. The capital has some 337,200 regulated accommodation places, of which around 100,395 are offered in the hotel category. Tourism activity has a great weight in Costa del Sol for its contribution to regional GDP, the employment it generates, and its ability to drag on other economic activities [81]. In recent years, the favourite destinations for tourists are the beaches of Malaga province, which represents the maximum exponent totals a third of the hotel beds in the region. The lower pressure of foreign demand favoured the hiring of Spanish tourists due to greater accessibility to the accommodation offer in Spanish destinations on the Spanish coast with the highest presence of tourist packages [82].
In 2020, for the first time after the Second World War, the tourism sector reduced its activity to almost zero overall in a controlled way. Uncertainty has been the protagonist of this unprecedented situation. The movements of people were reduced to their minimum expression, called essential and applied to all scales. The first reports predicted a pessimistic tourist future, with millions in losses, unemployment, destroyed companies, and a reactivation of the sector conditional on the mass production of a valid vaccine. In any case, Navarro et al. [83] declare that the new tourism will go through adaptation not only conceptual and process, but planning as well. The Costa del Sol is divided into two areas: the ‘Western Costa del Sol’ and the ‘Eastern Costa del Sol’, the capital and centre of both being the city of Malaga. Based on the tourism activity intensity reported by the statistical registry of Andalusia tourism [84], the municipalities being considered in this study are Fuengirola, Torremolinos, Benalmadena, Malaga capital, Marbella, Estepona, Mijas, and Nerja. Figure 2 describes the cartographic representation by the use of the software packaging Qgis, version 3.10.6 to explain the geographical location of the study area and the densities of the accommodation spaces.

3.2. Methodological Overview

This paper proposes the use of modified F-AHP and F-MAIRCA as an adapted methodology to evaluate overtourism issue of the case of Malaga province and accordingly propose the post-COVID-19 tourism sustainable/potential actions. The hierarchy framework consists of three succeeding steps, which are graphically presented in Figure 3. This framework can help tourism policymakers and manager analysts to identify the proposed set of criteria for overtourism evaluation by the study area, conclude the relative importance of criteria weights, and determine the most impacted alternative. First, the determination of the criteria and alternatives comes in the second place directly after the research problem and study aim identification. This set of criteria and alternatives have been designated through a deep investigation of relevant literature, current empirical studies, and inputs concluded from brainstorming meetings with experts in the tourism industry. As a result, a set of 10 criteria have been arranged and divided into three dimensions regarding environmental, social, and economic aspects. Additionally, eight municipalities of Malaga province have been selected due to their immense touristic activity in the peak seasons. Second, the dimension and criteria weights are calculated separately and then the total weights are generated. The main role of the F-AHP model is to identify relevant weights of each criterion and check the consistency rate of pairwise comparison matrices obtained from expert’s judgments. After obtaining the fuzzy global weights, the initial decision matrices are generated with the assistance of the decision-makers and experts in the tourism sector. Furthermore, the obtained weights are integrated with the F-MAIRCA model to assess and select the most impacted municipality by overtourism.

3.2.1. Data Acquisition

To evaluate the set of pertinent criteria identified through literature review and prospective alternatives, the background of experienced experts in the tourism sector was considered. A team of twelve highly proficient decision-makers was created. Each decision-maker, industrious in a differently situated yet important Costa del Sol region (Malaga province), was invited to furnish subjective judgments and decisions based on self-knowledge and proficiency. In this research, a combination of literature review and questionnaire survey was employed involving the appraisal of rich judgments obtained from experts as a sample with quantitative data [85]. A pilot survey was performed over semi-structured interviews with the team to eliminate the equivocal viewpoints, rectify errors, and test the compatibility of the identified indicators with the actual concerns in Spain. The questionnaire was handed out among tourism practitioners working in different public administrations including tourism faculty, municipalities, tourism delegations, and national tourism organisations as illustrated in Table A1. These selected experts, at a political level, face daily the challenge generated by the impact of tourism in their destinations, addressing the complex and non-linear interaction between the ‘right to the city’ and the disruption of ‘the tourist city’. The survey was constructed with two passages dedicated to creating the decision matrices to be employed in both AHP and MAIRCA method as explained in Table S1. However, the decision-makers’ subjective judgements might entail ambiguity and some linguistic variables can refer to the same importance [86]. As a solution to this problem, triangular fuzzy numbers (TFNs) were utilised to overcome the vagueness and determine the linguistic importance weights. During the interviews, the experts stated the methods used by the tourism planning institutions to measure the overtourism in Malaga province as follows:
  • An analysis of tourist flows by territories and roads in the city is carried out using Big Data tools, evaluating the carrying capacity of each one of them. Tourism statistics are quantified and scaled by creating micro-statistics associated with the impact of tourism activity and its relationship with residential statistics, tourists, and visitors, by residents;
  • An analysis of behaviour in terms of spending and visitor profiles is carried out. From other areas of Government of the City Council such as environmental sustainability, urban planning, commerce, mobility, security, and others, different ratios are evaluated and a comparison is made with other European cities;
  • Evaluation of the reports issued by Tourism and Planning Costa del Sol through meetings with professionals in the sector;
  • Cooperation with neighbourhoods’ service offices that enable them to deal directly with incidents suffered by residents due to excess tourism in the summer months. Consider monthly reports of hotel occupancy, tourist apartments, and analysis of the distribution of the VFT (housing for tourism purposes), and field work–study Profile of the Visitor to the city of Malaga.

3.2.2. Preliminaries

The triangular fuzzy number is used in this study. Therefore, some prime definitions and operations are concisely furnished in this section for the sake of the reader understanding. The Fuzzy set theory was primarily introduced by Zadeh [87] and has been widely employed to handle judgments extracted from real-world issues that contain ambiguity and vagueness. The main role of this theory is to deal with inaccurate data mathematically. A fuzzy set could be expressed arithmetically by giving a value to each discrete in the universe N ˜ = { ( x , μ N ˜ ( x ) ) ,   x R } ,   R 1 = < x < + and where each value is referring to its grade of membership in terms of membership function μ N ˜ ( x ) to the close interval of   [ 0 ,   1 ] . This is made to respond in a logical way to the primary imprecise judgments taken from various sources of information that might be ambiguous. The triangular fuzzy numbers (TFN) are the pillar of the fuzzy set and it is expressed with borders rather than crisp numbers to conduct a pairwise comparison matrix of the decision-makers. A triangular fuzzy number (TFN), symbolized by   N ˜ = ( l , m , u ) , entails the subsequent function [88]:
μ N ˜ ( x ) = { ( x 1 ) / ( m 1 ) , l x m ( u x ) / ( u m ) , m x u 0 o t h e r w i s e ,
The triplet values ( l , m , u ) determine the fuzzy situation and border the area of possible assessment to the close interval of   [ 0 , 1 ] where the parameter m shows the most favourable value, l represents the lower possible value, and the parameter u denotes the upper possible value. The basic operational laws for two triangular fuzzy numbers (TFNs) N ˜ 1 and   N ˜ 2 , N ˜ 1 = ( l 1 , m 1 , u 2 ) and   N ˜ 2 = ( l 1 , m 1 , u 2 ) , are defined as follows [79]:
Addition   N ˜ 1 N ˜ 2 = ( l 1 + l 2 ,   m 1 + m 2 ,   u 1 + u 2 )
Subtraction : N ˜ 1 N ˜ 2 = ( l 1 l 2 ,   m 1 m 2 ,   u 1 u 2 )
Multiplication   N ˜ 1   N ˜ 2 = ( l 1 l 2 ,   m 1 m 2 ,   u 1 u 2 )
Division   N ˜ 1   N ˜ 2 = ( l 1 ÷ l 2 ,   m 1 ÷ m 2 ,   u 1 ÷ u 2 )
Multiplication by a crisp value   λ N ˜ 1 = ( λ × l 1 ,   λ × m 1 ,   λ × u 1 ) ;   λ > 0   λ N ˜ 1 = ( λ × u 1 ,   λ × m 1 ,   λ × l 1 ) ;   λ < 0 ,   λ R

3.2.3. Modified Fuzzy AHP Method

The present study proposes a modified fuzzy AHP model, supports the evaluation process by using triangular fuzzy numbers to translate the judgments of experts, and proposes the geometrical mean method to obtain the value of the total weights. The following basic steps are essential to calculate the criteria weights [89]:
Step 1: Construct pairwise comparison matrices for dimensions and criteria of the hierarchy structure using linguistic variables in Table 3.
In Equation (7), kth denotes the number of the decision-makers who take part in the decision-making process. Each element d ˜ i j ( k ) of the pairwise comparison matrix D ˜ ( k ) is a fuzzy number equivalent to the linguistic variables.
D ˜ ( k ) = [ d ˜ 11 ( k ) d ˜ 12 ( k ) d ˜ 13 ( k ) d ˜ 1 n ( k ) d ˜ 21 ( k ) d ˜ 22 ( k ) d ˜ 23 ( k ) d ˜ 2 n ( k ) d ˜ ( n 1 ) 1 ( k ) d ˜ ( n 1 ) 2 ( k ) d ˜ ( n 1 ) 3 ( k ) d ˜ ( n 1 ) n ( k ) d ˜ n 1 ( k ) d ˜ n 2 ( k ) d ˜ n 3 ( k ) d ˜ n n ( k ) ]
A linguistic term is a sentence or a word formed to refer to the decision-maker’s preferences, which can be realised through the questionnaire. To translate the experts’ subjective pairwise comparisons, the triangular fuzzy number (TFN) for importance weights of each criterion is structured as shown in Figure 4:
Step 2: In this step, the aggregated fuzzy pairwise comparison matrix is determined with the help of the decision-makers as represented in Equation (8).
D ˜ = [ ( d l 11 , d m 11 , d u 11 ) ( d l 12 , d m 12 , d u 12 ) ( d l 1 n , d m 1 n , d u 1 ) ( d l 21 , d m 21 , d u 21 ) ( d l 22 , d m 22 , d u 22 ) ( d l 2 n , d m 2 n , d u 2 n ) ( d l n 1 , d m n 1 , d u n 1 ) ( d l n 2 , d m n 2 , d u n 2 ) ( d l n n , d m n n , d u n n ) ]
Step 3: This step is necessary to be done to check the consistency of the decision-maker’s judgments throughout the evaluation procedure. The consistency index (CI) of the fuzzy aggregated pairwise comparison matrix   D ˜ = [ d ˜ i j ] , and consistency ratio (CR) are computed by applying Equations (9) and (10), respectively.
C I = λ m a x N N 1
C R = C I R I ( n )
where, λ m a x denotes the largest eigenvalue, N the number of dimensions being used in the comparison matrix, and R I represents the random index. The values of R I varies correspondingly to the order of the judgments N as provided in Table 4.
The evaluation process is acceptable (consistent) when the value of the consistency ratio (CR) is equal to or less than 0.1. In case the obtained results are not consistent, the experts are requested to re-evaluate the pairwise comparison matrix.
Step 4: Next, the geometrical mean method is proposed in this study to determine the fuzzy geometric means of the triangular fuzzy numbers and the fuzzy weights for each row in the matrix as explained in Equation (11).
t ˜ i = ( j = 1 n d ˜ i j ) ( 1 k )
where, k denotes the number of the decision-makers.
Furthermore, the obtained fuzzy criteria weights are integrated with the proposed fuzzy MAIRCA method in the next sub-section to assess the alternatives.

3.2.4. Modified Fuzzy MAIRCA Method

The main shortcoming of the traditional MAIRCA method is in responding to the preference of decision-makers by using crisp values and its inability to calculate the total aggregated performance of multiple decision-makers. This study proposes a modified fuzzy MAIRCA method for the alternative’s assessment with the use of triangular fuzzy numbers and the aggregated performance method [92]. The selection of the most impacted province by overtourism is conducted based on the gap values. The ranking is accomplished to measure every region with highlighted objectives of the analysis. The following steps are required to apply the proposed fuzzy MAIRCA model:
Step 1: In this step, the linguistic variables are translated into triangular fuzzy numbers (TFN) for the agreed scale for rating the alternatives illustrated in Table 5 and Figure 5. The initial decision matrix X is constructed, where the m number of alternatives is assessed with respect to the n number of criteria. For generalisation, the number of decision-makers that are contributing to the assessment procedure of m alternatives is denoted as k regarding the n number of criteria. The fuzzy initial decision matrix is as follows:
X ˜ ( k ) = [ x ˜ 11 ( k ) x ˜ 12 ( k ) x ˜ 13 ( k ) x ˜ 1 n ( k ) x ˜ 21 ( k ) x ˜ 22 ( k ) x ˜ 23 ( k ) x ˜ 2 n ( k ) x ˜ ( m 1 ) 1 ( k ) x ˜ ( m 1 ) 2 ( k ) x ˜ ( m 1 ) 3 ( k ) x ˜ ( m 1 ) n ( k ) x ˜ m 1 ( k ) x ˜ m 2 ( k ) x ˜ m 3 ( k ) x ˜ m n ( k ) ]
where,   X ˜ ( k ) = ( x l k , x m k , x u k ) ;   x l x m x u ; i = 1 , 2 , 3 , , m ; j = 1 , 2 , 3 , , n ; k = number of experts.
Step 2: The aggregated performance decision matrix provided by experts is calculated with the use of the geometrical mean and represented by Equation (13).
r ˜ i = ( j = 1 n x ˜ i j ) ( 1 k ) ,   i = 1 , 2 , , m ; j = 1 , 2 , , n
where, k implies the number of the decision-makers.
Step 3: This step considers the normalisation, for each given criterion, of aggregated decision matrix X ˜ F as generated in Step 2. Assuming that this study does not hold a large number of incompatible criteria and the decision-makers do not take the type of the criteria (e.g., beneficial and non-beneficial) into account throughout the decision-making process. For the sake of ease in calculations, the normalisation process of the aggregated data (by geometric mean) holds a new technique unlike the one proposed by Pamučar [64], as given in Equation (14).
n i j l = x i j l i = 1 m [ ( x i j l ) 2 + ( x i j m ) 2 + ( x i j u ) 2 ] n i j m = x i j m i = 1 m [ ( x i j l ) 2 + ( x i j m ) 2 + ( x i j u ) 2 ]   n i j u = x i j u i = 1 m [ ( x i j l ) 2 + ( x i j m ) 2 + ( x i j u ) 2 ]
Next, the fuzzy normalised decision matrix is represented by Equation (15).
N ˇ X = [ n ˜ 11 n ˜ 12 n ˜ 13 n ˜ 1 n n ˜ 21 n ˜ 22 n ˜ 23 n ˜ 2 n n ˜ ( m 1 ) 1 n ˜ ( m 1 ) 2 n ˜ ( m 1 ) 3 n ˜ ( m 1 ) n n ˜ m 1 n ˜ m 2 n ˜ m 3 n ˜ m n ]
Step 4: Since the experts are indifferent towards the choice of the optimum alternative in the study, the present step ensures that each alternative is given an equal probability for selection as the ideal one. Hence, the preferences for each alternative can be defined by using Equation (16).
P X i = 1 m ;   i = 1 m P X i = 1
where   m denotes the number of alternatives.
Step 5: Next, the elements of the fuzzy matrix of theoretical ponder T ˜ P X are computed by multiplying the preferences to the selection of alternatives and the fuzzy criteria weights taken from the application of fuzzy AHP method   w ˜ i = ( w i l , w i m , w i u ) , where   w i l = w i m = w i u . The fuzzy theoretical ponder matrix is computed as follows:
T ˜ P X = [ 1 m × w ˜ 1 1 m × w ˜ 2 1 m × w ˜ 3 1 m × w ˜ n 1 m × w ˜ 1 1 m × w ˜ 2 1 m × w ˜ 3 1 m × w ˜ n 1 m × w ˜ 1 1 m × w ˜ 2 1 m × w ˜ 3 1 m × w ˜ n 1 m × w ˜ 1 1 m × w ˜ 2 1 m × w ˜ 3 1 m × w ˜ n ]
Thus, the fuzzy theoretical ponder matrix looks like the following:
T ˜ P X = [ t ˜ p 11 t ˜ p 12 t ˜ p 13 t ˜ p 1 n t ˜ p 21 t ˜ p 22 t ˜ p 23 t ˜ p 2 n t ˜ p ( m 1 ) 1 t ˜ p ( m 1 ) 2 t ˜ p ( m 1 ) 3 t ˜ p ( m 1 ) n t ˜ p m 1 t ˜ p m 2 t ˜ p m 3 t ˜ p m n ]
where   t P i j = 1 m × w ˜ j ; i = 1 , 2 , 3 , , m and   j = 1 , 2 , 3 , , n .
Step 6: The fuzzy elements of the actual ponder matrix T ˜ r X is computed by multiplying the elements of the fuzzy normalised decision matrix to the elements of the fuzzy theoretical ponder matrix as represented in Equation (19):
T ˜ r X = ( N ˜ X T ˜ P X ) =     [ n ˜ 11 × t ˜ p 11 n ˜ 12 × t ˜ p 12 n ˜ 13 × t ˜ p 13 n ˜ 1 n × t ˜ p 1 n n ˜ 21 × t ˜ p 21 n ˜ 22 × t ˜ p 22 n ˜ 23 × t ˜ p 23 n ˜ 2 n × t ˜ p 2 n n ˜ ( m 1 ) 1 × t ˜ p ( m 1 ) 1 n ˜ ( m 1 ) 2 × t ˜ p ( m 1 ) 2 n ˜ ( m 1 ) 3 × t ˜ p ( m 1 ) 3 n ˜ ( m 1 ) n × t ˜ p ( m 1 ) n n ˜ m 1 × t ˜ p m 1 n ˜ m 2 × t ˜ p m 2 n ˜ m 3 × t ˜ p m 3 n ˜ m n × t ˜ p m n ]
Step 7: To calculate the total gap matrix   G , it is recommended to use the fuzzy Euclidean distance for each alternative for each criterion from the theoretical and actual ponder matrix. The reason for using this notion is to diminish the calculation steps and simply get the crisp gap value (de-fuzzification). The total gap matrix is represented by Equation (20).
[ G ] m × n = [ 1 3 [ ( t p i j l t r i j l ) 2 + ( t p i j m t r i j m ) 2 + ( t p i j u t r i j u ) 2 ] ] m × n
where, the elements of total gap matrix G are represented by g i j .
Step 8: Final obtained value of the criteria functions is computed by summing the gap values for each alternative regarding each criterion as indicated in Equation (21). Then, the final values are ranked in ascending order.
Q i = j = 1 n g i j ; i = 1 , 2 , 3 , , m    
As stated earlier, the best-ranked alternative is the one with the minimum gap value, whereas the worst-ranked alternative is the one with the maximum gap value.

4. Results

This study proposes a novel hybrid model, namely, fuzzy AHP-MAIRCA, adapted to assist the tourism policymakers to make better decisions in future and implement wide-ranging sustainable strategies. For good measure, the present paper aims at focusing on specific regions that suffered from overtourism before the COVID-19 outbreak and seeking to revive tourism activity after the crisis in Spain through a series of realistic applications.

4.1. Weights Calculated in F-AHP

Fuzzy AHP is applied in the present work to identify the relative fuzzy weights of the dimensions: environmental impact   ( C 1 ) , social impact   ( C 2 ) , and economic impact ( C 3 ) as well as their corresponding criteria   ( C 11 ,   C 12 , C 13 , C 21 , C 22 , C 23 , C 24 , C 31 , C 32 , C 33 ) . The overtourism complexity is solved by disintegrating it into a hierarchy entailing numerous sub-issues, which are scrutinised independently. Here, only the dimensions calculations are shown due to space constrictions. The same procedure is performed to compute the fuzzy weights of the 10 main criteria to obtain at the end of the local and global weights.
Step 1: The initial decision matrix D ˜ ( 1 ) is constructed with the support of the decision-maker’s assessment. The fuzzy pairwise comparison matrix of the dimensions is illustrated in Table 6.
Step 2: Next, the initial decision matrix is aggregated by using Equation (8) as given in Table 7.
Step 3: Using Equation (9), the consistency index (CI) of the fuzzy aggregated pairwise comparison matrix D ˜ = [ d ˜ i j ]   is computed regarding the number of the criteria. In this case study, the value is   C I = 0.0215 . Then, the consistency rate is calculated by applying Equation (10) for the value of the random index. The value is   C R = 0.0371 . Similarly, all values of the consistency rate are less than 0.1 which means that the evaluation process is satisfactory and the collected data from experts is consistent. Table 8 shows the calculated hierarchical structure of local and global weights of the first decision-maker. The global weights are obtained by multiplying the local weight of each dimension with the local weight of each criterion. Further, the results can be achieved via a similar computational way.
Step 4: The fuzzy geometric mean of the triangular fuzzy numbers and the fuzzy weights for twelve decision-makers is computed according to Equation (11) and presented in Table 9.

4.2. Ranking Generated in F-MAIRCA

In the next step, the fuzzy obtained weights of the F-AHP model are integrated with the F-MAIRCA model to rank the alternatives according to the degree of overtourism impact. The assessment matrix provided by decision-makers is constructed regarding the scale given in Table 5. Only one of the decision-makers’ assessment matrices is shown in Table 10 due to paper space limitations.
Step 1: First, translate the linguistic variables obtained from experts into triangular fuzzy numbers using Table 5. Applying Equation (12), the initial decision matrix X ˜ 1 is developed with respect to ten criteria C j = ( j = 1 , 2 , , 10 ) and eight alternatives’ vectors A i = ( j = 1 , 2 , , 8 ) as shown in Table 11.
Step 2: The aggregated performance matrix is calculated using Equation (13) and presented in Table 12.
Step3: Next, the elements of the aggregated performance matrix are normalised applying Equation (14) as represented in the normalised decision matrix N ˜ X = [ n ˜ i j ] 8 × 10 in Table 13.
Step4: In this step, the preference for each alternative is calculated using Equation (16). In the present work, the optimum value is   ( 1 8 ) = 0.125 . The matrix of preference is constructed for the preference value.
Step 5: Next, the elements of the fuzzy theoretical ponder matrix T ˜ P X = [ t ˜ P i j ] 8 × 10 are calculated by multiplying the obtained fuzzy weights from the fuzzy AHP method as shown in Equation (17), and are provided in Table 14.
Step6: The elements of the fuzzy actual ponder T ˜ r X = [ t ˜ r i j ] 8 × 10 are obtained using Equation (19) and are provided in Table 15.
Step7: The total gap matrix [ G ] 8 × 10 is computed by applying Equation (20) as given in Table 16.
Step8: Final criteria function values are calculated by using Equation (21) as provided in Table 17. As mentioned earlier, the municipality with the highest gap value is the most impacted one by overtourism and vice versa as per the proposed extended fuzzy MAIRCA methodology. The obtained results demonstrate that the Nerja municipality turned out to be the most impacted municipality by overtourism and Malaga capital is the least impacted one.

5. Discussion

In this section, the municipalities’ rankings result obtained by applying the proposed model is validated. First, a comparative analysis of municipalities is furnished for the set of criteria. The ranking results are compared with various MCDM methods. Second, a sensitivity analysis is conducted by modifying the criteria weight coefficients to reveal the subsequent variations in municipalities’ rankings.

5.1. Comparison Analysis

To validate the efficiency of the proposed model, a comparative analysis with some established techniques grounded in the tourism sector is performed. The comparative analysis will mainly focus on the MCDM approaches that have been applied in the tourism domain in general. A few of them are fuzzy VIKOR [94], fuzzy TOPSIS [95], fuzzy ARAS [96], and the fuzzy extension of the WASPAS method [97]. The obtained rankings are also compared with the fuzzy extension of the classical MAIRCA method developed by [64]. The ranking order of the municipalities   A i ( i = 1 , 2 , 3 , , 8 )   by different MCDM methods is presented in Table 18.
The criteria weights obtained by fuzzy AHP methods in the present study are directly integrated with all other selected MCDM methodologies to obtain constant outcomes. The calculation performance steps are not presented in this sub-section since it is related to the comparative analysis of the ranking results. According to the ranking of municipalities by using different fuzzy MCDM methods, it is perceived that, each time, Malaga capital (A4) is identified as the less impacted municipality by overtourism phenomenon. Moreover, it is deduced that Nerja (A8) is identified as the second most impacted municipality by all other established fuzzy methods, except the FARAS method. Thus, the ranking results agree to middling with the original ranking order. Further, compared with the five methodologies, the proposed fuzzy hybrid model generates reasonable results. It is concluded that the tighter the municipalities’ area is, the higher the overtourism impact is.
To check the reliability of the final decision results, it is preferable to compute Spearman’s rank correlation coefficient to define the correlation of ranks generated by applying different approaches. According to Keshavarz Ghorabee et al. [98], the correlation is generally calculated to reveal the statistical significance of difference among the ranking generated throughout the application of various approaches. As per Table 19, it is observed that all the correlation coefficients are higher than 0.80, with an average value of 0.9131, which implies a strong correlation between the existing MCDM approaches and the proposed fuzzy hybrid model. Figure 6 also confirms the credibility of the proposed approach.

5.2. Sensitivity Analysis

In the MCDM methodology, the ranking results are directly linked to the criteria weight coefficients. Therefore, it is required to conduct sensitivity analysis by modifying the weight coefficients of the criteria to test the constancy and permanency of the new proposed approach. Generally, the variation in criteria weight coefficients leads to a slight change in the ranking order of the alternatives. Hence, it is essential to spot the sensitivity of the proposed model applied to rank the alternatives and determine at the same time the criteria that drive the important changes to alternatives rankings. As mentioned earlier, the weight coefficients in this study are performed based on decision-makers’ and experts’ relative importance, and the outcomes of possible deviance of these criteria weights should be evaluated. In various studies, sensitivity analysis is performed by adopting a slight modification in the original weights. For the sake of unity, the sensitivity analysis is executed by applying the following equation [99]:
w i R e l a t i v e = w i O r i g i n a l ± γ w i O r g i n a l , i = 1 n w i R e l a t i v e = 1
where, γ denotes the percentage of the variation of the original weights.
In this work, a total of 40 scenarios are assigned based on criteria C j   ( j = 1 , 2 , 3 , 10 ) and their corresponding alternatives   A i   ( i = 1 , 2 , 8 ) , and commonly divided into four stages, where each stage entails 10 different scenarios. For each scenario, the relative weights are decreased and increased with a variation of (10%, 30%, 50%, and 70%) for the total new sum as provided in Table 20. Additionally, Figure 7 shows the variation in municipalities rankings for various level of inconstancy for each criterion (a, b, c, d, e, f, g, h, i, j). After further observation, the ranking order remains steady unless rough variations are executed in the criteria weights.
According to the findings, it is noticed that Nerja municipality (A8) preserves its first position in 100% of the scenarios, while Estepona municipality (A6) maintains its second position in 80% of the scenarios. Furthermore, Nerja is considered as the most impacted municipality by overtourism and Estepona can be considered as the second most impacted municipality. The obtained results also imply an important correlation ( 90 % ) by applying the fuzzy adapted F-AHP and F-MAIRCA. This significant correlation indicates that the final raking results of Malaga region’s municipalities using the proposed methodology are credible and valid.
Overtourism is a phenomenon that occurred before the pandemic. If the pre-pandemic regulations remain in the destinations, similar situations and processes are likely to emerge with renewed intensity [100]. The rhetorical question is whether one should return to the previous status as soon as possible or take advantage of this opportunity to modify, partially or totally, the economic and social conditions that led to this situation [101]. Spain is a typical example of current alterations in its tourism policy. These fluctuations are occurring due to several reasons as mentioned above. The findings revealed that the economic ground is worsening the tourism situation, followed by the social and environmental ground. There is urgent need to conduct resilient public policies that align with sustainability concerns. This study assessed the impact of overtourism from different backgrounds (economic, environmental, and social). Therefore, the sustainability dimensions must be examined interdependently and not independently. The findings of this study also demonstrate that overtourism cannot be examined by taking the tourism perspective alone. Instead, the tourism policymakers are required to consider management strategies in a wider scope to keep up with the fast-growing movement within the tourism sector. The proposed methodology allows local governments to take measures according to the needs of their destinations without going back to the mistakes of the past and seeking a balance among environment, society, and economy [102]. Sustainable interventions tend to be valued positively by tourists and, in addition, promote increased competitiveness of destinations and touristic companies, although their implementation may incur additional costs. These costs of adapting tourist destinations to the new times should not affect a process of differentiation by prices for the promotion of the destination.
Nerja is a clear example of a tourist destination in which results and interpretations about tourism can change in a short period (overtourism/undertourism). The attractiveness of this destination is the result of many voices of supply and demand, in which economic development must be combined with DMOs. Therefore, the solution of balance between this overtourism/undertourism is to make everyone understand the role of tourism and accept the tourism product as such, that spatial and seasonal distribution of tourism is carried out and continuous monitoring and development of the Smart Destination are carried out to allow a process of continuous improvement [103]. Additional measures could be aimed at: extending the length of stay of tourists, stocking up in closer or proximity markets, promoting the consumption of organic and seasonal products, moving towards a model with high added value, encouraging local benefit and not that of global foreign-owned platforms, abandoning carbon-intensive travel, reducing seasonality, preserving the social fabric of cities, and promoting public–public, private–private, and public–private collaboration [104]. This period can be seen as an opportunity to reconsider a transformation of the global tourism system, focusing it towards one that is more aligned with the United Nations Sustainable Development Goals for 2030 (SDG) [105]. As indicated by Pons et al. [106], tourism sustainability does not only imply providing a balanced solution to economic profitability but also to social well-being and ecological balance.

6. Conclusions

Tourism endures incessant metamorphosis and requires sustainable management for residents, tourists and visitors. The economic, social, and environmental negative effects of overtourism have to be corrected. Hence, there lies the importance of reflection on the perception of this problem, determining its impacts, and proposing answers. Currently, Spain is facing a global pandemic that has paralysed the tourism sector and has exposed its extreme volatility. Therefore, it is time to put the innovation and accumulated tourist knowledge at the service of society, especially in areas such as the Costa del Sol. In the post-COVID-19 scenario, sustainability will be the differentiating factor to be taken into account in decision making in tourist destinations. The local destinations should start working more forcefully and sustainably, betting on collaboration also between destinations, due to the competitiveness to obtain the attention of future tourists. The visitor will be significant and their choice must be defined based on the product, the excellence, and the experience offered by the destination and not based on the price. Along the course of the pandemic, until it reaches its end, many changes will surely appear. The tourist who comes will have new requirements, in line with the experiences in previous destinations, together with the possible trauma caused by the difficult environment created by COVID-19. The requirement of safety (health, economic, and social) linked to environmental and social sustainability will be the pillar of the new framework within the tourism sector once post-COVID-19 begins to emerge.
The fuzzy modified AHP method was applied in this study for calculating the weights of the overtourism dimensions and main criteria. On the other hand, the fuzzy modified MAIRCA method was used for spotting the most impacted municipality in Malaga province by the overtourism phenomenon in the pre-pandemic scenario. The obtained global weights via fuzzy AHP were utilised as inputs in the adapted fuzzy MAIRCA method for assessing the municipalities and designating the most and less impacted ones. The attained findings were acknowledged by the professionals and there was a strong agreement among them. Firstly, the fuzzy AHP proposes a consistency rate (CR) equation to verify the pairwise comparison matrix of the decision-makers. Further, it demonstrates the mutual relationship between the push factors of the overtourism phenomenon. This can help policymakers and managers to conduct local and global weights for each criterion to reveal the impacted municipality. The main influencing criteria are: “CO2 emission/marine pollution   ( C 11 ) ”, “inorganic waste   ( C 12 ) ”, and “Economic dependence on tourism sector   ( C 33 ) ”. Secondly, the fuzzy MAIRCA illustrates to us how to aggregate the experts’ judgments and select the most impacted municipality by overtourism issue. The eightieth alternative (Nerja municipality) turned out to be the most impacted municipality in Malaga province. Thus, the tourism policymakers in the public sector and managers in the private sector would be capable to support the impacted municipalities by implementing sustainable tourism actions that go along with overtourism and undertourism in the post-COVID-19 scenario. Thus, the proposed framework may help as a reference for depicting and analysing the push factors as well as communities worldwide.
Andalusia has not been the only region hardest hit by the effects of the pandemic on the health of its population. On the contrary, it may be one of those that suffer the most from its economic consequences. The structural characteristics of the Andalusia economy, its lower density and business size, its sectorial specialisation, its low capacity to generate employment, and the trends observed in recent years of high relative entrepreneurship out of necessity, accompanied by some incipient experiences of entrepreneurship in High potential (Start-ups) very localised in very few geographical locations, make the consequences of the crisis particularly worrying in Andalusia. The impact has been high in consumer-oriented sectors such as tourism, hospitality, leisure, and retail with a high presence in the area. It has also been relatively important in micro-enterprises, self-employed and recently created companies, which have more relative weight in the region. It has especially hit women, youth, and people with less training and with temporary contracts. In this context, localities affected by overtourism can apply the eleven strategies proposed by the UNWTO [9] to deal with this phenomenon: promote the dispersion of visitors inside and outside of the city; promote the dispersion of visitors based on time; stimulate new itineraries and attractions; review and adapt regulation; improve visitor segmentation; ensure that local communities benefit from tourism; create urban experiences for residents and visitors; improve the infrastructure and facilities of the city; communicate and involve local stakeholders; communicate and attract visitors; and establish supervision and response measures.
The present study has few boundaries as well. Only 3 dimensions and 10 main criteria for overtourism phenomenon analysis have been acknowledged. Further dimensions and criteria (intuitional, technology, industrial) have not been acknowledged here. Further, it is an analysis of the current situation, with which the results cannot be extrapolated to other populations or the same ones analysed in other periods. The calculation steps of the proposed model are accomplished by considering the preference of the decision-makers. Henceforth, it is important to achieve these evaluations prudently. Furthermore, the proposed framework findings are grounded on a sole area; therefore, numerous MCDM techniques like (grey cognitive maps, ANP, MABAC, and DEMATEL) can be practical to analyse the push factors of the overtourism phenomenon.

Supplementary Materials

The following is available online at https://www.mdpi.com/article/10.3390/su13116394/s1. Table S1: the questionnaire example.

Author Contributions

Data curation, R.B.; Formal analysis, R.B.; Funding acquisition, J.G.M.; Methodology, R.B.; Project administration, J.G.M.; Supervision, J.G.M.; Validation, J.G.M.; Writing—original draft, R.B.; Writing—review and editing, R.B. Both authors have read and agreed to the published version of the manuscript.

Funding

The research in this paper was funded by the project “Overtourism in Spanish coastal destinations. Tourism degrowth strategies an approach from the social dimension” (RTI2018–094844-B-C33) financed by the Spanish Ministry of Science, Innovation and Universities (National Plan for I+D+i), the Spanish State Research Agency, and the European Regional Development Fund (ERDF).

Institutional Review Board Statement

Not applicable.

Informed Consent Statement

Informed consent was obtained from all subjects involved in the study.

Data Availability Statement

Not applicable.

Acknowledgments

The authors would like to thank the Spanish Ministry of Science Innovation and Universities (National Plan for I+D+i), the Spanish State Research Agency, and the European Regional Development Fund (ERDF) for making a collaborative program for carrying out the research work.

Conflicts of Interest

The authors declare no conflict of interest.

Appendix A

Table A1. Experts Identification.
ExpertsExpertise
D M 1 Former head of tourism and promotion of Malaga city council and expert in tourism delegation with 30 years of work experience
D M 2 Dean of tourism faculty of the University of Malaga Spain with 25 years of work experience
D M 3 Area advisor of tourism delegation of Estepona city council with 17 years of work experience
D M 4 Coordinator of the tourism department of Fuengirola city council with 12 years of work experience
D M 5 Head of the tourism service of the territorial delegation of tourism ministry (JUNTA DE ANDALUCÍA) in Malaga with 41 years of work experience
D M 6 Expert supervisor of Marbella city tourism project with 25 years of work experience
D M 7 Managing director of tourism and planning in Costa del Sol area with 15 years of work experience
D M 8 Head of the tourism department of Mijas city council with 35 years of work experience
D M 9 Councillor delegate for tourism of Nerja city council 27 years of work experience
D M 10 Head of marketing section, promotion and tourism development of Malaga city council with 20 years of work experience
D M 11 Responsible for the tourism delegation of Torremolinos city council with 20 years of work experience
D M 12 Coordinator of the tourism area for foreigners of Benalmadena city council with 25 years of work experience

References

  1. UNWTO. World Tourism Remains at a Standstill as 100% of Countries Impose Restriction on Travel; UNWTO: Madrid, Spain, 2020; Available online: https://www.unwto.org/news/covid-19-world-tourism-remains-at-a-standstill-as-100-of-countries-impose-restrictions-on-travel?fbclid=IwAR3y5w-JHXr287yo4dd6c9h6nH8H3zW_xaWUUasmmUh0wN31RNxxIEWwK21Q (accessed on 10 November 2020).
  2. García López, R. ¿Cómo Será el Turismo Tras la Crisis del COVID-19? Aprende de Turismo. 2020. Available online: https://www.aprendedeturismo.org/recuperacion-turismo/ (accessed on 15 November 2020).
  3. UNWTO. La OMT Presenta Sus Directrices Globales Para Reabrir el Turismo; UNWTO: Madrid, Spain, 2020; Available online: https://www.unwto.org/es/news/omt-presenta-sus-directrices-globales-para-reabrir-el-turismo?fbclid=IwAR08JleZCfIMza2rFCIpTWk7-7rXE9PSqQBlZuVIOSDfx7KvRMNRZTu5kMo (accessed on 6 October 2020).
  4. Strielkowski, W. International Tourism and COVID-19: Recovery Strategies for Tourism Organisations. Preprints 2020, 2020030445. [Google Scholar] [CrossRef] [Green Version]
  5. Fuentes, M.M.; Navarro, J.R.; Informe GEM Andalucía. Situación del Emprendimiento en Andalucía Ante la Crisis del COVID-19. 2020. Available online: https://www.gem-spain.com/wp-content/uploads/2020/05/InformeGEM-COVID19_ANDALUCIA-.pdf (accessed on 10 July 2020).
  6. WTTC. Latest Research from WTTC Shows a 50% Increase in Jobs at Risk in Travel and Tourism; WTTC: London, UK, 2020; Available online: https://wttc.org/About/News/Press-Releases/latest-research-from-wttc-shows-an-increase-in-jobs-at-risk-in-travel-and-tourism (accessed on 3 January 2021).
  7. Breaking Travel News. IATA Predicts Huge Falls in Aviation Revenue. 2020. Available online: http://www.breakingtravelnews.com/news/article/iata-predicts-huge-falls-in-aviation-revenue/ (accessed on 2 January 2021).
  8. UNWTO. World Tourism Barometer May. With Special Focus on the Impact of COVID-19; UNWTO: Madrid, Spain, 2020. [Google Scholar]
  9. UNWTO. ‘Overtourism’? Understanding and Managing Urban Tourism Growth Beyond Perceptions; UNWTO: Madrid, Spain, 2018. [Google Scholar]
  10. UNWTO. Las Llegadas de Turistas Internacionales Suman 1.400 Millones dos Años Antes de las Previsions; UNWTO: Madrid, Spain, 2019; Available online: https://www.unwto.org/es/press-release/2019-01-21/las-llegadas-de-turistas-internacionales-suman-1400-millones-dos-anos-antes (accessed on 5 May 2020).
  11. Peeters, P.M.; Gössling, S.; Klijs, J.; Milano, C.; Novelli, M.; Dijkmans, C.H.; Eijgelaar, E.; Hartman, S.; Heslinga, J.; Isaac, R.; et al. Research for TRAN Committee-Overtourism: Impact and Possible Policy Responses; European Parliament, Directorate General for Internal Policies, Policy Department B: Structural and Cohesion Policies, Transport and Tourism: Brussels, Belgium, 2018. [Google Scholar]
  12. Dicks, B. Culture on Display: The Production of Contemporary Visitability; McGraw-Hill Education: London, UK, 2004. [Google Scholar]
  13. Zukin, S. Naked City: The Death and Life of Authentic Urban Places; Oxford University Press: Oxford, UK, 2010. [Google Scholar]
  14. Terhorst, P.; Erkuş-Öztürk, H. Urban tourism and spatial segmentation in the field of restaurants: The case of Amsterdam. Int. J. Cult. Tour. Hosp. Res. 2015, 9, 85–102. [Google Scholar] [CrossRef]
  15. Simancas, C.M.R.; Hernández, M.R.; Padrón, F.N. Turismo pos-COVID-19: Reflexiones, Retos y Oportunidades; Universidad de La Laguna: San Cristóbal de La Laguna, Spain, 2020. [Google Scholar]
  16. Spalding, M.; Burke, L.; Fyall, A. Covid-19: Implications for nature and tourism. Anatolia 2020, 32, 126–127. [Google Scholar] [CrossRef]
  17. World Economic Outlook. The Great Lockdown; International Monetary Fund: Washington, DC, USA, 2020; Available online: https://www.imf.org/en/Publications/WEO/Issues/2020/04/14/weo-april-2020 (accessed on 6 February 2020).
  18. Kaya, S.K. Evaluation of the Effect of COVID-19 on Countries’ Sustainable Development Level: A comparative MCDM framework. Oper. Res. Eng. Sci. Theory Appl. 2020, 3, 101–122. [Google Scholar] [CrossRef]
  19. Coccossis, H.; Mexa, A. The Challenge of Tourism Carrying Capacity Assessment: Theory and Practice; Routledge: Abingdon-on-Thames, UK, 2017. [Google Scholar]
  20. Chaney, D.; Seraphin, H. Covid-19 crisis as an unexpected opportunity to adopt radical changes to tackle overtourism. Anatolia 2020. [Google Scholar] [CrossRef]
  21. Mardani, A.; Jusoh, A.; Zavadskas, E.K.; Cavallaro, F.; Khalifah, Z. Sustainable and renewable energy: An overview of the application of multiple criteria decision making techniques and approaches. Sustainability 2015, 7, 13947–13984. [Google Scholar] [CrossRef] [Green Version]
  22. Zavadskas, E.K.; Govindan, K.; Antucheviciene, J.; Turskis, Z. Hybrid multiple criteria decision-making methods: A review of applications for sustainability issues. Econ. Res. 2016, 29, 857–887. [Google Scholar] [CrossRef] [Green Version]
  23. Ulutaş, A.; Karabasevic, D.; Popovic, G.; Stanujkic, D.; Nguyen, P.T.; Karaköy, Ç. Development of a novel integrated CCSD-ITARA-MARCOS decision-making approach for stackers selection in a logistics system. Mathematics 2020, 8, 1672. [Google Scholar] [CrossRef]
  24. Alptekin, G.I.; Büyüközkan, G. An integrated case-based reasoning and MCDM system for Web based tourism destination planning. Expert Syst. Appl. 2011, 38, 2125–2132. [Google Scholar] [CrossRef]
  25. Liu, C.H.; Tzeng, G.H.; Lee, M.H. Improving tourism policy implementation: The use of hybrid MCDM models. Tour. Manag. 2012, 33, 413–426. [Google Scholar] [CrossRef]
  26. Peng, K.H.; Tzeng, G.H. Strategies for Promoting Tourism Competitiveness Using a Hybrid MCDM Model. In Intelligent Decision Technologies; Springer: Berlin/Heidelberg, 2012; pp. 107–115. [Google Scholar]
  27. Liu, C.-H.; Tzeng, G.-H.; Lee, M.-H.; Lee, P.-Y. Improving metro-airport connection service for tourism development: Using hybrid MCDM models. Tour. Manag. Perspect. 2013, 6, 95–107. [Google Scholar] [CrossRef]
  28. Jafari-Moghadam, S.; Zali, M.R.; Sanaeepour, H. Tourism entrepreneurship policy: A hybrid MCDM model combining DEMATEL and ANP (DANP). Decis. Sci. Lett. 2017, 6, 233–250. [Google Scholar] [CrossRef]
  29. Koens, K.; Postma, A.; Papp, B. Is Overtourism Overused? Understanding the Impact of Tourism in a City Context. Sustainability 2018, 10, 4384. [Google Scholar] [CrossRef] [Green Version]
  30. Martín Martín, J.M.; Guaita Martínez, J.M.; Salinas Fernández, J.A. An Analysis of the Factors behind the Citizen’s Attitude of Rejection towards Tourism in a Context of Overtourism and Economic Dependence on This Activity. Sustainability 2018, 10, 2851. [Google Scholar] [CrossRef] [Green Version]
  31. Ocampo, L.; Ebisa, J.A.; Ombe, J.; Escoto, M.G. Sustainable ecotourism indicators with fuzzy Delphi method—A Philippine perspective. Ecol. Indic. 2018, 93, 874–888. [Google Scholar] [CrossRef]
  32. Stević, I.; Stević, S.R.; de Jesus Breda, Z.M. Application of MCDM Methods to Tourism Evaluation of Cultural Sites. In Cultural Urban Heritage; Springer: Cham, Switzerland, 2019; pp. 357–381. [Google Scholar]
  33. Simancas Cruz, M.; Peñarrubia Zaragoza, M.P. Analysis of the Accommodation Density in Coastal Tourism Areas of Insular Destinations from the Perspective of Overtourism. Sustainability 2019, 11, 3031. [Google Scholar] [CrossRef] [Green Version]
  34. Perkumienė, D.; Pranskūnienė, R. Overtourism: Between the Right to Travel and Residents’ Rights. Sustainability 2019, 11, 2138. [Google Scholar] [CrossRef] [Green Version]
  35. Oklevik, O.; Gössling, S.; Hall, C.M.; Jacobsen, J.K.S.; Grøtte, I.P.; McCabe, S. Overtourism, optimisation, and destination performance indicators: A case study of activities in Fjord Norway. J. Sustain. Tour. 2019, 27, 1804–1824. [Google Scholar] [CrossRef] [Green Version]
  36. Zhang, C.; Luo, L.; Liao, H.; Mardani, A.; Streimikiene, D.; Al-Barakati, A. A priority-based intuitionistic multiplicative UTASTAR method and its application in low-carbon tourism destination selection. Appl. Soft Comput. 2020, 88, 106026. [Google Scholar] [CrossRef]
  37. Yang, J.J.; Chuang, Y.-C.; Lo, H.-W.; Lee, T.-I. A Two-Stage MCDM Model for Exploring the Influential Relationships of Sustainable Sports Tourism Criteria in Taichung City. Int. J. Environ. Res. Public Health 2020, 17, 2319. [Google Scholar] [CrossRef] [Green Version]
  38. Aydoğan, E.K.; Özmen, M. Travel and Tourism Competitiveness of Economies Around the World Using Rough SWARA and TODIM Method. In Strategic Innovative Marketing and Tourism; Springer: Cham, Switzerland, 2020; pp. 765–774. [Google Scholar]
  39. Abellana, D.P.M.; Rivero, D.M.C.; Aparente, M.E.; Rivero, A. Hybrid SVR-SARIMA model for tourism forecasting using PROMETHEE II as a selection methodology: A Philippine scenario. J. Tour. Futur. 2021, 7, 78–97. [Google Scholar] [CrossRef]
  40. Yang, J.J.; Lo, H.W.; Chao, C.S.; Shen, C.C.; Yang, C.C. Establishing a Sustainable Sports Tourism Evaluation Framework with a Hybrid Multi-Criteria Decision-Making Model to Explore Potential Sports Tourism Attractions in Taiwan. Sustainability 2020, 12, 1673. [Google Scholar] [CrossRef] [Green Version]
  41. Ren, J. 2-Tuple DEMATEL for Complex Interrelationships Analysis: Barriers Identification, Cause-Effect Analysis and Policy Implications for Sustainable Tourism Industry. In Advanced Operations Management for Complex Systems Analysis; Springer: Cham, Switzerland, 2020; pp. 33–56. [Google Scholar]
  42. Ayhan, Ç.K.; Taşlı, T.C.; Özkök, F.; Tatlı, H. Land use suitability analysis of rural tourism activities: Yenice, Turkey. Tour. Manag. 2020, 76, 103949. [Google Scholar] [CrossRef]
  43. Genç, T.; Filipe, J. A fuzzy MCDM approach for choosing a tourism destination in Portugal. Int. J. Bus. Syst. Res. 2016, 10, 23. [Google Scholar] [CrossRef]
  44. Maymand, M.M.; Bazazzadeh, S.H.; Eghbal, R.A. hybrid MCDM model for identification and prioritization of the factors affecting shopping behaviour of foreign tourists. Int. J. Serv. Oper. Manag. 2017, 26, 294–317. [Google Scholar]
  45. Gonzalez, V.M.; Coromina, L.; Galí, N. Overtourism: Residents’ perceptions of tourism impact as an indicator of resident social carrying capacity—case study of a Spanish heritage town. Tour. Rev. 2018, 73, 277–296. [Google Scholar] [CrossRef]
  46. Séraphin, H.; Zaman, M.; Olver, S.; Bourliataux-Lajoinie, S.; Dosquet, F. Destination branding and overtourism. J. Hosp. Tour. Manag. 2019, 38, 1–4. [Google Scholar] [CrossRef]
  47. Cheer, J.M.; Milano, C.; Novelli, M. Tourism and community resilience in the Anthropocene: Accentuating temporal overtourism. J. Sustain. Tour. 2019, 27, 554–572. [Google Scholar] [CrossRef]
  48. Diaz-Parra, I.; Jover, J. Overtourism, place alienation and the right to the city: Insights from the historic centre of Seville, Spain. J. Sustain. Tour. 2020, 23, 1–8. [Google Scholar] [CrossRef]
  49. Bakir, M.; Akan, Ş.; Kiraci, K.; Karabasevic, D.; Stanujkic, D.; Popovic, G. Multiple-criteria approach of the operational performance evaluation in the airline industry: Evidence from the emerging markets. Rom. J. Econ. Forecast. 2020, 23, 149. [Google Scholar]
  50. Saaty, T.L. Decision making with the analytic hierarchy process. Int. J. Serv. Sci. 2008, 1, 83. [Google Scholar] [CrossRef] [Green Version]
  51. Saaty, T.L. Decision Making with Dependence and Feedback: Analytic Network Process; RWS Publications: Pittsburgh, PA, USA, 1996. [Google Scholar]
  52. Zavadskas, E.K.; Kaklauskas, A.; Sarka, V. The new method of multi-criteria complex proportional assessment of projects. Technol. Econ. Dev. Econ. 1994, 1, 131–139. [Google Scholar]
  53. Brans, J.P.; Vincke, P. A preference ranking organization method: The PROMETHEE method for MCDM. Manag. Sci. 1985, 31, 647–656. [Google Scholar] [CrossRef] [Green Version]
  54. Roy, B. Multicriteria for Decision Aiding; Kluwer: London, UK, 1996. [Google Scholar]
  55. Opricovic, S. Multicriteria Optimization of Civil Engineering Systems; Faculty of Civil Engineering: Belgrade, Serbia, 1998; pp. 5–21. [Google Scholar]
  56. Yoon, K.P.; Hwang, C.L. Multiple Attribute Decision Making: An Introduction; Sage Publications: Thousand Oaks, CA, USA, 1995; Volume 104. [Google Scholar]
  57. Gigović, L.; Pamučar, D.; Bajić, Z.; Milićević, M. The Combination of Expert Judgment and GIS-MAIRCA Analysis for the Selection of Sites for Ammunition Depots. Sustainability 2016, 8, 372. [Google Scholar] [CrossRef] [Green Version]
  58. Keršulienė, V.; Zavadskas, E.K.; Turskis, Z. Selection of rational dispute resolution method by applying new step-wise weight assessment ratio analysis (SWARA). J. Bus. Econ. Manag. 2010, 11, 243–258. [Google Scholar] [CrossRef]
  59. Zavadskas, E.K.; Turskis, Z. A new additive ratio assessment (ARAS) method in multi-criteria decision-making. J. Technol. Econ. Dev. Econ. 2010, 16, 159–172. [Google Scholar] [CrossRef]
  60. Brauers, W.K.M.; Zavadskas, E.K. The MOORA method and its application to privatization in a transition economy. Control. Cybern. 2006, 35, 445–469. [Google Scholar]
  61. Brauers, W.K.M.; Zavadskas, E.K. Project management by MULTIMOORA as an instrument for transition. Technol. Econ. Dev. Econ. 2010, 16, 5–24. [Google Scholar] [CrossRef]
  62. Vaidya, O.S.; Kumar, S. Analytic hierarchy process: An overview of applications. Eur. J. Oper. Res. 2006, 169, 1–29. [Google Scholar] [CrossRef]
  63. Wallenius, J.; Dyer, J.S.; Fishburn, P.C.; Steuer, R.E.; Zionts, S.; Deb, K. Multiple criteria decision making, multi-attribute utility theory: Recent accomplishments and what lies ahead. Manag. Sci. 2008, 54, 1336–1349. [Google Scholar] [CrossRef] [Green Version]
  64. Pamučar, D.; Vasin, L.; Lukovac, V. Selection of Railway Level Crossings for Investing in Security Equipment Using Hybrid DEMATEL-MARICA Model. In Proceedings of the XVI International Scientific-expert Conference on Railways, Railcon, Niš, Serbia, 9–10 October 2014; pp. 89–92. [Google Scholar]
  65. Pamučar, D.; Lukovac, V.; Božanić, D.; Komazec, N. Multi-Criteria FUCOM-MAIRCA Model for the Evaluation of Level Crossings: Case Study in the Republic of Serbia. Oper. Res. Eng. Sci. Theory Appl. 2018, 1, 108–129. [Google Scholar] [CrossRef]
  66. Almeida-García, F.; Fernández, M.; Ángeles, P.; Balbuena-Vázquez, A.; Cortés-Macias, R. Residents’ perceptions of tourism development in Benalmádena (Spain). Tour. Manag. 2016, 54, 259–274. [Google Scholar] [CrossRef] [Green Version]
  67. Butler, R. The concept of a tourist area cycle of evolution: Implications for management of resources. Can. Geogr. 1980, 24, 5–12. [Google Scholar] [CrossRef]
  68. Mowforth, M. Tourism, Terrorism and Climate Change—NATO Advanced Research Workshop on “Climate Change and Tourism: Assessement and Coping Strategies”. 2003. Available online: http://citeseerx.ist.psu.edu/viewdoc/download?doi=10.1.1.199.6550&rep=rep1&type=pdf (accessed on 5 February 2020).
  69. Annual Draft Budgetary Plans (DBPs) of Euro Area Countries 2020. Draft Budgetary Plan Spain. 2021. Available online: https://ec.europa.eu/info/sites/default/files/economy-finance/2020_dbp_es_es.pdf (accessed on 12 May 2021).
  70. Exceltur. Escenarios Evolutivos En El Tiempo Del Impacto Socio economico Del Covid Para El Sector Turistico Español; Exceltur: Madrid, Spain, 2020. [Google Scholar]
  71. Seetanah, B.; Juwaheer, T.; Lamport, M.; Rojid, S.; Sannassee, R.; Subadar, A. Does Infrastructure Matter in Tourism Development? Univ. Maurit. Res. J. 2011, 17, 89–108. [Google Scholar] [CrossRef] [Green Version]
  72. Mbaiwa, J.E. Poverty or riches: Who benefits from the booming tourism industry in Botswana? J. Contemp. Afr. Stud. 2017, 35, 93–112. [Google Scholar] [CrossRef]
  73. Işik, C.; Kasımatı, E.; Ongan, S. Analyzing the causalities between economic growth, financial development, international trade, tourism expenditure and/on the CO2 emissions in Greece. Energy Sources Part B Econ. Plan. Policy 2017, 12, 665–673. [Google Scholar] [CrossRef]
  74. Eyuboglu, K.; Uzar, U. The impact of tourism on CO2 emission in Turkey. Curr. Issues Tour. 2019, 23, 1631–1645. [Google Scholar] [CrossRef]
  75. Stacherzak, A.; Hełdak, M. Borough Development Dependent on Agricultural, Tourism, and Economy Levels. Sustainability 2019, 11, 415. [Google Scholar] [CrossRef] [Green Version]
  76. Nesticò, A.; Maselli, G. Sustainability indicators for the economic evaluation of tourism investments on islands. J. Clean. Prod. 2020, 248, 119217. [Google Scholar] [CrossRef]
  77. Lee, S.W.; Xue, K. A model of destination loyalty: Integrating destination image and sustainable tourism. Asia Pac. J. Tour. Res. 2020, 25, 393–408. [Google Scholar] [CrossRef]
  78. Ministry of Industry, Commerce and Tourism. Press Release on the Balance of the Tourism Sector. 2019. Available online: https://www.mincotur.gob.es/es-es/gabineteprensa/notasprensa/2018/documents/20190116%20balance%20turismo%202018.pdf (accessed on 14 August 2020).
  79. García, E.C.; Martos, J.C.M.; Valverde, F.N.; Humana, D.G.; de Granada. 30 años de programa LEADER en Andalucía. Apuntes al periodo 2014–2020. PH: Boletín del Instituto Andaluz del Patrimonio Histórico 2019, 27, 9–15. [Google Scholar]
  80. Frontur, Frontier Tourist Movement Survey. National Statistics Institute (INE). 2020. Available online: https://www.ine.es/dyngs/INEbase/es/operacion.htm?c=Estadistica_C&cid=1254736176996&menu=ultiDatos&idp=1254735576863 (accessed on 14 August 2020).
  81. Tourism and Planification of the Costa del Sol. Principle Conclusions. Touristic Balance Year 2018. 2018. Available online: https://www.google.es/url?sa=t&rct=j&q=&esrc=s&source=web&cd=1&cad=rja&uact=8&ved=2ahUKEwirgY38ndfmAhWh6uAKHVbwCfoQFjAAegQIBhAC&url=https%3A%2F%2Fwww.costadelsolmalaga.org%2Fbase%2Fdescargas%2F313524%2Fbalance-del-ano-turistico-2018&usg=AOvVaw1LD81zjPe1LB4Uf4dx8RTV (accessed on 15 August 2020).
  82. Exceltur. Renewal Plan for Spanish Tourist Destinations. Document of Bases. 2019. Available online: https://www.exceltur.org/wp-content/uploads/2014/10/PLAN-RENOVE-DESTINOS-TURÍSTICOS-ESPAÑOLES.pdf (accessed on 15 August 2020).
  83. Navarro, E.; Anton, S.; Ivars, J.; López, J.A.; Pazos, M.; León, C.J.; Prats, L. La Agenda de Investigación Para el Turismo en la Etapa Post-COVID. Respuesta a Una Crisis sin Precedentes—Instituto Universitario de Investigación de Inteligencia e Innovación Turística. 2020. Available online: http://www.i3t.uma.es/wpcontent/uploads/2020/06/AgendaInvestigacionCovid2_RedInvestigaTurismo_Jun2020.pdf (accessed on 21 August 2020).
  84. Cejudo, E.; Maroto, J.C.; Navarro, F. 30 años de programa LEADER en Andalucía. Apuntes al periodo 2014-2020. Revista PH Instituto Andaluz del Patrimonio Histórico 2019, 27, 9–15. [Google Scholar]
  85. Creswell, J.W. A Concise Introduction to Mixed Methods Research; SAGE publications: Thousand Oaks, CA, USA, 2014. [Google Scholar]
  86. Dickson, D.; Ford, R.; Deng, W.J. Fuzzy importance-performance analysis for determining critical service attributes. Int. J. Serv. Ind. Manag. 2008, 19, 252–270. [Google Scholar]
  87. Zadeh, L.A. Fuzzy sets. Inf. Control 1965, 8, 338–353. [Google Scholar] [CrossRef] [Green Version]
  88. Kaufman, A.; Gupta, M.M. Introduction to Fuzzy Arithmetic; Van Nostrand Reinhold Company: New York, NY, USA, 1991. [Google Scholar]
  89. Ulutas, A.; Shukla, N.; Kiridena, S.; Gibson, P. A utility-driven approach to supplier evaluation and selection: Empirical validation of an integrated solution framework. Int. J. Prod. Res. 2016, 54, 1554–1567. [Google Scholar] [CrossRef] [Green Version]
  90. Chang, D.Y. Applications of the extent analysis method on fuzzy AHP. Eur. J. Oper. Res. 1996, 95, 649–655. [Google Scholar] [CrossRef]
  91. Golden, B.L.; Wasil, E.A.; Harker, P.T. The Analytic Hierarchy Process: Applications and Studies; Springer: Berlin/Heidelberg, Germany, 1989. [Google Scholar]
  92. Boral, S.; Howard, I.; Chaturvedi, S.K.; McKee, K.; Naikan, V.N. A novel hybrid multi-criteria group decision making approach for failure mode and effect analysis: An essential requirement for sustainable manufacturing. Sustain. Prod. Consum. 2020, 21, 14–32. [Google Scholar] [CrossRef]
  93. Chiou, H.K. Fuzzy hierarchical evaluation with grey relation model of green engineering for industry. Int. J. Fuzzy Syst. 2001, 3, 466–475. [Google Scholar]
  94. Dinçer, H.; Yüksel, S. Analysis of the Customer-Based Efficiency at Workplace for Tourism Industry Using House of Quality. In Handbook of Research on Positive Organizational Behavior for Improved Workplace Performance; IGI Global: Hershey, PA, USA, 2020; pp. 310–329. [Google Scholar]
  95. Azizi, K.E.; Rangzan, K.; Kabolizadeh, M.; Taghizadeh, A. Ranking of Tourism Village Locator with Environmental Criteria with FTOPSIS Case Study of Shoush. J. Geogr. Sci. 2019, 18, 165–181. [Google Scholar]
  96. Hatefi, S.M.; Koohi Habibi, N.; Abdollahi, E. Evaluating investment potential tourism centers using integrated model of fuzzy Shannon’s entropy and fuzzy ARAS method. Tour. Manag. Stud. 2019, 14, 269–302. [Google Scholar]
  97. Urosevic, S.; Karabasevic, D.; Stanujkic, D.; Maksimovic, M. An approach to personnel selection in the tourism industry based on the swara and the waspas methods. Econ. Comput. Econ. Cybern. Stud. Res. 2017, 51, 75–88. [Google Scholar]
  98. Keshavarz Ghorabaee, M.; Zavadskas, E.K.; Turskis, Z.; Antucheviciene, J. A new combinate distance-based assessment (CODAS) method for multi-criteria decision-making. Econ. Comput. Econ. Cybern. Stud. Res. 2016, 50, 25–44. [Google Scholar]
  99. Moghassem, A.R. Comparison among two analytical methods of multi-criteria decision making for appropriate spinning condition selection. World Appl. Sci. J. 2013, 21, 784–794. [Google Scholar]
  100. Skinner, H. Place Branding—The Challenges of Getting It Right: Coping with Success and Rebuilding from Crises. Tour. Hosp. 2021, 2, 173–189. [Google Scholar]
  101. Montanari, A. Covid-19 as an opportunity to tackle the phenomenon of overtourism in European historic centres: The case of Rome. Capitale Culturale 2020, 11, 285–305. [Google Scholar]
  102. Romagosa, F. The COVID-19 crisis: Opportunities for sustainable and proximity tourism. Tour. Geogr. 2020, 22, 690–694. [Google Scholar] [CrossRef]
  103. Eckert, C.; Zacher, D.; Pechlaner, H.; Namberger, P.; Schmude, J. Strategies and measures directed towards overtourism: A perspective of European DMOs. Int. J. Tour. Cities 2019, 5, 639–655. [Google Scholar] [CrossRef]
  104. Gössling, S.; Higham, J. The low-carbon imperative: Destination management under urgent climate change. J. Travel Res. 2020. [Google Scholar] [CrossRef]
  105. Rivera García, J.; Pastor Ruíz, R. ¿Hacia un Turismo Más Sostenible Tras el Covid-19? Percepción de las Agencias de Viajes Españolas. Gran Tour, Revista de Investigaciones Turísticas, 21. 2020. Available online: http://eutm.es/grantour/index.php/grantour/article/view/153 (accessed on 15 May 2021).
  106. Pons, G.; Borchers-Gasnier, M.A.; Leturcq, P. Greener After: A Green Recovery for a Post-COVID-19 World. SAIS Rev. Int. Aff. 2020, 1, 69–79. [Google Scholar] [CrossRef]
Figure 1. Study’s geographical location (Malaga, Spain).
Sustainability 13 06394 g001
Figure 2. Accommodation spaces density in Malaga province.
Sustainability 13 06394 g002
Figure 3. Hierarchical framework of overtourism assessment.
Sustainability 13 06394 g003
Figure 4. Fuzzy membership functions of the FAHP method.
Sustainability 13 06394 g004
Figure 5. Fuzzy Membership functions of the FMAIRCA method.
Sustainability 13 06394 g005
Figure 6. Municipalities ranking by applying diverse fuzzy MCDM methods.
Sustainability 13 06394 g006
Figure 7. Sensitivity analysis of the municipalities ranking through criteria weights alteration.
Sustainability 13 06394 g007aSustainability 13 06394 g007bSustainability 13 06394 g007c
Table 1. Summary of prior works.
AuthorsMethodsAbstract
[24]CBR, AHP.‘Propose an integrated case-based reasoning and MCDM system for web-based tourism destination planning.’
[25]DEMATEL, NRM, DANP, VIKOR.‘Improve tourism policy implementation by the use of hybrid MCDM model.’
[26]TDC, DEMATEL, DANP.‘Adopt strategies for promoting tourism competitiveness using a hybrid MCDM model.’
[27]DEMATEL, DANP, VIKOR.‘Improve metro–airport connection service for tourism development by using hybrid MCDM models.’
[28]DEMATEL, ANP.‘Propose a hybrid MCDM model for improving the tourism entrepreneurship policy.’
[29]Qualitative investigation.‘Analyse the overtourism problem by the use of qualitative investigation among 80 stakeholders in 13 European cities.’
[30]Descriptive statistical methods.‘Analyse tourism data in Barcelona to detect the elements behind the popular aversion of tourism.’
[31]Fuzzy set theory, DELPHI‘Adopt a fuzzy Delphi method in establishing sustainable ecotourism indicators. The fuzzy set theory for addressing vagueness and uncertainty of judgments.’
[32]SAW, TOPSIS.‘Application of MCDM methods to tourism evaluation of cultural sites.’
[33]Observation method.‘Identify the weaknesses of tourist accommodation density as a parameter of overtourism in Spain.’
[34]Integrative review.‘Examine the overtourism issue between the right of the tourists’ and residents’ rights.’
[35]Descriptive statistical methods.‘Determining the development of local, small-scale, and ideally more sustainable experiences can contribute to economic growth without necessarily increasing numbers of arrivals.’
[36]MCDM, UTASTAR.‘Apply a priority-based intuitionistic multiplicative UTASTAR method and its application in low-carbon tourism destination selection.’
[37]Bayesian BWM, Rough DEMATEL‘Develop a novel two-stage multi-criteria decision-making (MCDM) model to incorporate the concept of sustainable development into sports tourism.’
[38]TODIM, Rough SWARA‘Apply a hybrid MCDM method, which comprises rough SWARA and TODIM, to help policymakers and stakeholders to gain exact data about tourism and travel sector.’
[39]SVR-SARIMA; PROMETEE II‘Select the best forecasting model for long-term tourism demand by using hybrid MCDM approach.’
[40]Bayesian BWM, VIKOR‘Consider the Bayesian BWM and VIKOR methods to discuss the importance of sustainable sport tourism and recommend potential sport tourism attractions.’
[41]2-Tuple DEMATEL‘Propose a modified DEMATEL approach to examine the cause–effect relationships among the barriers hindering the tourism industry development and assess the critical barriers.’
[42]ELECTRE‘Conduct the ELECTRE method to facilitate the land-use suitability analysis for rural tourism.’
Table 2. Description of the set of criteria for overtourism assessment.
DimensionCriteriaDescription
Environmental C1CO2 emission/marine pollution
C 11
It shows the number of tourists’ arrival that participates more in environmental degradation. High level of carbon dioxide emission and marine pollution. A sustainable tourism strategy should be established to ensure that the region’s natural ecological space is not damaged by tourism activities.
Inorganic waste
C 12 .
It applies the consumption of inorganic waste in touristic events that hinders the environmental and ecological balance of the area. Inorganic waste should be managed and controlled in type and amount.
Natural resources usage
C 13
It involves the harsh use of natural resources, which shows some reverse effect. Tourism activities must take preventive measures and be organised in an environmentally friendly mode to ensure the conservation, preservation, and sustainability of the natural resources.
Social C 2 Safety and security
C 21
It encompasses the negative impacts of the tourism perceived by the local population like insecurity, noises, alcohol and drug consumption. Thus, the capability of local law to safeguard the safety and security of both citi-zens and tourists is essential.
Accessibility/facilities to touristic sites
C 22
This multidimensional aspect entails the improvement of the transportation system, facilitate travellers and residents to arrive at all destinations safely, and permit the local population to access touristic spaces.
Infrastructure degradation
C 23
Some existing touristic buildings and facilities often cause damages and degradation to cities’ infrastructure. Therefore, sustainable actions of the tourism sector should be implemented and build ecologic constructions to maintain the original look of the region.
Culture identity loss
C 24
As the tourism demand inclines, the loss of cultural identity and traditional activities in the local area becomes higher. This would be observed negatively by the local community and may create an intensive feeling of rejection and change the citizens’ attitudes towards tourism. Thus, this impact may lead to a loss of community moral values, pride, and a loss of local cultural identity.
Economic C 3 Inflation/low Salaries
C 31
Inflation and low salaries are strongly related to tourism activities in the local area. Inflation of prices and decrease of the handiness of some goods, services, and factors of production aimed at citizens. The youth are likely vulnerable to low wages, discrimination in job opportunities, and employment quality.
Infrastructures costs
C 32
Potential tourism capital investments are dedicated to infrastructures’ restructuration. These expenses create a strong challenge and may cause an imbalance in budget handling.
Economic dependence on tourism sector
C 33
Rely heavily on the tourism sector to generate incomes more than any other sector and is strongly impacted by seasonality and the degradation of other sectors of employment.
Table 3. Description of the linguistic terms for importance criteria evaluation [90].
Fuzzy NumberLinguistic TermsCodeMembership Function
1Equally Important(EI)(1,1,1)
1Moderately Important(MI)(2/3,1,3/2)
2Important(I)(3/2,2,5/2)
3More Important(MI)(5/2,3,7/2)
4Absolutely Important(AI)(7/2,4,9/2)
Table 4. Random Index Values [91].
N123456789
R I ( n ) 000.580.91.121.241.321.411.45
Table 5. Description of Linguistic Terms for Importance of alternatives assessment [93].
Fuzzy NumberLinguistic TermsCodeMembership Function
1Equally Important(EI)(1,1,3)
3Moderately Important(MI)(1,3,5)
5Important(I)(3,5,7)
7More Important(MI)(5,7,9)
9Absolutely Important(AI)(7,9,9)
Table 6. Fuzzy pairwise comparison matrix.
CriteriaC1C2C3
Criteria
C1(1, 1, 1)(1.5, 2, 1.5)(2.5, 3, 3.5)
C2(0.4, 0.5, 0.667)(1, 1, 1)(1.5, 2, 2.5)
C3(0.286, 0.333, 0.4)(0.4, 0.5, 0.667)(1, 1, 1)
Table 7. Fuzzy aggregated decision matrix.
CriteriaC1C2C3
Criteria
C10.4450.5290.604
C20.2420.3090.384
C30.1310.1620.207
Table 8. Hierarchical structure of local and global weights.
DimensionsLocal WeightsCriteria Local WeightsGlobal Weights
Environmental (C1)0.535CO2 emissions/marine pollution (C11)0.3980.213
Inorganic waste (C12)0.2050.110
Natural resources usage (C13)0.3980.213
Social (C2)0.299Safety & security (C21)0.2520.075
Accessibility/facilities to touristic sites (C22)0.2520.075
Infrastructure degradation (C23)0.2480.074
Culture identity loss (C24)0.2480.074
Economic (C3)0.166Inflation & low salaries (C31)0.2520.042
Infrastructures accessibility costs (C32)0.2520.042
Economic dependence on tourism sector (C33)0.4960.082
Table 9. Fuzzy weights of the FAHP method.
Global WeightsDecision-MakersFuzzy Weights
DM1DM2DM3DM4DM5DM6DM7DM8DM9DM10DM11DM12
C110.2130.0830.1970.2180.1840.3670.2650.1080.0860.1440.2500.3430.185
C120.1100.0840.2000.1750.1840.1580.1100.2390.0690.1440.1120.0940.131
C130.2130.0840.2000.2730.1840.1010.1710.0940.1100.1410.0970.1480.142
C210.0750.0510.0500.0770.1030.0430.0490.0500.0640.0980.2250.0410.068
C220.0750.0510.0410.0290.0610.0420.0950.0420.0640.0980.0330.0190.049
C230.0740.0510.0410.0290.0660.0650.0580.0480.0770.0970.0750.0250.055
C240.0740.0990.0700.0320.0930.0280.0420.0300.1080.0970.0830.0760.063
C310.0420.1640.1050.0900.0500.0790.0300.2110.1060.0600.0690.1360.082
C320.0420.1670.0680.0360.0320.0520.1100.0940.0680.0600.0370.0540.060
C330.0820.1640.0290.0410.0400.0640.0710.0820.2470.0600.0190.0620.063
Table 10. Assessment matrix of the alternatives regarding D M 1 .
C11C12C13C21C22C23C24C31C32C33
A 1 IMIEIIIMIMIMIEIMI
A 2 MIMIEIMIAIMIAIMIEIAI
A 3 IMIEIMIMIMIMIMIEIAI
A 4 MIIIMIMIMIMIIIMI
A 5 IMIEIIMIIMIMIEIAI
A 6 IMIEIMIIMIIMIEIMI
A 7 IMIEIMIIMIMIMIEIMI
A 8 MIEIEIIMIMIIMIEII
Table 11. Initial decision matrix.
C11C12C13C21C22C23C24C31C32C33
A 1 (3, 5, 7)(1, 3, 5)(1, 1, 3)(3, 5, 7)(3, 5, 7)(1, 3, 5)(5, 7, 9)(1, 3, 5)(1, 1, 3)(5, 7, 9)
A 2 (5, 7, 9)(1, 3, 5)(1, 1, 3)(5, 7, 9)(7, 9, 9)(5, 7, 9)(7, 9, 9)(1, 3, 5)(1, 1, 3)(7, 9, 9)
A 3 (3, 5, 7)(1, 3, 5)(1, 1, 3)(5, 7, 9)(5, 7, 9)(5, 7, 9)(5, 7, 9)(1, 3, 5)(1, 1, 3)(7, 9, 9)
A 4 (5, 7, 9)(3, 5, 7)(3, 5, 7)(5, 7, 9)(5, 7, 9)(1, 3, 5)(5, 7, 9)(3, 5, 7)(3, 5, 7)(5, 7, 9)
A 5 (3, 5, 7)(1, 3, 5)(1, 1, 3)(3, 5, 7)(5, 7, 9)(3, 5, 7)(5, 7, 9)(1, 3, 5)(1, 1, 3)(7, 9, 9)
A 6 (3, 5, 7)(1, 3, 5)(1, 1, 3)(1, 1, 3)(3, 5, 7)(1, 3, 5)(3, 5, 7)(1, 3, 5)(1, 1, 3)(5, 7, 9)
A 7 (3, 5, 7)(1, 3, 5)(1, 1, 3)(1, 1, 3)(3, 5, 7)(1, 3, 5)(1, 3, 5)(1, 3, 5)(1, 1, 3)(5, 7, 9)
A 8 (1, 3, 5)(1, 1, 3)(1, 1, 3)(3, 5, 7)(5, 7, 9)(5, 7, 9)(3, 5, 7)(1, 3, 5)(1, 1, 3)(3, 5, 7)
Table 12. Fuzzy aggregated performance decision matrix.
C11C12C13C21C22
A 1 3.3655.5887.6633.8206.1197.8252.8594.6846.7063.3875.5137.5584.6206.8488.218
A 2 3.8206.1197.8253.8206.1197.8252.7034.4926.7064.0416.0848.1055.1747.3968.570
A 3 3.3175.5487.5043.8206.1197.8252.7034.4926.7062.5734.8526.9484.2476.4318.218
A 4 4.3686.5678.2184.5536.7998.0483.5345.6707.7184.7236.7588.6314.8576.9018.631
A 5 3.1785.3957.3493.9285.7027.4992.5904.3686.5673.1585.4687.4514.2476.4318.218
A 6 2.5904.7876.8533.4615.7067.6632.2654.0706.2532.3484.6506.7562.0544.3336.433
A 7 2.5904.7876.8533.3175.0637.1921.9683.8446.0372.7625.0957.0952.7625.0957.095
A 8 2.6854.9907.0953.6115.3557.4991.7213.5825.7492.5734.8526.9483.0915.2837.349
C23C24C31C32C31
A 1 2.3294.5556.5254.4276.6598.0482.8205.0637.1462.8203.8476.2896.0848.1059.000
A 2 2.8405.2037.0954.5536.7998.0482.8205.0637.1462.9003.9286.2896.6188.6319.000
A 3 2.4314.6846.6633.6845.8707.5582.8205.0637.1462.9003.9286.2896.4358.4529.000
A 4 2.2324.4296.3903.5825.7497.5583.1785.3957.3494.4606.5258.2775.1377.1978.631
A 5 2.1714.3376.3903.6085.9087.5043.1785.3957.3493.5345.1747.3966.6188.6319.000
A 6 1.7323.5345.6702.0373.8735.9542.9005.1707.1462.2503.4355.8235.7537.7739.000
A 7 1.3163.4095.4392.9005.1707.1462.7805.0276.9982.7033.7416.1596.0848.1059.000
A 8 1.9814.1566.2132.4464.6216.5712.7034.9236.9982.7033.7416.1594.7186.8048.277
Table 13. Fuzzy normalised decision matrix.
C11C12C13C21C22
A 1 0.1210.2010.2760.1300.2080.2670.1210.1980.2840.1220.1990.2720.1510.2250.269
A 2 0.1380.2200.2820.1300.2080.2670.1140.1900.2840.1460.2190.2920.1700.2430.281
A 3 0.1190.2000.2700.1300.2080.2670.1140.1900.2840.0930.1750.2500.1390.2110.269
A 4 0.1570.2360.2960.1550.2320.2670.1500.2400.3270.1700.2440.3110.1590.2260.283
A 5 0.1140.1940.2650.1340.1940.2550.1100.1850.2780.1140.1970.2690.1390.2110.269
A 6 0.0930.1720.2470.1180.1940.2610.0960.1720.2650.0850.1680.2440.0670.1420.211
A 7 0.0930.1720.2470.1130.1720.2450.0830.1630.2560.1000.1840.2560.0910.1670.233
A 8 0.0970.1800.2550.1230.1820.2550.0730.1520.2430.0930.1750.2500.1010.1730.241
C23C24C31C32C31
A 1 0.1030.1640.2350.1580.2380.2870.1070.1930.2720.1170.1590.2600.1610.2150.238
A 2 0.1260.1770.2420.1630.2430.2870.1070.1930.2720.1200.1630.2600.1750.2290.238
A 3 0.1080.1980.2820.1320.2100.2700.1070.1930.2720.1200.1630.2600.1710.2240.238
A 4 0.0990.1600.2300.1280.2050.2700.1210.2060.2800.1850.2700.3430.1360.1910.229
A 5 0.0960.1420.2100.1290.2110.2680.1210.2060.2800.1460.2140.3060.1750.2290.238
A 6 0.0770.1570.2520.0730.1380.2130.1100.1970.2720.0930.1420.2410.1520.2060.238
A 7 0.0580.1220.1940.1040.1850.2550.1060.1920.2670.1120.1550.2550.1610.2150.238
A 8 0.0880.1580.2370.0870.1650.2350.1030.1880.2670.1120.1550.2550.1250.1800.219
Table 14. Fuzzy theoretical ponder decision matrix.
C11C12C13C21C22
A 1 0.02310.01640.01770.00850.0061
A 2 0.02310.01640.01770.00850.0061
A 3 0.02310.01640.01770.00850.0061
A 4 0.02310.01640.01770.00850.0061
A 5 0.02310.01640.01770.00850.0061
A 6 0.02310.01640.01770.00850.0061
A 7 0.02310.01640.01770.00850.0061
A 8 0.02310.01640.01770.00850.0061
C23C24C31C32C31
A 1 0.00680.00780.01030.00760.0079
A 2 0.00680.00780.01030.00760.0079
A 3 0.00680.00780.01030.00760.0079
A 4 0.00680.00780.01030.00760.0079
A 5 0.00680.00780.01030.00760.0079
A 6 0.00680.00780.01030.00760.0079
A 7 0.00680.00780.01030.00760.0079
A 8 0.00680.00780.01030.00760.0079
Table 15. Fuzzy actual ponder decision matrix.
C11C12C13C21C22
A 1 0.018530.013120.014190.006810.00481
A 2 0.018200.013120.014290.006630.00471
A 3 0.018590.013120.014290.007020.00486
A 4 0.017820.012850.013540.006440.00476
A 5 0.018720.013240.014380.006850.00486
A 6 0.019190.013300.014610.007090.00527
A 7 0.019190.013530.014800.006960.00513
A 8 0.019040.013360.015000.007020.00507
C23C24C31C32C31
A 1 0.005710.006050.008370.006220.00630
A 2 0.005610.006030.008370.006200.00623
A 3 0.005530.006240.008370.006200.00625
A 4 0.005740.006270.008250.005570.00646
A 5 0.005830.006250.008250.005900.00623
A 6 0.005760.006730.008340.006370.00635
A 7 0.006010.006420.008400.006260.00630
A 8 0.005760.006570.008420.006260.00654
Table 16. Total gap matrix.
Municipalities Criteria   Function   Values   Q i Ranking of Municipalities by a Proposed Hybrid Methodology
Fuengirola (A1)0.090136
Torremolinos (A2)0.089397
Benalmadena (A3)0.090495
Malaga capital (A4)0.087698
Marbella (A5)0.090504
Estepona (A6)0.093012
Mijas (A7)0.092993
Nerja (A8)0.093051
Table 17. Defuzzied gap values and ranking of municipalities.
C11C12C13C21C22
A 1 0.00280.00460.00640.00210.00340.00440.00210.00350.00500.00100.0020.0020.00090.00140.0016
A 2 0.00320.00510.00650.00210.00340.00440.00200.00340.00500.00120.0020.0020.00100.00150.0017
A 3 0.00280.00460.00620.00210.00340.00440.00200.00340.00500.00080.0010.0020.00090.00130.0016
A 4 0.00360.00550.00680.00250.00380.00440.00260.00430.00580.00140.0020.0030.00100.00140.0017
A 5 0.00260.00450.00610.00220.00320.00420.00190.00330.00490.00100.0020.0020.00090.00130.0016
A 6 0.00220.00400.00570.00190.00320.00430.00170.00310.00470.00070.0010.0020.00040.00090.0013
A 7 0.00220.00400.00570.00190.00280.00400.00150.00290.00450.00080.0020.0020.00060.00100.0014
A 8 0.00220.00410.00590.00200.00300.00420.00130.00270.00430.00080.0010.0020.00060.00110.0015
C11C12C13C21C22
A 1 0.00070.00110.00160.00120.00190.00220.00110.00200.00280.00090.00120.00200.00130.00170.0019
A 2 0.00090.00120.00170.00130.00190.00220.00110.00200.00280.00090.00120.00200.00140.00180.0019
A 3 0.00070.00140.00190.00100.00160.00210.00110.00200.00280.00090.00120.00200.00140.00180.0019
A 4 0.00070.00110.00160.00100.00160.00210.00120.00210.00290.00140.00200.00260.00110.00150.0018
A 5 0.00070.00100.00140.00100.00170.00210.00120.00210.00290.00110.00160.00230.00140.00180.0019
A 6 0.00050.00110.00170.00060.00110.00170.00110.00200.00280.00070.00110.00180.00120.00160.0019
A 7 0.00040.00080.00130.00080.00140.00200.00110.00200.00270.00080.00120.00190.00130.00170.0019
A 8 0.00060.00110.00160.00070.00130.00180.00110.00190.00270.00080.00120.00190.00100.00140.0017
Table 18. Comparison of the proposed model with other existing MCDM methods.
MunicipalitiesProposed ModelFARASFMAIRCAFTOPSISFVIKORFWASPAS
A1666466
A2777777
A3555654
A4888888
A5444544
A6213333
A7321111
A8132222
Table 19. Fuzzy MCDM approaches ranking correlation.
FARASFMAIRCAFTOPSISFVIKORFWASPASAverage
Spearman’s rank correlation coefficient0.92860.92860.85710.92860.92260.9131
Table 20. Criteria weights coefficient distribution.
CriteriaOriginal WeightsRelative Weights with Variation of 10%Relative Weights with Variation of 30%Relative Weights with Variation of 50%Relative Weights with Variation of 70%
C110.1850.2030.2400.0920.055
C120.1310.1440.0920.1970.039
C130.1420.1560.0990.0710.241
C210.0680.0740.0880.1020.115
C220.0490.0540.0640.0730.083
C230.0550.0600.0710.0820.093
C240.0630.0690.0810.0940.019
C310.0820.0910.1070.1240.140
C320.0600.0660.0790.0910.103
C330.0630.0700.0820.0950.108
C110.1850.2030.2400.0920.055
Publisher’s Note: MDPI stays neutral with regard to jurisdictional claims in published maps and institutional affiliations.

