Abstract
In closed-loop supply chains (CLSC), manufacturers, retailers, and recyclers perform their duties. Due to the asymmetry of information among enterprises, it is difficult for them to maximize efficiency and profits. To maximize the efficiency and profit of the CLSC, this study establishes five cooperation models of CLSC under the government‘s reward–penalty mechanism. We make decisions on wholesale prices, retail prices, transfer payment prices, and recovery rates relying on the Stackelberg game method and compare the optimal decisions. This paper analyzes the impact of the government reward-penalty mechanism on optimal decisions and how members in CLSC choose partners. We find that the government’s reward-penalty mechanism can effectively increase the recycling rate of used products and the total profit of the closed-loop supply chain. According to the calculation results of the models, under the government’s reward-penalty mechanism, the cooperation can improve the CLSC’s used products recycling capacity and profitability. In a supply chain, the more members participate in the cooperation, the higher profit the CLSC obtain. However, the cooperation mode of all members may lead to monopoly, which is not approved by government and customers.
1. Introduction
With the increase of the population, the advancement of industrialization and the rise of global carbon emissions, the deteriorating air quality and the increasingly severe greenhouse effect have brought unprecedented challenges to human survival. In addition, With the advancement of technology and the improvement of people’s living standards, the updating speed of electronic products is getting faster and faster. A large number of waste electronic and electrical equipment (WEEE) have been produced, including mobile phones, computers, home appliances, and so on. They contain a lot of toxic chemicals, which not only cause serious pollution to the environment but also threaten human health and survival. Facing the severe environmental problems, many countries have attached great importance to them, successively promulgating relevant laws and regulations, guiding enterprises to recycle waste products, and advocating the development of a circular economy. In order to ensure that the recycling and reuse of WEEE can meet the various requirements and technical indicators, the US government formulated the Solid Waste Disposal Act as early as 1976, and issued a series of laws and regulations in 2002 to further specify the qualifications of personnel engaged in the recycling of WEEE and the ratio of recycling should be achieved. Japan also began to implement the Household Appliances Recycling Law in 2001, which clearly stipulates that home appliance manufacturers must bear the obligation to recycle and use home appliances. Waste Electronic Products Recycling Law implemented in the European Union, in 2003, requires the original manufacturer to be responsible for recycling and processing waste electrical and electronic products entering the European Union. The Chinese government drew on the legislation and practical experience of waste product recycling in developed countries, such as the European Union, the US, and Japan, promulgating the Regulations on the Management of Waste Electrical and Electronic Equipment Recycling and Processing in 2011. These regulations establish systems for the centralized treatment of waste electrical and electronic products, the qualification license for waste electrical and electronic product disposal, the waste electrical and electronic product disposal fund, and the development plan for the disposal of waste electrical and electronic products. However, these regulations are full of punitive clauses, and it is difficult to mobilize enterprises to actively assume their social responsibilities.
Adding recycling and remanufacturing links to the traditional supply chain constitutes a closed-loop supply chain (CLSC). CLSC is a very appropriate solution of disposing of WEEE, it can reduce production costs and increase enterprises profits. For example, Canon and Xerox have saved millions of dollars in costs due to recycling and remanufacturing. For nearly 30 years, Canon has been implementing a toner cartridge recycling program, which saves costs by reducing the consumption of natural resources in the production of its products [1]. Xerox has implemented closed-loop supply chain management so that more than 65% of ink cartridges can be effectively recycled and remanufactured, which not only reduces the rate of waste generation but also saves manufacturing costs [2]. On the other hand, remanufacturing can help reduce carbon emissions and protect the environment. For example, Apple has improved the recyclability of products through continuous technological innovation, and established an online recycling platform to speed up recycling efficiency. It has reduced carbon emissions, per dollar of revenue, by 15.4% through CLSC [3]. JD.com is one of the B2C online retailers with the largest transaction volume and revenue in China. It cooperates with many mobile phone manufacturers to recycle used mobile phones online. It helps reduce environmental pollution by reducing the amount of discarded mobile phones [4]. In addition, increasing jobs in CLSC contributes to social stability and improves social welfare. Recently, some researchers have proposed to increase rewards, on the basis of government penalty, to further increase the proportion of enterprises recycling waste products and remanufacturing, which will help social stability and improve social welfare. This is the so-called government reward-penalty mechanism (RPM) [5,6,7]. Generally, we regard the overall closed-loop, composed of three main bodies of a manufacturer, a retailer, and a third-party recycler, as a complete CLSC. With the introduction of government RPM, enterprises in the supply chain are bound to seek cooperation to obtain the largest government rewards. As the market leader in CLSC, the manufacturer should make cooperative decisions in theory. That is, the manufacturer chooses to reach a cooperation agreement with the retailer or the third-party recycler. Therefore, some scholars have begun to pay attention to the cooperation strategy of manufacturers. However, some scholars have found that any two in the closed-loop supply chain have the idea of aligning with each other [8,9]. Many manufacturers, such as HP, Xiaomi, BMW, etc., are responsible for recycling old products by acquiring third-party recyclers or establishing corresponding subsidiaries, which is equivalent to cooperation between manufacturers and third-party recyclers.
Many large related companies such as Amazon and Alibaba are exploring the integration of supply chains to maximize profits [10], but we still don’t know what the final result will be. In this paper, we will explore the following questions:
- (1)
- Under different cooperation modes, how does the government’s RPM affect each member of the CLSC make optimal decisions?
- (2)
- Whether the more members cooperate in the supply chain, the more profits the supply chain will obtain? Whether the cooperation of all members in the CLSC is the best one?
- (3)
- Is the best cooperative model the most-worthy of promotion?
The main contributions of this paper lie in four aspects. Firstly, this paper is the first to investigate the government’s RPM in CLSC with different cooperation models. Secondly, we identify the optimal cooperation model and the optimal decision made by firms under government’s RPM. Finally, we analyze whether the government allows the existence of the optimal cooperation model.
This paper proceeds as follows. We provide a literature review related our paper in Section 2. Section 3 describes the problem. Section 4 analyzes five models and makes the optimal decisions. We compare the optimal decisions of different cooperation models in Section 5. Section 6 makes the numerical study. Section 7 is about discussion. We compare our results with the results of other related studies, and discussing the results of this research in the actual industry. Section 8 concludes the paper and shows directions for further research.
2. Literature Review
Our work is related to two aspects. The first one is about pricing research in CLSC, and the other one is about the impact of government financial intervention on the decision of CLSC.
Pricing research based on CLSC refers to the study of the pricing strategy of each node enterprise in the supply chain system and the corresponding coordination mechanism from the perspective of the entire CLSC system. Based on a CLSC composed of a monopolistic manufacturer and a retailer, Savaskan [11] applied game theory methods to study the pricing decision and the manufacturer’s selection of recycling channels, and concluded that in a decentralized decision-making CLSC, the retailer’s recycling channel has the largest total profit. Ullah [12] studies the optimal remanufacturing strategy and reusable packaging capacity under the conditions of random demand and random return rate. The results show that the hybrid strategy is the best choice for single retailer and multi retailers. Wang et al. [13,14,15,16,17,18,19] studies the decision-making of CLSC under different conditions, such as corporate social responsibility, revenue sharing, retail competition, manufactory competition and so on. Sazvar et al. [20,21,22,23,24,25,26] apply CLSC to specific industries and make optimal decisions in actual life. Research scope involves Pharmaceutical supply chain, seafood, vehicle, and so on.
Many scholars have paid attention to the research of recycling channels and sales channels. Zahedi [27] establishes a new CLSC network composed of sales agents and customers. The results show that using the attributes of the sales agent center and the customer base can increase the total revenue from the problem and the number of returned products collected. Liu [28] studies the WEEE recycling problem under the third party recycling in CLSC and uses revenue sharing, and cost sharing contracts, as the coordination mechanism. The results show that when retailers sell new products and secondhand products at the same time, consumers become more sensitive to recycling prices, and the profits of manufacturers, recyclers, and CLSC will increase. Kaoud et al. [29,30,31,32,33,34] establishes dual-channel CLSC models to solve the problem of e-commerce. By considering two channels in CLSC, sensitivity analysis was performed to illustrate the effectiveness of e-commerce integration. Xu et al. [35,36,37,38,39,40] constructs closed-loop supply chains under different conditions. Some of them use manufacturers to directly recycle WEEE, some use retailers to recycle WEEE, and the others introduce third-party recyclers. Based on their calculation results, we can conclude that the choice of recyclers should be specified in conjunction with specific conditions.
In recent years, as governments around the world attach importance to environmental protection, more and more scholars have begun to conduct research on CLSC under government intervention. Hong [41] builds a CLSC with the government as the leader. It has two followers, one is the entirety of the manufacturer, the supplier, and the retailer, and the other one is the recycler. Research on the impact and social benefits of subsidies given to the recycler by the government and manufacturer groups at the same time, the results show that the supply chain obtains the greatest social benefits in an equilibrium state, and the two followers also obtain the greatest benefits. Under dual supervision, Liu [42] establishes a two-level CLSC, composed of brand owners and OEMs, and studies the impact of dual supervision on four key aspects of supply chain operations. The results show that the recycling strategy of brand owners and the manufacturing strategy of OEMs are closely related to the dual supervision system. Fathollahi-Fard et al. [43] uses the proportion of government subsidies as a coordination variable to design a joint contract for government subsidy sharing, cost sharing, and coordinate decentralization decisions, and concluded that only when the manufacturer’s CSR is higher than a threshold, CSR works. Chen [44] develops two models of different regulatory settings to show the impact of the withdrawal of regulation on consumer surplus, supply chain revenue, and social welfare. The results show that the manufacturer’s best strategy depends on the applied regulatory model. In order to improve social welfare, low recycling targets and High reuse targets should be set. In the context of recycling legislation, Li [45] constructs a single-cycle stylized model for manufacturers in order to achieve the goal of maximizing profits. The results show that the government should set appropriate mandatory recovery and recycling targets based on the characteristics of product recovery, instead of pursuing excessive targets.
3. Problem Description and Model Assumption
This paper designs a three-level CLSC that consists of a manufacturer, a retailer and a third-party recycler. The manufacturer is responsible for manufacturing new products and remanufacturing the recycled waste products. It wholesales products to the retailer at price . Then the retailer sells products to market customers at price . The third-party recycler is responsible for recycling waste products from the market and selling them to the manufacturer for remanufacturing. The recycling price is denoted by A, and the unit transfer price paid by the manufacturer for recycling waste products from third-party recyclers/retailers is b. We assume b , which indicates the remanufacturing of the manufacturer has a positive profit. In order to encourage enterprises to increase the recycling quantity of waste products, the government promotes the recycling of waste products for remanufacturing throughout the supply chain by implementing a reward-penalty mechanism for recycling activities. The mechanism sets a minimum recovery rate threshold which is bigger than 0 and less than 100%. When the product recovery rate is higher than the threshold set by the government, the recycler will be rewarded, otherwise, it will be punished. The CLSC where the government implements the reward-penalty mechanism for recycling is shown in Figure 1.
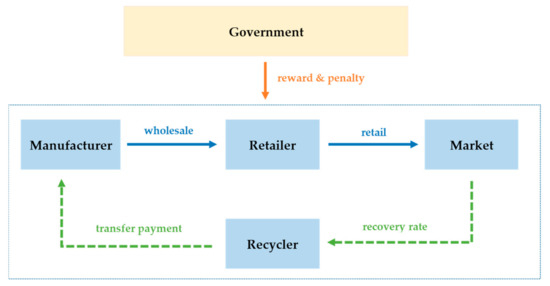
Figure 1.
Structure of a CLSC under government reward-penalty mechanism.
We assume that the quality and function of the new products and the remanufactured products produced by recycling waste products are exactly the same. is the unit cost of the manufacturer to manufacture new products, is the unit cost of the manufacturer to remanufacture products. To make remanufacturing meaningful, we assume . The production cost saved by producing remanufactured products is expressed as .
Following Savaskan [46] and Lejeune [47], we assume that the market demand function is , where denotes the potential market demand and denotes the price elasticity coefficient of market demand.
This paper also designs a recycling model for waste products. In the process of recycling waste products, recyclers need to spend [48,49,50]. The recovery rate represents the ratio of the output of remanufacturing using recycled waste products to the total production. The recovery effort cost of waste products I is a quadratic function of .
In reward-penalty mechanism, the government set a reward-penalty threshold . When , the government rewards the recyclers by , otherwise, the government penalizes the recyclers by . The symbol denotes the reward-penalty coefficient set by government.
The related parameters are shown in Table 1.

Table 1.
Model parameters.
When the variables and expressions are marked by “*” on the upper right corner, they denote the optimal values.
This paper studies the closed-loop supply chain decision-making research of the manufacturer (M), the retailer (R), and the third-party recycler (T) in different cooperation modes under the government’s reward and penalty. Let denote the profit of the role i in the cooperation mode j, denote the optimal profit, and denote the optimal decision of the parameter x in the cooperation mode j. We introduced 5 cooperation modes, namely MRT cooperation mode, MR cooperation mode, MT cooperation mode, RT cooperation mode, and NCO mode (independent decision-making respectively), as shown in Figure 2.
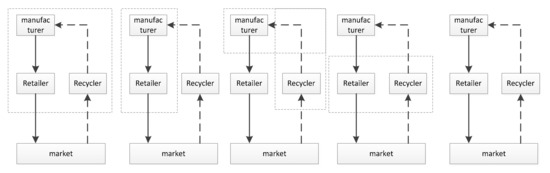
Figure 2.
From left to right are MRT, MR, MT, RT and non-cooperative mode.
4. Model Analysis
Electronic and electrical products have the characteristics of fast replacement and short service life. WEEE pollutes the environment seriously, and the processing of WEEE imposes a heavy burden on government finances [3,4]. Therefore, this study is based on a closed-loop supply chain with recycling WEEE as the core.
4.1. MRT Cooperation Mode
In MRT cooperation mode, the manufacturer, the retailer, and the recycler are studied as a whole. In this mode, there is no need to game within the enterprises, we only game between the enterprises and market consumers. The enterprises set the retail price and the recovery rate .
Enterprises’ total profit function is:
In this formula, the first item on the right is the profit from selling new products, the second item is the profit from selling remanufactured products, the third item is recovery effort cost, and the last item is government reward-penalty. The first, second, third, and fourth item each represent profit from selling new products, profit from selling remanufactured products, recovery effort cost and government reward-penalty. Related proof is put in Appendix A.
Proposition 1.
In the MRT cooperation mode, when , there is a unique optimal solution to Equation (1), and, the optimal pricing strategy is:
Bring the optimal solution into Equation (1) to obtain the total optimal profit of the enterprise:
Corollary 1.
In the MRT cooperation model, the optimal recovery rateincreases with the increase of the government reward-penalty coefficient, and the retail pricedecreases with the increase of the government reward-penalty coefficient.
Corollary 2.
In the MRT cooperation mode, when, the optimal profitincreases with the increase of the government reward-penalty coefficient.
Corollary 3.
In the MRT cooperation mode, under the premise of, that is, when, the optimal profit of the enterprisedecreases with the increase of the government reward-penalty coefficient.
Corollary 1 shows that, when the government reward-penalty coefficient increases, companies will increase the recycling rate of waste products to obtain more government rewards, which, in turn, will increase the proportion of manufacturers remanufacturing, resulting in significant production cost savings, and the average production cost of products getting smaller. Therefore, the sales price of the product decreases accordingly. According to the market demand function, , it can be seen that the market demand becomes bigger at this time. Corollary 2 shows that when the government reward-penalty threshold is set low, the enterprise can achieve the government reward goal with a lower cost of recovery effort. In this case, the reward-penalty coefficient can be directly regarded as the reward coefficient. Corollary 3 shows that when the government reward-penalty threshold is set high, the enterprise needs to spend a higher recovery effort cost to reach the reward threshold. When the reward coefficient is low, the government rewards are not enough to compensate for the recovery effort cost of the enterprise, resulting in the enterprise’s optimal profit, decreases with the increase of the government reward and punishment coefficient , and when the government reward-penalty coefficient is large enough, it is more advantageous than the recovery effort cost, and the enterprise’s optimal profit increases with the increase of government reward and punishment coefficient .
4.2. MR Cooperation Mode
In the MR cooperation model, manufacturer and retailer are studied as a whole. The decision sequence is that manufacturer and retailer decide the retail price of the product and the unit transfer payment price according to the market situation, and then the recycler decides the product recovery rate .
The combined profit function of the manufacturer and retailer is
In the formula, the first item on the right is the profit from selling new products, and the second item is the profit from selling remanufactured products.
The profit function of third-party recyclers is
In the formula, the first item on the right is the profit obtained by a third-party recycler from recycling and transferring a waste product, the second item is the cost of recycling effort, and the third item is government reward-penalty. Related proof is put in Appendix B.
Proposition 2.
In the MR cooperation model, the optimal pricing strategy is:
The profits of manufacturer, retailer and third-party recycler are:
Corollary 4.
In the MR cooperation model, the optimal recovery rateincreases with the increase of the government reward-penalty coefficient, the unit transfer payment pricedecreases with the increase of the government reward-penalty coefficient m, the retail pricedecreases with increase of government reward-penalty coefficient m.
Corollary 5.
In the MR cooperation mode, the optimal profit of the manufacturer and retailerincreases with the increase of the government reward-penalty coefficient.
Corollary 6.
In the MR cooperation mode, when, the optimal profit of the recyclerincreases with the increase of the government reward-penalty coefficient.
Corollary 7.
In the MR cooperation mode, under the premise of , that is, When, the optimal profit of the enterprisesdecreases with the increase of the government reward-penalty coefficient. When, the optimal profit of the enterprisesincreases with the increase of the government reward-penalty coefficient.
Corollary 4 and Corollary 5 show that when the government reward-penalty coefficient increases, recycler will increase the recycling rate of waste products to obtain more government rewards. At this time, manufacturers do not need to increase the transfer payment price to promote recyclers to increase the degree of recycling efforts, then the transfer payment price will be reduced. With the increase in the recycling rate of waste products and the decrease in the transfer payment price, the average production cost c of the product decreases, and the sales price p of the product decreases accordingly. In the MR model, the effect of profit growth brought by manufacturers and retail alliances by reducing average production costs c and increasing market demand q, which is stronger than the impact of lower retail prices p. Corollary 6 and Corollary 7 show that, when the government sets an excessively high recovery rate threshold , recyclers need to spend a higher recovery effort cost, and the benefits obtained cannot compensate for the increased investment.
4.3. MT Cooperation Mode
In the MT cooperation mode, the manufacturer, and the recycler are considered as a whole. The decision sequence is that the manufacturer and the recycler decide the unit product wholesale price and the product recovery rate according to the market situation, and then the retailer decides the product retail price .
The combined profit function of the manufacturer and recycler is
In the formula, the first item on the right is the profit from selling new products, the second item is the profit from selling remanufactured products, the third item is the cost of recycling waste products, the fourth item is the cost of recycling effort, and the last one is government reward-penalty.
The profit function of retailer is
The retailer’s profit function has only one item. It is the difference between sales and wholesale costs. Related proof is put in Appendix C.
Proposition 3.
In the MT cooperation model, the optimal pricing strategy is:
The profit of manufacturer, recycler and retailer is respectively:
Corollary 8.
In the MT cooperation model, the optimal recovery rateincreases with the increase of the government reward-penalty coefficient, the wholesale priceand the retail priceall decrease with increase of government reward-penalty coefficient.
Corollary 9.
In the MT cooperation mode, when, the optimal profit of the manufacturer and recycler increases with the increase of the government reward-penalty coefficient m. when, the optimal profit of the manufacturer and recyclerdecreases with the increase of the government reward-penalty coefficient m.
Corollary 10.
In the MT cooperation mode, the optimal profit of the retailer increases with the increase of the government reward-penalty coefficient m.
Corollary 8 to Corollary 10 show that, when the government reward-penalty coefficient increases, recyclers will increase the recycling rate of waste products to obtain more government rewards. In this case, the average production cost of the product becomes smaller, and both the wholesale price of the product and retail price are decreased. The market demand increases accordingly, and the effect of profit growth caused by the decrease of retail price and the increase of market demand are stronger, and the retailer’s optimal profit increases. In the MT mode, when the government sets an excessively high recycling rate threshold , if the manufacturer and recycler do not increase the cost of recycling efforts to increase the recycling rate of waste products, they will face higher government penalties. When manufacturers and recyclers increase the cost of recycling efforts and reach the threshold of recycling rate, the government rewards obtained are much lower than the input paid, so the optimal total profit is reduced.
4.4. RT Cooperation Mode
In the RT cooperation mode, the retailer and the recycler are studied as a whole. The decision sequence is that the manufacturer decides the unit product wholesale price and the unit transfer payment price . The retailer and the recycler decide the product retail price and the product recovery rate .
The profit function of the manufacturer is
In the formula, the first item on the right is the profit from selling new products, the second item is the profit from selling remanufactured products.
The profit function of the retailer and recycler is
In the formula, the first item on the right is the profit from selling products, the second item is the profit obtained by a third-party recycler from recycling and transferring a waste product, the third item is the cost of recycling waste products, the fourth item is the cost of recycling effort, and the last one is government reward-penalty. Related proof is put in Appendix D.
Proposition 4.
In the RT cooperation model, the optimal pricing strategy is:
The profit of manufacturer, recycler and retailer is respectively:
Corollary 11.
In the RT cooperation model, the optimal recovery rateand the wholesale priceincrease with the increase of the government reward-penalty coefficient, the retail pricedecreases with increase of government reward-penalty coefficient.
Corollary 12.
In the RT cooperation mode, the optimal profit of the manufacturerincreases with the increase of the government reward-penalty coefficient m.
Corollary 13.
In the MT cooperation mode, when, the optimal profit of the retailer and recyclerincreases with the increase of the government reward-penalty coefficient m. when, the optimal profit of the retailer and recyclerdecreases with the increase of the government reward-penalty coefficient m.
Corollary 11 to Corollary 13 show that, when the government reward-penalty coefficient increases, recycler will increase the recycling rate of waste products to obtain more government rewards. Retailer expands market demand by reducing product retail prices , thereby increasing the quantity of recycling of waste products, and increasing the total profit of the alliance by increasing transfer payments. As the transfer payment price reaches the maximum, manufacturers no longer have a cost advantage over manufacturing new products, it can only increase their profits by increasing the wholesale price .
4.5. NCO Mode
In the NCO mode, the manufacturer, retailer and recycler do not cooperate and they make independent decisions. The decision sequence is that the manufacturer decides the unit product wholesale price and the unit transfer payment price . Then, the retailer and the recycler decide the product retail price and the product recovery rate respectively.
The profit function of the manufacturer is
In the formula, the first item on the right is the profit from selling new products, and the second item is the profit from selling remanufactured products.
The profit function of the retailer is
The profit function of the recycler is
In the formula, the first item on the right is the profit obtained by a third-party recycler from recycling and transferring a waste product, the second item is the cost of recycling effort, and the last one is government reward-penalty. Related proof is put in Appendix E.
Proposition 5.
In the NCO model, the optimal pricing strategy is
The profit of manufacturer, recycler and retailer is respectively
Corollary 14.
In the NCO model, the optimal recovery rateand the retail priceincrease with the growth of the government reward-penalty coefficient, the wholesale pricedecreases with increase of government reward-penalty coefficient.
Corollary 15.
In the NCO mode, the optimal profit of the manufacturer and the profit of the retailerboth increase with the rise of the government reward-penalty coefficient m.
Corollary 16.
In the NCO mode, when, the optimal profit of the recyclerincreases with the rise of the government reward-penalty coefficient m. When, the optimal profit of the recyclerdecreases with the increase of the government reward-penalty coefficient m.
Corollary 14 to Corollary 16 show that when the government reward-penalty coefficient increases, the recycler will increase the recycling rate of waste products to obtain more government rewards. Due to the increase in recycling rate, the manufacturer does not need to increase transfer payments to obtain more waste products. Therefore, the transfer payment b decreases, and the average manufacturing cost c of the product decreases. As the cost decreases, the manufacturer lowers the wholesale price, and the retailer lowers the retail price p.
5. Comparison of the Optimal Decisions of Different Cooperation Models
In Section 4, we make decisions on CLSC under different cooperation modes. In this section, we compare the optimal decisions. Related proofs are put in Appendix F, Appendix G and Appendix H.
Proposition 6.
The more members participate in the cooperation, the higher the total profit and the lower sale price will be, that is,,.
Proposition 7.
If there is only one partner can be selected, when, the manufacturer tends to cooperate with the retailer, otherwise, the manufacturer prefers to cooperate with the recycler. When, the retailer is likely to cooperate with manufacturers, otherwise, the retailer is inclined to cooperate with the recycler. When, the recycler tends to cooperate with manufacturers, otherwise, the recycler tends to cooperate with the retailer.
Proposition 6 indicates that all the integration of enterprises in the closed-loop supply chain can achieve the most profitable maximization. The customers can also purchase by the lowest sale price. In reality, it is extremely difficult to integrate the entire supply chain. In addition, can it obtain support from the government? Proposition 7 shows how each member in the closed-loop supply chain chooses partners when only two parties can cooperate. Two-party cooperation has positive profit gains for the entire supply chain, and the choice of cooperation is determined by the recovery rate threshold, which is ultimately set by government.
Proposition 8.
The CLSC under the MRT model gets the most profits at the lowest retail price. It can easily eliminate other competitors in the market and achieve the monopoly position.
The CLSC, under the MRT mode, seizes market share by reducing retail prices and finally eliminates competing products. This kind of monopolistic behavior is opposed by the government and the market.
6. Numerical Study
In this section, we verify the relationship between the total profit of the CLSC and the government reward-penalty coefficient under different cooperation modes. The following parameter values are used for the analysis: , , .
Figure 3 shows that in any case, the more members participating in the cooperation, the highest profit the CLSC gains. the total profit in the MRT mode is the largest, and the total profit in the NCO mode is the lowest. In Figure 4, , the manufacturer is more inclined to cooperate with the retailer. In Figure 5, , the retailer is more inclined to cooperate with the manufacturer. In Figure 6, , the recycler are more inclined to cooperate with the retailer. We can further verify Proposition 7 by them. In addition to the government reward-penalty coefficient m, we also consider the impact of the cost advantage of remanufactured products on the most profitable. Here we adjust the parameters to: .
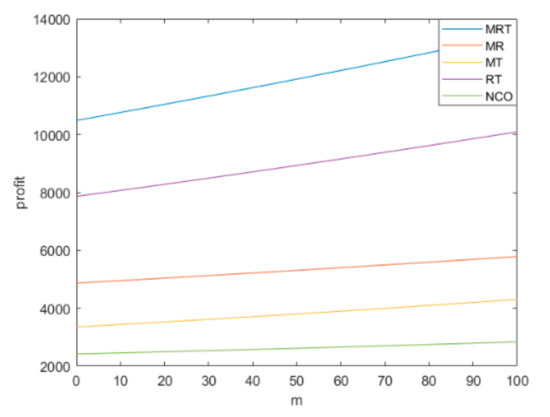
Figure 3.
The profits of five modes.
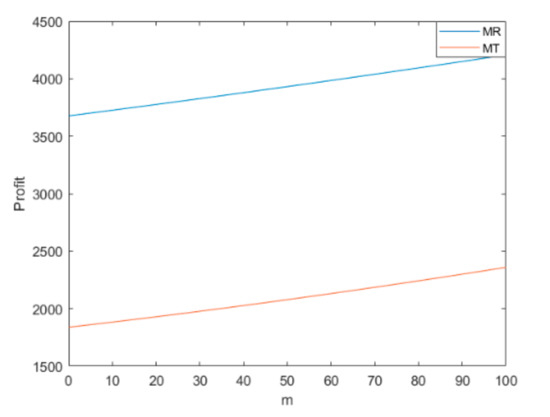
Figure 4.
The profits of MR mode and MT mode.
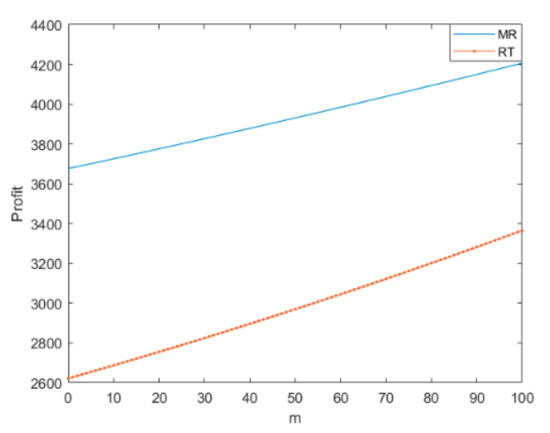
Figure 5.
The profits of MR mode and RT mode.
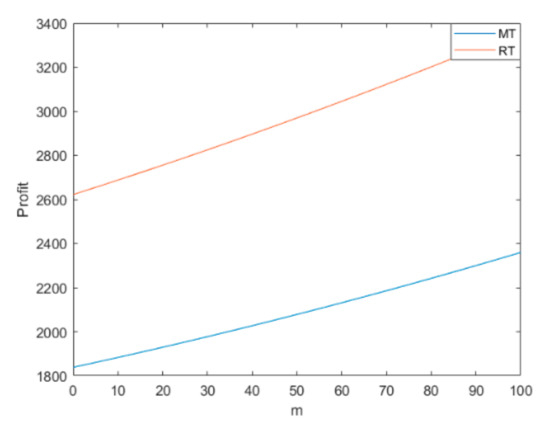
Figure 6.
The profits of MT mode and RT mode.
Note: In Figure 3, Figure 4, Figure 5 and Figure 6, the abscissa axis represents the government reward-penalty coefficient m, and the ordinate axis represents the profit of CLSC in different cooperation modes.
Figure 7, Figure 8, Figure 9, Figure 10 and Figure 11 are the profit images of the entire supply chain in the MRT, MR, MT, RT, and NCO modes respectively. Supply chain profits increase significantly with the expansion of remanufacturing cost advantages and the increase of government rewards and punishments coefficient.
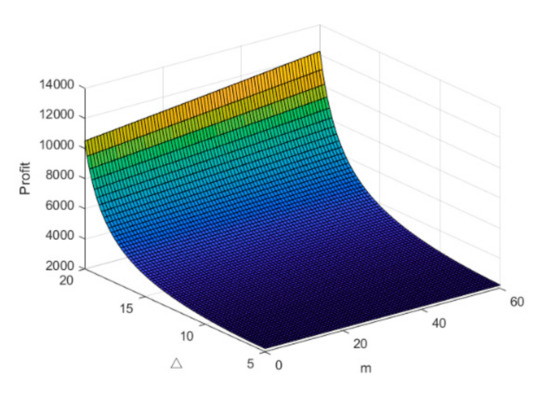
Figure 7.
The profit of MRT mode.
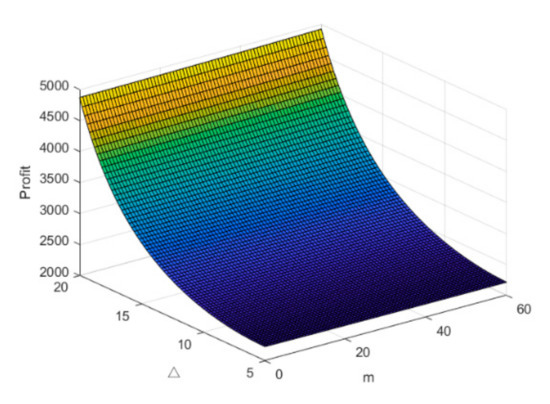
Figure 8.
The profit of MR mode.
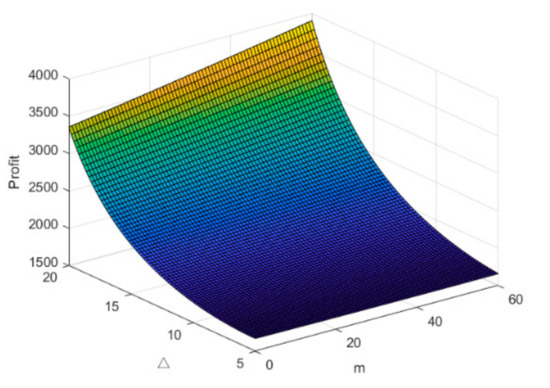
Figure 9.
The profit of MT mode.
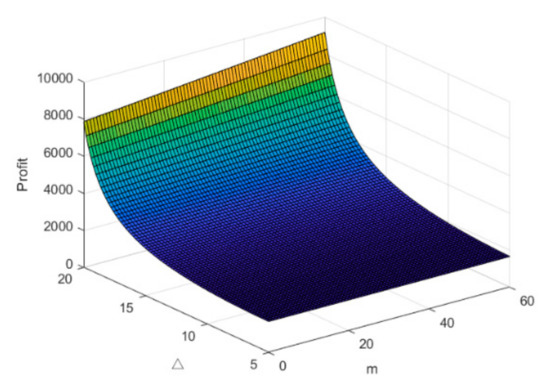
Figure 10.
The profits of RT mode.
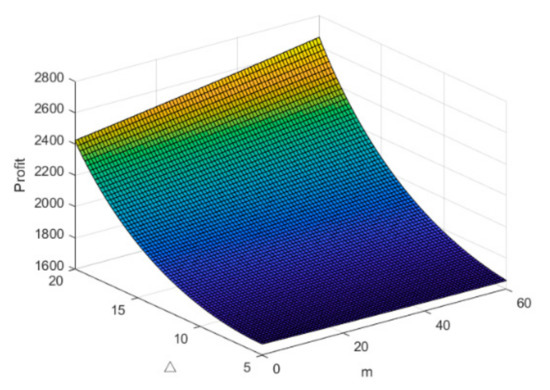
Figure 11.
The profits of NCO mode.
7. Discussion
As the awareness for environmental protection has increased, governments around the world have paid significant attention to participating in the recycling process of CLSC. Many scholars’ studies on CLSC, with the government reward-penalty mechanism, also reflect cooperation. Kim et al. [5] add revenue sharing conditions to CLSC with government reward-penalty mechanism, which can be seen as another embodiment of the MRT cooperation model of CLSC. The results show that the introduction of the government reward-penalty mechanism can effectively increase the recycling rate of WEEE, which is consistent with Corollary 1 of this study. Furthermore, according to Corollary4, Corollary 8, Corollary 11, and Corollary 14, as the introduction of government reward-penalty mechanism, the recycling rate increases in each cooperation mode. In addition, according to the research of Kim et al., revenue sharing can maximize the profit of CLSC, which is also consistent with the conclusion of this article. The specific conclusion can be seen in Proposition 6. Chen et al. [7] calculated that under the NCO mode, government reward-penalty mechanism has a positive effect on the recovery rate, which is also consistent with the conclusion of this study. Wang et al. [51] introduce a government reward-penalty mechanism in a two-stage closed-loop supply chain. The results show that the introduction of the government reward-penalty mechanism reduces retail prices, improves product recovery rates and increases the profits of recyclers. If the recovery rate threshold is set too high, no matter how the government regulates it, it will lead to a reduction in the profit of CLSC. In Wang et al.’s research, the manufacturer also acted as a recycler, which can be regarded as the MT model in this study, that is, the cooperation model between the manufacturers and the third-party recycler. Homological conclusions can be found in Corollary 8, Corollary 9, Corollary 10, and Proposition 7. Wang et al. [52] introduce the carrot/stick mechanism in CLSC, which is equivalent to the government reward-penalty mechanism. The results show that as the government reward-penalty coefficient increases, the recovery rate also increases effectively. It is in accordance with Corollary 1, Corollary 4, Corollary 8, Corollary 11, and Corollary 14 of this research.
As mentioned in Section 6, we substitute the various parameters of CLSC into numerical quantities. When the government reward-penalty coefficient m is 0, CLSC can be regarded as no government intervention. Therefore, from Figure 3, Figure 4, Figure 5 and Figure 6, we can intuitively get that the profit of CLSC increases with the government reward-penalty coefficient and the numbers participating in cooperation. In addition, Figure 7, Figure 8, Figure 9, Figure 10 and Figure 11 also show the changes in the profit of CLSC with remanufacturing cost savings . Different products (such as mobile phones, computers, household appliances) have different , so this study can also guide the decision-making of different industries.
For the first time, this study systematically analyzes the cooperation mode of CLSC under the government reward-penalty mechanism, and compares the results of different cooperation modes in theory. The calculation results can be verified with actual situation. In 2011, the Chinese government promulgated the Regulations on the Management of Waste Electrical and Elec-tronic Equipment Recycling and Processing. At that time, Xiaomi entered the market as a new mobile phone brand. It seized the opportunity to establish a sound closed-loop supply chain system. At the same time, thanks to the government’s support of WEEE recycling subsidies, Xiaomi greatly reduced manufacturing costs and its mobile phone retail price [53]. The price is almost half that of products of the same level. As a result, Xiaomi mobile phones quickly increased their market share. Subsequently, other brands have established or joined the closed-loop supply chain system, which has reduced the manufacturing costs of almost all brands of mobile phones.
8. Summary and Future Research
With the increasingly acute contradiction between economic development and the environment, governments of various countries attach great importance to environmental protection, and have successively issued some policies and regulations requiring enterprises to implement closed-loop supply chain management, and even implement subsidies to enterprises to encourage them to carry out recycling and remanufacturing activities.
This paper studies the decision-making problems of closed-loop supply chains with different cooperation modes when the government implements a reward-penalty on CLSC, and mainly analyzes the influence of government reward-penalty on the decision variables and profits of the closed-loop supply chain.
We draw the following conclusions:
- (1)
- Cooperation is the best choice to maximize profits. When the manufacturer, the retailer and the recycler cooperate, unnecessary transaction costs between enterprises are eliminated, and overall profits are increased. However, the MRT mode isn’t approved by government and market, because it leads to monopoly.
- (2)
- In the real market environment, due to the limited scale and business scope of the company, it is difficult for the manufacturer, the retailer, and the recycler to cooperate together. When only two parties participate in the cooperation, the parties still pursue the maximization of profits. In different situation, they choose different partner.
Although this study analyzes the decision-making of various cooperation modes, the two-party or three-party cooperation mode does not make further decisions on how to distribute profits, which is also the focus of future research. The government’s specific control plan is also the focus of our future research.
In this paper, we assume that all the players have full information, it is not the case in practice. In future study, we also will try our best to conduct research on specific industries, which will have more practical guiding significance. In addition, for electronic and electrical products, multi-product mixed sales are more in line with future development trends. Retail platforms, like Amazon and Alibaba, have a large number of customers, and they have become increasingly dominant in the market. In future research, we should also think about the retailer-led multi-product CLSC and the government intervention.
Author Contributions
Conceptualization, Q.L. and H.Z.; data curation, H.Z. and K.L.; formal analysis, H.Z.; investigation, Q.L.; methodology, H.Z.; project administration, Q.L. and H.Z.; resources, Q.L. and K.L.; software, H.Z. and K.L.; supervision, Q.L.; visualization, H.Z. and K.L.; writing—original draft preparation, H.Z.; writing—review and editing, Q.L. and K.L.; All authors have read and agreed to the published version of the manuscript.
Funding
This research received no external funding.
Institutional Review Board Statement
Not applicable.
Informed Consent Statement
Not applicable.
Conflicts of Interest
The authors declare no conflict of interest.
Appendix A. Proof of Proposition 1
According to formula (1), when , the total profit function of the enterprise is a strictly concave function about the price and the recovery rate Let we can solve the optimal decision.
Appendix B. Proof of Proposition 2
According to the reverse recursion method, this study make a decision with a third-party recycler, From Equation (3), can be obtained, which is substituted into Equation (2), it is easy to prove that Equation (2) is a strictly concave function of p and b.
Appendix C. Proof of Proposition 3
According to the reverse recursion method, make a decision for the retailer first. According to Formula (5), . Substituting it into Equation (4), it is easy to prove that Equation (4) is a strictly concave function of and , the optimal solution is obtained.
Appendix D. Proof of Proposition 4
According to the reverse recursion method, make a decision for the retailer and recycler first. Equation (7) is a strictly concave function of and .
Solve
Put and into Equation (6)
When , , so .
It is easy to solve .
Put and into Equations (6) and (7).
and can be solved.
Appendix E. Proof of Proposition 5
According to the reverse recursion method, make a decision for the retailer and recycler first. Equation (9) is a strictly concave function of and Equation (10) is a strictly concave function of .
Solve
Put and into Equation (8)
Solve
Put and into Equations (9) and (10), and can be solved.
Appendix F. Proof of Proposition 6
Appendix G. Proof of Proposition 7
Appendix H. Proof of Proposition 8
References
- Chan, C.K.; Man, N.; Fang, F.; Campbell, J. Supply chain coordination with reverse logistics: A vendor/recycler-buyer synchronized cycles model. Omega 2020, 95, 102090. [Google Scholar] [CrossRef]
- Genc, T.S.; De Giovanni, P. Optimal return and rebate mechanism in a closed-loop supply chain game. Eur. J. Oper. Res. 2018, 269, 661–681. [Google Scholar] [CrossRef]
- Wang, Z.; Wu, Q. Carbon emission reduction and product collection decisions in the closed-loop supply chain with cap-and-trade regulation. Int. J. Prod. Res. 2020, 1–25. [Google Scholar] [CrossRef]
- Guo, H.; Zhang, Y.; Zhang, C.; Liu, Y.; Zhou, Y. Location-inventory decisions for closed-loop supply chain management in the presence of the secondary market. Ann. Oper. Res. 2018, 291, 361–386. [Google Scholar] [CrossRef]
- Kim, S.; Shin, N.; Park, S. Closed-Loop Supply Chain Coordination Under a Reward–Penalty and a Manufacturer’s Subsidy Policy. Sustainability 2020, 12, 9329. [Google Scholar] [CrossRef]
- Tang, Y.; Zhang, Q.; Li, Y.; Li, H.; Pan, X.; Mclellan, B. The social-economic-environmental impacts of recycling retired EV batteries under reward-penalty mechanism. Appl. Energy 2019, 251, 113313. [Google Scholar] [CrossRef]
- Chen, C.-K.; Ulya, M.A. Analyses of the reward-penalty mechanism in green closed-loop supply chains with product remanufacturing. Int. J. Prod. Econ. 2019, 210, 211–223. [Google Scholar] [CrossRef]
- Zu-Jun, M.; Zhang, N.; Dai, Y.; Hu, S. Managing channel profits of different cooperative models in closed-loop supply chains. Omega 2016, 59, 251–262. [Google Scholar] [CrossRef]
- Huang, Z.; Li, S.X. Co-op advertising models in manufacturer–retailer supply chains: A game theory approach. Eur. J. Oper. Res. 2001, 135, 527–544. [Google Scholar] [CrossRef]
- Dutta, P.; Choi, T.-M.; Somani, S.; Butala, R. Blockchain technology in supply chain operations: Applications, challenges and research opportunities. Transp. Res. Part E Logist. Transp. Rev. 2020, 142, 102067. [Google Scholar] [CrossRef]
- Savaskan, R.C.; Bhattacharya, S.; Van Wassenhove, L.N. Closed-Loop Supply Chain Models with Product Remanufacturing. Manag. Sci. 2004, 50, 239–252. [Google Scholar] [CrossRef]
- Ullah, M.; Asghar, I.; Zahid, M.; Omair, M.; AlArjani, A.; Sarkar, B. Ramification of remanufacturing in a sustainable three-echelon closed-loop supply chain management for returnable products. J. Clean. Prod. 2021, 290, 125609. [Google Scholar] [CrossRef]
- Wang, Y.; Su, M.; Shen, L.; Tang, R. Decision-making of closed-loop supply chain under Corporate Social Responsibility and fairness concerns. J. Clean. Prod. 2021, 284, 125373. [Google Scholar] [CrossRef]
- Avinadav, T. The effect of decision rights allocation on a supply chain of perishable products under a revenue-sharing contract. Int. J. Prod. Econ. 2020, 225, 107587. [Google Scholar] [CrossRef]
- Bian, J.; Zhao, X. Tax or subsidy? An analysis of environmental policies in supply chains with retail competition. Eur. J. Oper. Res. 2020, 283, 901–914. [Google Scholar] [CrossRef]
- Bulmus, S.C.; Zhu, S.X.; Teunter, R. Competition for cores in remanufacturing. Eur. J. Oper. Res. 2014, 233, 105–113. [Google Scholar] [CrossRef]
- Qiao, D.; Wang, G.; Gao, T.; Wen, B.; Dai, T. Potential impact of the end-of-life batteries recycling of electric vehicles on lithium demand in China: 2010–2050. Sci. Total. Environ. 2021, 764, 142835. [Google Scholar] [CrossRef]
- De Giovanni, P. A joint maximization incentive in closed-loop supply chains with competing retailers: The case of spent-battery recycling. Eur. J. Oper. Res. 2018, 268, 128–147. [Google Scholar] [CrossRef]
- Muyldermans, L.; Van Wassenhove, L.; Guide, V. Managing high-end ex-demonstration product returns. Eur. J. Oper. Res. 2019, 277, 195–214. [Google Scholar] [CrossRef]
- Sazvar, Z.; Zokaee, M.; Tavakkoli-Moghaddam, R.; Salari, S.A.-S.; Nayeri, S. Designing a sustainable closed-loop pharmaceutical supply chain in a competitive market considering demand uncertainty, manufacturer’s brand and waste management. Ann. Oper. Res. 2021, 1–32. [Google Scholar] [CrossRef]
- Mosallanezhad, B.; Hajiaghaei-Keshteli, M.; Triki, C. Shrimp closed-loop supply chain network design. Soft Comput. 2021, 25, 7399–7422. [Google Scholar] [CrossRef]
- Garai, A.; Chowdhury, S.; Sarkar, B.; Roy, T.K. Cost-effective subsidy policy for growers and biofuels-plants in closed-loop supply chain of herbs and herbal medicines: An interactive bi-objective optimization in T-environment. Appl. Soft Comput. 2021, 100, 106949. [Google Scholar] [CrossRef]
- Shabbir, M.S.; Mahmood, A.; Setiawan, R.; Nasirin, C.; Rusdiyanto, R.; Gazali, G.; Arshad, M.A.; Khan, S.; Batool, F. Closed-loop supply chain network design with sustainability and resiliency criteria. Environ. Sci. Pollut. Res. 2021, 1–16. [Google Scholar] [CrossRef]
- Song, H.; Chu, H. Incentive Strategies of Different Channels in an Electric Vehicle Battery Closed-Loop Supply Chain. Procedia Comput. Sci. 2019, 162, 634–641. [Google Scholar] [CrossRef]
- Chavez, R.; Sharma, M. Profitability and environmental friendliness of a closed-loop supply chain for PET components: A case study of the Mexican automobile market. Resour. Conserv. Recycl. 2018, 135, 172–189. [Google Scholar] [CrossRef]
- Dominguez, R.; Cannella, S.; Framinan, J.M. Remanufacturing configuration in complex supply chains. Omega 2021, 101, 102268. [Google Scholar] [CrossRef]
- Zahedi, A.; Salehi-Amiri, A.; Hajiaghaei-Keshteli, M.; Diabat, A. Designing a closed-loop supply chain network considering multi-task sales agencies and multi-mode transportation. Soft Comput. 2021, 25, 6203–6235. [Google Scholar] [CrossRef]
- Liu, Y.; Xia, Z.-J.; Shi, Q.-Q.; Xu, Q. Pricing and coordination of waste electrical and electronic equipment under third-party recycling in a closed-loop supply chain. Environ. Dev. Sustain. 2021, 1–18. [Google Scholar] [CrossRef]
- Kaoud, E.; Abdel-Aal, M.; Sakaguchi, T.; Uchiyama, N. Design and Optimization of the Dual-Channel Closed Loop Supply Chain with E-Commerce. Sustainability 2020, 12, 10117. [Google Scholar] [CrossRef]
- Li, C.-F.; Guo, X.-Q.; Du, D.-L. Pricing Decisions in Dual-Channel Closed-Loop Supply Chain Under Retailer’s Risk Aversion and Fairness Concerns. J. Oper. Res. Soc. China 2020, 1–17. [Google Scholar] [CrossRef]
- Kleber, R.; Reimann, M.; Souza, G.C.; Zhang, W. Two-sided competition with vertical differentiation in both acquisition and sales in remanufacturing. Eur. J. Oper. Res. 2020, 284, 572–587. [Google Scholar] [CrossRef]
- Shu, T.; Liu, Q.; Chen, S.; Wang, S.; Lai, K.K. Pricing Decisions of CSR Closed-Loop Supply Chains with Carbon Emission Constraints. Sustainability 2018, 10, 4430. [Google Scholar] [CrossRef]
- Zhang, Z.-Z.; Wang, Z.-J.; Liu, L.-W. Retail Services and Pricing Decisions in a Closed-Loop Supply Chain with Remanufacturing. Sustainability 2015, 7, 2373–2396. [Google Scholar] [CrossRef]
- Memari, A.; Ahmad, R.; Jokar, M.R.A.; Rahim, A.R.A. A New Modified Firefly Algorithm for Optimizing a Supply Chain Network Problem. Appl. Sci. 2018, 9, 7. [Google Scholar] [CrossRef]
- Xu, L.; Shi, J. Withdrawn: The effect of capacity constraint on pricing decision and coordination contract in recycling channels. RAIRO Oper. Res. 2021, 55, S1705–S1724. [Google Scholar] [CrossRef]
- Zheng, X.-X.; Li, D.-F.; Liu, Z.; Jia, F.; Sheu, J.-B. Coordinating a closed-loop supply chain with fairness concerns through variable-weighted Shapley values. Transp. Res. Part E Logist. Transp. Rev. 2019, 126, 227–253. [Google Scholar] [CrossRef]
- Zhou, Y.-W.; Li, J.; Zhong, Y. Cooperative advertising and ordering policies in a two-echelon supply chain with risk-averse agents. Omega 2018, 75, 97–117. [Google Scholar] [CrossRef]
- Ranjbar, Y.; Sahebi, H.; Ashayeri, J.; Teymouri, A. A competitive dual recycling channel in a three-level closed loop supply chain under different power structures: Pricing and collecting decisions. J. Clean. Prod. 2020, 272, 122623. [Google Scholar] [CrossRef]
- Song, J.; Bian, Y.; Liu, G. Decisions of Closed-Loop Supply Chain Based on Recycling Effort and Differential Game. Discret. Dyn. Nat. Soc. 2020, 2020, 1–19. [Google Scholar] [CrossRef]
- Zhang, Y.; Diabat, A.; Zhang, Z.H. Reliable closed-loop supply chain design problem under facility-type-dependent probabilistic disruptions. Transp. Res. Part B 2021, 146, 180–209. [Google Scholar] [CrossRef]
- Hong, I.-H.; Ke, J.-S. Determining advanced recycling fees and subsidies in “E-scrap” reverse supply chains. J. Environ. Manag. 2011, 92, 1495–1502. [Google Scholar] [CrossRef]
- Liu, Z.; Li, K.W.; Tang, J.; Gong, B.-G.; Huang, J. Optimal operations of a closed-loop supply chain under a dual regulation. Int. J. Prod. Econ. 2021, 233, 107991. [Google Scholar] [CrossRef]
- Fathollahi-Fard, A.M.; Ahmadi, A.; Al-E-Hashem, S.M. Sustainable closed-loop supply chain network for an integrated water supply and wastewater collection system under uncertainty. J. Environ. Manag. 2020, 275, 111277. [Google Scholar] [CrossRef]
- Xintong, C.; Bangyi, L.; Zonghuo, L.; Goh, M.; Shanting, W. Take-back regulation policy on closed loop supply chains: Single or double targets? J. Clean. Prod. 2021, 283, 124576. [Google Scholar] [CrossRef]
- Li, B.; Wang, Y.; Wang, Z. Managing a closed-loop supply chain with take-back legislation and consumer preference for green design. J. Clean. Prod. 2021, 282, 124481. [Google Scholar] [CrossRef]
- Savaskan, R.C.; Van Wassenhove, L.N. Reverse Channel Design: The Case of Competing Retailers. Manag. Sci. 2006, 52, 1–14. [Google Scholar] [CrossRef]
- Lejeune, M. A variable neighborhood decomposition search method for supply chain management planning problems. Eur. J. Oper. Res. 2006, 175, 959–976. [Google Scholar] [CrossRef]
- Huang, W.; Swaminathan, J.M. Introduction of a second channel: Implications for pricing and profits. Eur. J. Oper. Res. 2009, 194, 258–279. [Google Scholar] [CrossRef]
- Jayaraman, V.; Patterson, R.; Rolland, E. The design of reverse distribution networks: Models and solution procedures. Eur. J. Oper. Res. 2003, 150, 128–149. [Google Scholar] [CrossRef]
- Williams, E.; Kahhat, R.; Allenby, B.; Kavazanjian, E.; Kim, J.; Xu, M. Environmental, Social, and Economic Implications of Global Reuse and Recycling of Personal Computers. Environ. Sci. Technol. 2008, 42, 6446–6454. [Google Scholar] [CrossRef]
- Wang, W.; Ding, J.; Sun, H. Reward-penalty mechanism for a two-period closed-loop supply chain. J. Clean. Prod. 2018, 203, 898–917. [Google Scholar] [CrossRef]
- Wang, W.; Yang, S.; Xu, L.; Yang, X. Carrot/stick mechanisms for collection responsibility sharing in multi-tier closed-loop supply chain management. Transp. Res. Part E Logist. Transp. Rev. 2019, 125, 366–387. [Google Scholar] [CrossRef]
- Zhang, S.; Meng, Q. Electronics closed-loop supply chain value co-creation considering cross-shareholding. J. Clean. Prod. 2021, 278, 123878. [Google Scholar] [CrossRef]


Publisher’s Note: MDPI stays neutral with regard to jurisdictional claims in published maps and institutional affiliations. |
© 2021 by the authors. Licensee MDPI, Basel, Switzerland. This article is an open access article distributed under the terms and conditions of the Creative Commons Attribution (CC BY) license (https://creativecommons.org/licenses/by/4.0/).