Article

Analysis and Prediction of Ecosystem Service Values Based on Land Use/Cover Change in the Yiluo River Basin

1
School of Water Conservancy and Engineering, Zhengzhou University, Zhengzhou 450000, China
2
State Key Laboratory of Simulation and Regulation of Water Cycle in River Basin, Institute of Water Resources and Hydropower Research, Beijing 100038, China
*
Author to whom correspondence should be addressed.
Sustainability 2021, 13(11), 6432; https://doi.org/10.3390/su13116432
Submission received: 28 April 2021 / Revised: 2 June 2021 / Accepted: 3 June 2021 / Published: 5 June 2021

Abstract

:
Ecosystem service values are closely related to land use/cover change, however, the values affected by land use/cover change in the context of climate variability remain unclear. Based on the land use/cover data of 2000, 2010, and 2020 in the Yiluo River Basin, we quantitatively analyzed the impacts of historical land use/cover change on the ecosystem service values. Then the future land use simulation model was applied to predict the land use/cover distribution in 2030 under three Representative Concentration Pathways scenarios, and the influences on ecosystem service values were analyzed further. We found that the total ecosystem service values in the Yiluo River Basin presented a growth from 9217 million dollars (2000) to 9676 million dollars (2020), which attributed to the increase of forestland and water bodies in recent years. By 2030, the total ecosystem service values continued to present an upward trend, while also showing a difference under three scenarios, this discrepancy was mainly caused by different precipitation conditions. With the introduction of the ecological protection and high-quality development of the Yellow River basin in the new period, climate change may be the main factors affecting the ecological field in the future.

1. Introduction

The current change rate and intensity of land use/cover change (LUCC) are far greater than any period in history, which is cumulatively a major driver of global environmental change [1,2,3]. There are many driving factors of LUCC-based anthropogenic activities such as continued population growth, industrial development, urban expansion, and policy factors, which are the key drivers over the years [4,5,6], however, the effects of climate variability cannot be ignored. Climate variability caused changes in temperature and rainfall, which may affect the growth of vegetation and the effectiveness of water resources, and exerted influences on land use/cover further [7,8,9]. The impacts of climate variability on land use/cover have attracted more and more attention in recent years, especially the spatio-temporal evolution characteristics of land use/cover under the background of future climate variability [10,11].
The changes in the land use/cover scales, compositions and patterns, led to rapid alterations in ecosystem composition and structure and resulted in significant changes in the quantity and quality of ecosystem service (ES) supply [12,13]. For example, the change of farmland area will affect the food supply function, forestland area will affect the function of climate regulation, and the water area will affect the function of water supply [14,15]. Regarding the impacts of LUCC on ES, the ecosystem service values (ESV), which quantify and monetize the ES, were usually adopted as the evaluation indicators and the basis for the execution of ecosystem protection and management [16,17,18].
There are two kinds of approaches widely used to evaluate ESVs. One is based on primary data, the ecological processes and functions that constitute ES are quantified by the ecological model, and then evaluates the economic values of ES. Such a method is performed on one or a few kinds of services rather than the comprehensive ESVs [19,20,21]. The other is the equivalent coefficient method, where ESVs are estimated based on the equivalent coefficient of various ecosystem services and combined with the unit area of the ecosystem [16,22,23]. Compared with the previous method, such an approach is more convenient to evaluate the spatial-temporal distribution of ESVs, especially for the ESVs evaluation results of LUCC [24,25,26,27]. A great number of researchers used this method to analyze the change of ESVs in different regions of the world, such as in Ebinur Lake [28], Qinghai-Tibet Plateau [29], Gangetic plain [30], the coastal zone of Tanzania [31], but these studies were mainly focused on the influences of historical LUCC on ESVs. In addition, some scholars have carried out works to simulate the influences of LUCC on ESVs in the future by setting different development scenarios in recent years, including ecological protection scenario, business-as-usual scenario, food sovereignty scenario [32,33,34,35], however, this approach lacks sufficient scientific basis.
Unlike previous studies, this paper focused on the prediction and assessment of ESVs in the context of future climate variability. To achieve this target, we selected the future climate model data in three Representative Concentration Pathways (RCPs) scenarios as the driving factors of the model, which are credible with comprehensive and high spatial resolution climate scenarios. Then the future land use simulation model (FLUS) was applied to predict the land use/cover distribution in 2030 under three RCPs scenarios, and the discrepancies of the ESVs were calculated and analyzed further. The Yiluo River Basin was selected as the study area and the objectives of this paper are: (1) analyzing the law of historical land use/cover change and detecting the reasons for these changes; (2) evaluating the change of historical ESVs and the impacts of LUCC on ESVs; (3) simulating the land use/cover distribution in the future, and predicting the impacts of future climate change on the ESVs. This study will provide scientific decision-making support for sustainable land use and ecosystem management in the Yiluo River Basin.

2. Materials and Methods

Firstly, based on the land use/cover data of 2000, 2010, and 2020 in the Yiluo River Basin, we analyzed the law of LUCC by using land use/cover dynamic degree change and a conversion matrix, and the change of ESVs by using an ESV model. Secondly, we calibrated and verified the FLUS model, simulated and predicted the land use/cover distribution in 2030 under three RCPs scenarios (RCP2.6, RCP4.5, and RCP8.5), and calculated the ESVs. The structure of the paper is shown in Figure 1.

2.1. Study Area

The Yiluo River Basin (109°43′–113°10′E, 33°39′–4°54′N) is a significant tributary in the Yellow River, covering an area of around 18,462.96 km2, including more than 20 counties in Shaanxi and Henan Province. The Yiluo River has two principal tributaries: The Luo River and the Yi River, where the Luo River is located on the north side and the Yi River on the south side. The Luo River originates in Shaanxi Province, with a whole length of 446.9 km and an annual runoff of 1.4 billion m3. The Yi River originates in Henan Province and flows into the Luo River in Yangcun, Yanshi City, which is about 265 km with an average annual runoff of 1.3 billion m3. The geographical location, elevation, and major rivers of the Yiluo River Basin are shown in Figure 2.
The Yiluo River Basin is located in the transition zone between the subtropical zone and warm temperate zone, belonging to the continental monsoon climate zone, being cold with little rain in winter and hot with a lot of rain in summer. The average annual temperature ranges from 7.4 to 9.5 °C, and the mean annual rainfall ranges from 460 to 980 mm. Due to the influences of monsoon climate, the rainfall is intensive in summer, and apt to lead to a peak runoff, which seriously threatens the ecosystem security downstream of the Yiluo River. In addition, parts of the Loess Plateau located in the northern Yiluo River Basin have characteristics of a loosening soil structure and sparse vegetation, and serious soil and water loss during the flood season [36]. In order to maintain the ecosystem security and eliminate the flood threat, large-scale soil and water conservation projects have been carried out on the basin, for example, The Grain for Green Project [37].

2.2. Data

In this paper, we selected land use/cover data of 2000, 2010, and 2020, which were obtained from the National Geomatics Center of China, with a precision of 30 m resolution. The historical climate data provided by the National Climate Center of the China Meteorological Administration. The digital elevation model (DEM) data source was shuttle radar topography mission data set, the slope and aspect were generated from DEM data. The socioeconomic and roads data were obtained from the Peking University Geographic Data Platform and the National Catalogue Service for Geographic Information, respectively.
Future climate data were obtained from The Global Climate Model provided by The Inter-Sectoral Impact Model Inter-comparison Project. The impacts of climate change existed some uncertainties, including the uncertainty on the climate model output results and the future emission scenarios [38,39]. In order to reduce the uncertainty of climate model predictions, we selected five commonly used climate models, namely GFDL-ESM2 M, HADGEM2-ES, IPSL-CM5A-LR, MIROC-ESM-CHEM, and NORESM1-MR, and used historical measured meteorological data to test these five climate models, the results showed that the error of IPSL-CM5A-LR simulation was the smallest in the study area. Therefore, IPSL-CM5A-LR was selected as the climate model for future climate prediction. The Representative Concentration Pathways (RCPs) is a new scenario developed by the IPCC for the Fifth Assessment Report in May 2011, which provides a comprehensive and high spatial resolution climate scenario. In this study, we selected three RCPs scenarios, RCP2.6, RCP4.5, and RCP8.5, which represent low, medium, and high greenhouse gas emissions, respectively, to reduce the uncertainty of the carbon emission scenario.

2.3. Detecting Land Use/Cover Change

(1)
Dynamic degree change
The single dynamic degree and the comprehensive dynamics degree were widely used method to describe the LUCC, which can be calculated by the following formula:
K = U b U a U a × 1 T × 100 % ,
LC = i = 1 n Δ L U i j 2 i = 1 n L U i × 1 T × 100 % ,
where K represents the single dynamic degree of a certain land use/cover in the study period, when the value of K is positive indicating area increase, otherwise, indicating area decrease. U a and U b are the area of a certain land use/cover category at the initial phase and the end phase, T is the extent of the study period. LC refers to the comprehensive land use/cover dynamics degree, L U i represents the area of land use/cover type i at the initial phase, Δ L U i j represents the sum of the absolute values of the transformed land use/cover in the research period. The higher of the comprehensive land use/cover dynamics degree indicating land use/cover change faster.
(2)
Land use/cover conversion matrix
Land use/cover conversion matrix was obtained by the ArcGIS software to analyze the mutual transformation patterns of land use/cover types, which can be extracted as follow:
C i j = A i j t × 10 + A i j t + 1 ,
where A i j t and A i j t + 1 refer to the land use/cover data in time t and t+1; C i j represents the conversion of land use/cover type i to type j.

2.4. Ecosystem Service Valuation

We used the equivalent coefficient method to assess the ESVs in this article. Firstly, depending on the present situation of the Yiluo River Basin, we divided the ES into 4 types and 11 services. Then confirmed the equivalent coefficients of the ESVs for each land use/cover type, which on the basis of the research achievements of Costanza et al. and Xie et al. [16,22].
Secondly, we set the value of the equivalent coefficients, which can be equivalent to one-seventh of the economic value of food production per hectare per year refer to existing research [14,40]. Where one-seventh means that the economic value provided by natural ecosystems without human input, which is approximately equal to one-seventh of the economic value of the food production provided by existing farmland. The average grain yield was 6895.4 kg/hm2 and the average grain price was 0.4 dollars/kg in Yiluo River Basin from 2010 to 2018, we calculated the value of the equivalent coefficients was 352.7 dollars/hm2. ESVs per unit were equal to the equivalent coefficients multiply by the value of the equivalent coefficients. The final equivalent coefficient value of the per-unit ESVs are shown in Table 1.
Finally, the ESVs were obtained by multiplying the area of each land use/cover category by the corresponding equivalent coefficient value. The calculation formula is as follows:
ESV =   U i × V i ,
V i = j = 1 n E S V i j ,
where ESV refers to the values of ecosystem service, U i represents the area of the land use/cover type i ecosystem, V i is the ESV of land use/cover type i ecosystem, and E S V i j is the j kind of ESV of land use/cover type i.

2.5. FLUS Model Simulation and Validation

We used the FLUS model to simulate the future land use/cover, which was a comprehensive model for land use/cover simulation by coupling anthropogenic and non-human effects (free obtained at http://www.geosimulation.cn/flus.html (accessed on 12 October 2008 to 12 October 2023) [41]. This model based on the Cellular Automata (CA) theory, but with great perfections over the conventional CA, makes land use/cover simulation with higher accuracy, and more convenient and efficient [42,43,44].
Considering the availability, quantification, and correlation of the data, we selected a total of nine driving factors, including the DEM, slope, aspect, population density, GDP, historical temperature and precipitation, distance to roads, and distance to the railway. Moreover, the resolution of driving factors, the number of grid rows, and the cell size were kept consistent.
The model simulation and validation steps were as follows. Firstly, based on the land use/cover data in 2010, we calculated the land use/cover adaptability probability, then simulated the land use/cover in 2020 by using the improved CA simulation function. The simulation result was verified with the actual data in 2020. The Kappa coefficient was 0.82, which indicated that the simulation accuracy was high, and the FLUS model can better simulate the spatial distribution of land use in the Yiluo River Basin. Secondly, based on the land use/cover data in 2020, the driven factors of historical temperature and precipitation, which are liable to change a lot, were replaced by temperature and precipitation data in 2030. Moreover, the other driving factors were assumed to be maintained as continually consistent. In this setting, we simulated the land use/cover distribution in 2030 under future scenarios of RCP2.6, RCP4.5, and RCP8.5.

3. Results

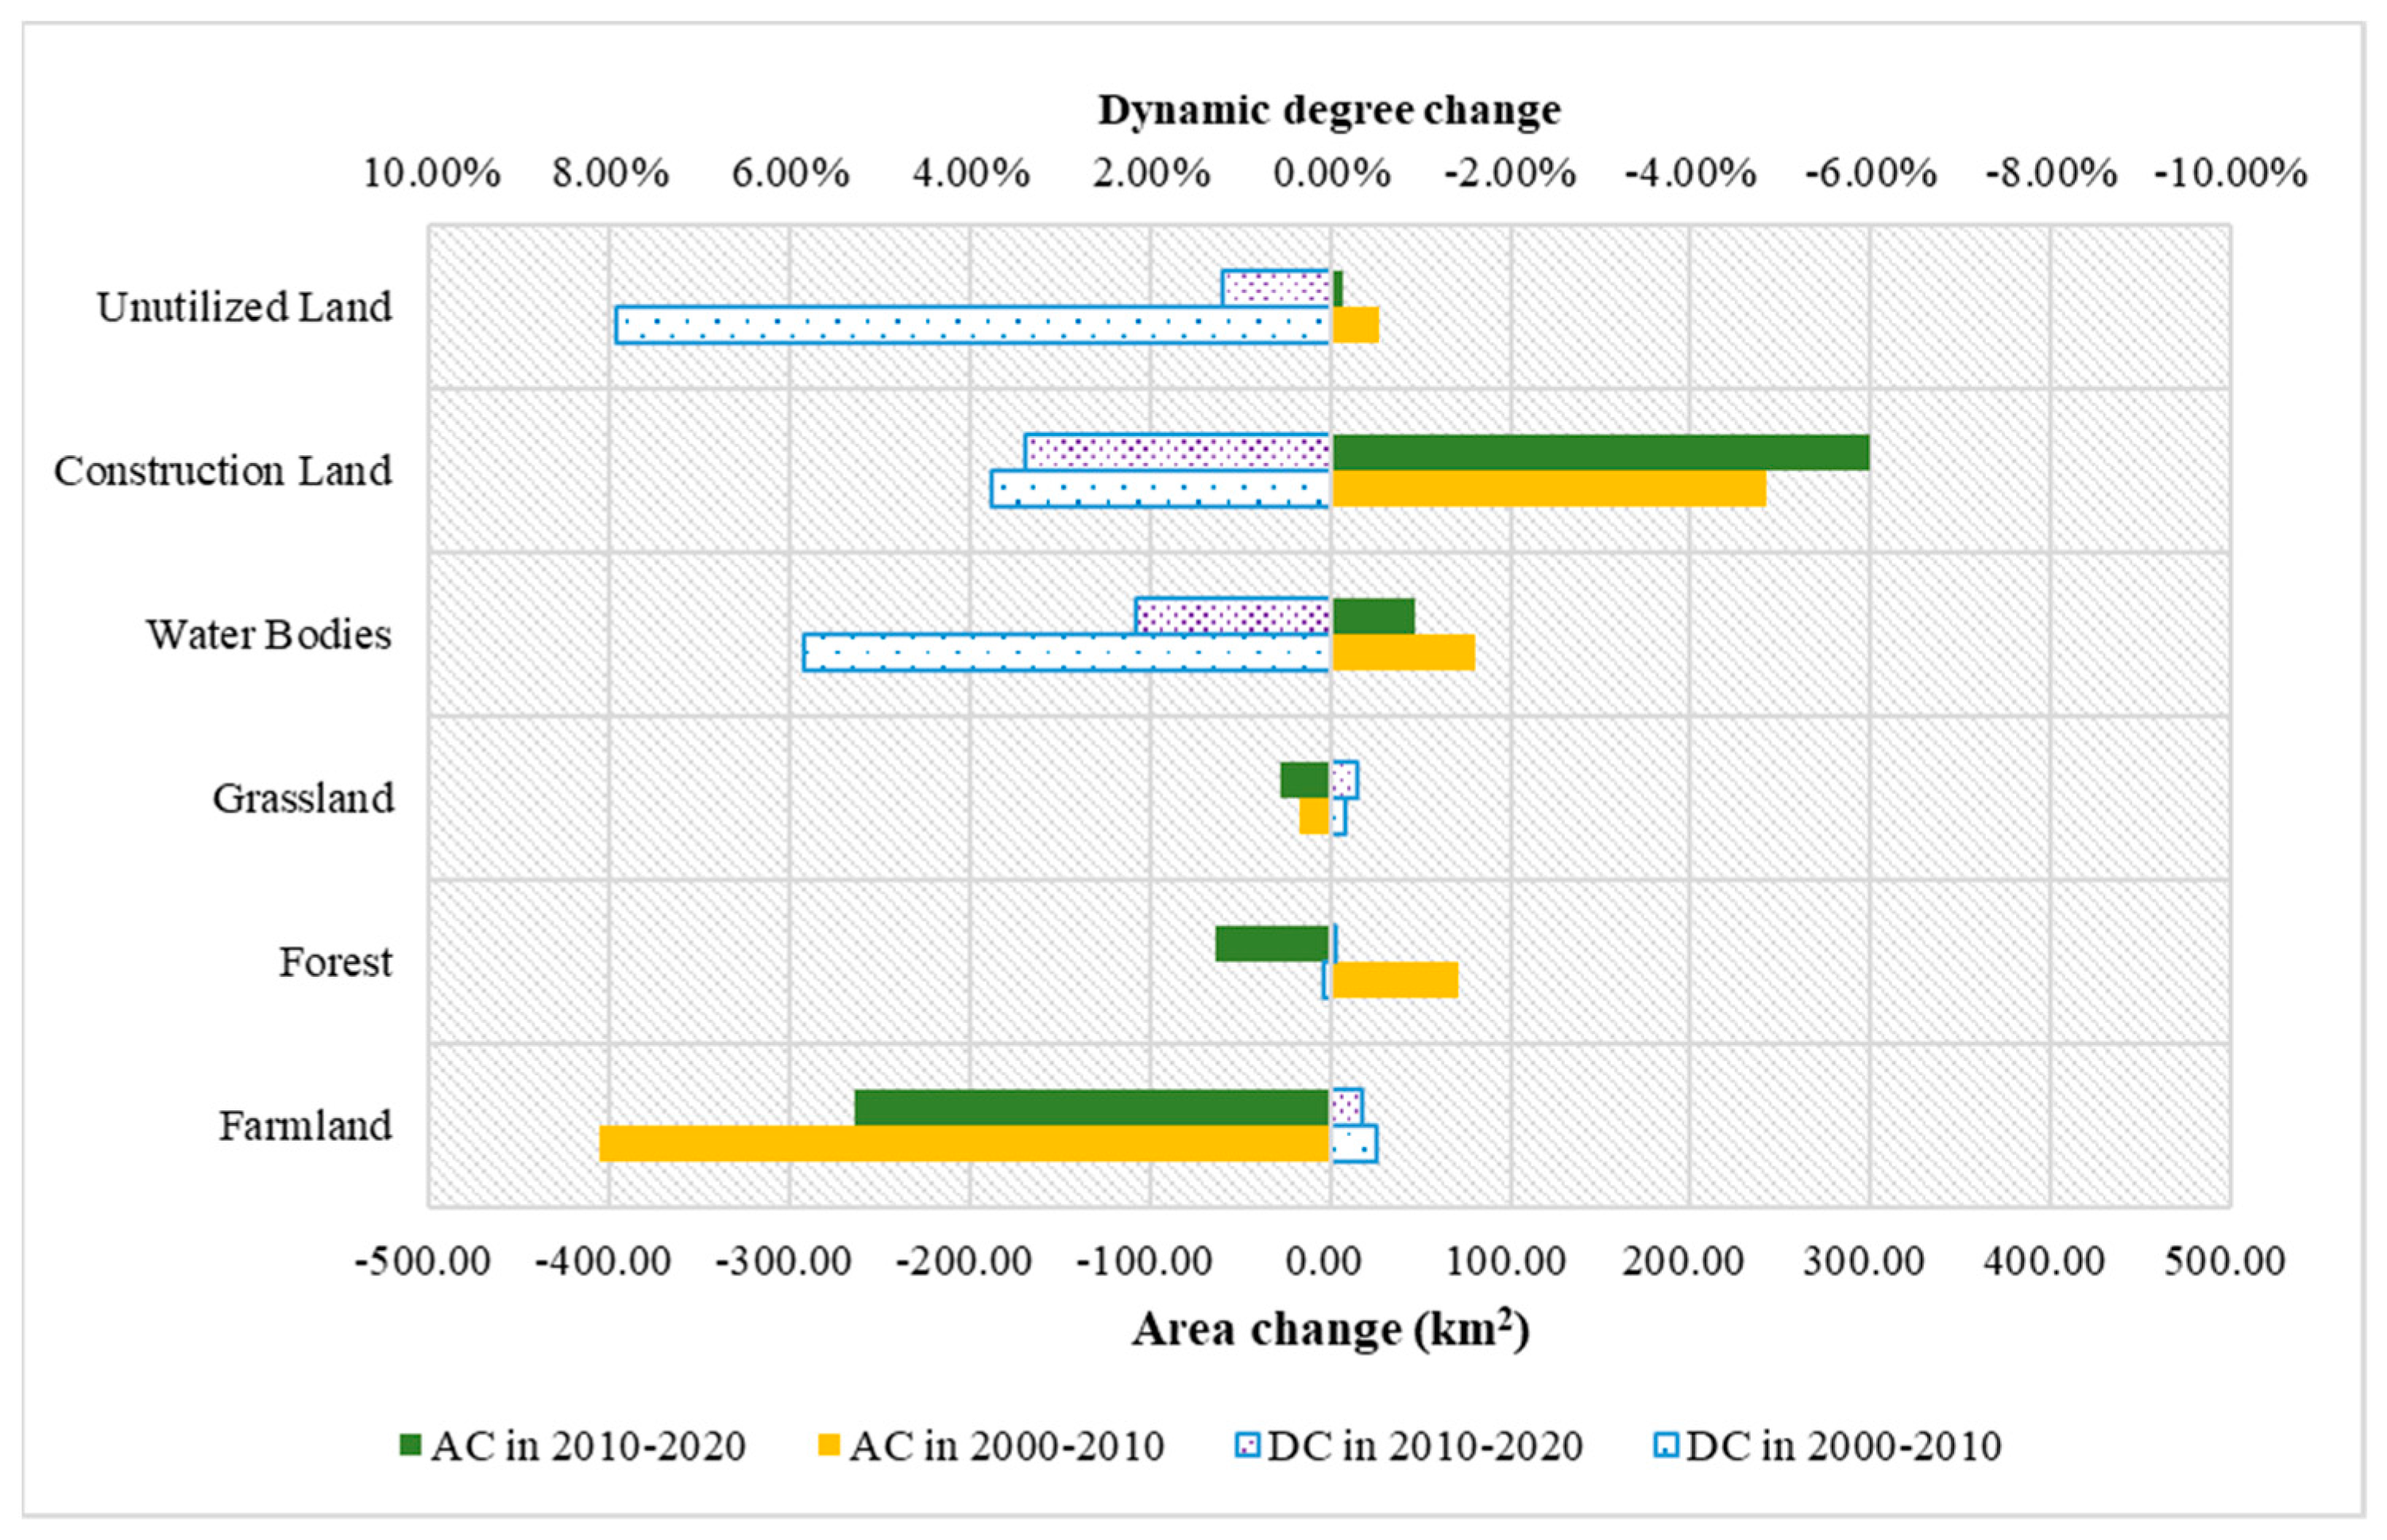
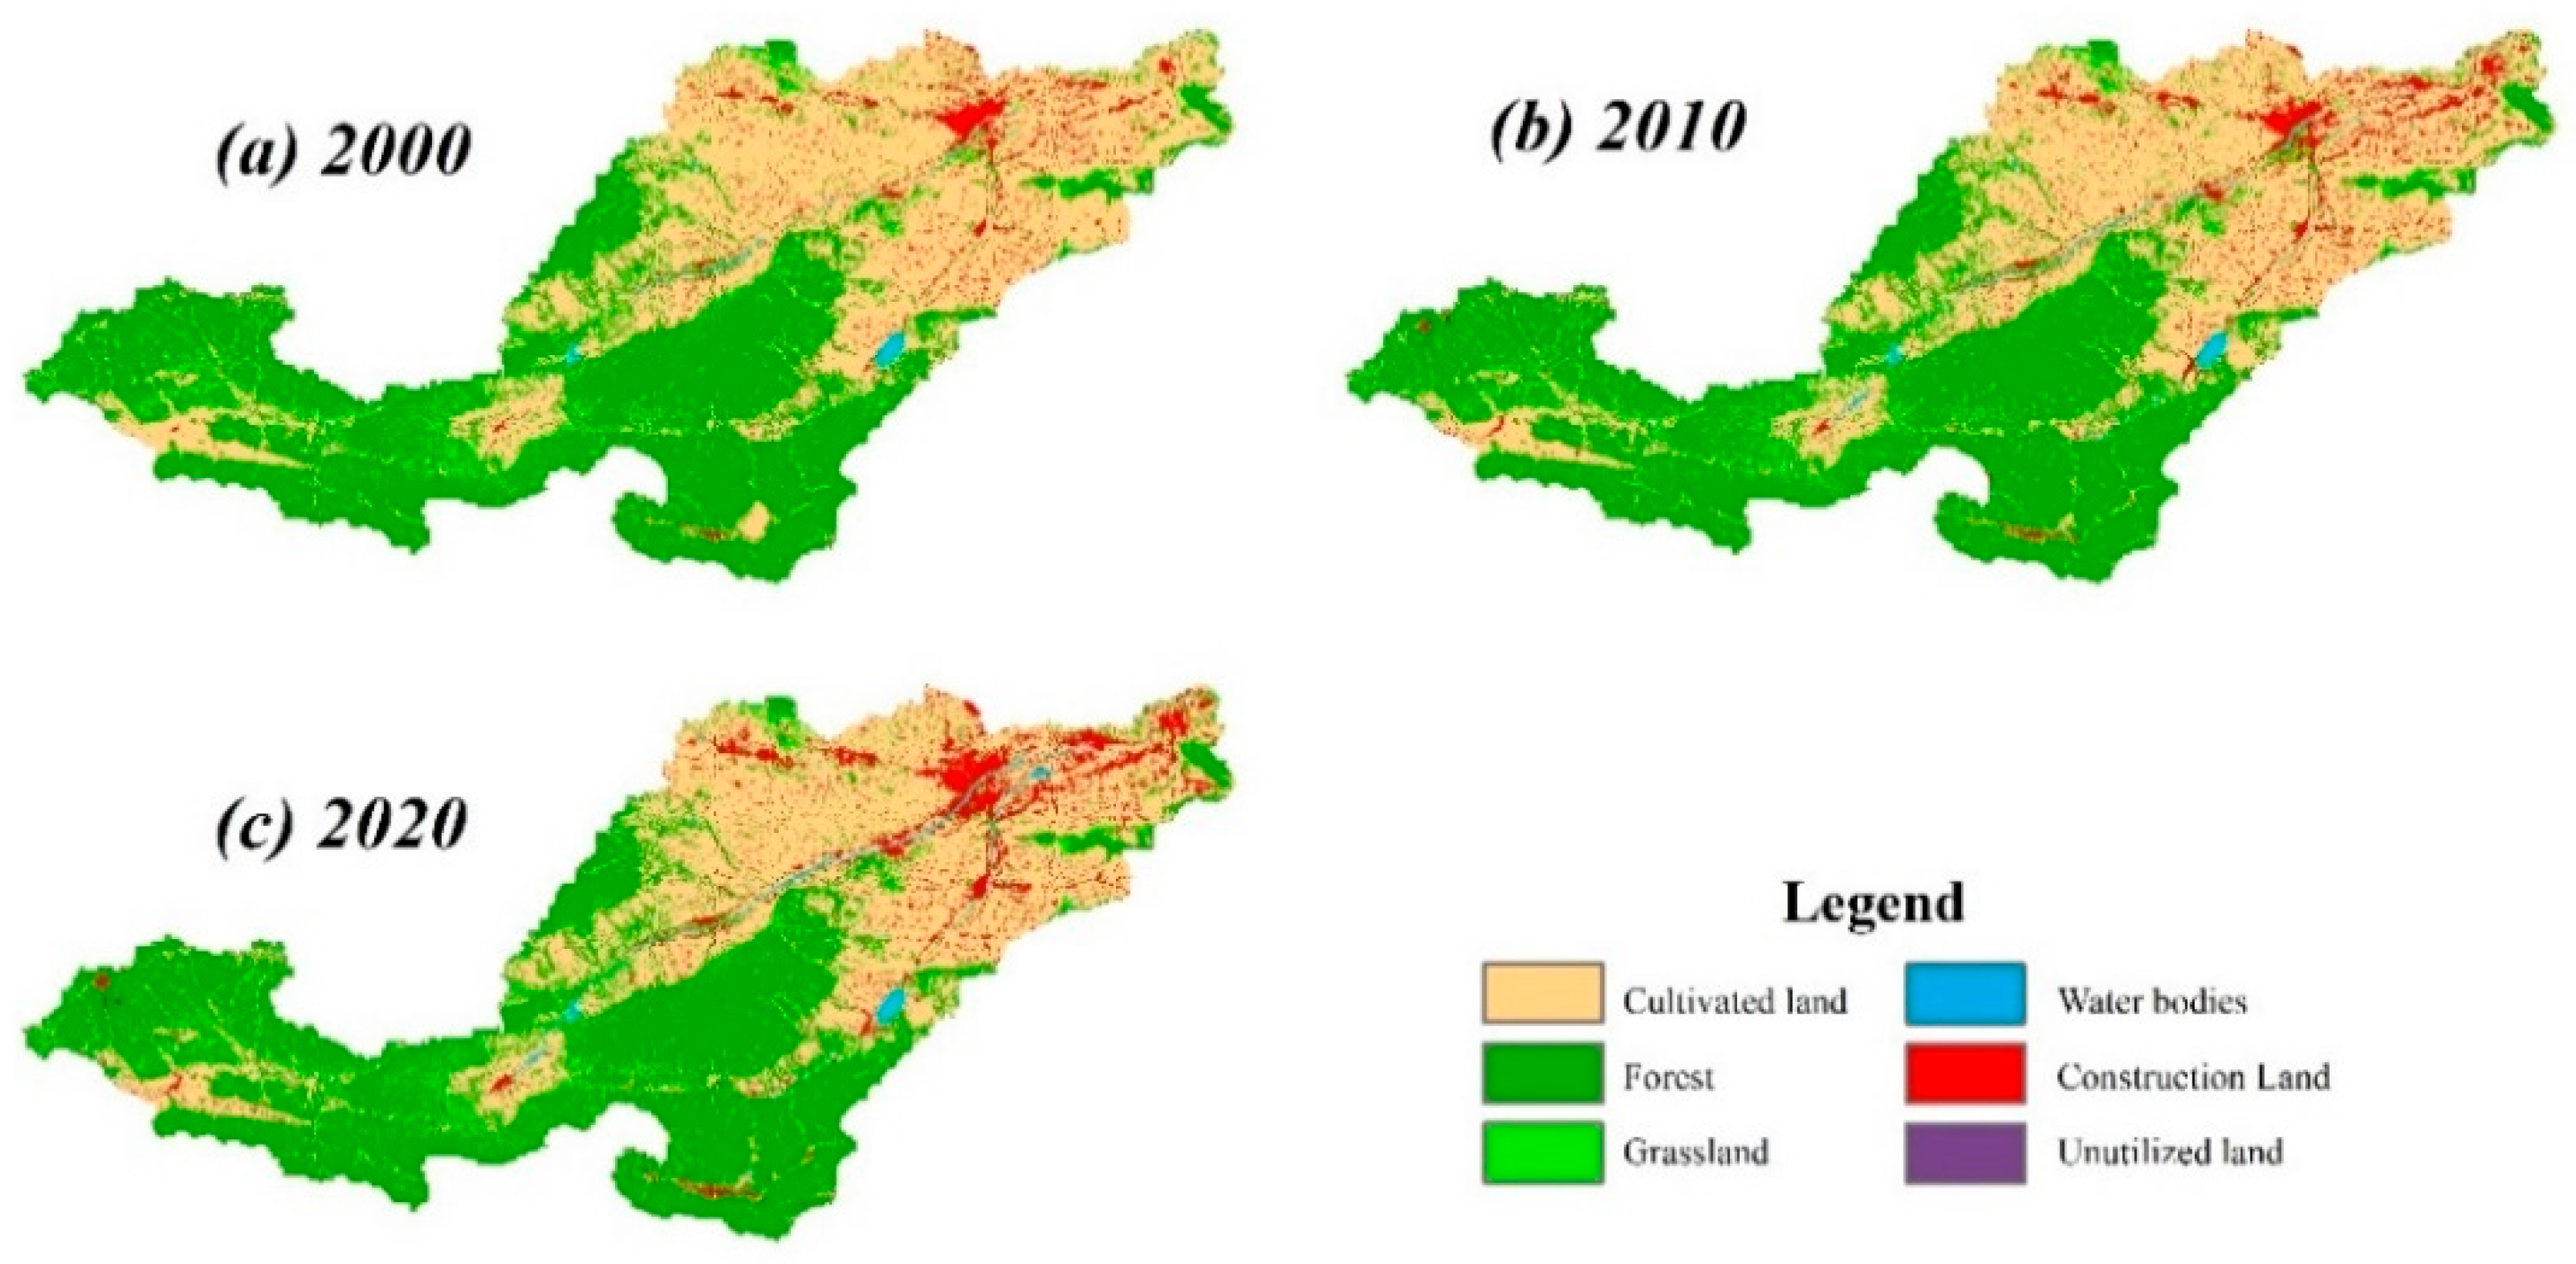
3.1. Land Use/Cover Change during 2000–2020

3.1.1. Temporal Analysis of Land Use/Cover Change

According to the historical land use/cover information, we analyzed the changing trend of land use/cover in the Yiluo River Basin from 2000 to 2020 (Figure 3). The land use/cover types mainly constituted of farmland and forestland of the basin, accounting for more than 38% and 48%, respectively, followed by grassland and construction land, while water bodies and unutilized land account for a smaller proportion.
Figure 4 showed the change of land use/cover area and a dynamic degree from 2000 to 2020. The results showed that the area of farmland and grassland decreased, while the other land use/cover types increased, and the comprehensive dynamics degree was 0.39 from 2000 to 2020, of which the dynamic degree in 2000–2010 was higher than in 2010–2020. In recent years, the proportion of cultivated land showed a continuous downward trend, the area decreased by 668.99 km2 and the dynamic degree was −0.86%. The area of forestland initially increased and then decreased, increasing by 8.06 km2 while the dynamic degree was 0.01%. The grassland experienced a sustained slow decrease, decreasing by 43.77 km2 while the dynamic degree was −0.47%. Water bodies and unutilized land with the highest dynamic degree of 9.27% and 10.05%, respectively, and the area increased by 127.55 km2 and 34.48 km2, respectively. The area of construction land showed a sustained increasing trend, raised from 643.06 km2 in 2000 to 1185.73 km2 in 2020, increasing by 542.67 km2, while the dynamic degree reached 8.44%.

3.1.2. Transformation Patterns of Land Use/Cover Types

Figure 5 showed the locations of transformation distribution of land use/cover types in the Yiluo River Basin from 2000 to 2020, in which Figure 5a showed the land patterns in 2000 and Figure 5b showed the land patterns in 2020. As showed in the figure, the conversion area in the Yiluo River Basin reached 2334.98 km2 from 2000 to 2020, which were mainly cultivated land, forestland, and grassland, accounting for 49.1%, 23.5%, and 15.7%, respectively. Among them, the cultivated land loss was about 1146.47 km2, which was mainly transformed into construction land (586.58 km2), forestland (278.54 km2), and water bodies (197.74 km2). Forestland was reduced by 548.77 km2, mainly transformed into farmland (284.09 km2), grassland (197.74 m2), and construction land (38.2 km2). About 367.63 km2 of grassland area was transformed, mainly converted into cultivated land (47.29 km2), water bodies (254.95 km2), and construction land (44.18 m2). Water bodies, construction land, and unutilized land were rarely converted to other land use/cover categories, while the increase was mainly converted from cultivated land, forestland, and grassland.

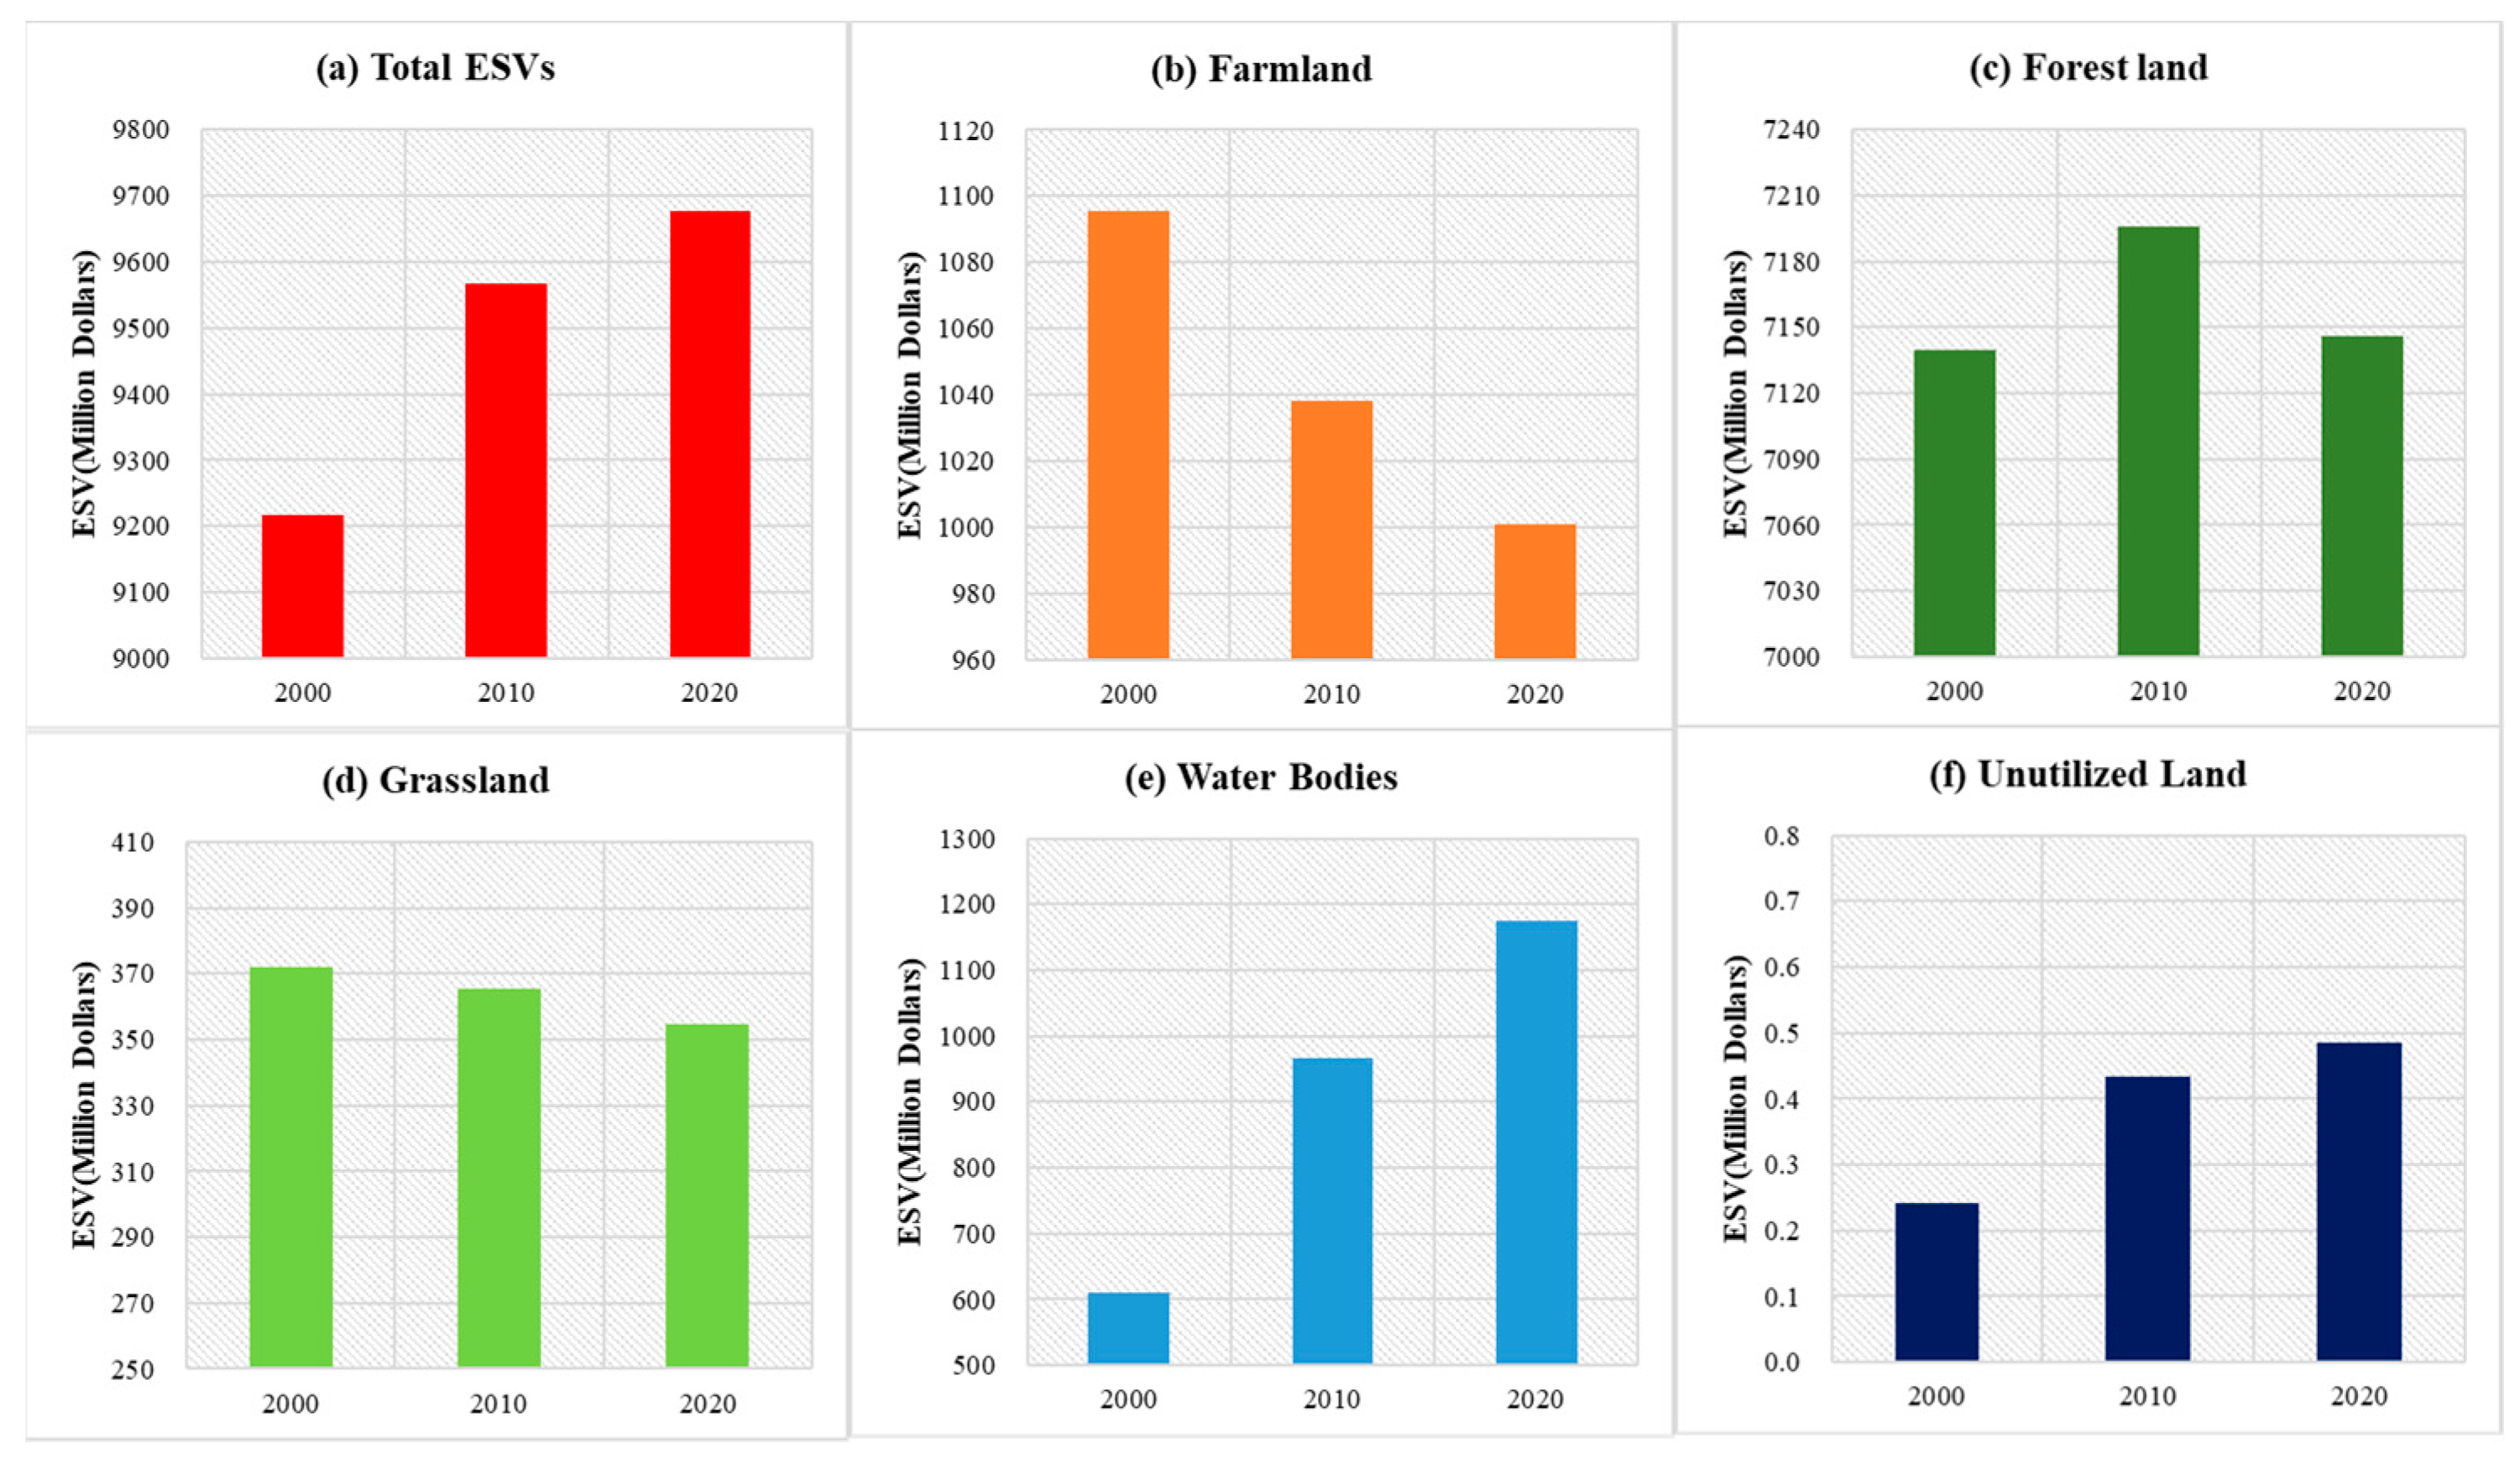
3.2. Changes in Ecosystem Service Values during 2000–2020

3.2.1. Changes in Ecosystem Service Values of Different Land Use/Cover Type

The ESVs for each land use/cover type and the total values for each study year were shown in Figure 6. The total ESVs of the Yiluo River Basin presented a growth from 9217 million dollars (2000) to 9676 million dollars (2020), with an increase of 4.98%. Among them, an increase of 350 million dollars from 2000 to 2010, and 110 million dollars from 2010 to 2020. The ESVs provided by different land use/cover categories were different. Forestland accounted for the most, more than 75% of the total ESVs, followed by the cultivated land, grassland, and water bodies, the unutilized land contributed the least. From 2000 to 2020, cultivated land and grassland decreased by 95 million dollars and 18 million dollars, respectively. Water bodies raised the most, increasing by 565 million dollars. The forestland and unutilized land were also increased.

3.2.2. Changes in Different Ecosystem Service Values

During all periods, the value of regulating services contributed the greatest proportion at more than 77%, followed by supporting services and providing services, while cultural services accounted for the least of the total ESVs (Table 2). From 2000 to 2020, regulating services and supporting services showed an increasing trend, while cultural services and providing services changed slightly with the characteristics of initially increasing and then decreasing. In the light of the ecosystem service sub-types, climate regulation accounted for most of the total ESVs, second was regulation of water flows, erosion prevention, air quality regulation, fertility habitat services, waste treatment, cultural and amenity services, raw material supply, and food supply. In contrast, maintenance of soil and water supply contributed the least. Water supply, waste treatment, regulation of water flows, and cultural and amenity services showed an increasing trend, while the other ecosystem service sub-types reduced in the whole period.

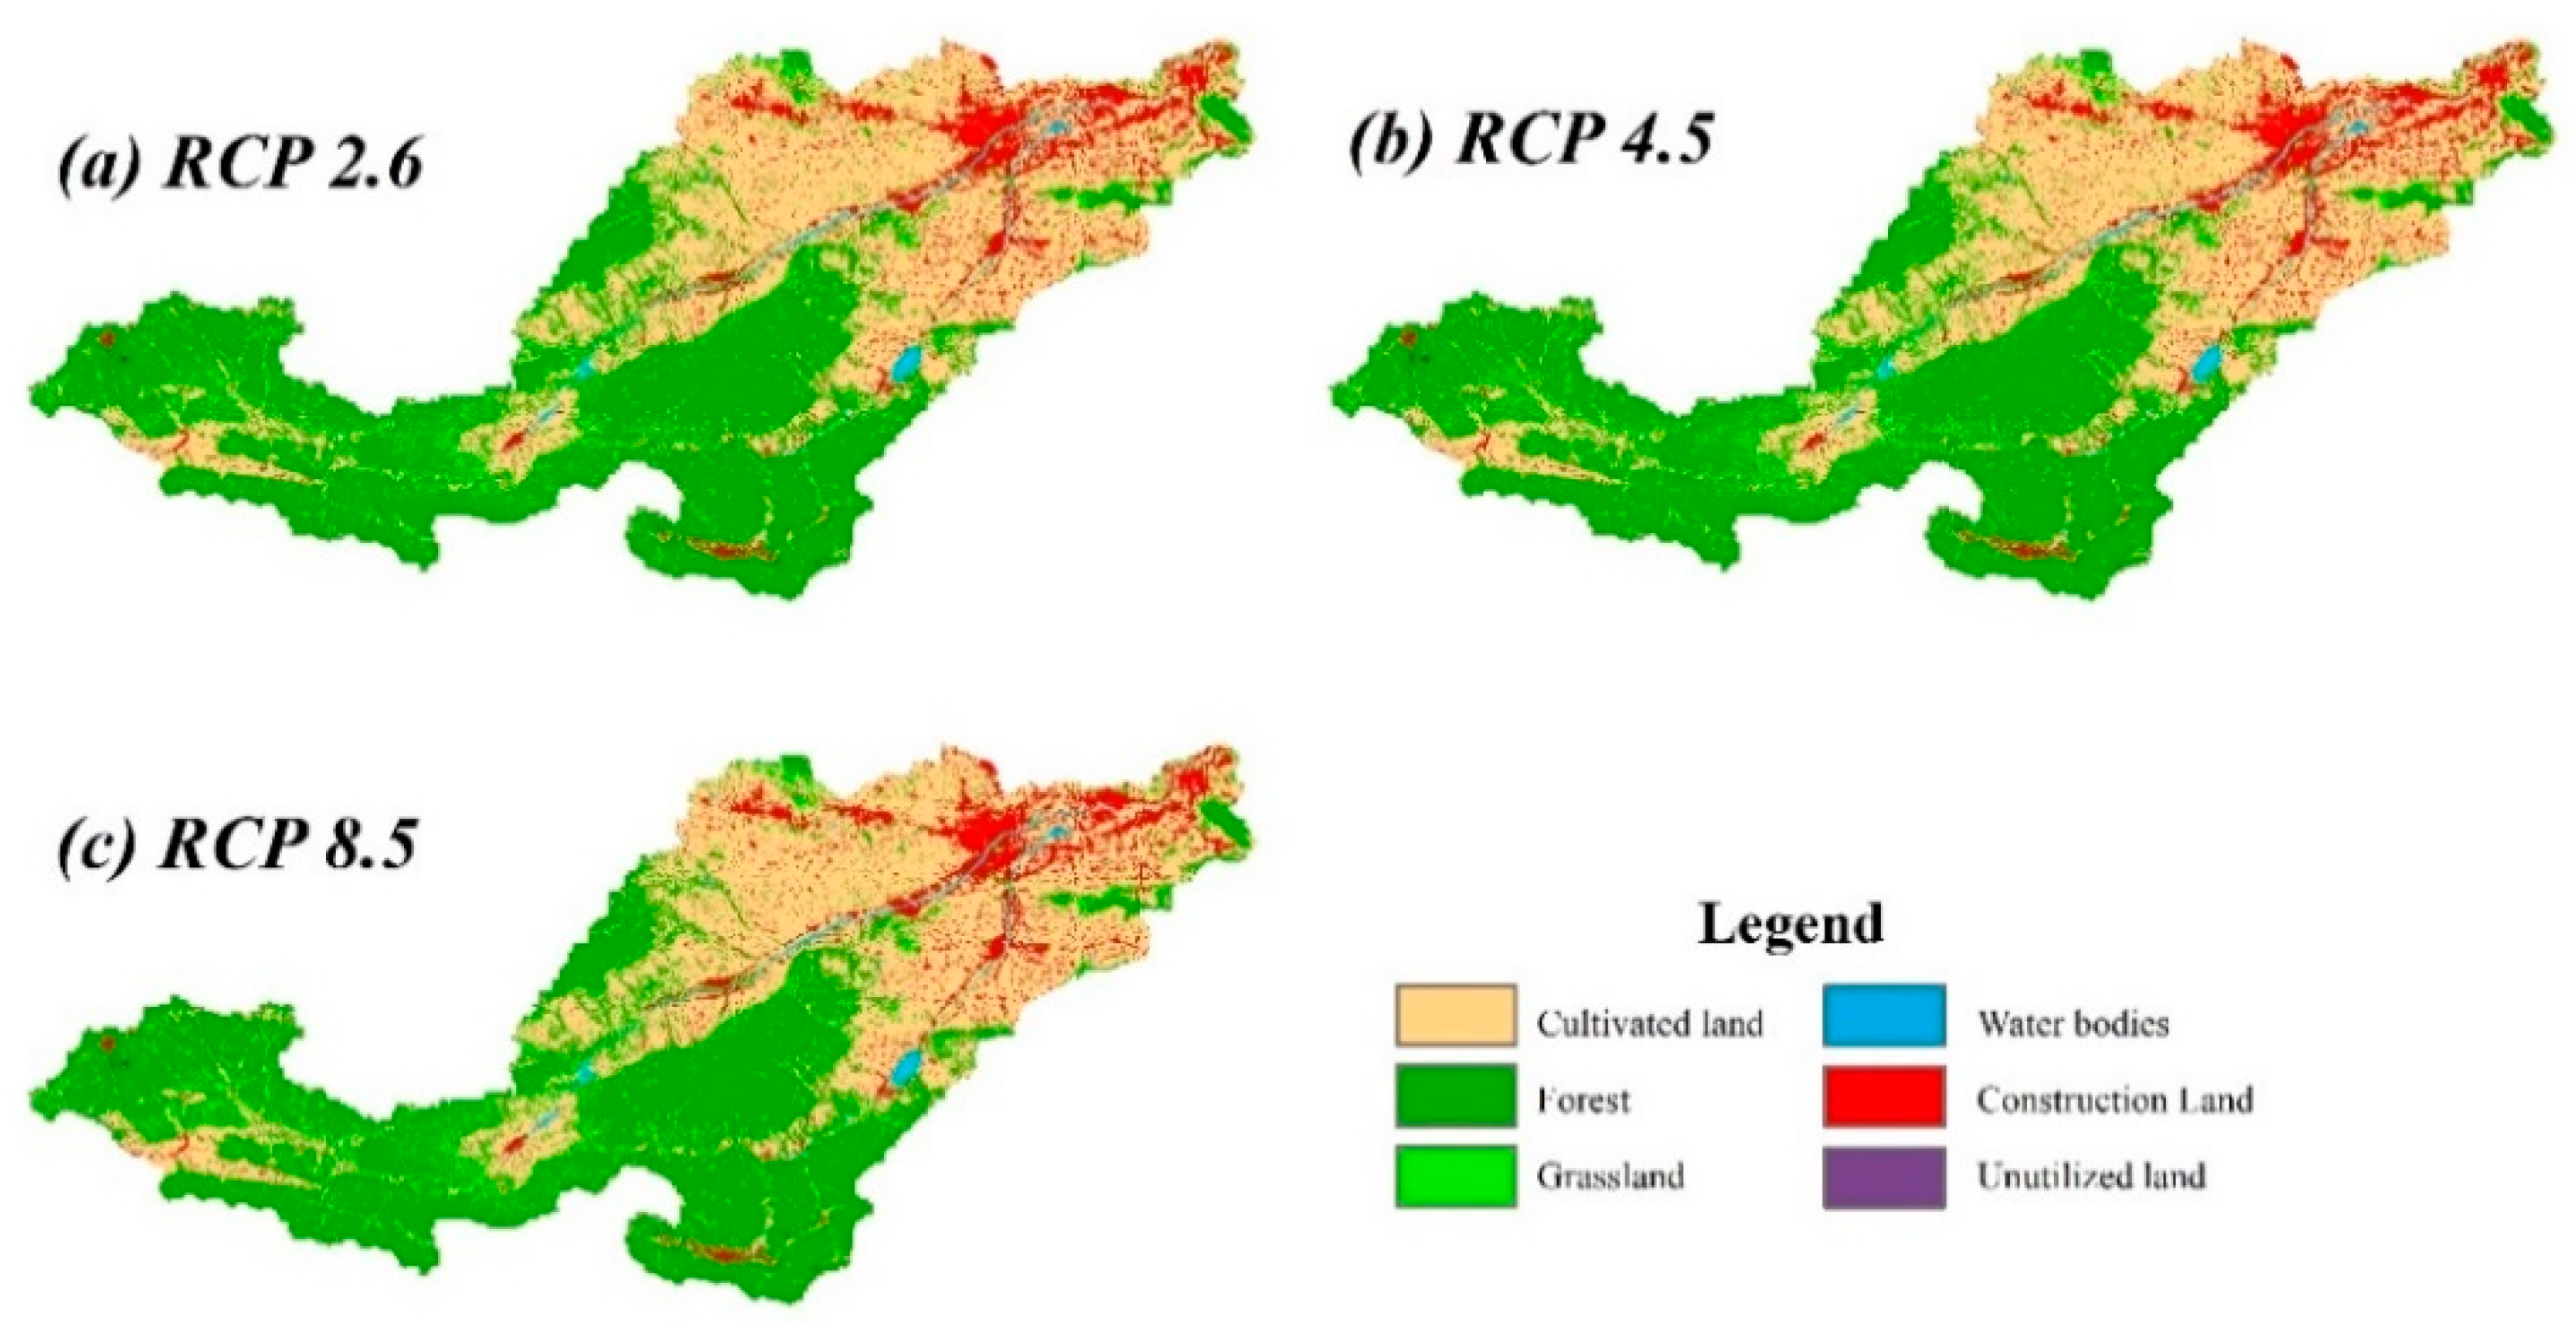
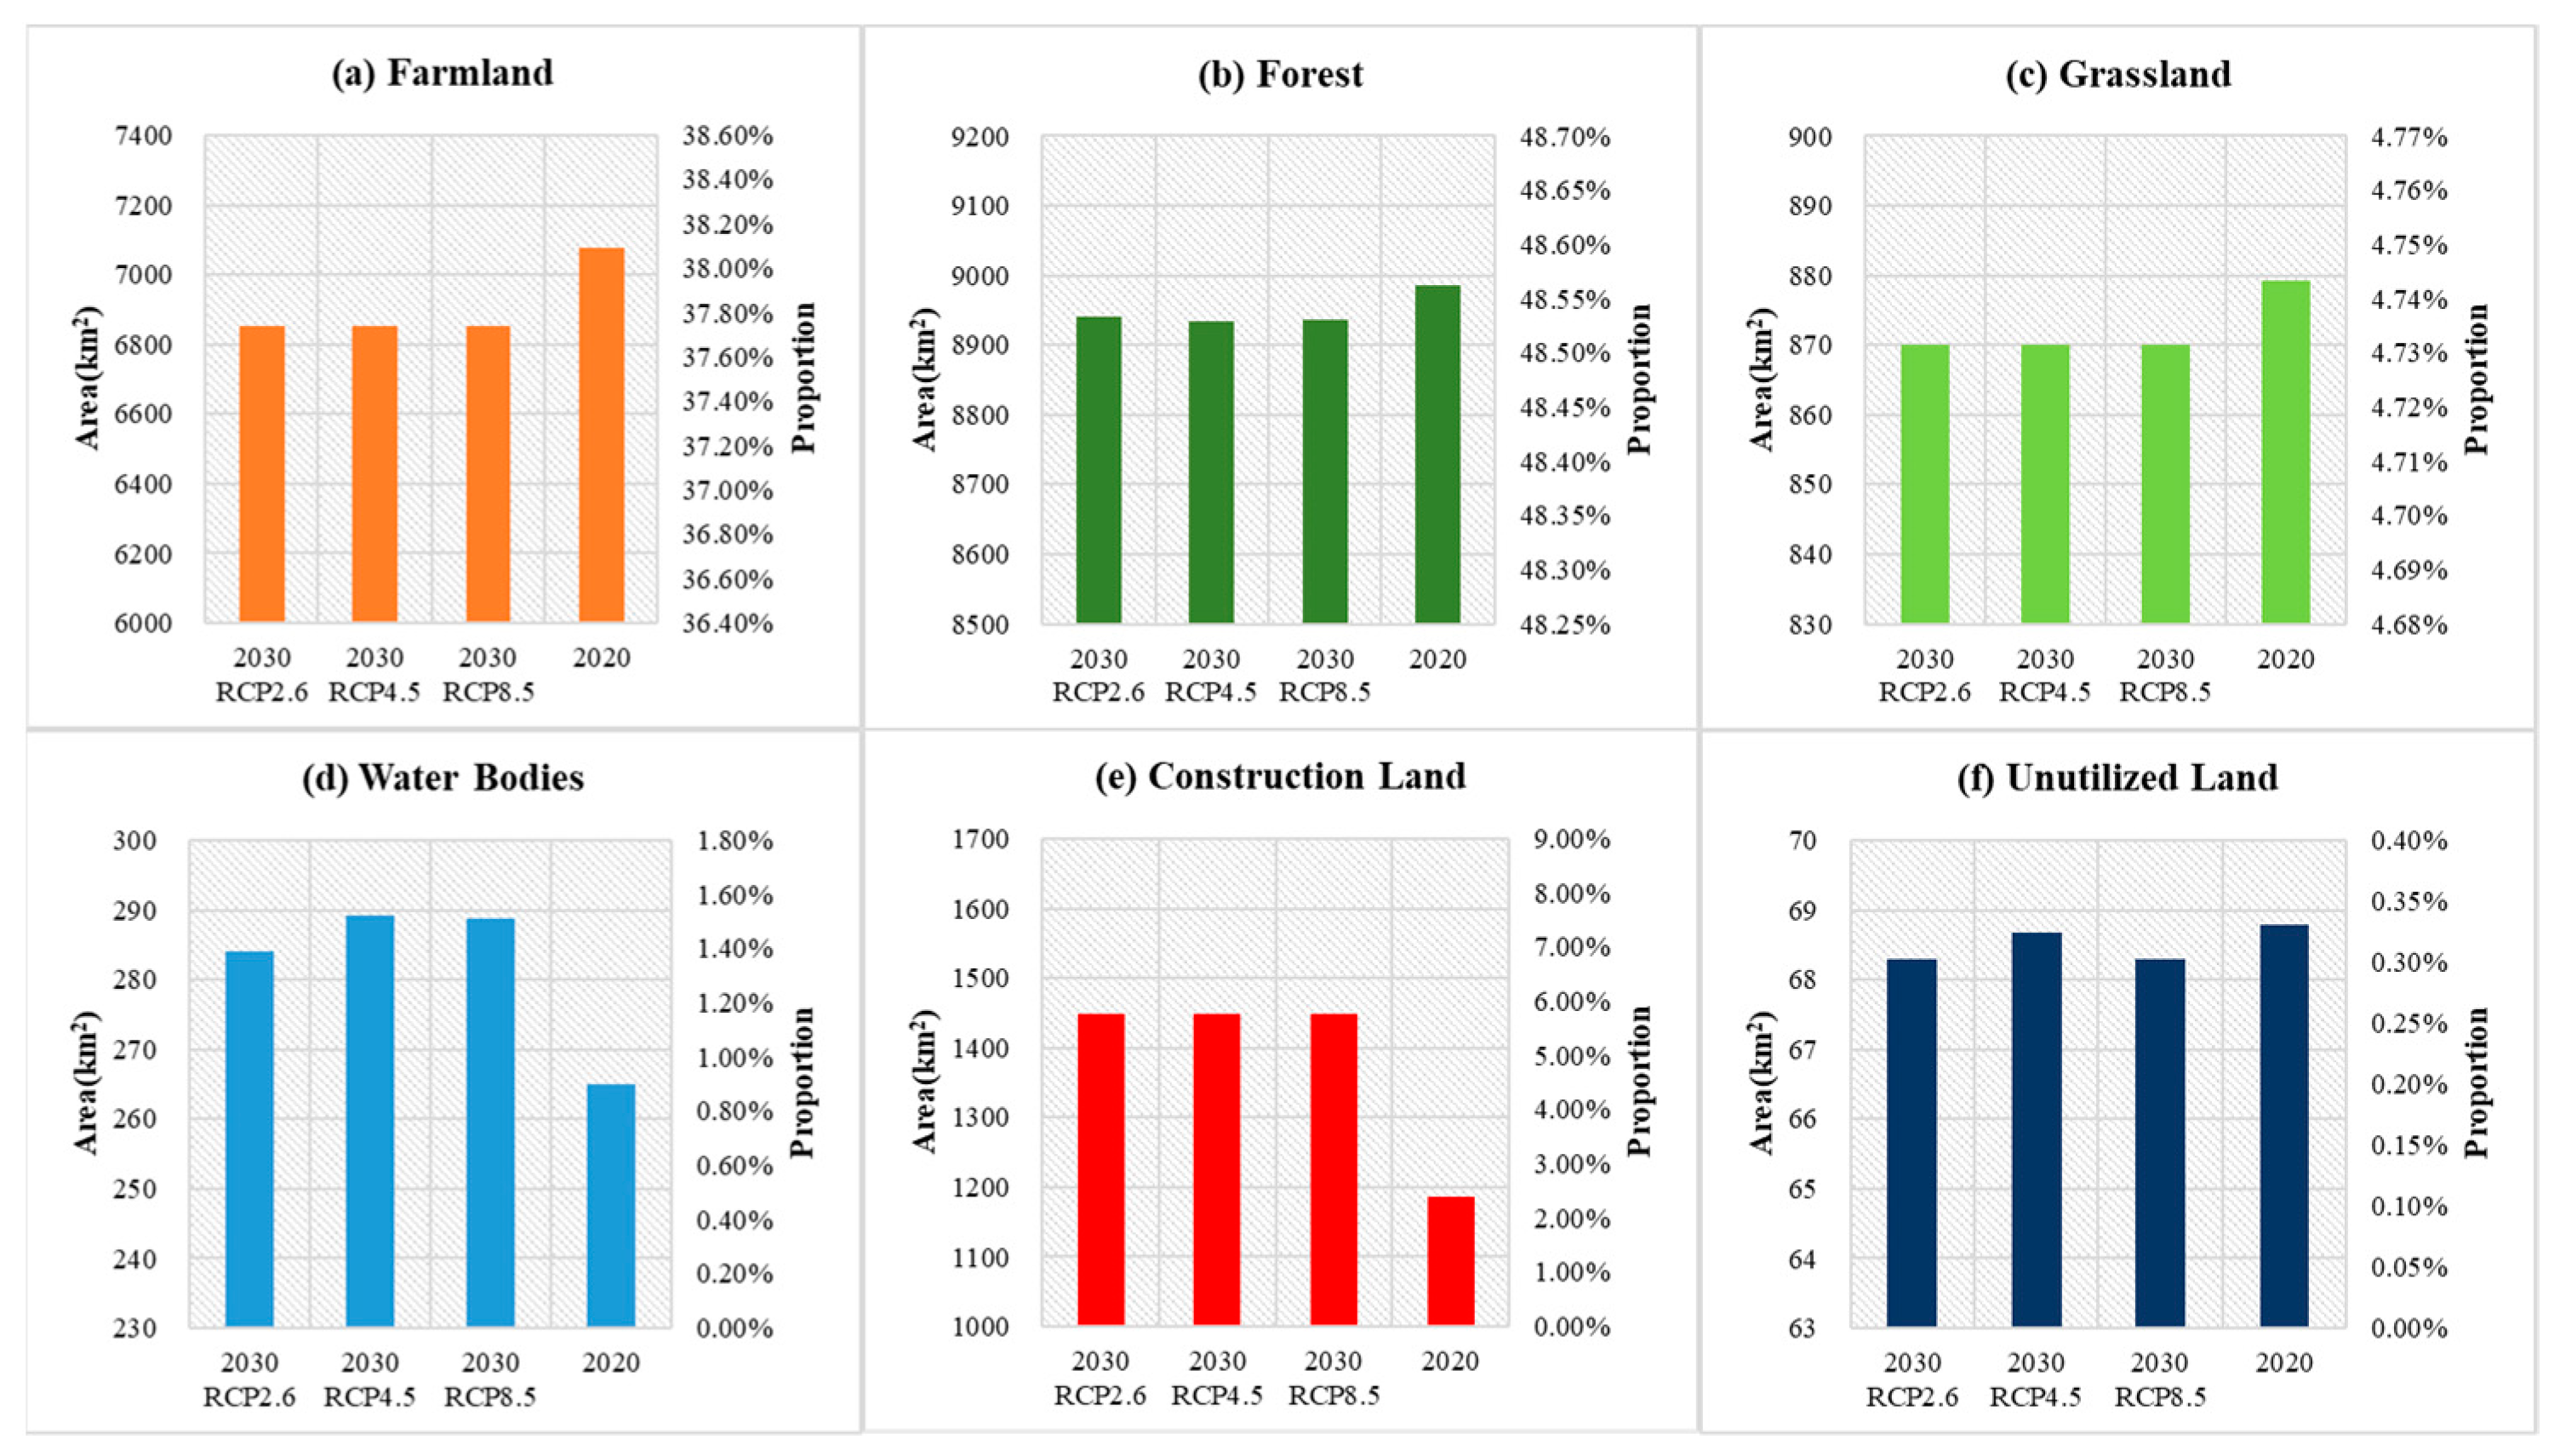
3.3. Future Changes in Land Use/Cover and Ecosystem Service Values under Different RCPs Scenarios

3.3.1. Future Changes in Land Use/Cover under Different RCPs Scenarios

The land use/cover distribution in the Yiluo River Basin by 2030 under different RCPs scenarios were shown in Figure 7 and Figure 8. Compared with 2020, the area of each land use/cover type was obviously different in 2030, the cultivated land, forestland, grassland, and unutilized land decreased, while the waters and residential sites increased. Under different RCPs scenarios in 2030, the spatial patterns of farmland, grassland, residential sites, and bare land in the Yiluo River Basin were basically the same, while the forestland and water bodies were different. In RCP2.6, forestland decreased by 45.1 km2, water bodies increased by 18.91 km2. While in RCP4.5, forestland decreased by 50.73 km2, water bodies increased by 24.2 km2. Under RCP8.5, forestland decreased by 49.88 km2, water bodies increased by 23.67 km2.

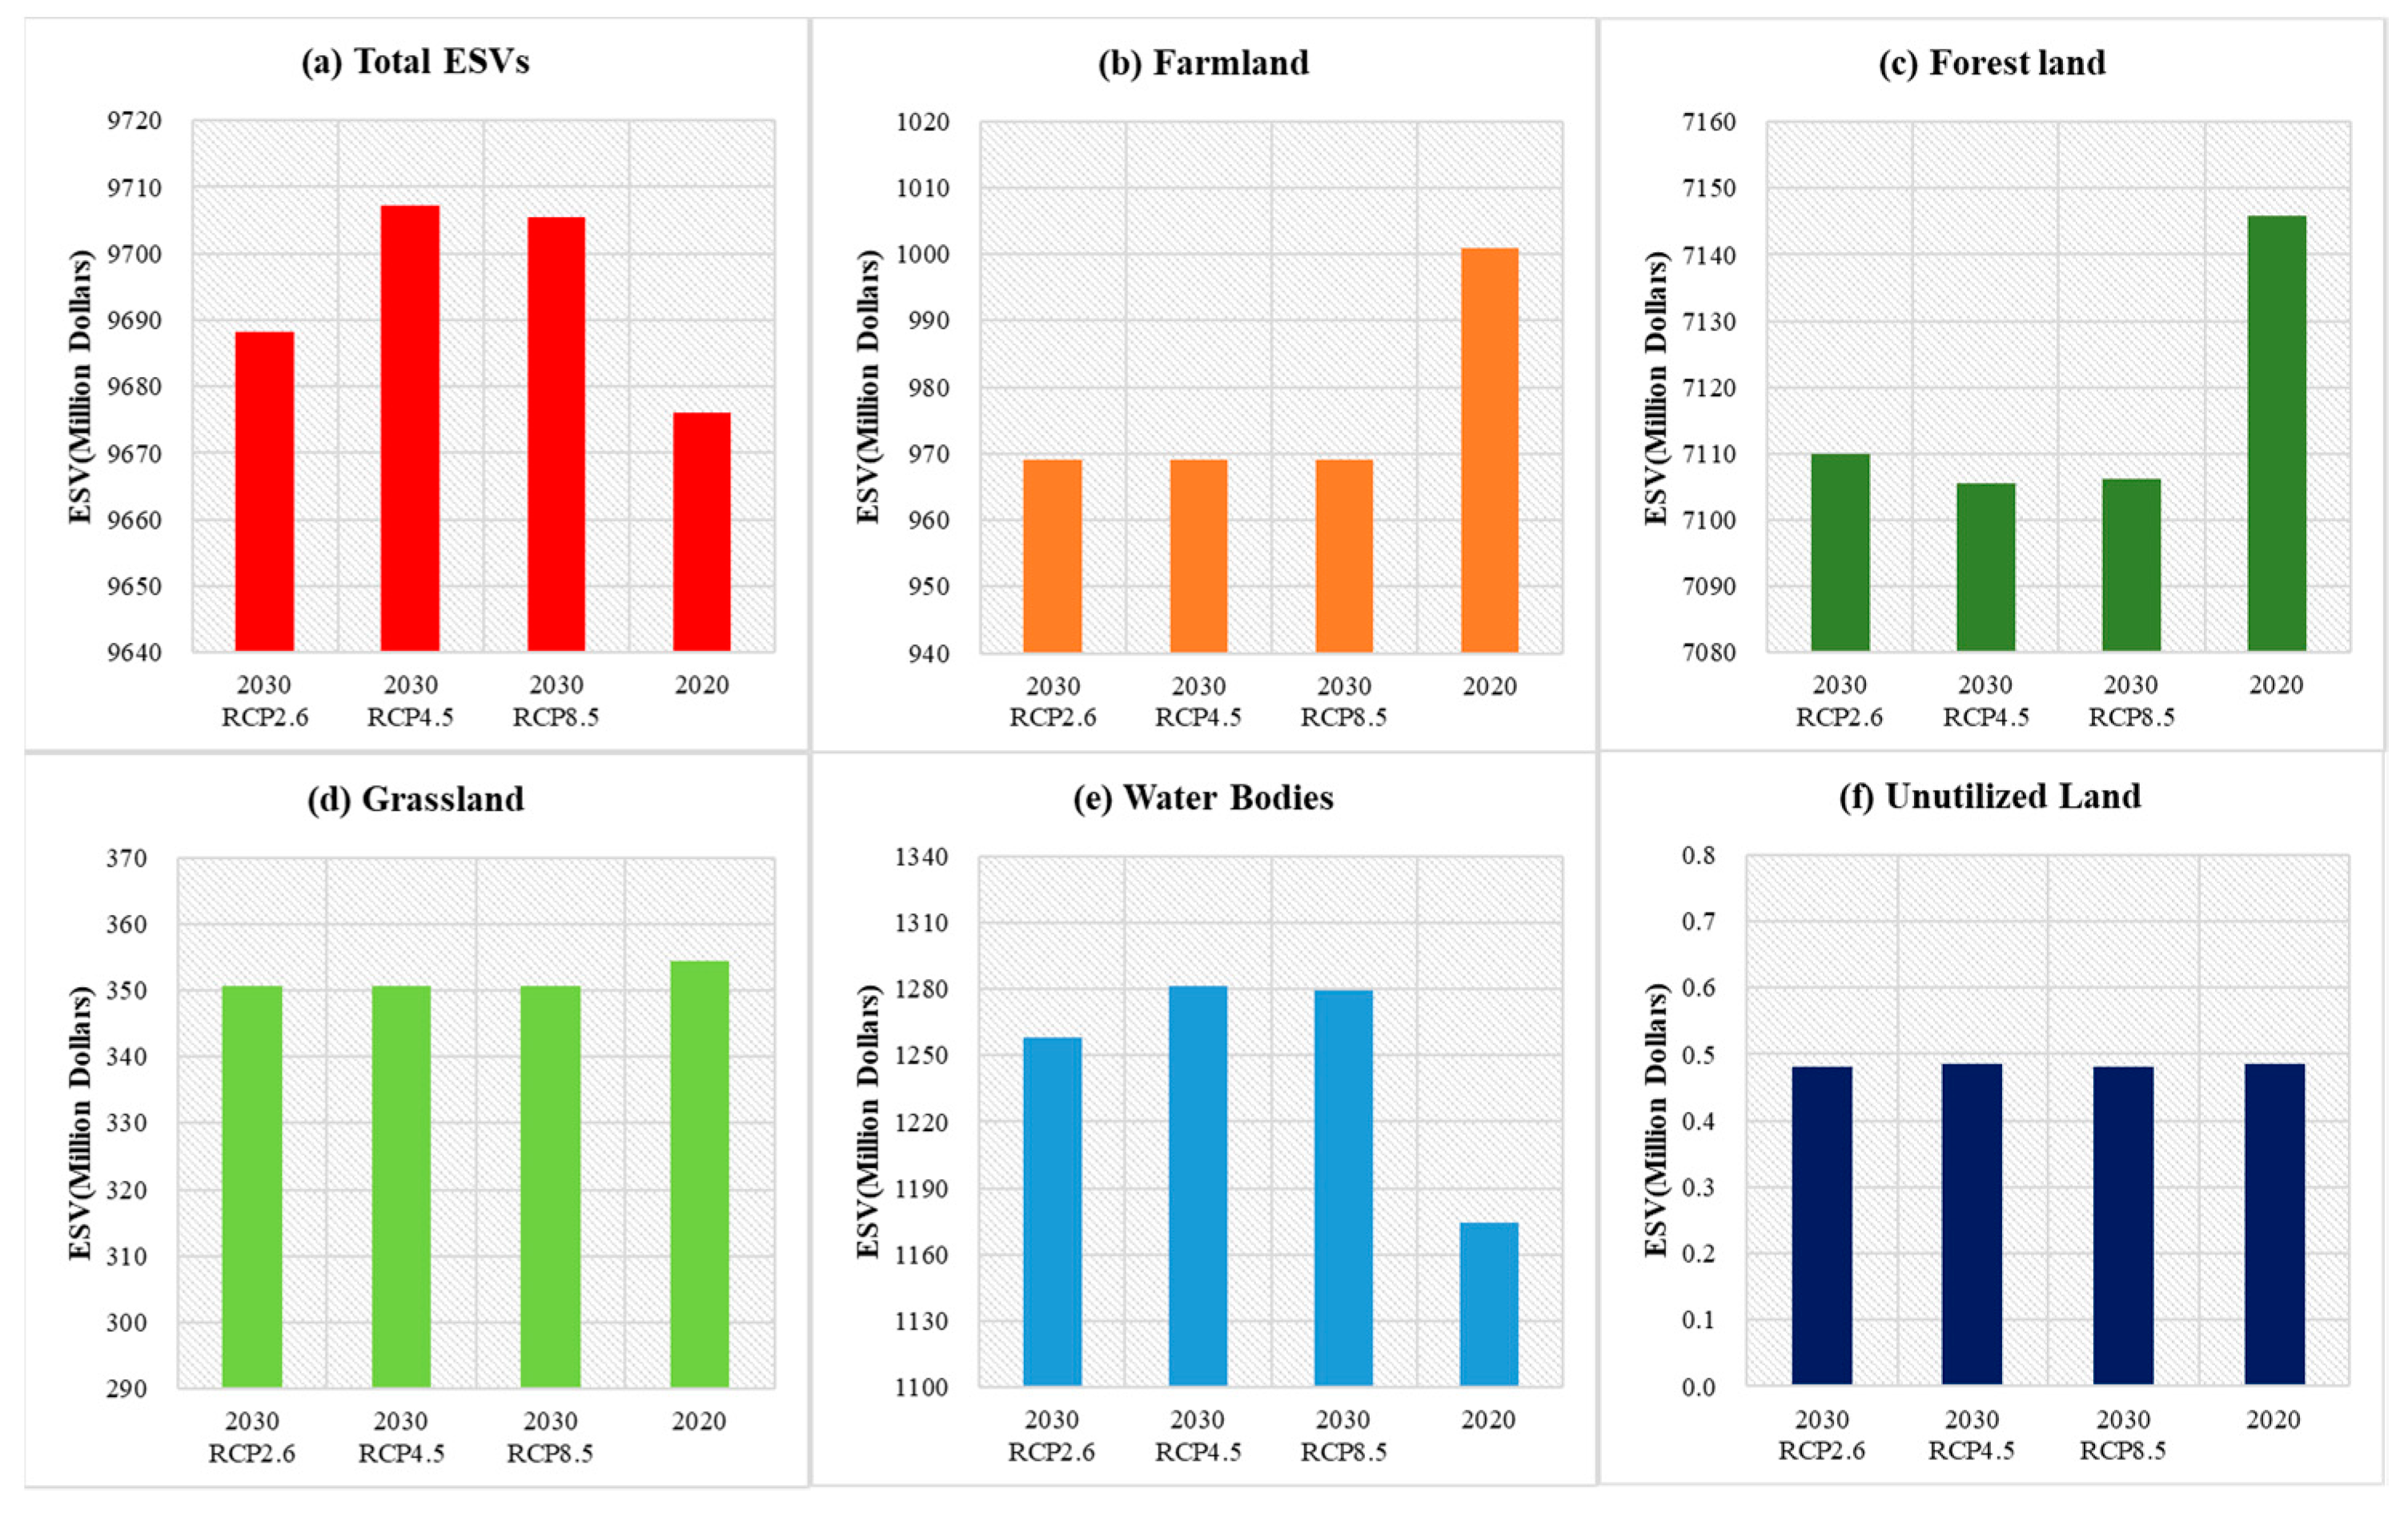
3.3.2. Future Changes in Ecosystem Service Values under Different RCPs Scenarios

The ESVs changes in Yiluo River Basin by 2030 affected by different RCPs scenarios were shown in Figure 9. By 2030, the total ESVs continued to present an upward trend, while the total ESVs showed a difference under the scenario of RCP2.6, RCP4.5, and RCP8.5, with 9688 million dollars, 9707 million dollars, and 9705 million dollars, respectively. Compared with those in 2020, the ESVs increased by 12 million dollars, 31 million dollars, and 29 million dollars, respectively. In terms of the land use/cover types, the ESVS of farmland and grassland were the same under the scenario of RCP2.6, RCP4.5, and RCP8.5, which decreased by 32 million dollars and 4 million dollars, respectively. While there were differences in the ESVS of woodland and water bodies, the woodland decreased by 36 million dollars, 40 million dollars, and 39 million dollars, respectively, and the water bodies increased by 84 million dollars, 107 million dollars, and 105 million dollars, respectively. The ESVs of unutilized land showed no obvious change trend.
Table 3 showed the ESVs of ecosystem service types in the Yiluo River Basin under different RCPs scenarios. According to the type of ES, the values of the regulating services under the scenario of RCP2.6, RCP4.5, and RCP8.5 showed some difference, with 7569 million dollars, 7587 million dollars, and 7585 million dollars, respectively, while provisioning services, supporting services, and cultural services had no obvious changes. In the light of the ecosystem service sub-types, there were significant changes in water supply and regulation of water flows, while there were small changes in ESVs of other ecosystem service sub-types.

4. Discussion

In the past 20 years, the land use/cover in Yiluo River Basin had been undergone great changes, which were mainly shown in the decrease of farmland and grassland, and the increase of forestland, water bodies, construction land, and bare land. All of these changes were mainly due to climate change and human activities.
According to the Statistical Yearbook of Luoyang, the population of Luoyang has increased by 1 million in the past 20 years, and the GDP of Luoyang has increased from 6.57 billion dollars (2000) to 78.21 billion dollars (2019). Urban development and population growth led to a large number of productive space (cultivated land) and ecological space (forestland, grassland, and water bodies) encroachment by construction land expansion [45,46]. The Yiluo River Basin is a significant tributary in the Yellow River, which belongs to the key ecological function area. The government had taken the Grain for Green Project and achieved good results. Simultaneously, public awareness of the protection of forest resources has increased and deforestation has decreased, these measures increased the area of forestland [37,47]. In addition, some reservoirs and rubber dams have been built in the basin in recent years, for example, multi-level water surface engineering in Luoyang city (14 km), Jinniuling reservoir (storage capacity: 23.8 million m3). Synchronously, some protection measures of the water bodies have been taken in the basin to restore the water area, for example, unified water management forbidding occupying river courses. All of these engineering and measures lead to the increase of water area directly.
Over the past 20 years, climate change was remarkable in Yiluo River Basin. Among them, the total precipitation showed no significant increase, but with a characteristic of large inter-annual difference and an increase in the frequency of extreme precipitation events. The temperature had risen by about 0.45 °C/10 a, and the climate showed a warming and drying trend. Studies have shown that climate change will cause changes in temperature and precipitation, which affected the characteristics of soil moisture and temperature, the photosynthesis and water use efficiency of vegetation, regulated the growth of vegetation, and had impacts on land use/cover further [7,8,48,49]. The rise of temperature and the change of precipitation characteristics in the Yiluo River Basin may lead to the decrease of vegetation coverage area [50,51,52,53], which were related to ecological service functions. Based on the land use/cover conversion matrix, some of the forestland and grassland transformed into other land use/cover types may be due to the influence of climate change directly or indirectly.
In the study area, the LUCC had important influences on ESVs. From 2000 to 2010, the total ESVs increased by 350 million dollars, the main reason was because forestland area increased by 0.79%, and water bodies increased by 58.54% in this period. In 2010–2020, the total ESVs increased by 110 million dollars, the growth trend significantly reduced compared to the previous stage. The main reason was that the area of forestland and grassland decreased by 63.25 km2 and 27.25 km2, respectively. Thanks to the water bodies continuing to increase, this made up for the loss and kept the overall ESVs on an upward trend.
According to the future climate model data, the temperature under different RCPs scenarios will be slightly different in the Yiluo River Basin by 2030, but there will be significant differences in precipitation. In comparison, the discrepancy of future precipitation between RCP4.5 and RCP8.5 scenarios is small, which is significantly higher than RCP2.6. The ESVs under the scenarios of RCP2.6, RCP4.5, and RCP8.5 will be 9688 million dollars, 9707 million dollars, and 9705 million dollars, respectively. This discrepancy was mainly reflected in the difference of ESVs between forestland and water bodies. In the future, human activities will aim to minimize the interference of the physical environment, reducing the occupation of ecological land, and carry out green and sustainable development patterns [54]. With the introduction of the ecological protection and high-quality development of the Yellow River basin in the new period, climate change may be the main factors influencing the ecological field in the future.
In this study, we did exploratory research on the prediction and assessment of ESVs in the context of climate variability. We selected three scenarios, RCP2.6, RCP4.5, and RCP8.5, to reduce the uncertainty of the carbon emission scenario. Although the results do not differ much in different scenarios, it is intuitive to witness the impacts of climate change on the ESVs. Moreover, we used the FLUS model to estimate the land use/cover situation in 2030, which was widely used to combine with climate factors to simulate future land use/cover change. However, the model also had some limitations, for example, insufficient simulation on the dynamic evolution of climate change and vegetation, which may affect the accuracy of the simulation results. In the following work, we will carry out our research on the fitting of climate change and ecological evolution, as well as improving the simulation effect and precision of the model.

5. Conclusions

This paper selected the Yiluo River Basin as the study area, analyzed the impacts of LUCC on the ESVs, predicted the future distribution of land use/cover and the change of ESVs in 2030 under different RCPs scenarios. The main achievements were as follows.
(1)
In the past 20 years, the land use/cover, affected by climate change and human activities, in the Yiluo River basin has undergone great changes, which mainly showed that the area of cultivated land had the most loss, the area of construction land increased the most, and water bodies and unutilized land had the highest dynamic degree.
(2)
From 2000 to 2020, the total ESVs increased by 459 million dollars, which attributed to the increase of forestland and water bodies in recent years. Among them, water bodies increased the most, with an increase of 565 million dollars.
(3)
By 2030, the total ESVs continued to present an upward trend compared with 2020, which increase by 12 million dollars, 31 million dollars, and 29 million dollars, respectively under the scenario of RCP2.6, RCP4.5, and RCP8.5, and this discrepancy in different scenarios was mainly reflected in forestland and water bodies.
(4)
This research will contribute to understanding the land use/cover change effects on ecosystem services for decision-makers and provide a relevant scientific reference and support for ecosystem protection and integrated management in the Yiluo River Basin.

Author Contributions

All the authors contributed to the completion of this article. J.H. conducted the model building, data processing, and paper writing. T.Q. reviewed and revised the comments of the article. S.L. designed the structure of the manuscript. B.D. and S.Y. polished the English expression of the article. H.N. and J.W. provided assistance in model building and data processing. All authors have read and agreed to the published version of the manuscript.

Funding

This research was funded by the National Key Research and Development Project, grant number 2017YFA0605004; the National Science Fund for Distinguished Young Scholars, grant number 51725905 and the National Key Research and Development Project grant number 2016YFA0601503.

Institutional Review Board Statement

Not applicable.

Informed Consent Statement

Not applicable.

Data Availability Statement

Data available in a publicly accessible repository that does not issue DOIs.

Acknowledgments

We acknowledge the National Geomatics Center of China for the remote sensing images, and the National Meteorological Information Center of China Meteorological Administration provided the basic meteorological data. Moreover, we would like to thank the reviewers for their constructive and detailed comments.

Conflicts of Interest

The authors declare that they have no known competing financial interests or personal relationships that could have appeared to influence the work reported in this paper.

References

  1. Foley, J.A.; Defries, R.; Asner, G.P.; Barford, C.; Bonan, G.; Carpenter, S.R.; Chapin, F.S.; Coe, M.T.; Daily, G.C.; Gibbs, H.K.; et al. Global consequences of land use. Science 2005, 309, 570–574. [Google Scholar] [CrossRef] [Green Version]
  2. Veldkamp, A.; Lambinb, E. Predicting land-use change. Agriculture, Ecosyst. Environ. 2001, 85, 1–6. [Google Scholar] [CrossRef]
  3. Lambin, E.F.; Meyfroidt, P. Global land use change, economic globalization, and the looming land scarcity. Proc. Natl. Acad. Sci. USA 2011, 108, 3465–3472. [Google Scholar] [CrossRef] [PubMed] [Green Version]
  4. Lambin, E.F.; Turner, B.L.; Geist, H.J.; Agbola, S.B.; Angelsen, A.; Bruce, J.W.; Coomes, O.T.; Dirzo, R.; Fischer, G.; Folke, C.; et al. The causes of land-use and land-cover change: Moving beyond the myths. Glob. Environ. Chang. 2001, 11, 261–269. [Google Scholar] [CrossRef]
  5. Bohn, T.J.; Vivoni, E.R.; Mascaro, G.; White, D.D. Land and water use changes in the US-Mexico border region, 1992–2011. Environ. Res. Lett. 2018, 13, 114005. [Google Scholar] [CrossRef] [Green Version]
  6. Kalantari, Z.; Santos Ferreira, C.S.; Page, J.; Goldenberg, R.; Olsson, J.; Destouni, G. Meeting sustainable development challenges in growing cities: Coupled social-ecological systems modeling of land use and water changes. J. Environ. Manag. 2019, 245, 471–480. [Google Scholar] [CrossRef] [PubMed]
  7. Feng, Z.D. Hydrological and ecological responses to climatic change and to land-use/land-cover changes in Central Asia. Quat. Int. 2013, 311, 1–2. [Google Scholar] [CrossRef]
  8. Wang, Q.; Xu, Y.; Wang, Y.; Zhang, Y.; Xiang, J.; Xu, Y.; Wang, J. Individual and combined impacts of future land-use and climate conditions on extreme hydrological events in a representative basin of the Yangtze River Delta, China. Atmos. Res. 2020, 236, 104805. [Google Scholar] [CrossRef]
  9. Huang, C.; Zhang, M.; Zou, J.; Zhu, A.; Chen, X.; Mi, Y.; Wang, Y.; Yang, H.; Li, Y. Changes in land use, climate and the environment during a period of rapid economic development in Jiangsu Province, China. Sci. Total Environ. 2015, 536, 173–181. [Google Scholar] [CrossRef]
  10. Watson, L.; Straatsma, M.W.; Wanders, N.; Verstegen, J.A.; de Jong, S.M.; Karssenberg, D. Global ecosystem service values in climate class transitions. Environ. Res. Lett. 2020, 15, 24008. [Google Scholar] [CrossRef]
  11. Fang, S.; Yan, J.; Che, M.; Zhu, Y.; Liu, Z.; Pei, H.; Zhang, H.; Xu, G.; Lin, X. Climate change and the ecological responses in Xinjiang, China: Model simulations and data analyses. Quat. Int. 2013, 311, 108–116. [Google Scholar] [CrossRef]
  12. Song, W.; Deng, X. Land-use/land-cover change and ecosystem service provision in China. Sci. Total Environ. 2017, 576, 705–719. [Google Scholar] [CrossRef] [PubMed]
  13. Xie, G.; Zhang, C.; Zhen, L.; Zhang, L. Dynamic changes in the value of China’s ecosystem services. Ecosyst. Serv. 2017, 26, 146–154. [Google Scholar] [CrossRef]
  14. Wang, Y.; Dai, E.; Yin, L.; Ma, L. Land use/land cover change and the effects on ecosystem services in the Hengduan Mountain region, China. Ecosyst. Serv. 2018, 34, 55–67. [Google Scholar] [CrossRef]
  15. Allan, J.D. Landscapes and Riverscapes: The Influence of Land Use on Stream Ecosystems. Annu. Rev. Ecol. Evol. Syst. 2004, 35, 257–284. [Google Scholar] [CrossRef] [Green Version]
  16. Costanza, R.; D’Arge, R.; De Groot, R.; Farber, S.; Grasso, M.; Hannon, B.; Limburg, K.; Naeem, S.; O’neill, R.V.; Paruelo, J. The value of the world’s ecosystem services and natural capital. Nature 1997, 387, 253–260. [Google Scholar] [CrossRef]
  17. Raymond, C.M.; Bryan, B.A.; MacDonald, D.H.; Cast, A.; Strathearn, S.; Grandgirard, A.; Kalivas, T. Mapping community values for natural capital and ecosystem services. Ecol. Econ. 2009, 68, 1301–1315. [Google Scholar] [CrossRef]
  18. Kreuter, U.P.; Harris, H.G.; Matlock, M.D.; Lacey, R.E. Change in ecosystem service values in the San Antonio area, Texas. Ecol. Econ. 2001, 39, 333–346. [Google Scholar] [CrossRef]
  19. Rai, R.; Zhang, Y.; Paudel, B.; Acharya, B.; Basnet, L. Land Use and Land Cover Dynamics and Assessing the Ecosystem Service Values in the Trans-Boundary Gandaki River Basin, Central Himalayas. Sustainability 2018, 10, 3052. [Google Scholar] [CrossRef] [Green Version]
  20. Msofe, N.K.; Sheng, L.; Li, Z.; Lyimo, J. Impact of Land Use/Cover Change on Ecosystem Service Values in the Kilombero Valley Floodplain, Southeastern Tanzania. Forests 2020, 11, 109. [Google Scholar] [CrossRef] [Green Version]
  21. Gedefaw, A.; Atzberger, C.; Bauer, T.; Agegnehu, S.; Mansberger, R. Analysis of Land Cover Change Detection in Gozamin District, Ethiopia: From Remote Sensing and DPSIR Perspectives. Sustainability 2020, 12, 4534. [Google Scholar] [CrossRef]
  22. Xie, G.D.; Zhen, L.; Lu, C.X.; Xiao, Y.; Chen, C. Expert Knowledge Based Valuation Method of Ecosystem Services in China. J. Nat. Resour. 2008, 23, 911–919. [Google Scholar]
  23. Costanza, R.; De Groot, R.; Sutton, P.; Van Der Ploeg, S.; Anderson, S.J.; Kubiszewski, I.; Farber, S.; Turner, R.K. Changes in the global value of ecosystem services. Glob. Environ. Chang. 2014, 26, 152–158. [Google Scholar] [CrossRef]
  24. Riao, D.; Zhu, X.; Tong, Z.; Zhang, J.; Wang, A. Study on Land Use/Cover Change and Ecosystem Services in Harbin, China. Sustainability 2020, 12, 6076. [Google Scholar] [CrossRef]
  25. Mortoja, M.G.; Yigitcanlar, T. Local Drivers of Anthropogenic Climate Change: Quantifying the Impact through a Remote Sensing Approach in Brisbane. Remote Sens. 2020, 12, 2270. [Google Scholar] [CrossRef]
  26. Hu, Z.; Wang, S.; Bai, X.; Luo, G.; Li, Q.; Wu, L.; Yang, Y.; Tian, S.; Li, C.; Deng, Y. Changes in ecosystem service values in karst areas of China. Agric. Ecosyst. Environ. 2020, 301, 107026. [Google Scholar] [CrossRef]
  27. Woldeyohannes, A.; Cotter, M.; Biru, W.; Kelboro, G. Assessing Changes in Ecosystem Service Values over 1985–2050 in Response to Land Use and Land Cover Dynamics in Abaya-Chamo Basin, Southern Ethiopia. Land 2020, 9, 37. [Google Scholar] [CrossRef] [Green Version]
  28. Ma, X.; Zhu, J.; Zhang, H.; Yan, W.; Zhao, C. Trade-offs and synergies in ecosystem service values of inland lake wetlands in Central Asia under land use/cover change: A case study on Ebinur Lake, China. Glob. Ecol. Conserv. 2020, 24, e1253. [Google Scholar] [CrossRef]
  29. Jiang, W.; Lü, Y.; Liu, Y.; Gao, W. Ecosystem service value of the Qinghai-Tibet Plateau significantly increased during 25 years. Ecosyst. Serv. 2020, 44, 101146. [Google Scholar] [CrossRef]
  30. Talukdar, S.; Singha, P.; Mahato, S.; Praveen, B.; Rahman, A. Dynamics of ecosystem services (ESs) in response to land use land cover (LU/LC) changes in the lower Gangetic plain of India. Ecol. Indic. 2020, 112, 106121. [Google Scholar] [CrossRef]
  31. Ligate, E.J.; Chen, C.; Wu, C. Evaluation of tropical coastal land cover and land use changes and their impacts on ecosystem service values. Ecosyst. Health Sustain. 2018, 4, 188–204. [Google Scholar] [CrossRef] [Green Version]
  32. Schirpke, U.; Tscholl, S.; Tasser, E. Spatio-temporal changes in ecosystem service values: Effects of land-use changes from past to future (1860–2100). J. Environ. Manag. 2020, 272, 111068. [Google Scholar] [CrossRef] [PubMed]
  33. Liu, Y.; Hou, X.; Li, X.; Song, B.; Wang, C. Assessing and predicting changes in ecosystem service values based on land use/cover change in the Bohai Rim coastal zone. Ecol. Indic. 2020, 111, 106004. [Google Scholar] [CrossRef]
  34. Wu, C.; Chen, B.; Huang, X.; Dennis Wei, Y.H. Effect of land-use change and optimization on the ecosystem service values of Jiangsu province, China. Ecol. Indic. 2020, 117, 106507. [Google Scholar] [CrossRef]
  35. Yirsaw, E.; Wu, W.; Shi, X.; Temesgen, H.; Bekele, B. Land Use/Land Cover Change Modeling and the Prediction of Subsequent Changes in Ecosystem Service Values in a Coastal Area of China, the Su-Xi-Chang Region. Sustainability 2017, 9, 1204. [Google Scholar] [CrossRef] [Green Version]
  36. Liu, Q.; Yang, Z.; Cui, B.; Sun, T. Temporal trends of hydro-climatic variables and runoff response to climatic variability and vegetation changes in the Yiluo River basin, China. Hydrol. Process. 2009, 23, 3030–3039. [Google Scholar] [CrossRef]
  37. Wang, X.; Zhang, P.; Liu, L.; Li, D.; Wang, Y. Effects of Human Activities on Hydrological Components in the Yiluo River Basin in Middle Yellow River. Water 2019, 11, 689. [Google Scholar] [CrossRef] [Green Version]
  38. Gu, W.; Chen, B.; Yang, Y.; Dong, G. Simulation evaluation and uncertainty analysis for climate change projections in East China made by IPCC-AR4 models. Prog. Geogr. 2010, 29, 818–826. [Google Scholar]
  39. Zhang, S.; Gu, Y.; Lin, J. Uncertainty analysis in the application of climate models. Adv. Water Sci. 2010, 21, 504–511. [Google Scholar]
  40. Yuan, S.; Zhu, C.; Yang, L.; Xie, F. Responses of Ecosystem Services to Urbanization-Induced Land Use Changes in Ecologically Sensitive Suburban Areas in Hangzhou, China. Int. J. Environ. Res. Public Health 2019, 16, 1124. [Google Scholar] [CrossRef] [Green Version]
  41. Liu, X.; Liang, X.; Li, X.; Xu, X.; Ou, J.; Chen, Y.; Li, S.; Wang, S.; Pei, F. A future land use simulation model (FLUS) for simulating multiple land use scenarios by coupling human and natural effects. Landsc. Urban. Plan. 2017, 168, 94–116. [Google Scholar] [CrossRef]
  42. Liang, X.; Liu, X.; Li, X.; Chen, Y.; Tian, H.; Yao, Y. Delineating multi-scenario urban growth boundaries with a CA-based FLUS model and morphological method. Landsc. Urban. Plan. 2018, 177, 47–63. [Google Scholar] [CrossRef]
  43. Liang, X.; Liu, X.; Li, D.; Zhao, H.; Chen, G. Urban growth simulation by incorporating planning policies into a CA-based future land-use simulation model. Int. J. Geogr. Inf. Sci. IJGIS 2018, 32, 2294–2316. [Google Scholar] [CrossRef]
  44. Wang, J.; Wang, K.; Qin, T.; Nie, H.; Lv, Z.; Liu, F.; Shi, X.; Hu, Y. Analysis and prediction of LUCC change in Huang-Huai-Hai river basin. Open Geosci 2020, 12, 1406–1420. [Google Scholar] [CrossRef]
  45. Foley, J.A.; Ramankutty, N.; Brauman, K.A.; Cassidy, E.S.; Gerber, J.S.; Johnston, M.; Mueller, N.D.; O’Connell, C.; Ray, D.K.; West, P.C.; et al. Solutions for a cultivated planet. Nature 2011, 478, 337–342. [Google Scholar] [CrossRef] [PubMed] [Green Version]
  46. Chen, J.; Yin, S.; Gebhardt, H.; Yang, X. Farmers’ livelihood adaptation to environmental change in an arid region: A case study of the Minqin Oasis, northwestern China. Ecol. Indic. 2018, 93, 411–423. [Google Scholar] [CrossRef]
  47. Jiang, W.; Fu, B.; Lü, Y. Assessing Impacts of Land Use/Land Cover Conversion on Changes in Ecosystem Services Value on the Loess Plateau, China. Sustainability 2020, 12, 7128. [Google Scholar] [CrossRef]
  48. Zhang, F.; Yushanjiang, A.; Jing, Y. Assessing and predicting changes of the ecosystem service values based on land use/cover change in Ebinur Lake Wetland National Nature Reserve, Xinjiang, China. Sci. Total Environ. 2019, 656, 1133–1144. [Google Scholar] [CrossRef] [PubMed]
  49. Sun, Y.; Liu, S.; Dong, Y.; Dong, S.; Shi, F. Effects of multi-time scales drought on vegetation dynamics in Qaidam River Basin, Qinghai-Tibet Plateau from 1998 to 2015. Appl. Clim. 2020, 141, 117–131. [Google Scholar] [CrossRef]
  50. Saiz, G.; Bird, M.I.; Domingues, T.; Schrodt, F.; Schwarz, M.; Feldpausch, T.R.; Veenendaal, E.; Djagbletey, G.; Hien, F.; Compaore, H.; et al. Variation in soil carbon stocks and their determinants across a precipitation gradient in West Africa. Glob. Chang. Biol. 2012, 18, 1670–1683. [Google Scholar] [CrossRef]
  51. Souza, R.; Feng, X.; Antonino, A.; Montenegro, S.; Souza, E.; Porporato, A. Vegetation response to rainfall seasonality and interannual variability in tropical dry forests. Hydrol. Process. 2016, 30, 3583–3595. [Google Scholar] [CrossRef]
  52. Xu, Z.X.; Li, J.Y.; Liu, C.M. Long-term trend analysis for major climate variables in the Yellow River basin*. Hydrol. Process. 2007, 21, 1935–1948. [Google Scholar] [CrossRef]
  53. Liu, L.; Xu, H.; Wang, Y.; Jiang, T. Impacts of 1.5 and 2 °C global warming on water availability and extreme hydrological events in Yiluo and Beijiang River catchments in China. Clim. Chang. 2017, 145, 145–158. [Google Scholar] [CrossRef] [Green Version]
  54. Jung, S.H.; Feng, T. Government subsidies for green technology development under uncertainty. Eur. J. Oper. Res. 2020, 286, 726–739. [Google Scholar] [CrossRef]
Figure 1. Structure of the article.
Sustainability 13 06432 g001
Figure 2. Location, elevation, and major rivers of the Yiluo River Basin.
Sustainability 13 06432 g002
Figure 3. Spatial distribution of land use/cover types in the Yiluo River Basin from 2000 to 2020. (ac) represents the land use/cover in 2000, 2010 and 2020, respectively.
Sustainability 13 06432 g003
Figure 4. Land use/cover dynamic degree change and area change in Yiluo River Basin during 2000–2020 (AC: Area change; DC: Dynamic degree change).
Sustainability 13 06432 g004
Figure 5. Transformation distribution of land use/cover types in the Yiluo River Basin from 2000 to 2020. (a,b) represents the land patterns in 2000 and 2020, respectively.
Sustainability 13 06432 g005
Figure 6. Ecosystem service values of different land use/cover types (Million Dollars) from 2000 to 2020. (a) represents the total ESVs, and (bf) represent the ESVs of farmland, forestland, grassland, water bodies and unutilized land, respectively.
Sustainability 13 06432 g006
Figure 7. Spatial distribution of land use/cover types in the Yiluo River Basin by 2030 under different RCPs scenarios. (ac) represents the land use/cover under the RCP 2.6, RCP 4.5 and RCP 8.5, respectively.
Sustainability 13 06432 g007
Figure 8. Land use/cover change in the Yiluo River Basin under different RCPs scenarios (Where 2020 represents the actual ESVs in 2020, and 2030 RCP2.6, 2030 RCP4.5, and 2030 RCP8.5 represent the predicted ESVs in 2030 of different scenarios). (af) represents the area of farmland, forest, grassland, water bodies, construction land and unutilized land, respectively.
Sustainability 13 06432 g008
Figure 9. Ecosystem service values of different land use/cover types under different RCPs scenarios (Million Dollars). (a) represents the total ESVs, and (bf) represents the ESVs of farmland, forestland, grassland, water bodies and unutilized land, respectively.
Sustainability 13 06432 g009
Table 1. Ecosystem service values per unit area for different land use/cover types (dollars/hm2).
Primary ClassificationSecondary ClassificationFarmlandForestlandGrasslandWater BodiesUnutilized Land
Provisioning servicesFood supply299.8109.377.6282.10.0
Raw material supply141.1250.4116.481.10.0
Water7.1130.563.52923.60.0
Regulating servicesAir quality regulation236.3828.8402.0271.57.1
Climate regulation127.02479.21065.0807.60.0
Waste treatment35.3701.8352.71957.335.3
Regulation of water flows95.21237.8779.436,056.010.6
Erosion prevention363.21008.6490.2328.07.1
Supporting servicesMaintenance of soil42.377.638.824.70.0
Fertility habitat services45.8726.5447.9899.37.1
Cultural servicesAesthetic landscape provision21.2402.0197.5666.53.5
Table 2. Values of different ecosystem services in the Yiluo River Basin (Million Dollars).
Primary ClassificationSecondary Classification200020102020
Provisioning servicesFood supply341.4332.2324.7
Raw material supply345.9342.5337.2
Water168.7192.8205.3
Regulating servicesAir quality regulation967.9S965.8954.5
Climate regulation2433.52450.82432.6
Waste treatment717.0735.8738.7
Regulation of water flows1753.02047.02204.1
Erosion prevention1236.71231.01215.3
Supporting servicesMaintenance of soil106.4105.3103.7
Fertility habitat services741.5751.3748.5
Cultural servicesAesthetic landscape provision404.7411.8411.3
Table 3. Ecosystem service values of the Yiluo River Basin in 2030 under different RCPs scenarios (Million Dollars).
Primary ClassificationSecondary ClassificationRCP2.6RCP4.5RCP8.5
Provisioning servicesFood supply317.9318.0318.0
Raw material supply332.9332.8332.9
Water210.0211.5211.4
Regulating servicesAir quality regulation945.6945.3945.3
Climate regulation2419.12418.22418.3
Waste treatment738.1738.8738.7
Regulation of water flows2263.82282.22280.4
Erosion prevention1202.71202.31202.3
Supporting servicesMaintenance of soil102.4102.4102.4
Fertility habitat services745.5745.5745.6
Cultural servicesAesthetic landscape provision410.1410.2410.2
Publisher’s Note: MDPI stays neutral with regard to jurisdictional claims in published maps and institutional affiliations.

