Article

The Integrated Cropping Calendar Information System: A Coping Mechanism to Climate Variability for Sustainable Agriculture in Indonesia

1
Indonesian Agroclimate and Hydrology Research Institute, Indonesia Agency for Agricultural Research and Development, Jl Tentara Pelajar 1A, Bogor 16111, Indonesia
2
Geosciences, School of Agriculture and Environment, Massey University, Palmerston North 4410, New Zealand
3
Indonesia Centre for Agricultural Technology Assessment and Development, Indonesia Agency for Agricultural Research and Development, Jl Tentara Pelajar 10, Bogor 16124, Indonesia
4
Indonesia Agency for Agricultural Research and Development, Jl Ragunan 29 Pasar Minggu, Jakarta Selatan 12540, Indonesia
*
Author to whom correspondence should be addressed.
Sustainability 2021, 13(11), 6495; https://doi.org/10.3390/su13116495
Submission received: 4 May 2021 / Revised: 30 May 2021 / Accepted: 3 June 2021 / Published: 7 June 2021
(This article belongs to the Special Issue Sustainable Tropical Crop Science and Agriculture Management)

Abstract

:
Climate change and its variability are some of the most critical threats to sustainable agriculture, with potentially severe consequences on Indonesia’s agriculture, such as changes in rainfall patterns, especially the onset of the wet season and the temporal distribution of rainfall. Most Indonesian farmers receive support from agricultural extension services, and therefore, design their agricultural calendar based on personal experience without considering global climate phenomena, such as La Niña and El Niño, which difficult to interpret on a local scale. This paper describes the Integrated Cropping Calendar Information System (ICCIS) as a mechanism for adapting to climate variability. The ICCIS contains recommendations on planting time, cropping pattern, planting area, varieties, fertilizers, agricultural machinery, potential livestock feed, and crop damage due to climate extremes for rice, maize, and soybean. To accelerate the dissemination of information, the ICCIS is presented in an integrated web-based information system. The ICCIS is disseminated to extension workers and farmers by Task Force of the Assessment Institute for Agricultural Technology (AIAT) located in each province. Based on the survey results, it is known that the ICCIS adoption rate is moderate to high. The AIAT must actively encourage and support the ICCIS Task Force team in each province. Concerning the technological recommendations, it is necessary to update the recommendations for varieties, fertilizer, and feed to be more compatible with local conditions. More accurate information and more intensive dissemination can enrich farmers’ knowledge, allowing for a better understanding of climate hazards and maintaining agricultural production.

1. Introduction

Climate change and variability may severely impact crop production in Indonesia. Rice, the staple food of over 250 million Indonesians, is highly susceptible to climate change [1,2,3], and climate variability [4,5]. There are typically three rice-growing periods in Indonesia; the first planting, also known as the Wet Season Planting (WSP), usually occurs from October to December, followed by two Dry Season Planting (DSP). WSP is the primary planting season, and accounts for about 45 % of total production. The onset of the wet season is the most decisive factor in adjusting the planting time of the WSP. Advances or delays at the beginning of the wet season will determine the planting time of WSP and have ripple effects through the next two DSP.
The rainfall characteristics, namely, onset and withdrawal dates, duration, and accumulated precipitation, have important implications for crop production. As defined by Odekunle et al. [6], the wet season onset is the period at the beginning of the wet season, when rainfall distribution has become adequate for crop development, while the withdrawal refers to the period towards the end of the wet season, when rainfall distribution may no longer sustain crop growth. Moreover, variations in the rainfall accumulated during the wet and dry seasons directly impact water availability during growing periods. The onset and withdrawal of the wet season over Indonesia differ amongst region, and rainfall pattern varies with the season due to the Inter-Tropical Convergence Zone (ITCZ) and Monsoon [7]. The wet season starts from the Indian Ocean side of Sumatera in the middle of September and propagates northward (in Java) and eastward (to Nusa Tenggara in the middle of December). The withdrawal of the wet season starts from western Nusa Tenggara in March and goes eastward (to eastern Nusa Tenggara) and westward (to Java) until late May [8].
Interannual variability, such as the El Niño-Southern Oscillation (ENSO) and the Indian Ocean Dipole (IOD), are coherently correlated with rainfall extreme in Indonesia [9,10,11,12]. According to As-syakur et al. [13], both ENSO and IOD have similar spatiotemporal patterns to influence rainfall during Indonesia’s dry season. Moreover, Hidayat et al. [14] concluded that IOD has a significant correlation to rains in the western Indonesian region, including northwestern Java, while ENSO found a substantial correlation to rainfall over Indonesia’s central/eastern part. Furthermore, Satyawardhana et al. [15] found that during El Niño, the onset of the wet season delayed from 30 to 40 days and became shorter, while during La Niña, the wet season occurred 20 to 30 days earlier and became longer.
These changes will affect the onset and withdrawal of the wet season, which has become irregular over the years [16], making it difficult for farmers to optimize the planting period and adjust to the length of the growing season [17,18]. The immediate consequences are increased yield loss due to climate-related hazards and a decrease in agricultural production. Therefore, determining the onset and withdrawal of the wet season will significantly assist the on-time preparation of farmlands, mobilize seeds/crops, human resources, and equipment and adjust the appropriate planting time.
Indonesia has long established the traditional rice-growing calendar for farmers using different terms in each region. The time is used as a starting point for indigenous awareness of agriculture planning. Nevertheless, additional local wisdom cannot be fully referenced early in the season due to climate change and difficulty finding an indicator of a seasonal marker [19].
The Indonesian Agency for Agricultural Research and Development, The Indonesian Ministry of Agriculture, has developed an Integrated Cropping Calendar Information System (ICCIS) as a coping mechanism against climate variability. The ICCIS describes the potential planting time patterns for food crops, especially rice, maize, and soybeans, based on climate and water resources [20]. Utilization of planting time information combined with other information, such as areas prone to flooding, drought, pest attacks, varieties, and fertilizer recommendations, the availability of agricultural machinery, and the adequacy adequate of livestock feed can be used as a reference for policymakers in preparing a food crop management [21].
Given that Indonesia is an archipelago, the ICCIS using conventional methods, such as mail, telephone, or fax, is costly and slow. An internet-based distribution system allows users to distribute the information faster and more content can be delivered, such as maps and graphs. In addition, the rapid development of the internet in Indonesia can be integrated into smartphones to allow users to receive information faster.
This paper aims to describe the cropping calendar information packaging in the form of a Web-Based Information Technology System. This strategy to informing the recommendation of the upcoming planting season for small farmers should become a guideline for the upcoming planting season to support Indonesia’s food security programs.

2. Data and Method

2.1. Study Area

The study covers all regions of Indonesia within the 6°–11° S and to 95°–141° E range. Stretching on both sides of the equator, Indonesia has a tropical climate, with two distinct seasons: wet and dry season. The wet season is usually from November to April, with some regional variations. The wet season coincides with the southern hemisphere’s summer monsoon and the presence of the ITCZ. The dry season occurs when the dry south-easterly wind blows in from Australia. Due to the fact that maritime Indonesia is a vast and complicated region comprised of about 17,000 islands with mountains, several important atmospheric and oceanic processes imposed by Sea Surface Temperature variability may influence various parts of the region [22,23]. Based on the annual rainfall and the wet and dry periods, Susanti et al. [24] defined 18 agroclimatic zones in Indonesia. The case study areas focused on two regencies with different agroclimatic zones: Klaten and North Toraja Regencies (located respectively in the provinces of Central Java and South Sulawesi). Klaten Regency represents an area with a moderate climate zone, referring to the rainfall of 1500–2500 mm with a dry period of 5–7 months and a wet period of 3–4 consecutive months. North Toraja Regency represents an area dominated by a wet climate zone, referring to annual rainfall greater than 2500 mm with a dry period of fewer than three months and a wet period of 5–9 months (Figure 1).

2.2. Data

The required data to develop and update the ICCIS is very complex and involved various institutions within the Ministry of Agriculture, as well as outside the ministry. The prediction of operational seasonal rainfall, namely, rainfall characteristics, and the onset of the rainy or dry season, were obtained from the Meteorological, Climatological, and Geophysical Agency (BMKG). The monthly gridded dataset on the potential evapotranspiration (PET) dataset developed by the Climate Research Unit (CRU TS version 4.02) for the period 1990–2015 was retrieved in March 2019 from https://crudata.uea.ac.uk/cru/data/hrg/ (accessed on 1 March 2019). Water availability data were collected at Soilgrid (accessed on 2 March 2019). The digital map of the official rice area was provided by the Ministry of Agrarian Affairs and Spatial Planning/National Land Agency [25]. Monthly historical data on rice planting area by sub-district were collected from The Statistic Indonesia. These data formed the main data for assessing the onset of the planting period.
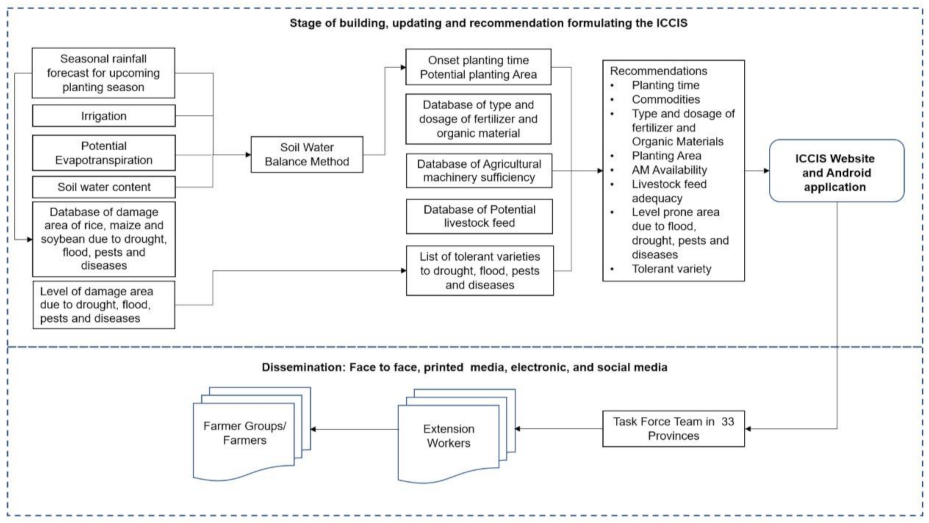
Supporting data include fertilizer and variety recommendations, agricultural machinery (AM), livestock feed, and agricultural hazard. The distribution map of N, P, K, ZA, and SP36 required for the fertilizer recommendation was obtained from the Indonesian Soil Research Institute (ISRI). The AM, collected in the form of number and distribution by Regency, were documented from the Indonesia Center for Agricultural Engineering Research and Development (ICAERD). The livestock population used to calculate the feed requirement was obtained from Statistic Indonesia. Monthly data of rice, maize, soybean affected, and “puso” (harvest failure) area due to drought, flood, and pest attack for various regencies in Indonesia were provided by the Directorate of Food Crop. The recommended list of varieties of rice, maize, and soybeans tolerant to drought, floods, pests, and diseases, was obtained from the Indonesian Center for Food Crop Research and Development (ICFORD). The results of the ICCIS compilation, update, and recommendations formulation in the form of websites and Android applications, were disseminated by the Task Force teams in 33 provinces in-person, print, electronic, and social media to the extension workers and farmers/farmer groups. The process of the ICCIS compilation, updating, and dissemination is described in Figure 2.

2.3. Determination of Planting Time and Planting Area

The ICCIS is released twice a year for Wet Season Planting (WSP) and Dry Season Planting (DSP). The planting time for rice, maize, and soybean was determined using the soil water balance (SWB) method. The SWB is developed to estimate soil water availability at a ten-day time step using modified versions of Thornthwaite and Mather [26]. A discrete form of the water balance equation can be written as follows:
R + I = PET + ∆SWC + W
where R = rainfall, I = irrigation, PET = potential evapotranspiration, ∆SWC = change in soil water content, and W = water surplus or deficit. Seasonal rainfall prediction is provided by BMKG. Irrigation uses the recommended wet rice-field water requirement (1 lt/sec/ha), assuming it is available all year round (1 lt/sec/ha), available 2/3 years, and available 1/2 year. The recommendation for crop selection is determined based on the water availability generated by the SWB method. Rice is recommended if water availabilities greater than 80%, 60–80% for maize, 35–60% for soybean, and less than 35% for fallow.
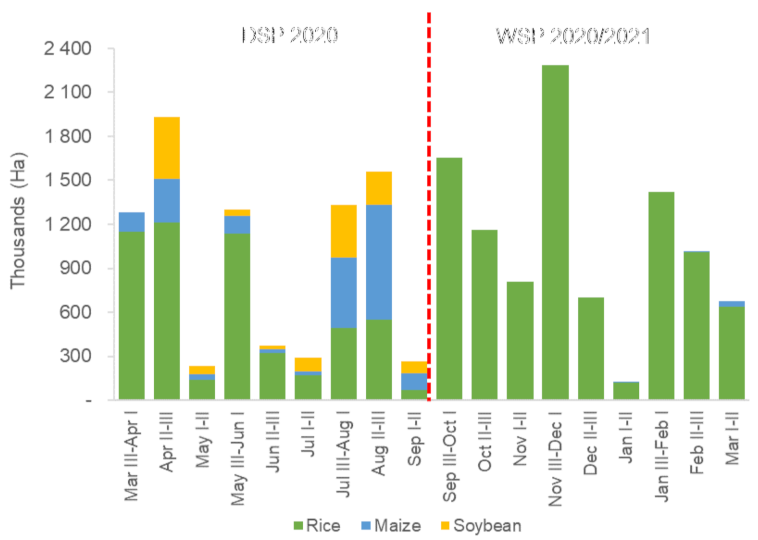
Planting time periods are classified into 18 classes with 20-day intervals. Planting time period for DSP, including March III–April I, April II–III, May I–II, May III–June I, June II–III, July I–II, July III–August I, August II–III, and September I–II. WSP commences from September III–October I, October II–III, November I–II, November III–December I, December II–III, January I–II, January III–February I, February II–III, and March I–II.
The potential planting area in WSP and DSP is calculated by multiplying the Rice Planting Index (RPI) and official rice field area. The RPI is calculated by dividing the average rice planting area by the standard official rice field. RPI is categorized into three classes based on ENSO years, namely, wet years (La Niña), normal years (Neutral), and dry years (El Niño). If the rainfall is predicted to be above normal, the potential planting area is calculated using the wet year of the RPI. Meanwhile, if the prediction of rainfall is normal or below normal, the RPI for normal and dry years is used, respectively. The analysis process was performed per sub-district.

2.4. System of Formulating Recommendation

The ICCIS is also equipped with information to support the farming system and minimize climate-related risks. The information includes (a) fertilizer recommendations, (b) information about agricultural machinery availability, (c) potential livestock feed, and (d) potential crops damaged, due to flooding, drought, pests and diseases, (e) varieties recommendation.
(a)
Fertilizer Recommendations
The presented information on the types of fertilizer are Urea, NPK, and ZA for rice and maize, and for soybeans are NPK and SP 36. Fertilizer recommendations were compiled from the map of fertilizer type, fertilizer dosage, P and K distribution documented by the Indonesian Soil Research Institute (ISRI). Fertilizer dosage refers to the concept of balanced fertilization, which refers to the Ministry of Agriculture Regulation No. 47/2007 [27]. Balanced fertilizer provides an adequate amount of fertilizer in the soil to ensure an adequate level of essential nutrients [28]. The recommended option for each crop available in the form of a composite fertilizer with or without organic materials for each sub-district.
(b)
Agricultural Machinery Sufficiency
Another significant input contributing to increase agricultural production is the sufficiency of agricultural machinery. Agricultural machinery (AM) has been used widely and has considerably improved the yield and quality of agricultural products in Indonesia. Information on the sufficiency of the AM included in the ICCIS consists of a two-wheeled tractor, a four-wheeled tractor, a thresher, a dryer, a transplanter, a combine harvester, and a rice milling unit. The AM sufficiency data are provided by the Indonesian Center of Agricultural Engineering Research and Development. The sufficiency level of the AM was grouped into five classes, namely, very poor (≤40%), less (40–60%), moderate (60–80%), sufficient (80–100%), and saturated (>100%) [29]. Information on AM sufficiency is available at the regency level and is periodically updated as changes in its distribution are reported.
(c)
Potential Livestock Feed
The availability of livestock feed was estimated from the total rice by-product, namely, straw and bran production. Straw and bran production was estimated by multiplying the grain yield by the conversion factor (0.35 for straw and 0.1 for bran). Livestock feed requirements are calculated based on requirements for dry matter (DM), crude protein (CR), and Total Digestible Nutrient (TDN). Each metric is calculated according to the total ruminant population (dairy cattle, beef cattle, buffaloes) and the DM/CR/TDN requirement per head × 365. DM requirement 8 kg/head/day, CR req = 730 g/head/day, and TDN req = 3.92 kg/head/day. Feed adequacy is estimated by dividing feed availability and feed requirements. Feed adequacy status is presented in three categories, namely, deficit (<90%), moderate (90–110%), and surplus (>110%) for all regencies in Indonesia. Livestock potential data are calculated and updated on a seasonal basis based on the forecast of potential planting area.
(d)
Crop Damage due to Flood, Drought, Pests, and Diseases Attacks
A dataset of drought, floods, pests, and diseases was extracted to reveal patterns of damage areas for each administrative. The damage, due to pests and diseases, was examined for several types. The damage areas were calculated using the following equation:
Damage area = 0.5 × (affected area − puso area) + puso area
The natural breaks method was applied to divide the damaged area into five classes, namely, very low, low, moderate, high, and very high. This method is generally designed to minimize class variation and maximize between-class variance in the iterative series of calculations [30]. The current GIS mapping tool uses Jenks for its calculation method labeled natural breaks.
The potential damage areas for WSP and DSP were examined according to the seasonal rainfall prediction released by BMKG. The impact of climate variability on planting time and its recommendations can be divided into three categories: El Niño, Neutral, and La Niña. Furthermore, the seasonal rainfall prediction was used to define the potential damages for the following season.
(e)
Varieties Recommendation
Variety recommendations were developed based on agriculture hazards, including flooding, drought, pests, and diseases. The list of rice, maize, and soybean varieties recommended for these hazards was established based on expert judgment. The expert judgment determines the types of rice, maize, and soybean varieties for each district in Indonesia. The communication and discussion were led with the judgment of experts from the Center for Rice Research Institute, the Indonesian Legumes, the Tuber Crops Research Institute, and the Indonesian Cereals Research Institute.

2.5. Case Study

In this case study, we linked ENSO phases with an output of ICCIS, including planting time, dosage of fertilizer, adequacy of livestock feed, and tolerance variety recommendations, based on the potency of flood, drought, pests, and disease. Two regencies with a different agroclimatic zone were selected as a case study. The agroclimatic zone maps illustrate the relative length of wet and dry periods, and the annual rainfall developed by [24]. Klaten Regency in Central Java represents an area of a moderate climate with a rainfall amount of 1500–2500 mm coupled with a dry period of 5–7 months and a wet period of 3–4 consecutive months. North Toraja Regency represents an area dominated by a wet climate, with annual rainfall greater than 2500 mm, a dry period of fewer than three months, and a wet period of 5–9 months.
We used the NOAA operative definitions for El Niño or La Niña. El Niño is defined by a positive ONI greater than or equal to +0.5 °C, and La Niña is characterized by a negative ONI less than or equal to −0.5 °C. The ONI is defined as three-month running-mean values of SST departures from average in the Niño-3.4 region (5° N–5° S, 120°–170° W) [31,32]. The ONI graph from 2018 to 2021 is depicted in Figure 3.
The seasonal rainfall prediction was used to identify potential damages for the subsequent season. Next, recommendation of tolerant varieties based on types and levels of damage are arranged using a list of recommended varieties based on their tolerances.

2.6. The Integrated Cropping Calendar Information System

The Ministry of Agriculture has developed a calendar for food crop planting season in Indonesia [33]. The initial estimate of planting time is based on yearly rainfall conditions, i.e., in wet, neutral, and dry conditions [34]. The latest version of the ICCIS is available on the website https://katam.litbang.pertanian.go.id (accessed on 31 March 2021) with an interface as illustrated in Figure 4.
There are four key elements for creating information from input data in the information system: First, the ICCIS Desktop application calculates raw data using formulas or rules to automatically generate meaningful information stored in the database. The other function is to have an official report for the agricultural office at the provincial, regency, and sub-district levels. The second key element is storing data and information available on the ICCIS desktop and on the interactive web. The third element is an interactive web that serves users access to information through the internet. The map server also uses the interactive web to provide spatial information. Android is also used to interact with the interactive web to access the database.
The final element is a near-real-time of the monitoring standing crop using Near-Real-Time Satellite data. The purpose of the standing crop is to correct the recommended planting time and area for the ICCIS. This element can do series of instructions to produce a map of rice-growing stages in the near-real-time rice is a using machine learning with 10 m × 10 m resolution (Figure 5). This subsystem will automatically download the Sentinel-2 images from Copernicus Hub. Sentinel-2 has a multi-spectral sensor that provides 12 bands that can be used as predictors in the classification process, with rice growth stages using a machine learning model. The model was created from a ground truth campaign on July–August 2018 in six regencies in Java [35]. The model represented three main classes of rice cultivation: Vegetative (0–60 days), reproductive (61–90 days), and ripening (91–120 days), and one class to represent the fallow condition (bare land).
Information on standing crops was made available in two ways. Firstly, the spatial information was created using generated classifying tiles. Next, the generated tiles are saved on a web server for the web and the Android application to access the information. The second information is the process of tabulation of spatial data using the intersection with the administration map. This process provides the user with information on each class in hectares for every village in Indonesia. The recapitulation is also available from the village, to the sub-district, regency, province, and national level. Over one year (2020), the total data output is 12,280 maps at the regency level and 81,874 maps at the sub-district level. Figure 4 shows an example of the output of the standing crop. These features are unique compared to other national monitoring systems, such as https://sipandora.lapan.go.id/ (accessed on 29 April 2021), with 250 m spatial resolution and http://sig.pertanian.go.id/ (accessed on 29 April 2021) with 30 m × 30 m resolution.
It is worth mentioning that the ICCIS is a product of evolution from 2011 to 2021, where some features were created at one time and some time. The feature was stopped due to several reasons, such as technically and low acceptance rate. For example, the CD and SMS feature was created in 2012 to disseminate by sending a CD to certain agriculture offices had low effectively where many provinces or regencies did not have a CD player. Moreover, the SMS, which was intended to send information in a text message to avoid blank internet spot, also failed, and stopped in 2017 because the SMS gateway server was crashing multiple times. The standing crop feature was upgraded in 2015, the MODIS standing crop has been released, and in 2019, it was discontinued and replaced by the Sentinel-2 standing crop in 2018. The new sensor provides a higher precision classification with a spatial resolution of 10 m, where MODIS is just 250 m (Figure 6).

2.7. Dissemination and Feedback

A mixed method of self-report survey and literature study is used to extract information about ICCIS dissemination, and feedback. Self-report survey-based data collection is carried out using the internet, to gather research participants include drawing larger, more diverse samples, accessing difficult-to-reach populations, limiting the costs of survey administration, and eliminating the need for a data entry [36]. A survey was conducted using purposive sampling of respondents from the teams of the 33 Assessment Institute for Agricultural Technology (AIAT) Task Force in all Indonesian provinces. A Task Force team in each province, with three to five members, is responsible for disseminating the ICCIS to various stakeholders at the provincial, regency, sub-district, and village levels. Dissemination occurs through print, electronic, and social media to provide stakeholders, extension workers, farmers, and other communities with the information available in the ICCIS. In addition, the dissemination was conducted by the Task Force team in collaboration with other agencies, such as the agricultural office, the Provincial BMKG, and the Agricultural Extension Center (BPP).
In order to collect information and feedback on the use of the ICCIS information, an interview was conducted using an online structured questionnaire. The questions to determine the success of the dissemination are Socialization implementer, frequency of dissemination implementation, and the number of participants in the socialization. Information collected to determine user feedback includes the level of accessibility and adoption of the ICCIS by farmers, the extent to which the ICCIS recommendations are accurate and relevant in the field. The ICCIS accessibility and adoption survey is divided into three levels: High (50–75%), moderate (26–50%), and low (0–25%). The data and information collected are then analyzed using a descriptive statistical method.

3. Results and Discussion

3.1. Cropping Calendar Information for Dry Season and Wet Season Planting

The concept of the planting calendar has been developed in various countries to study rice productivity and water requirements, especially in areas with unstable environmental conditions, such as in Vietnam [37], and to provide climate-related information to farmers to ensure rational and time-efficient planting times [38]. In Indonesia, since 2011, the ICCIS regularly updates information for the WSP and DSP annually. For example, information on the latest year, a summary of the analyzes of the rice cropping calendar in DSP 2020 and WSP 2020/2021 are shown in Figure 7. DSP period is between March III and September II, and WSP period between September III and March II. The information indicates that the highest planting area for DS 2020 was recommended in Apr II-III 2020. Based on the overlay between rainfall prediction for DSP 2020 and rice field area, the total planting area for rice, maize, and soybean is estimated to be more than 1.9 million ha. Recommendations for maize and soybeans are based on water balance analysis which shows insufficient availability of water for growing rice. In WSP 2020/2021, the ICCIS recommended that the highest planting area occurred from Nov III to Dec I, covering more than 2.2 million ha solely for rice planting. At WSP 2020/2021, rainfall is predicted to be sufficient for planting rice, hence all wet rice fields are recommended for planting rice.
Information on rainfall prediction is then analyzed into recommendations for rice, maize, or soybeans planting calendars, and information on potential planting areas for both WSP and DSP. The ICCIS recommendation is one of the climate variability adaptation mechanisms for sustainable agricultural planning in Indonesia. Based on information from the ICCIS, the government may formulate a strategy for the preparation of agricultural facilities and infrastructure, in particular for rice-growing in the WSP. In the meantime, the DSP prepared the facilities and infrastructure for rice, maize, and soybeans, based on the timing and planting area that had been communicated to the ICCIS.

3.2. Case Study

(a)
Comparison of Cropping Calendar Information in WSP under ENSO Scenarios in the Recent Years
The WSP is the most important rice growing season of the year, supporting both irrigated, and rain-fed rice fields. Approximately 45% of the total production usually comes from the wet season crop, grown from October to December. Previous studies indicated that the ENSO phenomenon caused El Niño and La Niña events to occur and have affected both the timing of rice plantings and the cumulative area of rice planted over the entire cropping year [39,40]. For that reason, the discussion in WSP focused on the rice farming system.
Table 1 details the onset of the rice planting period and potential planting area in WSP 2018/2019, 2019/2020, and 2020/2021, corresponding to El Niño, Neutral, and La-Nina, respectively. It can be seen the abnormal climatic conditions in El Niño and La Niña, have affected both the planting time and the potential planting area. In the Klaten district, under neutral conditions, the onset of the planting period starts in October II-III with a potential planting area of approximately 55 thousand hectares. Due to low rainfall and drought in El Niño, the planting period should be postponed to November III-December I, with a decrease in the planting area of 28 thousand hectares. The planting time and planting area are not significantly different between La Niña and the Neutral year. In La-Nina year, planting time starts in November I-II with a potential planting area of more than 46 thousand hectares. The recommendation for the district of North Toraja shows significant differences in these scenarios. In El Niño, the 20-day delay of the planting period is compared to a decline in the planting area. In contrast, during the La Niña year, the planting period starts 20 days in advance, and the planting area increases relative to the Neutral year (Table 1). According to Naylor, Falcon, Wada, and Rochberg [39], during the El Niño years, the area planted is well below normal with a delay in planting in the wet season. Conversely, the La Niña years show the opposite trend, with planting above normal early in the wet season.
The results of the analysis of the standing crops of Klaten Regency on October 20, 2021, show that the area of the fallow phase in the rice fields is 7856 ha, the water phase is 305 Ha, the vegetative phase is 5843 Ha, the generative phase is 6082 Ha, and the maturation phase is 11,607 Ha, with a total area of rice fields monitored, covering an area of 31,698 Ha. The area that can be planted from November to December 2020 is estimated to be 25,545 hectares from the fallow phase, the mature stage, and the generative phase. Meanwhile, the results of the analysis of the rice planting calendar on MH 2020/2021 in the Klaten Regency were 46,179 hectares, consisting of 25,868 hectares in November I-II, 2661 hectares in November III-December I, and 17,651 hectares in March I-II. The planting forecast for November-December 2020 alone was 28,528 hectares. There is an estimated value that is not significantly different between Katam’s predictions and the results of standing crop monitoring using Sentinel-2 satellite imagery. Figure 8a on the map of the Klaten Regency standing crop shows the spatial distribution of rice monitoring in the rice fields in October 2020, while Figure 8b shows a tabular form of rice monitoring in the rice fields in the Klaten Regency down to the sub-district level.
Figure 9 shows the wet planting period in Neutral, El Niño, and La Niña for Klaten and North Toraja Regencies because of ENSO in each Regency. The figure does not show all areas within a district that have the same planting date. However, it is predominantly in accordance with those described in Table 1. The recommended planting period can provide the basis for adaptation to climatic diversity. The planting recommendations that can be made earlier in La Niña by regional decision-makers to accelerate the distribution of agricultural facilities and infrastructure in accordance with their potential planting area. Extension workers can disseminate farmers to prepare land and commodities for early planting, so that rainfall can be used to its full potential. Conversely, under El Niño conditions, planting must be postponed, waiting for rainfall and an adequate amount of water for tillage. In addition, the provision of agricultural facilities and infrastructure must be adapted to the potential of the rice fields that can be planted. Alternatively, planting can occur under normal conditions, but facilities need to be prepared if there is an additional source of irrigation water.
(b)
Fertilizer Recommendations
The recommendations for rice fertilizers are given in the Ministry of Agriculture Regulation No.40/2007 based on single fertilizers (Urea, SP-36, KCl) and organic fertilizers based on straw and manure. Application of organic fertilizer could improve soil properties and increase rice yield [41,42]. Based on the data on fertilizer recommendation and the recommended number of sub-districts in 2020, the dose of rice fertilization is quite spread from 50 kg to 350 kg. The most widely used fertilizer doses are 100, 175, and 200 kg per hectare. NPK and Urea are mostly used, either without organic matter or with organic matter. With regards to the distribution of P and K, which are also used in determining the dosage of fertilization in the ICCIS, according to Hatta [43], the low, medium, and high P and K conditions in the rice fields are very useful for determining location-specific fertilizer recommendations.
The fertilizer recommendation in El Niño at a given location is the same, namely, Urea, NPK, SP 36, KCL, and ZA, both without organic matter and with organic matter. Fertilizer doses can be the same, or there are differences, although they are not significant from place to place. For instance, in Klaten and North Toraja Regencies under El Niño (2018), fertilizer types and doses are relatively similar. For the normal year (2019), the fertilizer dosage at Klaten Regency is higher than at North Toraja Regency. Meanwhile, not much data is available in the year of La Niña (2020).
(c)
Agricultural Machinery
The use of AM is very important in supporting a particular farming system, especially the food crop farming system. This is also reflected in the research results [44,45]. Conventional agriculture must be supported by machinery technology that is faster and higher accuracy. Machine vision technology provides an alternative to automated, non-destructive, cost-effective, fast, and accurate processes [46]. Based on AM identification for rice in Indonesia, the types of AM used, among others: Tractors, Tresher, Dryer, Transplanter, Combine Harvester, Paddy Mower, and Rice Mill.
In general, AM availability during El Niño (2018) in the Klaten Regency is saturated, while in the North Toraja Regency were moderate and very poor. However, the availability of Thresher and Dryer in these two regencies is very low. In the Neutral year of 2019, the availability of tractors in the Klaten Regency is saturated, while in the North Toraja Regency are moderate and very low. In the La Niña year (2020), the availability of AM in the North Toraja Regency is low to very low, while the transplanter is sufficient. In the Klaten Regency, the availability of the AM is limited, except for Paddy Mower, and Rice Mill.
The difference in the availability is due to the distribution of assistance received, because most AM is from the government. Other factors include the management at the farmer group level and the intensity of its use. Furthermore, information on the availability of AM can be used as a basis for the distribution of AM assistance by the Ministry of Agriculture.
The use of AM is an adaptation to climate change in the agricultural sector. During the dry season, agricultural machines, such as pumps, are used to supply water to plants to reduce the risk of crop drought. At the beginning of the growing season, the use of tractors and transplants is intended to speed up tilling and planting. Using a tractor and a motor-driven combine can reduce yield losses at harvest time. During the wet season, the use of a dryer is very useful to accelerate the drying of the grain. The process from the beginning of tillage, planting, harvesting to post-harvest, which is supported by the use of AM, can accelerate planting time, decrease yield loss, increase productivity, and improve crop quality.
(d)
Livestock Feed Potential
Information on livestock is provided in the ICCIS version 3.1 in the form of maps and graphs on the adequacy of DM, CN, and TDN. The tabular information presented is for beef cattle, dairy cows, buffalo, sheep, and goats in sub-districts. According to the basic data, more than 2500 sub-districts still experience have deficits in the adequacy of DM, CP, and TDN.
The adequacy of animal feed (dry matter (DM), crude protein (CP), and total digestible nutrients (TDN)) in most regencies of Indonesia is dominated by a deficit condition, although in some regencies, there are surpluses. Base on the performance of each regency, the conditions indicate slightly different under various climatic conditions. As an example, under the El-Nino (2018) condition, the adequacy of DM and TDN in the Klaten Regency are surplus, while CP is a deficit. Meanwhile, in the Neutral year 2019, the adequacy of CP and TDN show deficits, while DM is in surplus. For North Toraja Regency, the adequacy of all animal feed is surplus during El Niño (2018), Neutral year (2019), and La Niña (2020). Adequacy of feed is primarily determined by the number of livestock, body weight, and correction factors according to the need for each type of feed per animal per day. This means that in North Toraja Regency, the availability of feed is higher than required. Leinonen [47] argues that the relationship between animal feeding and climate change is not just a one-way process. Future feed formulations may also be affected by changes in the availability and quality of certain feed ingredients. Such changes could be triggered by global warming and increased atmospheric CO2 concentrations. Research conducted by Saxe et al. [48] shows that an increase in CO2 will reduce the demand for land use for feed production, but at the same time would increase the need for protein from plants (soybeans), due to the reduction in the concentration of feed plant protein. This will have considerable economic and environmental consequences. Based on the results of the case study, the adequacy of animal feed is more influenced by the number of livestock and the area of rice fields as a provider of feed ingredients. Furthermore, in the context of sustainable livestock production, the three pillars of sustainability, namely, environmental, social, and economic challenges, must be integrated into the information system.
(e)
Agricultural Hazard and Related Varieties Recommendation
In addition to planting time, information on potential damage due to drought, floods, and pests’ attacks on rice, maize, and soybean, is available at the district office to support the ICCIS. This information is intended to provide early warning to farmers, so that farmers are aware of potential crop damage because of disasters in their area. This would allow them to adjust based on the potential level of damage to their crops.
The classification of crop damaged areas is determined using data from the damage area series of each metric. The frequency distribution method was used to classify the area damaged, due to drought, flooding, pests, and disease attacks by the district, as shown in Table 2.
Recommendations for drought, flooding, and pest attack were assessed using the prediction of rainfall characteristics in the form of normal, below normal, and above normal rainfall published by BMKG. Rainfall predictions for WSP 2018/2019, 2019/2020, and 2020/2021 are normal. Based on a database of varieties that are tolerant to flooding, drought, and several rice pests and diseases at various levels of the rice damage area, due to the ICCIS recommendations for Klaten and North Toraja Regencies, are described in Table 3.
Given the above conditions, climate variability significantly affects the availability of feed, especially from rice straw. The long dry season, due to El Niño, decreases the supply of hay. This will threaten the long-term availability of feed for agricultural and industrial operations. One way to minimize the impact of climate variability is to turn straw into a sustainable feed product like silage for storage and use in the next season.

3.3. Dissemination and Feedback of the ICCIS

The following session discusses the outcome of the socialization of the ICCIS over a 20-year. The Indonesian government, through the Ministry of Agriculture, has enacted a national policy to encourage farmers to implement the ICCIS [49]. Dissemination of the ICCIS is incorporated into the research activities on AIAT, which was coordinated by Indonesia Centre for Agricultural Technology Assessment and Development (ICATAD) [50].
During the period 2011–2020, the Task Force teams distributed the ICCIS to farmers and extension workers by AIAT itself or in collaboration with other agencies in the regions, such as BMKG, extension offices, and agricultural offices. Over the past ten years, only one of the 33 AIAT Task Force teams disseminates independently and with the three aforementioned organizations. The most widely distributed disseminations are through AIAT with the Extension workers office and the agricultural office. There are 5 AIATs that only deliver without engaging other stakeholders. (Table 4). The majority of the AIAT Task Force team conducted the dissemination of the ICCIS at the AIAT, agricultural office, and BPP, because the focus of the ICCIS was primarily on the extension workers. All three agencies play a role by encouraging and accommodating extension workers to support agricultural development. There are five Task Forces teams in the AIAT working group who only socialize in one agency because of the large area, limiting accessibility and mobility. There are 6 AIAT Task Forces that do not disseminate; the dissemination is only by invitation from the three agencies. These Task Forces require the motivation of each AIAT to enhance its active participation in the dissemination of the ICCIS.
Dissemination was done at different regional levels: Villages, sub-districts, regencies, and provinces (Table 5). The majority of AIATs carried out outreach activities in sub-districts, regencies, and provinces. This is because AIAT partners in the implementation of the Ministry of Agriculture’s program are at the regency and provincial levels, namely, the Agricultural Office, and at the sub-district level, namely, the Agricultural Extension Center. Four AIATs provide dissemination at all levels of administration. This can increase the adoption rate of the ICCIS as the target audience for dissemination increases. At each meeting, the average number of participants was under 25 (78.1%), 25–50 (15.6%), and 51–75 (6.3%). Most dissemination took place 1–3 times a year, according to the launch of ICCIS. Yulianti et al. [51] state that dissemination is most prevalent in the first season (WSP).
Besides the face-to-face method, dissemination was also carried out through printed media (44.9%), electronic media, namely, television and radio (18.1%), and social media, including Facebook, Instagram, YouTube, and podcasts (28.8%). Social media is now more dominant than electronic media because of its wide scope and accessibility. Social media usage is on the rise, due to factors such as ease of access, up-to-date information, accuracy, and environmental requirements. Social media may also serve as a means of learning from farmers. In contrast to the research of Yulianti, Sirnawati, and Ulpah [51], which stated that the synergy of dissemination with other institutions was a way of socialization that was also dominant at that time.
According to AIAT Task Force teams, the survey’s results showed that the access and adoption by farmers of the ICCIS are classified as moderate to high. The survey results found that 48.4% of respondents reported high and moderate accessibility to the ICCIS, and only 3.23% showed reported low accessibility. Meanwhile, the ICCIS adoption rates indicated that 51.5% of respondents reported a high ICCIS adoption rate was high, and 48.4% reported a moderate adoption rate. Research in the city of Bengkulu province has also shown that the adoption of the ICCIS by farmers is still weak. About 68% of farmers did not apply ICCIS in their farming activities, even though they are highly knowledgeable of ICCIS [52].
Several reasons caused the low adoption of the ICCIS, including: Not having enough understanding of the information and technology (20%), the communication device (phone) was not supported (20%), farmers do not understand the ICCIS (12%), difficulties in applying, due to lack of facilities and infrastructure (44%), and problems of climate, fertilizer, and variety (4%). The low adoption recorded was due to poor communication signals, inappropriate field conditions with the ICCIS, late socialization of planting season predictions, and the habits of farmers who have not believed the ICCIS. However, there were still farmers who had difficulty accessing the ICCIS because of accessibility issues related to devices and signals.
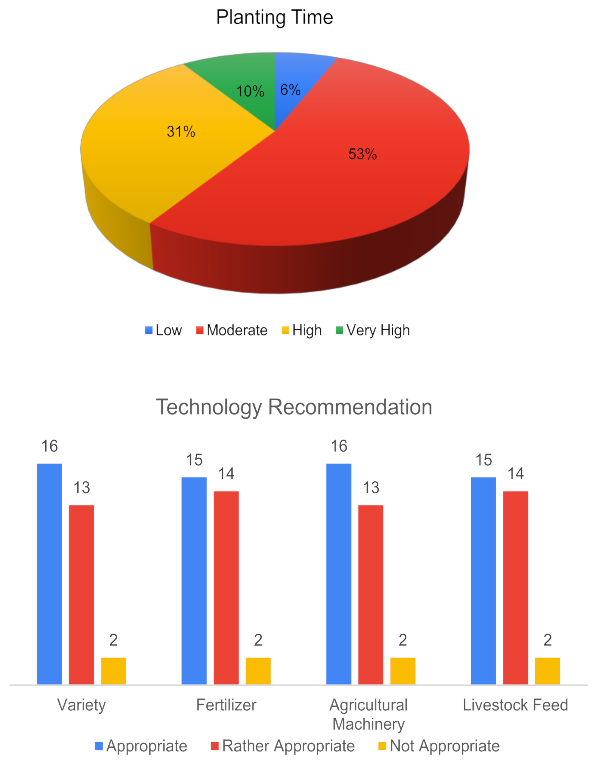
The appropriate planting time, as well as the ICCIS data and information, are presented in Figure 10. The majority of respondents agreed that the accuracy of planting time information was moderate, and some felt that the planting time information was very accurate. Farmers who applied planting time information based on the ICCIS because it is not appropriate for field conditions. Results of a survey by farmers by Azis et al. [53] in South Kalimantan also showed that 80% of farmers benefited from the ICCIS. By applying the ICCIS, the farmers would be able to know the beginning of the planting period, better rice varieties or varieties suitable to be planted in local sites, the ideal amount of fertilizer given to plants, and the type of pests that will attack. The survey in six provinces of Indonesia (North Sumatra, South Kalimantan, West Nusa Tenggara, East Nusa Tenggara, West Java, Yogyakarta) showed that the ICCIS was implemented by 123 respondents, while 15 respondents had never applied ICCIS [49].
The problems of the ICCIS encountered in the field were internet gadgets and signals (25%), unsuitable field conditions (61.29%), farmer’s habits (6.45%), and late socialization (3.23%). Similar to research by Yulianti, Sirnawati, and Ulpah [51], which conclude that the most reason for the problem was there is no availability of recommended varieties (44%), the limited information on ICCIS, and unsuitable with usual existing farming culture. Yuliarso, Windirah, and Widono [52] states the level of implementation of the full cropping calendar at the farmer level is still low. However, the technological components, such as the use of superior varieties, fertilizer, and the application of jajar legowo cropping patterns, have been implemented by farmers in the city of Bengkulu.
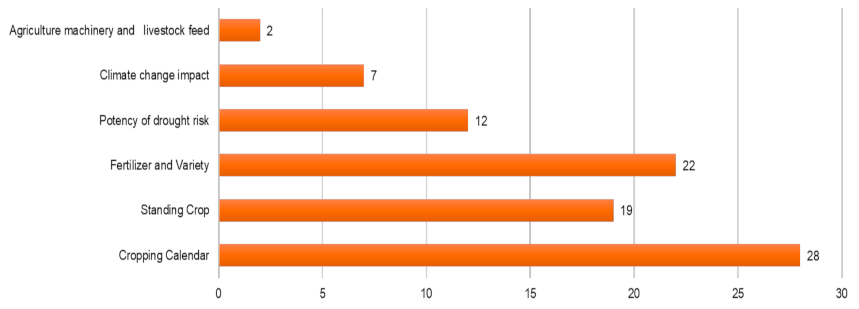
The ICCIS has a varied menu in its performance. The frequently accessed menu is presented in Figure 11. The majority of respondents frequently access the Cropping Calendar menu and followed by fertilizer and variety information. The cropping calendar menu contains information on the planting period and the cropping pattern of rice, maize, and soybeans based on the potential and dynamics of climate and water resources. These menus are often used by extension workers and farmers. At the beginning of 2015, the information is updated two times a year before WSP and DSP [53,54] explained that the information recommendations that farmers need planting time, followed by recommendations on varieties, fertilization, pests, diseases, and agricultural machinery. The survey also shows that information on planting time was most frequently accessed by users, followed by varieties and fertilizer recommendations.
To improve the ICCIS, some feedback from the survey related to the importance of validating and updating recommendations on varieties, fertilizers, agricultural machinery, and livestock in the field. Consequently, the information presented can be implemented at their respective locations.

3.4. Users Access to the ICCIS Website

Figure 12 shows the declining users of the ICCIS website over time. Some peaks occur throughout the calendar because of updating the ICCIS calendar in April for dry season information and October for the wet season. The declining process of the user can be certain possibilities. The financial incentives for the agricultural extension are more limited due to budgetary constraints, or the information from ICCIS is monotonous (updated twice a year). This finding is similar to the study by Bouroncle et al. [55], which implies the user is constrained by the climate information system. This can be overcome by integrating third-party developers to use the ICCIS as a service, such as by a pesticide or fertilizer producer or supplier.
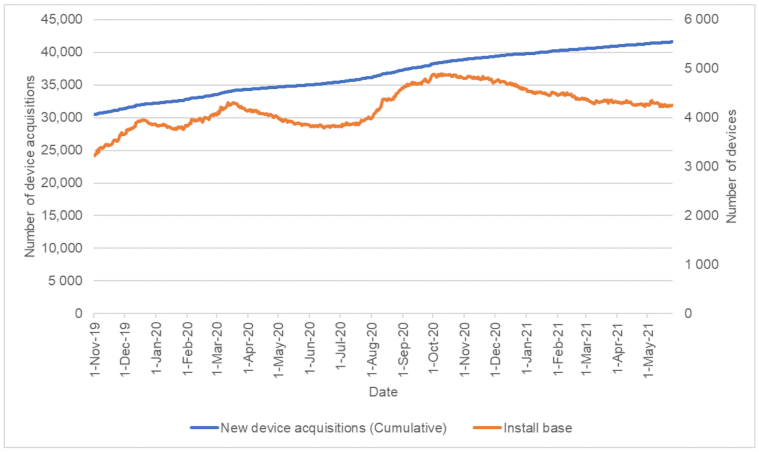
The Android application has been downloaded 35,865 times, with months remain installed devices is >4000. Figure 13 shows the accumulated Android application as increased over time. However, the amount of user loss is relatively high as the number of remains installed is fluctuating from 4000–4500 devices. The main challenge in developing the ICCIS remains an external input, which can be updated only once a year. Moreover, the information of the ICCIS is always at the macro level, which must be disseminated or explained by external resources, such as an agricultural extension. Some reports show that the farmers would be engaging more in the application, if the applications provide post-harvest activity in addition to information, such as water and pest management, storage, real-time financial subsidies, sales management, or connecting with online marketplaces [56,57,58].

4. Conclusions

One of the efforts to reduce the risk of yield loss, due to climate variability, is by adjusting the planting times and applying cultivation technologies that are in accordance with climatic conditions. To deal with this problem, the Ministry of Agriculture has developed the ICCIS. The ICCIS contains recommendations on planting time, cropping pattern, planting area, varieties, fertilizers, agricultural machinery, potential livestock feed, and crop damage, due to extreme conditions for rice, maize, and soybean, for the upcoming planting season.
The ICCIS is accessible to users, and is updated twice a year, prior to WSP and DSP. Information is available in tabular and spatial forms for as many as 7021 districts throughout Indonesia. Since its establishment, the ICCIS has undergone various improvements and adapts to technological developments to make it more accessible to users.
The ICCIS can describe shifts in planting time and planted area under climate variability conditions, such as El Niño, La Niña, and Neutral year, based on water balance calculations with input prediction of rainfall for the next six months. Increasing (decreasing) rainfall will affect the recommended planting time to be earlier (backward) and the potential for an increase (decrease) in the area of planting. This information is very useful for farmers to optimize planting in favorable climatic conditions, on the contrary reducing the risk of crop failure/harvest in conditions of insufficient rainfall for planting. To verify the accuracy of the planting time and planting area potential recommendations with respect to the standing crop during the period closest to the planting time recommendations. Differences still exist between the recommended planting area and the existing conditions in the field due to cloud cover issues. Furthermore, free high resolution, such as Sentinel-1 and Sentinel-2, may be one solution to access cropping patterns in the parcel level that needs further investigation. Further study is needed to incorporate artificial space intelligence at the field level to avoid future disasters caused by climate change or soil erosion.
The ICCIS was disseminated through print, electronic, and social media by the AIAT Task Force, involving extension workers so that information can be received and understood by farmers. Based on respondent feedback, it is concluded that the adoption of the ICCS was categorized as moderate to high. Some of these problems are caused by poor communication signals, improper field conditions with ICCIS, late dissemination of planting season forecasts, and the habits of farmers who did not believe in the ICCIS. The AIATs should encourage the Task Force to actively participate in the dissemination of the ICCIS recommendations. In terms of the technology recommendations, we found that there were still a number of problems with the recommendation of varieties that were not adapted to the conditions on the ground. It is necessary to update the recommendations for varieties, fertilizers, and feed to be more compatible with local conditions.

Author Contributions

Conceptualization, Y.A., A.P., E.S. (Elza Surmaini) and H.S.; meth-odology, Y.A., E.S. (Elza Surmaini), A.P., E.S. (Erni Susanti) and F.R.; software, A.P. and F.R.; val-idation, Y.A., E.S. (Elza Surmaini), W.E., A.P., S.S. and F.R.; formal analysis, A.P., Y.A., E.S.(Erni Susanti) and R.P.; investigation, Y.A. and E.S. (Elza Surmaini); resources, A.P., E.S. (Erni Susanti) and R.P.; data curation, A.P., E.S. (Elza Surmaini), F.R. and R.P.; writing—original draft prepara-tion, Y.A., E.S. (Elza Surmaini), W.E., A.P., F.R., S.S., E.S.(Erni Susanti) and R.P.; writing—review and editing, Y.A., E.S. (Elza Surmaini), W.E., F.R., S.S. and R.P.; visualization, F.R.; supervision, Y.A. and E.S. (Elza Surmaini); project administration, Y.A. and H.S.; funding acquisition, H.S. All authors have read and agreed to the published version of the manuscript.

Funding

This research was funded by Indonesia Agency for Agricultural Research and Development, grant number SP DIPA-018.09.2.648694/2019.

Data Availability Statement

Not applicable.

Conflicts of Interest

The authors declare no conflict of interest. All authors read and approved the final manuscript.

References

  1. Amien, I.; Rejekiningrum, P.; Pramudia, A.; Susanti, E. Effects of interannual climate variability and climate change on rice yield in Java, Indonesia. Water Air Soil Pollut. 1996, 92, 29–39. [Google Scholar]
  2. Naylor, R.L.; Battisti, D.S.; Vimont, D.J.; Falcon, W.P.; Burke, M.B. Assessing risks of climate variability and climate change for Indonesian rice agriculture. Proc. Natl. Acad. Sci. USA 2007, 104, 7752–7757. [Google Scholar] [CrossRef] [PubMed] [Green Version]
  3. Estiningtyas, W.; Surmaini, E.; Susanti, E. Vulnerability of the food crop to climate change (in Indonesian). J. Sumberd. Lahan 2016, Special Edition, 85–96, ISSN 1907-0799. [Google Scholar]
  4. Boer, R.; Surmaini, E. Economic benefits of ENSO information in crop management decisions: Case study of rice farming in West Java, Indonesia. Theor. Appl. Climatol. 2020, 139, 1435–1446. [Google Scholar] [CrossRef]
  5. Surmaini, E.; Hadi, T.W.; Subagyono, K.; Puspito, N.T. Early detection of drought impact on rice paddies in Indonesia by means of Niño 3.4 index. Theor. Appl. Climatol. 2015, 121, 669–684. [Google Scholar] [CrossRef]
  6. Odekunle, T.O.; Balogun, E.E.; Ogunkoya, O.O. On the prediction of rainfall onset and retreat dates in Nigeria. Theor. Appl. Climatol. 2005, 81, 101–112. [Google Scholar] [CrossRef]
  7. Haylock, M.; McBride, J. Spatial Coherence and Predictability of Indonesian Wet Season Rainfall. J. Clim. 2001, 14, 3882–3887. [Google Scholar] [CrossRef]
  8. Murakami, T.; Matsumoto, J. Summer Monsoon over the Asian Continent and Western North Pacific. J. Meteorol. Soc. Jpn. Ser. II 1994, 72, 719–745. [Google Scholar] [CrossRef] [Green Version]
  9. Aldrian, E.; Dümenil Gates, L.; Widodo, F.H. Seasonal variability of Indonesian rainfall in ECHAM4 simulations and in the reanalyses: The role of ENSO. Theor. Appl. Climatol. 2007, 87, 41–59. [Google Scholar] [CrossRef] [Green Version]
  10. Hamada, J.-I.; Yamanaka, M.D.; Matsumoto, J.; Fukao, S.; Winarso, P.A.; Sribimawati, T. Spatial and Temporal Variations of the Rainy Season over Indonesia and their Link to ENSO. J. Meteorol. Soc. Jpn. Ser. II 2002, 80, 285–310. [Google Scholar] [CrossRef] [Green Version]
  11. Susilo, G.E.; Yamamoto, K.; Imai, T.; Ishii, Y.; Fukami, H.; Sekine, M. The effect of ENSO on rainfall characteristics in the tropical peatland areas of Central Kalimantan, Indonesia. Hydrol. Sci. J. 2013, 58, 539–548. [Google Scholar] [CrossRef] [Green Version]
  12. Saji, N.H.; Yamagata, T. Structure of SST and Surface Wind Variability during Indian Ocean Dipole Mode Events: COADS Observations. J. Clim. 2003, 16, 2735–2751. [Google Scholar] [CrossRef]
  13. As-syakur, A.R.; Adnyana, I.W.S.; Mahendra, M.S.; Arthana, I.W.; Merit, I.N.; Kasa, I.W.; Ekayanti, N.W.; Nuarsa, I.W.; Sunarta, I.N. Observation of spatial patterns on the rainfall response to ENSO and IOD over Indonesia using TRMM Multisatellite Precipitation Analysis (TMPA). Int. J. Climatol. 2014, 34, 3825–3839. [Google Scholar] [CrossRef]
  14. Hidayat, R.; Ando, K.; Masumoto, Y.; Luo, J.J. Interannual Variability of Rainfall over Indonesia: Impacts of ENSO and IOD and Their Predictability. IOP Conf. Ser. Earth Environ. Sci. 2016, 31, 012043. [Google Scholar] [CrossRef]
  15. Satyawardhana, H.; Trismidianto; Yulihastin, E. Influence of ENSO on Deviation of The Season Onset in Java Based on CCAM Downscaling Data. IOP Conf. Ser. Earth Environ. Sci. 2018, 166, 012030. [Google Scholar] [CrossRef]
  16. Salack, S.; Muller, B.; Gaye, A.T. Rain-based factors of high agricultural impacts over Senegal. Part I: Integration of local to sub-regional trends and variability. Theor. Appl. Climatol. 2011, 106, 1–22. [Google Scholar] [CrossRef]
  17. Mugalavai, E.M.; Kipkorir, E.C.; Raes, D.; Rao, M.S. Analysis of rainfall onset, cessation and length of growing season for western Kenya. Agric. For. Meteorol. 2008, 148, 1123–1135. [Google Scholar] [CrossRef]
  18. Ndomba, P.M. Development of rainfall curves for crops planting dates: A case study of Pangani River Basin in Tanzania. Nile Basin Water Sci. Eng. J. 2010, 3, 13–27. [Google Scholar]
  19. Apriyana, Y.; Aldrian, E.; Koesmaryono, Y. The Dynamics of Rice Cropping Calendar and Its Relation with the ENSO (El Niño-Southern Oscillation) and IOD (Indian Ocean Dipole) in Monsoon and Equatorial Regions of Indonesia. In Proceedings of the IOP Conference Series: Earth and Environmental Science, Jakarta, Indonesia, 21–22 November 2018. [Google Scholar]
  20. Runtunuwu, E.; Ramadhani, F.; Setyorini, D.; Sari, K.; Apriyana, Y.; Susanti, E.; Haryono, H. Institutional Innovation of Integrated Cropping Calendar Information System to Support Climate Change Adaptation for National Food Security. Pengemb. Inov. Pertan. 2013, 6, 44–52. [Google Scholar]
  21. Runtunuwu, E.; Syahbuddin, H.; Ramadhani, F.; Pramudia, A.; Setyorini, D.; Sari, K.; Apriyana, Y.; Susanti, E.; Haryono, H.; Setyanto, P. Integrated cropping calendar information system: Current status and future challenges (in Indonesian). J. Sumberd. Lahan 2012, 6, 67–78. [Google Scholar]
  22. Aldrian, E.; Dümenil-Gates, L.; Jacob, D.; Podzun, R.; Gunawan, D. Long-term simulation of Indonesian rainfall with the MPI regional model. Clim. Dyn. 2004, 22, 795–814. [Google Scholar] [CrossRef]
  23. Chang, C.P.; Wang, Z.; Ju, J.H.; Li, T. On the Relationship between Western Maritime Continent Monsoon Rainfall and ENSO during Northern Winter. J. Clim. 2004, 17, 665–672. [Google Scholar] [CrossRef] [Green Version]
  24. Susanti, E.; Surmaini, E.; Pramudia, A.; Heryani, N.; Estiningtyas, W.; Suciantini, S.; Apriyana, Y. Updating of The Agro-climate Resources Map of Indonesia to Support Agricultural Planning (in Indonesian). Indonesian Soil Climate J. 2021, 45, 12. [Google Scholar] [CrossRef]
  25. Ministry of Agrarian Affair and Spatial Planning/National Land Agency. National Rice Field Map (in Indonesian); Ministry of Agrarian Affair and Spatial Planning/National Land Agency: Jakarta, Indonesia, 2019. [Google Scholar]
  26. Thornthwaite, C.W.; Mather, J.R. Instructions and Tables for Computing Potential Evapotranspiration and the Water Balance; FAO: Centerton, AR, USA, 1957. [Google Scholar]
  27. Ministry of Agriculture. Fertilization Recommendations for N, P, and K in Location Specific Rice (in Indonesian); Ministry of Agriculture: Jakarta, Indonesia, 2007. [Google Scholar]
  28. Setyorini, D.; Kasno, A.; Nurjaya; Adamy, I.S.; Suryono, J. Determination of Recommendations and Needs for Fertilizer Based on an Integrated Planting Calendar (in Indonesian); Indonesian Center for Agricultural Land Resources Research and Development—Indonesian Agency for Agricultural Research and Development—Ministry of Agriculture: Bogor, Indonesia, 2011. [Google Scholar]
  29. Budiharti, U.; Suparlan; Nurhasanah, A.; Nasution, D.A.; Ramadhani, F.; Mulyani; Gultom, R.J.; Nursani, D.; Sulistiyosari, N.; Harningsih, S. Mapping Development of Rice, Corn and Soybean Production Mechanization (in Indonesian); ndonesian Center for Agricultural Engineering Research and Development - Indonesian Agency for Agricultural Research and Development—Ministry of Agriculture: Tangerang, Indonesia, 2015. [Google Scholar]
  30. Brewer, C.A.; Pickle, L. Evaluation of methods for classifying epidemiological data on choropleth maps in series. Ann. Assoc. Am. Geogr. 2002, 92, 662–681. [Google Scholar] [CrossRef]
  31. Xue, Y.; Smith, T.M.; Reynolds, R.W. Interdecadal Changes of 30-Yr SST Normals during 1871–2000. J. Clim. 2003, 16, 1601–1612. [Google Scholar] [CrossRef] [Green Version]
  32. Kousky, V.E.; Higgins, R.W. An Alert Classification System for Monitoring and Assessing the ENSO Cycle. Weather Forecast 2007, 22, 353–371. [Google Scholar] [CrossRef]
  33. Runtunuwu, E.; Las, I.; Amien, I.; Syahbuddin, H. Utilizing Cropping Calendar in Coping with Climate Change. Ecolab 2011, 5, 1–14. [Google Scholar] [CrossRef]
  34. Runtunuwu, E.; Syahbuddin, H. Atlas of national food crop planting calendar to address climate variability and change (in Indonesia). J. Sumberd. Lahan 2011, 5, 1–10. [Google Scholar]
  35. Ramadhani, F.; Pullanagari, R.; Kereszturi, G.; Procter, J. Automatic Mapping of Rice Growth Stages Using the Integration of SENTINEL-2, MOD13Q1, and SENTINEL-1. Remote Sens. 2020, 12, 3613. [Google Scholar] [CrossRef]
  36. Darna, N.; Herlina, E. Choosing the Right Research Method: For Management Science Research (in Indonesian). J. Ekonologi Ilmu Manaj. 2018, 5, 287–292. [Google Scholar]
  37. Kotera, A.; Nguyen, K.D.; Sakamoto, T.; Iizumi, T.; Yokozawa, M. A modeling approach for assessing rice cropping cycle affected by flooding, salinity intrusion, and monsoon rains in the Mekong Delta, Vietnam. Paddy Water Environ. 2014, 12, 343–354. [Google Scholar] [CrossRef]
  38. Yegbemey, R.N.; Kabir, H.; Awoye, O.H.R.; Yabi, J.A.; Paraïso, A.A. Managing the agricultural calendar as coping mechanism to climate variability: A case study of maize farming in northern Benin, West Africa. Clim. Risk Manag. 2014, 3, 13–23. [Google Scholar] [CrossRef] [Green Version]
  39. Naylor, R.; Falcon, W.; Wada, N.; Rochberg, D. Using El Nino-Southern oscillation climate data to improve food policy planning in Indonesia. Bull. Indones. Econ. Stud. 2002, 38, 75–91. [Google Scholar] [CrossRef]
  40. Naylor, R.L.; Falcon, W.P.; Rochberg, D.; Wada, N. Using El Nino/Southern oscillation climate data to predict rice production in Indonesia. Clim. Chang. 2001, 50, 255–265. [Google Scholar] [CrossRef]
  41. Subardja, V.O.; Anas, I.; Widyastuti, R. Utilization of organic fertilizer to increase paddy growth and productivity using System of Rice Intensification (SRI) method in saline soil. J. Degrad. Min. Lands Manag. 2016, 3, 543–549. [Google Scholar] [CrossRef]
  42. Kai, T.; Kumano, M.; Tamaki, M. A Study on Rice Growth and Soil Environments in Paddy Fields Using Different Organic and Chemical Fertilizers. J. Agric. Chem. Environ. 2020, 9, 331–342. [Google Scholar]
  43. Hatta, M. A Site-Specific Fertilizer Recommendation Based on the Phosphorus and Potassium Status in Mempawah District, West Kalimantan. J. Trop. Soils 2020, 25, 93–106. [Google Scholar] [CrossRef]
  44. Kalpalatha, C.; Reddy, N. Impact of Agricultural Machinery and Equipment on Paddy Production (A study on Nellore district of Andhra Pradesh). IOSR J. Humanit. Soc. Sci. 2018, 23, 17–24. [Google Scholar]
  45. Qiu, Z.; Zhao, N.; Zhou, L.; Wang, M.; Yang, L.; Fang, H.; He, Y.; Liu, Y. Vision-Based Moving Obstacle Detection and Tracking in Paddy Field Using Improved Yolov3 and Deep SORT. Sensors 2020, 20, 4082. [Google Scholar] [CrossRef]
  46. Kiratiratanapruk, K.; Temniranrat, P.; Sinthupinyo, W.; Prempree, P.; Chaitavon, K.; Porntheeraphat, S.; Prasertsak, A. Development of Paddy Rice Seed Classification Process using Machine Learning Techniques for Automatic Grading Machine. J. Sens. 2020, 2020, 7041310. [Google Scholar] [CrossRef]
  47. Leinonen, I. Achieving Environmentally Sustainable Livestock Production. Sustainability 2019, 11, 246. [Google Scholar] [CrossRef] [Green Version]
  48. Saxe, H.; Hamelin, L.; Hinrichsen, T.; Wenzel, H. Production of Pig Feed under Future Atmospheric CO2 Concentrations: Changes in Crop Content and Chemical Composition, Land Use, Environmental Impact, and Socio-Economic Consequences. Sustainability 2018, 10, 3184. [Google Scholar] [CrossRef] [Green Version]
  49. Azis, A.; Muljono, P.; Las, I.; Mulyandari, R.S.H. Implementation of integrated cropping calendar information system (ICCIS) to improve farmer’s knowledge and to adapt the climate change. Innov. Sci. Inf. Serv. Netw. 2019, 16, 3226–3233. [Google Scholar]
  50. Syahbuddin, H.; Purnamayani, R.; Siska, W.; Humaedah, U.; Suryaningrat, B.; Ethika, A.P.W.; Medionovianto, R.D.; Priyadi, I. Application of Technological Innovations for Improving the Planting Index (in Indonesian); Indonesian Center for Agricultural Technology Assessment and Development—Indonesian Agency for Agricultural Research and Development—Ministry of Agriculture: Bogor, Indonesia, 2018. [Google Scholar]
  51. Yulianti, A.; Sirnawati, E.; Ulpah, A. Introduction technology of cropping calendar-information system (CC-IS) for rice farming as a climate change adaptation in Indonesia. Int. J. Adv. Sci. Eng. Inf. Technol. 2016, 6, 92. [Google Scholar] [CrossRef]
  52. Yuliarso, M.Z.; Windirah, N.; Widono, S. The Implementation of Integrated Cropping Calendar on Lowland Rice Farming in Bengkulu City. J. AGRISEP Kaji. Masal. Sos. Ekon. Pertan. Dan Agribisnis 2020, 19, 407–416. [Google Scholar] [CrossRef]
  53. Azis, A.; Muljono, P.; Las, I.; Mulyandari, R.S.H. Utilization of integrated planting calendar technology to increase local rice productivity in South Kalimantan (in Indonesian). Proc. Natl. Semin. Use Local Var. Support Community Econ. Growth 2020, 1, 25–38. [Google Scholar]
  54. Dewi, E.R.; Susanti, E.; Apriyana, Y. Planting time options to improve rice productivity based on the Integrated KATAM recommendations. IOP Conf. Ser. Earth Environ. Sci. 2021, 648, 012105. [Google Scholar] [CrossRef]
  55. Bouroncle, C.; Müller, A.; Giraldo, D.; Rios, D.; Imbach, P.; Girón, E.; Portillo, F.; Boni, A.; van Etten, J.; Ramirez-Villegas, J. A systematic approach to assess climate information products applied to agriculture and food security in Guatemala and Colombia. Clim. Serv. 2019, 16, 100137. [Google Scholar] [CrossRef]
  56. Rose, D.C.; Sutherland, W.J.; Parker, C.; Lobley, M.; Winter, M.; Morris, C.; Twining, S.; Ffoulkes, C.; Amano, T.; Dicks, L.V. Decision support tools for agriculture: Towards effective design and delivery. Agric. Syst. 2016, 149, 165–174. [Google Scholar] [CrossRef] [Green Version]
  57. Sun, Z.; Di, L.; Fang, H.; Guo, L.; Yu, E.; Tang, J.; Zhao, H.; Gaigalas, J.; Zhang, C.; Lin, L.; et al. Advanced Cyberinfrastructure for Agricultural Drought Monitoring. In Proceedings of the 2019 8th International Conference on Agro-Geoinformatics (Agro-Geoinformatics), Istanbul, Turkey, 16–19 July 2019; pp. 1–5. [Google Scholar]
  58. Mase, A.S.; Prokopy, L.S. Unrealized Potential: A Review of Perceptions and Use of Weather and Climate Information in Agricultural Decision Making. Weather Clim. Soc. 2014, 6, 47–61. [Google Scholar] [CrossRef]
Figure 1. Two examples of rice-growing areas on Klaten and North Toraja Regency.
Sustainability 13 06495 g001
Figure 2. The process of ICCIS compilation, updating, recommendation formulating, and dissemination.
Sustainability 13 06495 g002
Figure 3. Determination of ENSO years using the Ocean Nino Index.
Sustainability 13 06495 g003
Figure 4. The interface of ICCIS on the website.
Sustainability 13 06495 g004
Figure 5. The current back-end and front end of ICCIS in 2019.
Sustainability 13 06495 g005
Figure 6. Timeline of features in the ICCIS.
Sustainability 13 06495 g006
Figure 7. ICCIS recommendation of the crop planting area in DSP 2020 and WSP 2020/2021.
Sustainability 13 06495 g007
Figure 8. An example of standing crop information (a) a webpage and (b) a tabulation page.
Sustainability 13 06495 g008
Figure 9. Map of planting time of the wet season in Neutral, El Niño, and La Niña in the Klaten Regency (above) and North Toraja Regency (below).
Sustainability 13 06495 g009
Figure 10. Accuracy of ICCIS planting time (above) and technology recommendation (below).
Sustainability 13 06495 g010
Figure 11. Frequently accessed menu in ICCIS according to respondents.
Sustainability 13 06495 g011
Figure 12. The number of pages visited and new users per month to access the ICCIS website.
Sustainability 13 06495 g012
Figure 13. Accumulative new devices acquisitions and install base for Android application.
Sustainability 13 06495 g013
Table 1. Recommendations of the ICCIS on the onset of WSP and rice planting area for El-Nino year 2018/2019, Neutral year 2019/2020, and La-Nina year 2020/2021 in Klaten and North Toraja Regencies.
ENSOThe Onset of Planting TimePotential Planting Areas (Ha)
Klaten Regency
El Niño year 2018/2019Nov III–Dec I30,052
Neutral year 2019/2020Oct II–III55,046
La Niña year 2020/2021Nov I–II46,179
North Toraja Regency
El Niño year 2018/2019Nov I–II8553
Neutral year 2019/2020Oct II–III14,135
La Niña year 2020/2021Sep III–Oct I19,039
Table 2. Classification of crops damaged area due to various hazards.
CropCategoryDamaged Area (ha)
FloodDroughtBPHRFRRSBRTDBLBRBD
RiceVery low0–100–100–10–50–30–10–10–2
low10–3010–301–55–103–101–21–32–5
moderate30–8030–805–1010–2010–202–103–55–15
high80–28080–26010–3020–6520–5510–205–1515–40
Very high>280>260>30>65>55>20>15>40
Note: BPH (Brown Planthopper), RFR (Rice field Rat), RSB (Rice Stem Borer), RTD (Rice Tungro Disease), BLB (Bacterial Leaf Blight), RBD (Rice Blast Disease).
Table 3. Recommendation varieties based on several agricultural hazards in Klaten District and North Toraja.
Agricultural HazardKlaten DistrictNorth Toraja District
CategoryVarieties RecommendationCategoryVarieties Recommendation
FloodModerateInpari 17, 21–24, 29, 30, Inpara 1–7SafeInpari 11–13, 17, 21–24, 29, 30, Inpara 1–7
DroughtModerateInpari 10, 13, 18–20, 38–41, Situ Patenggang, Limboto, Situ Bagendit, Batutegi, Inpago 7, 8, 10SafeInpari 1, 10, 13–16, 18–20, 38–41, Situ Patenggang, Limboto, Situ Bagendit, Batutegi, Silugonggo, Inpago 6–8, 10
Brown PlanthopperVery highInpari 13,31,33, MekonggaSafeInpari 1–3,5,6,10,13,18,19,31–33, Widas, Cisantana, Konawe, Mekongga
Rice field RatVery high-High-
Rice Stem BorerVery high-Low-
Rice Tungro DiseaseModerateInpari 5, 7, 21, Tukad Unda, Tukad Petanu, Tukad BalianSafeInpari 4, 5, 7–9, 21, 31, 33, Tukad Unda, Tukad Petanu, Kalimas, Bondoyudo
Rice Blast DiseaseVery highBatang Piaman, Situ Patenggang, Limboto, Inpari 28, Inpari 32HDBHighInpari 11, 17, 28, Batang Piaman, Situ Patenggang, Limboto, Danau Gaung, Batutegi, Inpari 32HDB
Bacterial Leaf BlightVery highInpari 1, 6, 17, Conde, Angke, Inpari 32 HDB, Hipa 18SafeInpari 1, 3, 4, 6, 7 Lanrang, 8, 11, 15–20, Mekongga, Conde, Angke, Inpari 32 HDB
Table 4. The number of annual meeting forums for ICCIS dissemination for the period 2011–2020.
AIATBMKGBPPAgricultural OfficeNumber of Forum Dissemination
8
3
1
2
1
1
1
1
3
8
3
1
Table 5. Administration level of the ICCIS dissemination.
Level of DisseminationNo of AIAT
VillageSub DistrictRegencyProvince
1
2
3
1
6
6
10
4
Publisher’s Note: MDPI stays neutral with regard to jurisdictional claims in published maps and institutional affiliations.