1. Introduction: Co-Creation Planning in Brazil
Spatial planning is still a major challenge in Brazil, as well as to the rest of the world. It is not an easy task to recognize that space should be thought of in terms of its local culture and values, according to its geographical specificities and the exploration of its potential uses, adjusting it according to its vulnerabilities, while respecting the needs imposed by a global consciousness. Brazil owes a significant growth in its thought processes regarding space to the period in which modernist thinking was prevalent, where space was understood as a blank canvas for architects to draw and, thanks to the creative genius of urban design, be able to solve complex social, environmental, and economic issues. However, time has shown that cities that were delimitated and planned as complete cosmoses required less than 50 years to be transformed into complex and dynamic areas (Belo Horizonte, Brasília, Palmas, and others). At the same time, the City Master Plans, instruments that were supposed to translate collective agreements and shared routes as values to be pursued, also became pieces borne out of pure legal obligation, and became poorly effective in terms of urban landscape. This can be expressed by the percentage of buildings that indeed fulfill the requirements of Master Plans and the Law for Land Use and Occupation in different municipalities.
What is observed in planning programs is that top-down processes failed to promote quality to a common future for the citizens. Planners worked in authorial proposals, not considering the opinions of the people living in the place. With this in mind, it seems appropriate to experiment with bottom-up processes that start by listening to the expectations of the citizens. In investigating possible paths, Geodesign emerges as a method that promotes the collective construction of opinions and ideas, in a process that focuses on co-creating and negotiating an alternative future. However, everything relies on how it is applied and how the different stages of the planning system are executed.
As a significant contribution for shared planning processes, Geodesign has been widely developed over the past decade. Some authors argue that it represents a continuity from the topics initially proposed by McHarg in “Design with Nature” [
1], as the process could even be analogically conducted. Nonetheless, the major difference is in associating resources provided by geospatial technology, especially web-based ones, and using them as a support for collectively planning alternative futures for a given landscape [
2,
3,
4]. In essence, it is about planning (designing), considering geography (geo), and including different social agents into a dynamic construction that is led by a mediator. Among these authors, Steinitz’s [
5] work is noteworthy. They structured a framework that includes models that are built on pre-workshop stages and during the workshop itself, both of which support decision-making.
In Brazil, shared planning is clearly stated as a goal in the 1988′s Constitution, also known as the “Citizen Constitution,” which established that decisions that affect the interests of our society must be taken collectively. This takes shape in Law 10.257 from 2001, the Statute of Cities, which defines participatory planning as a requisite. The question is: what kind of participation?
According to Khakee [
6], there are different levels and forms of integrating citizens into planning processes, namely, through the following lines of thought: Rational-Comprehensive Planning; Incremental Planning or Incrementalism; Advocative Planning; Implementation-oriented Planning; Strategic Planning; Transitive or Participatory Planning; Negotiation Planning and Communicative Planning. All the approaches can be considered and accepted as forms to include citizen participation in decision-making processes, but all of them also bear serious limitations in terms of what that “participation” is.
Based on Khakee’s (op. Cit.) schematics, and the discussions led by authors such as Pressman and Wildavsky [
7], Kinyashi [
8], Oliveira [
9], and Stumptener [
10], we proposed the evaluation of how these different approaches relate to planning in Brazil. Rational-Comprehensive planning was and still is widely used in Brazil, conducted by groups of technicians that elaborate robust studies regarding an area and based on its characterization, possible vulnerabilities, and potentialities, making decisions alongside political forces. Long and thorough diagnoses are produced, which include listening to citizens, but by the end of the process, the reality has already been transformed, and the plan continues to be mostly the result of a group’s authorial process.
Advocative Planning is quite common in projects that take place in Brazil’s more disadvantaged communities. Technicians believe they need to act on behalf of the people they represent, even creating structures that guide how actions are to be taken, so that citizens believe they are taking part in the process even though, in fact, they are being conducted regardless of the noble intentions of their guides. Strategic Planning would only be possible if we had already identified, as a first step in regional planning, the landscape units and scopes, the main values, and genius loci of the places. Participatory Planning aims to create bonds between citizens and technicians, but the latter would need to have strong communicational skills and the ability to orchestrate processes and motivate people, without disregarding that technical guidance should act as an additional source of information. Unfortunately, technicians would need to expand their own conditions to listen to citizens and perform mediations that are more than simply asking people to vote on proposals.
Negotiation Planning has become common in Brazil, when different social groups settle on deals that benefit both parties (or more), which is the case in Consortium Operations and other kinds of agreements that use both public and private resources to fulfill the interest of all parties involved. Although it is based on the partnerships established by different sectors, these agreements do not necessarily constitute shared decisions that were achieved in consideration of other social agents.
Still using Khakee’s [
6] model, Communicational Planning defends the idea that each action is specific to an individual case, therefore acknowledging that planners are a nonneutral part in the process and should act as mediators, guiding discussions toward achieving consensus. When analyzing Geodesign and the framework proposed by Steinitz [
5], it is possible to observe the central role a mediator can have, as they will be the ones who define: which themes will be discussed (conceived as systems); the spatial analysis models that will be offered to participants as the basis for further work (Evaluation Models); the areas allowed to receive proposals; the calculation involving the impact of the decisions taken by participants (and classified as positive or negative according to the organizing group, based on a matrix that checks whether the ideas were placed on the locations that are appropriate to receive them). Moreover, the mediator must orchestrate things in a way the group is able to achieve a final decision, even if using strategies that do not necessarily expand their understanding of the problem at hand.
In that sense, the idea of Transformative Learning, proposed by Forester [
11], is particularly interesting and suitable for contemporary Brazil. The reason is that Brazilian citizens need to learn how to participate, rather than undergo processes in which they are conducted and led to believe that they have participated. It is worth noting that, to Forester (op. Cit.), the product of planning is not necessarily the plan, but can also and should be a way for participants to create knowledge, which is what provides support for opinion making.
In the evolution stage, in which citizens need to learn to act, there is no room for conducting participants through models that already tell them where to do what and, ultimately, working as a means toward a model of decision-making. In this current stage of planning, the goal must be to transform citizens who will effectively have their opinions registered and choose, on their own, which variables will define how they choose the “right” area. Furthermore, they have a right to an individual vote even though they will also participate in collective processes that involve listening and discussing.
GisColab was created to support planning processes based on Geodesign, in a flexible way to adapt to different work frameworks according to the specifics of the case study. In its approach, the most tested process has been to start by listening to citizens’ opinions through reading enrichment, followed by the construction of ideas. The participants do not receive a synthesis as an evaluation map, but a collection of maps that represent the main variables they can combine freely, to choose the right place and the right idea according to their way of thinking. GISColab, the Brazilian Geodesign platform, was developed by Freitas and Moura [
12], and structured around three main components:
- (a)
Geographical Base—The data produced can be stored in GDB (Geographic Database) format, Shapefile for vectorial information, and GeoTIFF for raster data.
- (b)
Geoserver Map Server—Using open-source standards established by the Open Geospatial Consortium (OGC). The Map Server is responsible for converting geographical information into webservices, thus lending a more dynamic nature to the diffusion of data, and guaranteeing interoperability.
- (c)
Metadata Catalog—The metadata catalog server is responsible for documenting all the information produced that will be used for decision making and spatial analysis. It plays the crucial role of formalizing and registering the spatial set that was used as data in decision making and of registering all the information derived from reading and analyzing the basic data. For this purpose, Geonetwork, a catalog software that manages spatially referenced resources, was used. It is currently used in several data infrastructure initiatives across the world.
- (d)
WebMap/WebGIS—WebGIS allows us to retrieve and visualize the information that is registered on the metadata catalog, as well as organizing it in ways that provide a clearer context of the data and its subsets. Furthermore, other functionalities were developed, which allow its use in shared decision-making processes and Geodesign. We used Mapstore2, but optimized by scripts and programming made by us. It is a highly modular WebGIS open-source software developed by GeoSolutions, to safely create, manage, and share maps and panels.
With the goal of conducting a comparative research on Geodesign planning, as well as building a national study group, a single research topic was developed, namely: “Geodesign Brazil: Trees for Metropolitan Regions,” referring to 13 Brazilian metropolitan regions located across the country. The same method was proposed to all case studies, using the GISColab platform and the same Geodesign framework, to find similarities and differences in performances in planning, as the country has continental size, as well as many different local realities in geography, climate, culture, economy, and social conditions. Even though a scope was delimited—Metropolitan Regions—each still bears its own realities in terms of landscape, connections, social and cultural groups, population size, and infrastructure. In theory, when a metropolitan region is delimited, planning should be considered in broader terms, as an urban agglomeration that is polarized by the main city and in which comparisons can be made regarding infrastructure, economic production, and habitation. That would be the case in theory; however, what we can observe is that, in many cases, there are different conditions in different cities that are disconnected among themselves and may include large areas with no common relationships to one another. Therefore, despite defining a specific scope (metropolitan regions) to compare them, their realities are significantly different. Given a country with such complexity, planning methodologies need to be sufficiently flexible and adaptable to different realities, even if following a single, agreed-upon framework. Comparing realities is hardly possible and often results in no learning experience, but comparing how processes are appropriated is interesting and may lead to a transformative learning experience.
Materials and Methods
As materials and methods, it is necessary to identify the processes proposed by the IGC world group (International Geodesign Collaboration (the International Geodesign Collaboration group. Available online:
https://www.igc-geodesign.org/ (accessed on 4 January 2021)) network) and the specific processes adopted by the Brazilian group.
The world group that investigates Geodesign as a method of participatory planning in many parts of the world proposes, for each year, common working routes, and common goals, so that all participants follow these proposals in their countries and in their case studies. For the years 2020/2021, the agreement was to apply Geodesign to discuss innovative ideas for regional planning, considering the themes of water, vegetation, housing, transportation, commerce and industry, institutions, energy, agriculture, tourism and culture, and carbon credit, with an emphasis on CCO2. The ideas should favor meeting the goals of sustainable development (SDG), with an emphasis on global climate change. The participating countries already have experience in Geodesign, and the challenge would then be to work with the problem of innovation and SDGs. In a global meeting, participants will have the opportunity to report their experiments, presenting the positive and negative results of the method.
Specifically for Brazilian experiments, it was decided to use the Brazilian Geodesign Platform, GISColab, and it was established that all 13 case studies, from metropolitan regions, would start their work with the same collection of thematic maps, characterizing the study areas, in the form of a WebGIS. As a first task, they would be asked to record notes on existing vulnerabilities and potentialities, in the form of a VGI (Volunteered Geographic Information). As a second task, they would be asked to propose ideas according to the established themes, and for 3 meetings, they would increase the level of innovation of these ideas. Finally, through negotiation processes, they would result in a territorial plan for the area, covering the SDGs and guaranteeing a 30% increase in carbon sequestration. Each step is detailed in the development of the text.
2. Trees for Metropolitan Regions: Geodesign Brazil
The project was created for a group of Brazilian universities to participate in the IGC—International Geodesign Collaboration network, which deals with scenario-based research projects at regional and local scales, while also addressing future global changes using Geodesign. Each year, the organizers, led by Steinitz, create a work proposal that must be followed by participants in their local case studies, so that, during the event, the results can be presented, compared, and shared between everyone.
In 2021, the proposal was that each group selected an area of regional dimension, using a set of eight specific systems and two additional ones of their choice, to tackle the issue of carbon credit and build scenarios for the “Non-adopter,” “Late-adopter,” and “Early-adopter” approaches in the years of 2035 and 2050.
In Brazil, a group was formed to apply the same approach in each of their metropolitan regions: Trees for Metropolitan Regions. The 13 metropolitan regions (MR) and the 15 universities/institutions involved were: Universidade Federal da Bahia (Salvador MR), Universidade Federal do Pará (Belém MR), Universidade Federal de Minas Gerais (Belo Horizonte MR), Universidade do Estado de São Paulo campus Rio Claro and Universidade de Campinas (Campinas MR), Universidade do Extremo Sul Catarinense (Carbonífera MR), Universidade do Estado de Santa Catarina (Florianópolis MR), Universidade Federal do Ceará (Fortaleza MR), Universidade Federal de Goiás (Goiânia MR), Universidade Federal do Amapá and Secretarias do Estado do Governo do Amapá (Macapá MR), Universidade Federal de Tocantins (Palmas MR), Universidade Federal de Pernambuco (Recife MR), Universidade Federal Rural do Rio de Janeiro and Universidade Federal de Juiz de Fora (Rio de Janeiro MR), and Universidade do Estado de São Paulo (São Paulo MR) (
Figure 1).
In the Brazilian case studies, we adopted the eight basic systems defined by the IGC (hydrography, vegetation, transportation, habitation, commerce and industry, energy, agriculture, and institutions) and included, as specific systems, tourism and culture, as well as carbon credits. This guaranteed that the main theme was more thoroughly discussed through proposals (areas for recovery and CO2 sequestration), even if they coincided with ideas that were simultaneously proposed in one of the other nine systems.
The platform used for developing the 13 case studies was GISColab, the Brazilian Geodesign platform, which incorporates resources from WebGIS, SDI (Spatial Data Infrastructure), and dynamic scripts that support decision-making (Moura and Freitas, 2020). The meetings for each case study took place over 4 weeks, with around 3 to 4 h of work per week, according to the following schedule: (1) Reading Enrichment; (2) Proposal for the Scenario Without Innovations (non-adopter) in 2035 and 2050; (3) Proposal for the Scenario with Innovations (Late-adopter) in 2035 and 2050; (4) Proposal for the Scenario with Several Innovations (Early-adopter) in 2035 and 2050; (5) Post-Workshop Analysis (
Figure 2).
To prepare the workshop, UFMG’s group (Federal University of Minas Gerais) was responsible for producing the entire collection of data for each MR (metropolitan region) and transforming it into spatial information, thus guaranteeing everyone would receive the same set of around 40 thematic maps used to support the analysis of the 10 systems, as well as for building ideas. All the data were retrieved from free platforms, 2 of them international (satellite and terrain images) and 15 national ones, all of which underwent adjustments for cartographic projection, spatial cropping, attribute association, and caption organization to achieve specific goals, as well as standardizing them. Aside from the work involving the data itself, geoprocessing models were applied to transform them into geospatial information, according to at least one of the following procedures: (a) Taxonomic classification (classes of captions created according to specific goals); (b) Spatial classification (identify areas of influence or in which occurrences were concentrated); (c) Mathematical classification (employs models according to indexes or algorithms); (d) Hierarchical classification (occurrences per degree of pertinence to the goals of the study).
The 40 maps were organized according to systems, to be used by participants in WebGIS format. Some themes showed up in more than one system, sometimes with the same caption, and other times with a highlight on captions that have relevance for a given system. For instance, the theme “Surface Temperature” is of particular interest to the “Energy” system but is also of interest for “Carbon Credits.” The theme “Insolation per Aspect” is particularly relevant for the “Energy” system, but also for the “Agriculture” one. “Slope inclinations” are important for the “Transportation” system (due to the maximum inclinations of 15% for road), “Habitation” (highlighting maximum inclinations of 30% for urban installments), and “Agriculture” (separating a maximum inclination of 13% for agricultural mechanization). Therefore, layer distribution was freely used by participants through overlaps, transparency, or even by moving the system around (
Figure 3).
It should be noted that the same collection of thematic maps separated by systems for each area was provided for all groups, but during the workshops, some of them included, on their own account, additional layers that were deemed strategic for their decision-making.
2.1. Reading Enrichment—Day 1 of the Workshop
During the first day of the workshop, groups were given access to their respective projects in GISColab and were instructed to work within the context of “Reading Enrichment.” The 43 maps were presented in WebGIS format, organized according to the 10 systems, as discussed above, and the participants’ task was to conduct an informative reading of the data, by analyzing each individual map, groups of overlapping maps, using transparency resources, or moving the layers around and creating compositions of interest.
Once they felt informed enough, the participant would notify the others, add remarks, complement it with missing information, register noteworthy vulnerabilities or potential uses, and add warnings regarding known conflicts within the areas. This process is called “Annotation,” in which points are marked according to the color scheme used by systems in the workshop. Organizers could also allow participants to create their notes as lines or polygons, but the decision was made to standardize them as points with symbols to facilitate geovisualization, as using color schemes allows for a visual aggregation of the notes (
Figure 4 and
Figure 5).
The participants could also include new layers of maps into the systems if they deemed them relevant. Out of the 12 total groups, 4 of them included layers regarding specific traits of the area, which they considered fundamental for further discussions. The result of this initial reading of the local reality results in a dynamic layer for the following stages of the process. In other words, as new annotations are made, they are automatically added and show up in all the contexts as an informative layer, thus providing extra support for designing ideas (
Figure 6).
In cases where there were many participants, they were separated into groups A and B, with the reading enrichment stage taking place in separate contexts, and their annotations being later united into a single layer, during the following stages of the workshop.
2.2. Idea Proposals—Without Innovations—Day 2 of the Workshop
During the second encounter, participants were encouraged to read the annotations left by others in the “Annotations” layer, which is symbolized as “Reading Enrichment” and is grouped with the other contexts as a dynamic layer.
This is the moment where ideas are proposed, initially without innovations, or in other words, in the traditional sense of planning, as a “non-adopter.” Although the IGC’s work proposal stated that only the 2050 “non-adopter” scenario was required, we decided to also work with the context of the 2035 “non-adopter” scenario as well. The reason is that it would be a way for participants to better understand planning in shorter- and longer-term scales. Initially, as there were no innovations required, we did not encourage participants to fulfill any goals or to give extra thought to the issue of carbon credits, which was presented as just another one of the systems being discussed. Participants could use points, lines, and hollow polygons (composed of polylines) to design their ideas. No goals were established and, despite their knowledge of the existence of 10 systems for proposing ideas, no group managed to create proposals for every one of them (
Figure 7).
2.3. Idea Proposals—With Innovations—Day 3 of the Workshop
In order to construct ideas with some innovations considered, as part of the “late-adopter” context, participants were asked to consult the examples defined as “assumptions,” previously prepared by the IGC group. The selection of ideas organized according to each system had the goal of encouraging users to choose proposals that were different from the usual ones, though also allowing them to create their own innovative proposals. The participants consulted the IGC website to select assumptions to apply to their studies.
In some projects, the participants were divided into Group A and Group B. Group A was asked to elaborate the 2035 with innovations (late-adopter) scenario considering only the annotations provided by the Reading Enrichment stage. Group B was to create the 2050 with innovations scenario (late-adopter) but observing the ideas that were previously presented in the context of 2035 without innovations (non-adopter). In projects where the number of participants was lower, the same logic was applied, but the same group of participants created both proposals according to their time sequence.
As the project had to contain innovations, aside from the listed ideas, participants should also be able to achieve goals related to carbon credits. For the year of 2050, it was necessary that they proposed a minimum of a 30% increment in areas with robust vegetation cover, which could be obtained by investing in the conservation of strategic areas, the expansion of areas with potentialities, or even by creating new areas located in positions of particular interest. As they were required to consider both the 2035 and 2050 scenarios, they had to make decisions regarding the goal until 2035, and by 2050, they had to achieve the minimum requirement of 30%. To support their decisions, participants had access to thematic maps regarding the surface temperature, distribution of robust vegetation cover and protected areas, and landscape ecology metrics per vegetation fragments (core area, stepping-stones, and shape factor) (
Figure 8).
The goal of a 30% robust vegetation cover was defined according to a paper by Crowther et al. [
13] that indicates that an increment of this magnitude by 2050 could balance out the global deficit in carbon credit. For the calculation of average vegetation values, the maps of Crowther et al. (op. Cit) were used, and for the calculation of carbon credit potential above the ground, the maps of Spawn and Gibbs [
14] were used. As a supporting process for decision-making, an algorithm was included to perform the calculations regarding polygon areas in locations used for carbon sequestering. The results were presented as widgets, which dynamically inform participants of the percentage achieved by the proposals, total polygon area, the number of trees that will be inserted in that specific case study area (the amount is a function of the biome and local conditions), and how much CO2 sequestering will be generated above and below soil (measured in MgC units). To reach these values, the widget would calculate today’s robust vegetation sequestering rate for each case study, define the average of trees in these existing areas, and project what a 30% increase would mean. The script would then measure what was proposed and present the partial results, providing participants with their group’s performance (
Figure 9 and
Figure 10).
2.4. Idea Proposals—Several Innovations—Day 4 of the Workshop
During the fourth and final encounter, participants were asked to revisit and evaluate the proposals for 2035 with innovations to create proposals for 2050 with Several Innovations, according to the Early-Adopter logic. Workshops with a lower number of participants used only the context of 2050-A Several Innovations, but those with a higher number were divided into 2050-A and 2050-B Several Innovations, with a negotiation stage in the end.
Once more, similar to in the round of day 3 (with innovations), participants were encouraged to search the list of ideas provided by IGC (assumptions) to select ideas, or they could even come up with very innovative ideas on their own. They were also asked to fulfill a minimum goal of a 30% increase in CO2-sequestering resources, proposing new areas of conserving, creating, or adding robust vegetation. To control if they had achieved the goal, they used a widget, a tool presenting algorithms that provided visual support to the indexes.
The fundamental difference in this final stage was the construction of more robust dialogs and the voting mechanism. Once the ideas were presented, participants would add their comments regarding each proposal. The comments, in the form of dialogs, aim to question or request additional information on the ideas, lend support or provide criticism, and impose conditions on their execution. Registered comments are fundamental for the following stage, which is the voting. The reason is that participants will issue a vote (“like” or “don’t like”) not only based on the location, title, and description of ideas, but also based on the comments made by other participants. It is worth noting that discussions can take place in groups, as they exercise listening and exchange thoughts, but that voting is individual, because we consider it important that each participant is able to manifest their own thoughts to create a sense of co-responsibility. As previously discussed, in larger groups, the contexts were alternated for commenting, and the final result is the synthesis of both designs (
Figure 11).
3. Post-Workshop Evaluation and Further Discussions
Questionnaires were submitted to all participants in Brazil. In total, 113 replies were obtained. Most of the participants identified themselves as students (76%), followed by professors (11%), public sector professionals (8%), and private sector professionals (5%). A little less than half of the participants replied that they had prior knowledge of the Geodesign methodology (41%), but 69% said that they never participated in a workshop of this nature and 99% said that they improved their knowledge on the subject. Participants who declared to have a deeper knowledge of the area prior to the workshop account for 65%, and 99% replied to have increased their interest on the area.
Regarding the use of the GISColab platform, 86% declared that it was easy to use during the Annotation stage, 86% found it easy to use during the Dialog stage, and 94% that it was easy to use during the voting stage. A total of 96% of participants replied that they understood how the process of Geodesign works and 86% declared that they understood the logic of the non-adopter, late-adopter, and early-adopter. Regarding the collection of maps made available through the WebGIS platform, 97% of participants considered it important to have access to that resource.
When asked about the existence of maps that they did not use during the workshop, answers indicate that many of them did not use maps of airport locations, ducts (infrastructure), caverns, and number of young people. Some of the most used maps were urban spot and urban area, robust vegetation, soil coverage and use, and conservation units. Maps that participants would like to include consist of mining areas, bus stops, gardening and farming areas, zoning according to local Master Plans, height templates according to legislation for land use and occupation, geological risks, and highlights on areas that contain villages and slums.
In replies to open-ended questions regarding the potentialities of Geodesign and the employment of GISColab, many noted the possibility of widespread application in planning processes, as well as the positive impact this can have in the future of the studied areas. They pointed out how participants were involved in co-creation, the possibilities for citizen participation, and the expansion of knowledge that the experience provided, as well as the potential for considering different points of view and the flexibility of the platform. There was a lot of positive feedback, but we highlight three of them that synthesize the overall response:
“The conceiving of Geodesign, it seems to me, is the right thing to do when we think about optimizing the use of scarce resources and territorial planning with the goal of promoting the well-being of these generations, as well as future ones.” “Geodesign is a tool that manages to provide an egalitarian database that is easy to manage, so that people with different experiences can have the same basic support to apply their ideas. This allows planning to be truly integrated and shared among its different agents.” “It can change the course of urbanization processes, through the inclusion of environmental aspects that are necessary to promote a better quality of life in the cities, and reduce the vulnerability of its population, especially the less privileged ones.”
Few comments addressed the limitations, and most focused on the limitations of a web-based platform and the restrictions imposed by slow Internet connection, delays when loading data, outdated data that were retrieved from national spatial data infrastructures, and criticism involving the difficulty of thinking about innovations in a country where basic issues have not yet been solved.
In evaluating the results from the proposed scenarios, CO2 sequestering and contributions to CO2 credit were the most successful ones. This is likely due to the use of widgets with alerts on the metrics used, which encouraged participants to work a bit harder in constructing their ideas. The quality of the maps provided to facilitate the construction of ideas is also worth noting (soil uses, current vegetation condition, surface temperature, protected areas, and landscape ecology metrics per fragment of vegetation). However, many systems did not receive the same attention when creating ideas, which will require a more active role by mediators in encouraging idea building for all systems, perhaps by promoting thematic debates and resorting to the help of experts.
A post-workshop analysis proposed by the IGC group was to evaluate if the objectives of sustainable development (Sustainable Development Goals–SDGs, ONU), agreed upon in 2015 as goals for 2030, were addressed in the workshop, according to a 17-item list (1. No Poverty; 2. Zero Hunger; 3. Good Health and Well-being; 4. Quality Education; 5. Gender Equality; 6. Clean Water and Sanitation; 7. Affordable and Clean Energy; 8. Decent Work and Economic Growth; 9. Industry, Innovation, and Infrastructure; 10. Reduced Inequality; 11. Sustainable Cities and Communities; 12. Responsible Consumption and Production; 13. Climate Action; 14. Life below Water; 15. Life on Land; 16. Peace and Justice Strong Institutions; 17. Partnerships to achieve the Goal). Within the IGC proposal, they should be taken as goals for 2050, so that they also achieve the goals for global change according to the United Nations Paris Agreement on Climate.
Despite being a qualitative evaluation, suitable for future studies on how to improve measurements, it was interesting to analyze the positive evolution in metrics regarding non-adopter, late-adopter, and early-adopter, in all groups. Although the issue of incremental innovations, in view of early adopters, was eventually challenging for the groups, it is important to note that there was, indeed, an increase in the conditions for fulfilling the goals of sustainable development, even if just by improving the proposals over time and by increasing the time dedicated to help participants understand the meaning of the workshop.
As a way of analyzing the fulfillment to the SDG, each idea proposed in the plans is associated with at least one of the 17 objectives. With this indexing, it is possible to compute how many and which of the objectives were met in each theme (water, vegetation, transportation, housing, among others). For each constructed scenario (Non-Adopter, Late-Adopter, and Early-Adopter), the sum of the achieved score is obtained, which is recorded on the “y” axis of the graph in
Figure 12. On the “x” axis of the same graph, the evolution of the scenarios is indicated (
Figure 12).
4. Closing Remarks
In a general evaluation of the 13 workshops, we initially point out the willingness of the groups, scattered throughout the country, including every region, to participate in the project. More groups would have participated if it were not limited to Metropolitan Regions, as not all universities are able to develop studies of this nature, because they are not located in this type of administrative unit. Additional time would also favor a more encompassing participation. The project started in early February, and all the workshops had already been concluded by late April. The group that was responsible for organizing the data and setting up the platform required one week to build each project, so as our deadline was due and a significant number of experiments have been achieved, we are currently no longer conducting new workshops.
According to reports from participants and coordinators, the process was considered easy to understand and execute. Some coordinators expressed that the quality of the final projects could be improved and that they were concerned due to the fact that not all 10 systems received ideas, but that the outcome of the workshop is not necessarily a plan but rather a greater understanding of the process, based on Transformative Learning, which was quite clear in our evaluation. Although most of the participants were students, they are also part of the communities and belong to specific social groups. In that sense, we believe it was a test to the learning process regarding the area and its potential uses and vulnerabilities, as well to observe the improvement in the capacity to participate and provide opinions, which are the most significant and desirable achievements of the experiment.
The process based on the GISColab platform is based on the usage of information layers in WebGIS format, which are freely available on spatial data infrastructures (SDIs). Several coordinators and participants noted the lack of updates and further detailing of available information, which is a limitation on the quality of the data that is currently available for planning purposes. Those with expert knowledge in the field of geoprocessing can provide major improvements on the quality of the information by producing their own data, and it is worth noting that some (a third of the total group) decided to take the initiative and added their own layers. However, the need for Brazil to advance its data infrastructure should be registered here, in municipal, state, and national levels, so that planners can dedicate themselves to the proposal stage, instead of focusing solely on the analysis and diagnosis stages.
GISColab, the Brazilian Geodesign platform, was widely approved by participants, who considered it easy to use. It is important to point out that several participants adapted the platform for tasks that were not previously requested, using it to include layers, and optimize and personalize processes according to their own terms. The GISColab platform adheres to the norms defined by the OGC (Open Geospatial Consortium), thus using standardized patterns for geospatial data and geographic information, which allows for a broad range of applications and for its insertion into global projects. The platform can run on the formats such as WMS (Web Map Service), WFS (Web Feature Service), and WPS (Web Processing Service), and, in terms of heavier layers, it can resort to WMTS (Web Map Tile Service) resources. It allows wide interoperability in data consumption and production.
Among the most promising tools for supporting the workshop conduction, dynamic layers and widget alerts seem particularly relevant. They are both possible thanks to WPS (Web Processing Service) access, as it automatically processes data as participants work on their proposals. The dynamic layer is updated in real time for the work contexts, gathering annotations into a single geovisualization element. The widgets display metrics that are dynamically calculated based on the idea designs created by participants. Although dashboards were available, they were not used during the workshops. However, they could have been used to present a new form of visualizing information regarding the proposed ideas, by using charts and analyses of particular interest.
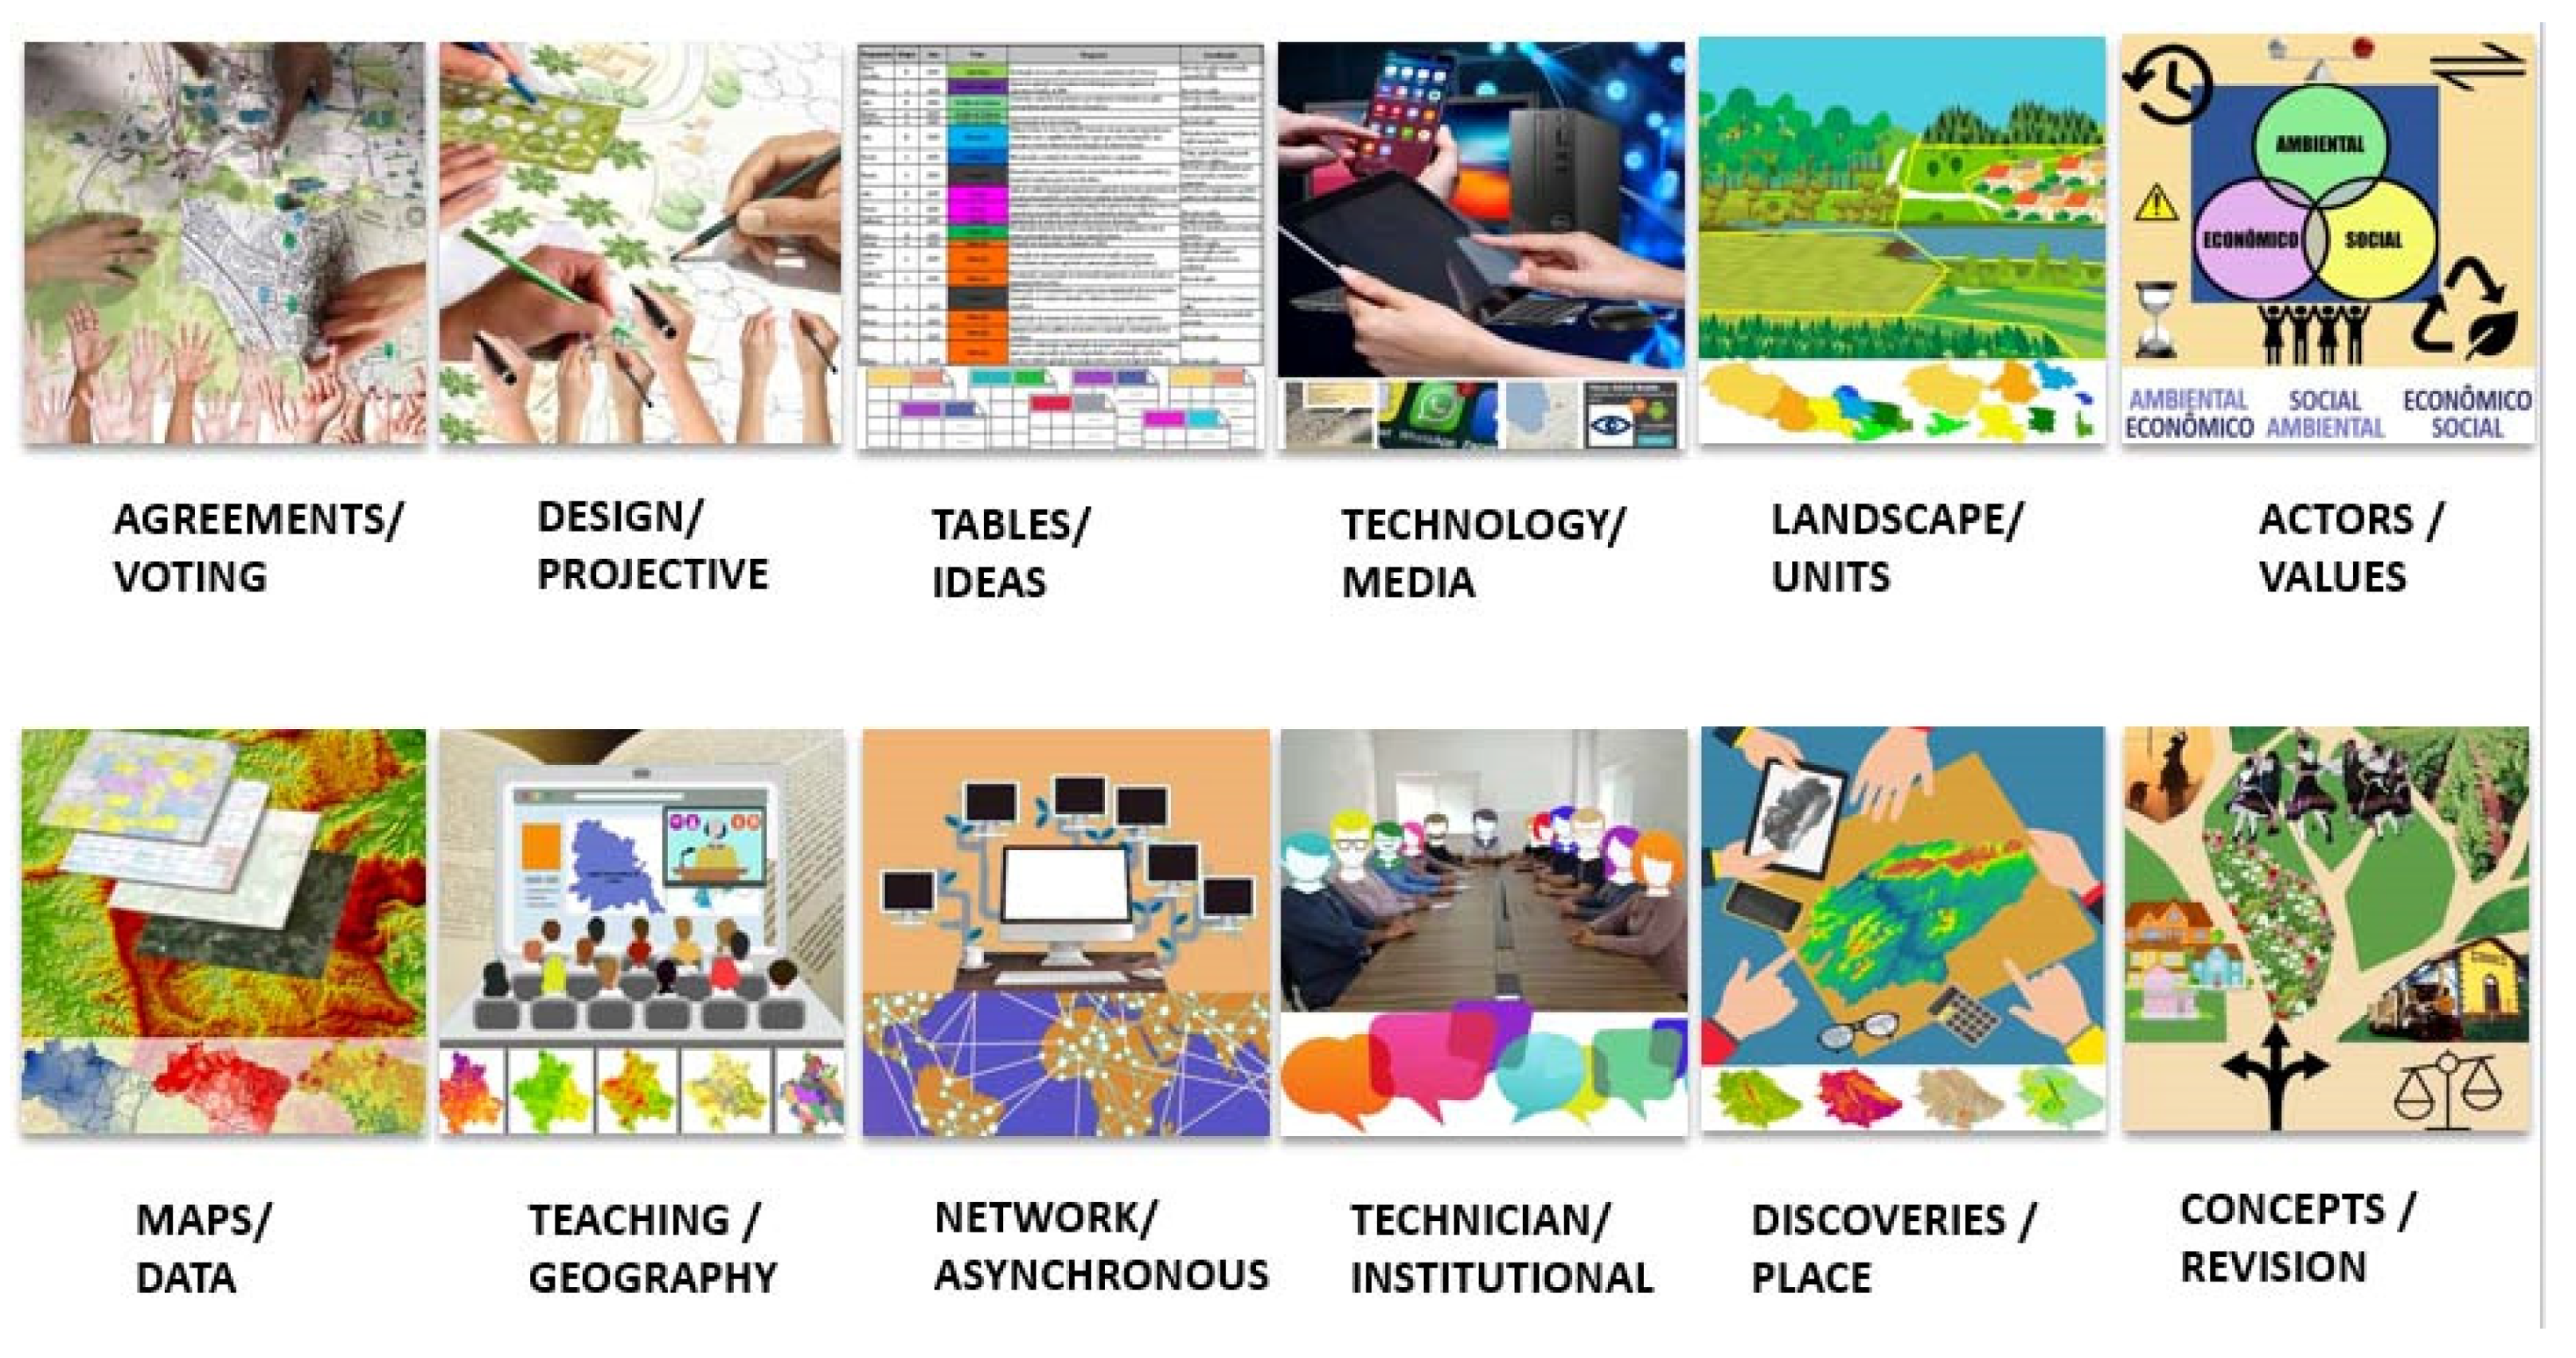
Although a single script was planned for all groups, with a conceptual base and justifications on how to conduct the required tasks on the platform, for each of the days in the workshop, each group adapted the method to their local reality, proving the scalability of the process and the necessary flexibility for employment in different realities: (1) negotiation and voting; (2) projective design; (3) tables and ideas; (4) technology and media; (5) landscape and units; (6) actors and values; (7) maps and data; (8) teaching and geography; (9) networks and asynchronicity; (10) technical and institutional; (11) discoveries and the location; (12) revision concepts (
Figure 13).
The Belo Horizonte MR group stood out due to their actions toward negotiation and voting, which permeated the entire processes, in every stage, thus broadening the use of the Dialogs and Voting tools. The São Paulo MR group, formed mostly by architects and contributions by biologists, employed the form of work used by the architects, based on projective drawings, even if guided by a collective discussion. The Florianopolis MR group was comprised of participants from the field of social sciences, with strong interest in Law, History, and Sociology, and only a small part of them came from spatial and territorial sciences. Therefore, they opted for working with more abstract ideas and the creation of tables to achieve a decision on their ideas, in such a way that the spatial location was not the starting point for the process.
The Rio de Janeiro MR group acted in a quite tech-forward manner, using social media applications, and building a VGI (Volunteered Geographic Information) on ViconSaga (a web-based platform developed by the coordinator of the case study). As it works as a VGI, they brainstormed ideas regarding the case study and uploaded those data into GISColab. The Fortaleza MR group divided the area into landscape units and attributed each participant with the responsibility of conceiving and proposing ideas for that given space. The Campinas MR focused on detailing the role of social actors, dividing participants according to environmental, social, and economic axes (which form the sustainability tripod), and attributing each group with the responsibility for a given set of systems.
The Belém MR group was mostly comprised of teachers and students from within the field of geoprocessing, which resulted in a greater interest in the data, in the creation of models for spatial analysis, and in a longer period dedicated to the reading enrichment stage. The Goiânia MR group used the experiment and the platform as a tool for teaching Geography, detailing their study of the relationships between geographic variables, and conducting, in their post-workshop stage, a specific application in a new case study as part of their undergrad program. The Recife MR group proposed to deal with time in an asynchronous fashion, exploring the potential uses of the internet to evaluate the possibility of applying the method in broader public inquiries, where synchronous actions were to be avoided. Therefore, their challenge was to plan for ways to keep participants connected and committed.
The Macapá MR group was mostly formed by professionals from the public sector, which were part of the Amapá State Office. They managed to fulfill the goal of testing the possibilities for implementing such a method in their professional routines, and it was clear that the way they approached the proposition, analysis, and approval of ideas was strongly associated with the kind of work they do as part of the state’s public service network. The Palmas MR group faced the challenge of conducting a study in a capital city that was recently planned and built (its foundation was in 1989), which is also a metropolitan region with no metropolitan nature. In other words, with cities that do not form conurbations and have little contact with each other, the initial focus was clearly on defining the characteristics of the area, expanding their knowledge of their object of study, and then creating proposals that were suited for that reality. Lastly, the Carbonífera MR group, located in the far-south of Santa Catarina state, experienced the need to question and review key concepts, as the topic “innovations,” represented by the idea of “early-adopter,” was a major challenge. The reason is that the area has a strong attachment to traditions brought by their immigrant ancestors, who take pride in maintaining their local way of life. Hence, they do not view the “non-adopter” concept as something negative or that needs to be overcome, but rather as a local characteristic. Through their concept review, innovations and adopters were then re-constructed as those who have a strategic knowledge of how to use their local culture and values to promote positive change.
Considering what was hereby presented, it is important to note how even though there was a single script, each workshop adapted itself to fit within its local values. This is crucial for a country with continental size, a highly diverse culture, and such different expectations between groups. The way in which the tool and the work proposal were used by each group was not something previously planned but came into being as a spontaneous demand from participants. However, it was only possible because the work proposal and the Brazilian Geodesign Platform, GISColab, made it possible.
The first Brazilian platform for the Geodesign method, GISColab, was structured after several experiments in which the coordinators measured the interoperability between users and the tools, the time spent on each step, and, mainly, the maintaining engagement and interest during tasks. For now, it can be said that it was a cultural adaptation to traditional Geodesign processes, because the platform has not yet been tested in other countries.
It is believed that the use of the Brazilian framework and the way of working for Geodesign are fully compatible for similar studies in other countries, for the following reasons: (a) the platform is web-based and can be accessed virtually from anywhere in the world, because it is deposited in a robust geographic data server; (b) the platform and its applications follow the international standards of geospatial data, the OGC (Open Geospatial Consortium) and, for this reason, it is fully compatible for consumption and interoperability in other countries; (c) the platform is prepared, in its configurations, for changing languages; (d) the technological resources used today are discussed and accepted worldwide, such as integration to SDI (Spatial Data Infrastructure) for data consumption by WMS (Web Map Service) or WFS (Web Feature Service), navigation on maps by the WebGIS standard, and registration of information by the VGI standard (Volunteered Geographic Information).
Finally, it should be noted that the platform and the work framework were tested in 13 quite different realities, as Brazil has continental dimensions and great geographical, climatic, cultural, social, and economic variability. In this sense, by testing in Brazil, one is testing in diversity and preparing to expand to different countries.


