Abstract
This paper explores the relationship between defence expenditure and government debt in small European Union countries that are members of NATO, such as Luxembourg, Lithuania, Latvia, Estonia, DRenmark, Slovakia, and Slovenia. The investigation used Eurostat data in relation to gross government debt, as well as NATO information regarding defence expenditure as a share of GDP and its distribution by main category for the period between 2005 and 2019. The authors applied descriptive statistics and methods of multivariate statistics: Spearman’s correlation, the ANOVA test, and Life tables. Taking into consideration the tendencies of variables in all examined countries, the results show that the share of defence expenditure in GDP correlates statistically significantly and negatively with government gross debt. Latvia, Slovakia, and Slovenia revealed statistically significant relationships between variables, while Luxembourg, Denmark and Lithuania insignificant. In Estonia, the relationship between variables is strong and positive. Additionally, the investigation shows that, whether for increasing defence expenditure or for stable or decreasing defence expenditure, the trajectories of government debt have no clear interrelation in explored countries. Therefore, the cause of government debt by means of defence expenditure alone can only be partially explained. The insights that were drawn from this study could be applied to government finance management processes, as well as to ensure both national security and the achievement of the Sustainable Development Goals 2030.
1. Introduction
Government debt and security are the components of the Sustainable Development Goals (SDGs). Therefore, maintaining a balance between defence financing and government debt is becoming an important tool in terms of economic development and achieving the SDGs. Government finance management is a complex and multi-factorial process, which is implemented through budgeting and execution. It is also a tool for planning, organising, and implementing those objectives, which are being pursued. Bivainis and Butkevicius [1] argue that the budget is one of the most important public financial documents to allocate public financial resources according to functional, economic, programmatic, and other classifications. More than any other form of budget allocation in a particular country, the defence budget has to be considered not only by politicians, taxpayers, the military and security concerns, but also by friendly and unfriendly neighbouring countries and international organisations. Therefore, each country’s budgeting and implementation process consists of a set of actions which includes an analysis of the country’s geopolitical situation, a targeted analysis of economic indicators and forecasts, cooperation among institutions of interest, an audit of the use of funds, and targeted control of other institutions. Security funding, as part of the budget, is also a sensitive part of the system, which is the subject of much debate amongst both politicians and the public. It is important to emphasise that security—both external and internal, including defence—is a public good, which is absolutely necessary for existence and freedom, as well as for the positive development of the economy, culture, and prosperity of the country. Frorach [2] states that the public must pay for security and defence. This idea and the interdependence of some factors are supported by other scholars [3,4,5], who argue that investing in the security sector is driven by the geopolitical situation, threats, and a desire to feel secure.
In the last two decades, there has been a growing number of scientific studies [6,7,8,9,10,11,12,13,14,15,16,17,18,19,20,21,22,23,24,25,26,27,28,29,30,31,32], which have been investigating the economic effects of defence budgets using a variety of estimation methods. They focus either on individual countries or on groups of countries. The additional question of whether defence is capable of reducing government debt is currently a controversial issue. The effects of defence on government debt can be a particularly important problem for small countries with relatively limited budgets and a relatively low level of real GDP per capita. This is particularly relevant in the situation, which has been brought about by the onset of the COVID-19 pandemic. The entire world is going through a health crisis, with economic growth in many countries either declining or turning negative, and countries tend to maintain or increase defence funding due to external security and threats. The economic success of countries largely depends upon the role of governments in allocating and redistributing budgets [33]. According to Ben-Gad et al. [34], in environments that provide unreliable information about threats to national security, policymakers very often focus on higher-than-would-be-appropriate defence expenditure. Moreover, we would expect policymakers to favour spending on weapons and associated defence strategies, where such strategies and spending would be most effective in preventing the occurrence of worst-case scenarios. According to the Keynesian theory, an increase in government expenditure stimulates aggregate demand and rapid economic development, while the Wagnerian theory has stated that national revenue growth is driving higher government spending [33,35]. At low levels of indebtedness, an increase in government debt as a percentage of GDP could promote economic growth. However, at high levels of indebtedness, an increase in this proportion could hurt economic development [36]. Therefore, defence spending can make an impact on the burden of government debt, which in turn could stimulate or hurt economic performance. Taking into consideration the fact that economic growth, government debt, and security are components of the SDGs, the act of maintaining a balance between defence financing, government debt, and growth is becoming an important tool in terms of achieving the 2030 sustainable development goals.
Given the inconsistencies which have emerged from empirical studies, it is notable that very little attention has been paid to EU or NATO countries in respect of the defence–government debt nexus. The authors believe that this investigation will at least partially fill this gap. Therefore, this research focuses on an analysis of the relationship between variables in small EU and NATO countries, such as Luxembourg, Lithuania, Latvia, Estonia, Denmark, Slovenia, and Slovakia. This investigation involves the following research questions: does defence have an impact upon government debt? What are the peculiarities in terms of the defence expenditure–government debt nexus in the small EU and NATO countries (in terms of their population figures)? The selected countries differ in their levels of economic development. According to real GDP per capita, which reflects the level of economic development, the countries under consideration could be divided into two groups. During the period 2005–2019, Luxembourg and Denmark stand out with a high GDP per capita indicator, which averaged about eighty thousand euros and forty-six thousand euros a year respectively. The remaining countries—Lithuania, Latvia, Estonia, Slovakia, and Slovenia—belong to the same group, where GDP per capita ranges from ten thousand euros to eighteen thousand euros a year [37]. During the period analysed, defence expenditure increased in all of the countries concerned. In 2019, when compared to 2005, the lowest increases in defence spending were in Slovenia (about 28%) and Denmark (about 19%). Meanwhile, it tripled in Luxembourg, Lithuania, Latvia, Estonia, and Slovakia [38]. In 2019, when compared to 2005, government gross debt as a percentage of GDP also increased in all of these countries except Denmark [37].
This article consists of the following sections: the introduction, a literature review, a methodological approach, research results, a discussion, and conclusions. The authors note that, in the following text, the terms “military” and “defence” are used as synonyms to reveal the same phenomenon.
2. Literature Review
In analysing the planning and distribution of defence spending, scholars focus most on government policy decisions where these are related to the country’s overall economic and social well-being. Potrafke [39] argues that the dynamics of defence spending depend mostly upon economic and political factors in various countries. This is supported by Solomon and Stone [40], who argue that budget decisions are inherently based upon political choice. On another hand, Potrafke [41] does not emphasise the ideologies of any political parties, arguing that government ideology hardly influenced budgetary affairs in the last decades and, therefore, if ideology plays a role at all, it serves to influence only non-budgetary affairs. What has been more greatly emphasised is the fact that in order to ensure the efficiency of the security resource management process, the military budget process appears to be systematic, rational, and open to public scrutiny and debate. Each country has to find ways in which it can provide transparent, reliable, flexible, and efficient financial management processes. However, the current pandemic situation and its consequences are likely to pose new challenges for public finance management and decision-making. In this case, budgeting principles such as comprehensiveness, discipline, legitimacy, flexibility, predictability, contestability, honesty, information, transparency, and accountability [42] will play a particularly important role in creating well-being, not only for the state but also for society.
The process of estimating the effects of defence on government debt continues to be an important field of study. The researchers investigated many possible channels by which defence can influence the economy. However, one channel which has had little attention has been the impact of defence on government debt [43]. The relationship between defence expenditure and government debt is an important and controversial issue. Brzoska [44] first noted the significance of defence spending in terms of debt accumulation. In 1979, armament expenditure formed between twenty to thirty percent of the debt burden in developing countries [5,44]. According to Karagol [8], defence expenditure affects a country’s external debt in several ways. Firstly, defence expenditure can indirectly effect a country’s external debt. Military spending may be pressing on budget revenues, with the result that a government may borrow from external or internal sources. Secondly, defence spending can have a direct effect on a country’s external debt if a country is an arms importer and the total import payment is financed by external resources. Looney and Frederiksen [45] studied whether high external borrowing will have a negative impact on the country’s overall growth for the period between 1970 and 1982. The researchers found that the relationship between external debt and defence expenditure is negative in relatively resource-constrained countries and positive in relatively resource-unconstrained countries.
Country growth and economic sustenance has depended upon external funding. In particular, external funding has been crucial in less developed countries, in terms of financing capital and investment projects, and in short-term borrowing for budgetary support [13]. Ahmed [13] explored the relationship between military expenditure, external debt, and economic performance in the economies of sub-Saharan Africa using a sample of twenty-five countries over the period between 1988 and 2007. The investigation has revealed that military expenditure has a positive and significant impact upon external debt in African countries. Moreover, real GDP has affected the total debt of African countries by causing a negative relationship. The results suggested that a one percent rise in national output leads to a decline in external debt by 1.52 percent. It has been recommended that African countries strengthen their fiscal responsibility and encourage rational spending, particularly by reducing military expenditure. The paper by Zaman et al. [46] examined the impact of military expenditure and economic growth on external debt for five selected countries, including Bangladesh, India, Nepal, Pakistan, and Sri Lanka between 1988 and 2008. The research found that external debt is rather elastic with respect to military spending in the long run, and inelastic in the short run. Karagol [8] investigated the causal relationship between defence expenditure and external debt in Turkey over the period between 1955 and 2000. The results indicated both a long-run and short-run unidirectional causality which ran from defence expenditure to external debt. Further research by Karagol [47] for Turkey during the period 1960–2002 confirmed that defence expenditure has a positive effect on external debt stock. Later, Karagol and Turhan [10] examined the relationship between external debt, defence expenditure, and political business cycles in Turkey from 1960 to 2002. The findings suggested that defence expenditure is influenced by political ideology and the fiscal policy of the government. Kollias et al. [6] empirically estimated the impact of defence expenditure on the fiscal situation of Greece during the period between 1960 and 2001. The authors focused on the effects of military spending on government debt and its components, such as internal and external debt. The empirical findings reported that governmental external debt has been adversely influenced by military expenditure, but also by the domestic political cycle. The paper by Shahbaz et al. [18] investigated the effect of military spending on external debt in Pakistan for the period between 1973 and 2009. According to the author, the interrelationship between defence expenditure and external debt is a crucial issue for developing countries like Pakistan. The findings in the research indicated the existence of a long-run relationship between military expenditure, external debt, economic growth, and investment. Moreover, the results revealed that a rise in military expenditure also serves to increase external debt. Additionally, an increase in investment increases external debt. However, there is an inverse impact of economic growth on external debt. The investigation of Sánchez-Juárez and García-Almada [48] has revealed that public debt is positively correlated with public investment and that this generates economic growth. Kamran and Ahmed [49] evaluated the impact of military spending on external debt in highly indebted and low-income developing countries, such as India, Pakistan, Brazil, and the Philippines for the period between 1988 and 2010. The study has discovered that the impact of defence has been significant in poor economic conditions. In opposition, and under beneficial economic circumstances such as increasing economic growth, increasing tax revenues, and improving export and foreign reserves, the military has not caused any significant impact on external debt. Azam and Feng [23] explored the effect of military spending on external debt, using a sample of ten Asian countries over the period between 1990 and 2011. The empirical results suggested that the effect of military expenditure on external debt is positive, while the effects of economic growth and foreign exchange reserves on external debt are negative. The authors concluded that, for developing countries, military expenditure often requires an increase in external debt, which may negatively impact economic development. The research by Niazi [24] considered the relationship between defence expenditure, external debt, economic growth, foreign aid, and development in Pakistan between 1960 and 2016. The study has revealed that GDP is positively affected by defence expenditure and external debt. Additionally, a strong but negative relationship was detected between external debt, defence spending, and GDP. Two other variables, such as foreign aid and development, do not have a relationship with defence expenditure, external debt, or GDP. The study by Abbas and Wizarat [29] investigated the effects of military spending on external debt in five South Asian economies, such as Pakistan, Bangladesh, India, Nepal, and Sri Lanka, during the period between 1990 and 2015. The results indicated that the external debt of those selected South Asian countries is positively determined by their military spending, and negatively explained by their domestic investment activities. Khan et al. [50] tested the effects of military spending on the external debt of thirty-five arms-importing countries between 1995 and 2016. The empirical results suggested that military spending generally increases external debt in the studied countries. Moreover, it was also found that military spending decreases external debt in Europe and Central Asia. Finally, the researchers concluded that military expenditure often increases the external debt burden in countries in which the debt management system is weak. Conversely, some researchers [51,52,53] revealed that defence spending has no impact on debt. The paper by Dunne et al. [51] considered the experiences of Argentina, Brazil, and Chile. The authors found no evidence that the military burden had any impact on the evolution of debt in Argentina and Brazil, but there was some evidence that the military burden had tended to increase debt in Chile. Sezgin [52] empirically examined the relationships between Turkey’s defence expenditure and external debt for the period between 1979 and 2000. The findings showed no clear evidence of a defence/debt nexus for the period that was analysed. Additionally, Feridun [53] did not detect any causal relationship between external debt and military expenditure in the case of Argentina. Moreover, it is notable that defence spending also affects economic growth by acting on government debt. This is evidenced by recent research. The study of thirty-one developing countries over a period of thirty-six years has shown that the accumulation of external debt is associated with a slowdown in the economies of the countries [54]. Later, the cases of emerging economies also revealed a negative and significant influence by government debt on economic growth [55,56]. The investigation recommends a more productive use of the external debt fund in order to affect positive growth [56]. One other study in Africa demonstrates that, beyond a specific capacity, external debt would start to have a deteriorating impact upon economic development. The researchers recommend that the proper application of government debt be ensured in terms of economic activities which could lead to sustained long-term economic performance [57].
To sum up, empirical evidence from studies that have been conducted in various countries all around the world has suggested that, in many cases, defence expenditure affects government debt and economic development. The effect is particularly pronounced in economically weaker countries, where increasing defence funding tends to increase the debt burden as well as usually impeding further economic development.
3. Research Methodology
Criteria for the selection of countries. Although the term of small states is often used, there are disagreements over the definition. According to Rickli [58], the definition of small states could be based on the approaches of four scholars’ generations. The first generation focused on the geographic or demographic size of the country or GDP. The second one adopted the definition, which related to the role and the influence of small states in the system, whereas the third generation proposed a psychological definition, which maintained that smallness was a matter of self-perception. The fourth generation considers smallness through its relation with power [58]. Taking into consideration the lack of agreement over the definition of small states, the authors used three criteria for the selection of countries as follows: (1) the country is a member of the EU and joined no later than 2004; (2) demographic size (population size); (3) the country is a member of NATO and joined no later than 2004. Finally, from half of the European Union member states, the authors selected seven countries that met the above criteria. These countries are as follows: Luxembourg (LU), Denmark (DK), Estonia (EE), Latvia (LV), Lithuania (LT), Slovakia (SK), and Slovenia (SL). By 1 January 2020, Luxembourg had a total population of 0.6 million inhabitants, Denmark had a population of 5.8 million, Estonia 1.3 million, Latvia 1.9 million, Lithuania 2.8 million, Slovakia 5.5 million, and Slovenia 2.1 million [59]. As can be seen, all of the selected countries are small in terms of their population figures. The population size ranges from 0.6 million to 5.8 million inhabitants.
Hypotheses. Based on findings in previous research on the impact of defence expenditure on government gross debt, the following hypotheses were formulated:
Hypotheses 1 (H1).
a strong and positive statistically significant correlation relationship exists between defence expenditure and government debt;
Hypotheses 2 (H2).
unidirectional causality between defence expenditure and government debt exists: any increase in defence expenditure serves to increase government debt.
Variables and research methods. For the purposes of analysis, secondary data on government gross debt and defence expenditure within the time period of 2005–2019 were collected. Information held by Eurostat [37] and NATO [38] was used for the purposes of standardisation and acceptability. The following variables are used in the analysis:
- government consolidated gross debt as expressed as a percentage of GDP (further in the text this is also referred to as “Government debt” or “financial debt”, or simply as “debt”).
- the categories of defence expenditure are as follows:
- -
- defence expenditure as a share of GDP (%),
- -
- personnel expenditure as a percentage of total defence expenditure,
- -
- equipment expenditure as a percentage of total defence expenditure,
- -
- infrastructure expenditure as a percentage of total defence expenditure,
- -
- other expenditure as a percentage of total defence expenditure.
All of these areas are presented as scale variables. In the analysis of data, the authors applied the following research methods:
- descriptive statistics;
- ANOVA test;
- the Spearman’s correlation analysis;
- Life tables are part of a group of probabilistic–statistical Even History Analysis methods.
Analysis began from the point of descriptive statistics. Firstly, the mean values of defence expenditure and government debt for the period 2005–2019 were explored, together with the standard deviation, plus the minimum and maximum. Furthermore, a comparison was conducted between defence expenditure and government debt trajectories. For this reason, the ANOVA test was applied. This test compares the mean values of two or more measures. As a higher value of the Fisher (F) coefficient, as difference between the compared measures is higher [60].
For a test of the hypotheses, methods of mathematical statistics were applied which include multivariate statistical analysis such as correlation analysis, and life tables. For a more detailed look at the direction of associations between explored curves, correlation analysis was used. This method measures the strength and direction of association between interval-ratio variables. The results of the correlation analysis (r) range from zero to ±1 [60,61]. The absolute values of r indicate the strength of the linear association between the two variables: r is closer to ±1 where a stronger relationship exists, and r is closer to zero where a weaker relationship exists. Meanwhile, the signs “+” or “−“show the direction of this relationship: a figure of +1 means that the two variables have a perfect positive association, while −1 means that the two variables have a perfect negative association, and zero indicates no association between the two variables. In our research, correlation analysis was conducted between the variable in terms of government debt, and the variables in terms of defence expenditure. In total, one hundred and five cases were analysed, i.e., seven countries multiplied by fifteen years of analysis. In calculations involving correlations for the separate countries, only fifteen cases were analysed for each country. Due to the small number of cases, Spearman’s correlation method was applied [62]. The latter is a special case of a more general correlation coefficient, serving to assess continuous relationships between two variables even if their relationship is not linear, and therefore is appropriate for the analysis of small sample sizes with many tied ranks.
Furthermore, while searching for an answer in regards to the question about the direction of causality related to H2 hypothesis, the method of life tables which are part of a group of probabilistic–statistical Even History Analysis methods was applied [63,64]. The life tables are based on the idea that some life events intersect over time. It expresses survival at certain levels of status for a particular time period for one event, until a change of status appears for another interrelated event. The application of the method is not usual in the analysis of financial or military issues though, but the authors of this paper consider the method to be suitable when it comes to realising the aim of the research because, in terms of social process, it effectively discloses causal relationships over the period under consideration. In our research, the method led to us being able to detect how the status of individual government financial debts could change when changes also appeared in defence expenditure. This method adds a time dimension into the analysis, and provides an opportunity to explore how government debt is impacted by defence expenditure in the period analysed, and therefore makes it possible to test the H2 hypothesis. First of all, a form of life tables was calculated using the survival tables method. For the calculations, the initial variable of government consolidated gross debt was transformed into a variable with an ordinal scale in which a figure of zero equalled debt increase over one year, and a figure of one equalled debt being stable or decreasing over one year. Similarly, the variable for defence expenditure as a share of GDP was transformed into a variable with an ordinal scale in which zero equalled a defence expenditure increase over one year, and one equalled defence expenditure being stable or decreasing over one year. The recording was conducted for each measure for the period of time between 2005 and 2019. For characterisation of the survival trajectories and an identification of the differences between them, use was made of Median survival time, as well as Breslow (Generalised Wilcoxon), and Log Rank (Mantel–Cox) indexes [63,64]. Median survival time expresses a level of mean waiting time from a certain time point until an event appears. Meanwhile, both indexes compare the differences between the trajectories. The greater the value, the greater the difference between compared survival trajectories. The Breslow (Generalised Wilcoxon) index reflects better the difference between compared survival trajectories at the beginning of the waiting period. The Log Rank (Mantel–Cox) index expresses better the difference between survival functions in the second part of the waiting period of time. A combination of two cases for each defence expenditure (in terms of increase and being stable or decreasing) and government debt (increase and being stable or decreasing), provided a total of four curves in the section “Research Results”.
For the purpose of carrying out the data calculations, the IBM SPSS version 20 package was used.
4. Research Results and Discussion
4.1. Research Results
Descriptive statistics. Descriptive statistics revealed that the mean government consolidated gross debt in all explored countries is 32% of GDP with a standard deviation of 18.2 (Table 1). In Denmark, Latvia, Slovakia, and Slovenia, this measure exceeds the total mean figure, while in Estonia it is lower than the total mean figure, and in Lithuania, it is equal to the total mean. The highest mean debt figure is for Slovakia, and the lowest is for Estonia.

Table 1.
Descriptive statistics on variables used in the analysis, 2005–2019.
The total mean figure for defence expenditure as a share of GDP is equal to 1.2%, with a standard deviation of 0.5. Only in Luxembourg is this measure lower than the total mean, meanwhile, in Lithuania, it is equal to the total mean, and for the rest of the countries, this expenditure exceeds the total mean.
Among the constitutive parts of defence expenditure, the highest mean is for personnel. This is true as for total data, as for separate countries. The only exception is Estonia, where the highest levels of expenditure are for the area of “other defence expenditure”. The lowest mean figure for defence expenditure is for infrastructure, and this is true for total data and separate countries.
The dynamics behind the means of government debt and defence expenditure show that these measures vary year by year and, at first sight, these variations do not necessarily travel in the same direction (Figure 1). For the majority of the selected countries as well, in total, government debt increased between 2011 and 2015 to 2017. In the period before 2011, there were great variations. After the 2015–2017 period, the trend is to slightly decrease. In the same period, variations in defence expenditure differ in the various countries.
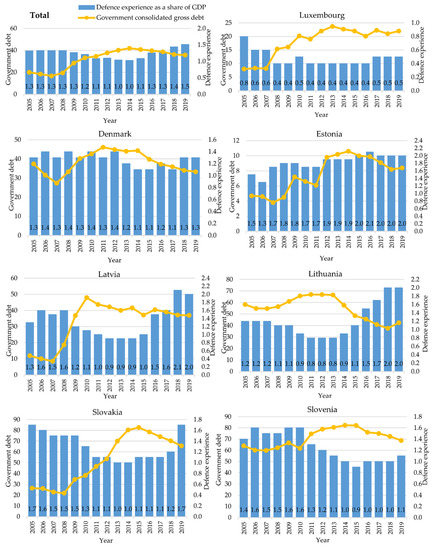
Figure 1.
A comparison of defence expenditure as a share of GDP and government gross debt in selected NATO countries. Source: authors’ elaboration, based on Eurostat [37] and NATO [38].
For example, in Lithuania and Slovenia, prior to 2007 the defence expenditure was much higher than it was in the rest of the countries in the same period of time. In the period of around 2010–2015, defence expenditure as a share of GDP increased in most countries. After this period, defence expenditure started to decrease but did so differently in the selected countries.
Looking at the variations described above, the question arises in regard to how big is the difference between the curves for defence expenditure and those for government debt. In order to answer this question, the ANOVA test was applied. In this research, for the total data, it was found that F = 5.117 (p < 0.001) reveals the existence of a statistically–significant difference between the mean figures for defence expenditure and government debt. Although, for the separate countries, the measure does not necessary show any statistically-significant difference. For example, in Denmark and Latvia the indexes (of F = 0.377 and F = 1.153 respectively) are not statistically significant and, therefore, nothing can be said about general similarities or differences between mean figures and curves in terms of defence expenditure and government debt. However, in Luxembourg, Estonia, Lithuania, Slovakia, and Slovenia these coefficients are statistically significant (standing at F = 19.752, p < 0.001; F = 8.881, p < 0.01; F = 3.455, p < 0.05; F = 3.721, p < 0.05; and F = 15.930, p < 0.001 respectively). They also reveal general differences in variations for the mean figures and curves for defence expenditure and government debt. Even more than that, the F index ended up showing that the biggest difference between these two measures tends to exist in Luxembourg and Slovenia, while the lowest difference was in Lithuania.
Testing the H1 hypothesis. An important question in our research concerns the direction of associations between the curves being explored. For this reason, a correlation analysis was applied. The variables in terms of defence expenditure, its constitutive parts, and government consolidated gross debt were all included in the correlation analysis. According to the results which were generated by the total data, the share of defence expenditure in GDP correlates to a statistically significant degree with government consolidated gross debt. Table 2 below shows the results of the Spearman correlation and it is statistical significance p (in parentheses). For total data, the relationship is not strong, and it is also a negative one (r = −0.255, p < 0.001). This means that the bigger the share in terms of defence expenditure in GDP, the smaller tends to be the level of government debt, and in the opposite direction this also applies, with the smaller being the share of defence expenditure, greater being the figure of government debt. The same trend, but much stronger, was obtained in Latvia (r = −0.555, p < 0.032), Slovakia (r = −0.7000, p < 0.004), and Slovenia (r = −0.783, p < 0.001). Such results contradict the presumption which was made in hypothesis H1, but confirm the results that were found in Pakistan between 1960 and 2016 [24]. In Estonia, the correlation relationship is strong and also positive (r = 0.718, p < 0.003). This relationship takes a direction which is different from the one described above, and instead refers to following trend: a bigger share in terms of defence expenditure in GDP means a bigger level of government debt, and a smaller share of defence expenditure means a smaller level of government debt. For Luxembourg, Denmark, and Lithuania correlation between defence expenditure, and government consolidated gross debt is not clear because statistically insignificant score. In summary, only for Estonia, the hypothesis H1 is confirmed.
Table 2.
Correlation relationships between government gross debt and defence expenditure.
For a greater depth of knowledge, correlations were conducted between government debt and the constitutive parts of any defence expenditure (Table 2). For the purposes of providing an entirety of complete data, a correlation relationship was found between debt and personnel expenditure, thereby confirming hypothesis H1 (r = 0.554, p < 0.001). This relationship is statistically significant, strong, and positive. For the other areas of defence expenditure, statistically significant correlation relationships were also identified, although the latter are negative and not always strong. For example, in the case of expenditure for equipment (r = −0.307, p < 0.001), infrastructure (r = −0.634, p < 0.001), and other expenditure (r = −0.295, p < 0.01), the relationship is negative, even not necessary strong.
For selected countries, variations were obtained in correlation relationships between government debt and the constitutive parts of defence expenditure. In Luxembourg, debt correlates negatively and strongly with expenditure for personnel (r = −0.673, p < 0.01), but positively and strongly—with infrastructure (r = 0.828, p < 0.001). In Denmark, debt correlates negatively and strongly with expenditure for equipment (r = −0.781, p < 0.001), and infrastructure (r = −0.744, p < 0.001), but positively and strongly—with other expenditure (r = 0.588, p < 0.05). In Estonia, debt correlates negatively and strongly with expenditure for infrastructure (r = −0.739, p < 0.001), but positively and strongly in terms of personnel expenditure (r = 0.829, p < 0.001). In Latvia, debt correlates negatively and rather strongly with expenditure for infrastructure (r = −0.546, p < 0.05). In Slovakia, debt correlates negatively and rather strongly with other expenditure (r = −0.619, p < 0.05). In Slovakia, debt correlates negatively and rather strongly with expenditure for equipment (r = −0.843, p < 0.000), for infrastructure (r = −0.654, p < 0.01), and other expenditure (r = −0.757, p < 0.000), but positively and very strongly with personnel expenditure (r = 0.925, p < 0.001). Finally, in Lithuania, statistically significant correlation relationships were not obtained in terms of government debt and the constitutive parts of military expenditure.
In summary, the correlation relationship varied from country to country when it came to looking at government gross debt and the share of defence expenditure in GDP, as well as in terms of the constitutive parts of defence expenditure. In most statistically significant cases, the relationship is strong but negative. Statistically significant positive correlations were obtained in the relationship between expenditure for personnel and other expenditure, which mainly includes operations and maintenance expenditure, and other R&D expenditure. Therefore, hypothesis H1 is confirmed only partially.
Testing the H2 hypothesis. In order to identify the direction of causality between defence expenditure and government financial debt, and to test the H2 hypothesis, an analysis of life tables for the period of time between 2005−2019 was conducted. The results were provided in the form of trajectories (Figure 2).
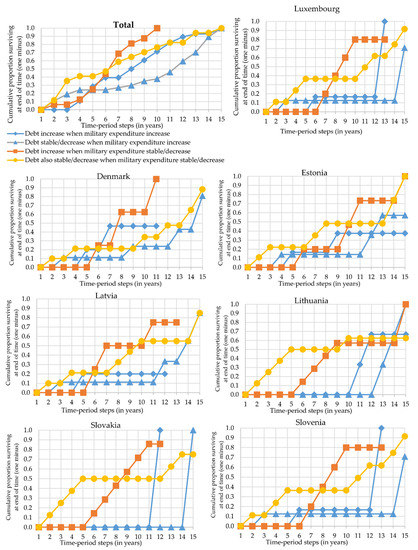
Figure 2.
Survival of government debt in respect to changes in defence expenditure as a share of GDP. Source: authors’ elaboration, based on Eurostat [37] and NATO [38].
For the total number of cases, when starting from a certain point in time, it is likely that the situation will appear first in which defence expenditure as well as government debt remains stable or decreases. In the period of analysis, the probability of such a situation will slightly but steady increase. The median survival period from a certain point in time until such a situation appears (in other words, waiting for the event time to occur), is equal to 7 years (Table 3). Next, the situation in which defence expenditure will be stable or decrease, while government debt will increase, most likely. The median survival time until such a situation does appear, also, is equal to 7 years. Furthermore, a situation in which defence expenditure together with government debt will increase appears, but it will remain at rather a low level for a certain period of time. The median survival time until such a situation should appear is equal to 8 years. Finally, the chances of a situation in which defence expenditure will remain stable or decrease, meanwhile, government debt increases, is likely to appear. Even if such a situation arises at the latest possible point in time, it tends to grow very rapidly. The median survival time until such a situation appears is equal to 12 years. Finally, Breslow (Generalised Wilcoxon) and “Log Rank” (Mantel–Cox) are not statistically significant, and reveal that neither in terms of increasing defence expenditure, nor in terms of providing stable or decreasing defence expenditure do the trajectories of government debt become statistically significantly different. In other words, survival trajectories have no clear or generalised trends in relation to defence expenditure.
Table 3.
The median survival time and measures of its comparison.
For explored countries, similar trends are evident: at the beginning of the period in question defence expenditure and government debt trajectories are stable or decrease; but when defence expenditure starts to increase, government debt remains stable or decreases; when defence expenditure and government debt increase together; and finally, when defence expenditure enters a situation of stability or decrease, but meanwhile government debt still increases (Figure 2). In the long run, some variations could be observed in terms of interrelations among the explored trajectories in different countries. At the same time, general trends remain as follows: when defence expenditure returns to stable or a decreasing position but government debt still increases, this tends to appear last of all but grows very rapidly after it does make an appearance. The probability of a situation in which defence expenditure and government debt remain stable or in a decreasing position is slight but with a steady increase for almost the entire period of time in question. While the remaining situations tend to appear second or third in the running order but for the majority of the time remain at rather a low level. The main differences concern median survival time until a certain situation tends to appear (Table 3). Finally, Breslow (Generalised Wilcoxon) and Log Rank (Mantel–Cox) indexes again show that the trajectories of government debt do not have clear and regular trends in relation to defence expenditure when it comes to an increase of defence expenditure in selected countries, or for stable or decreasing defence expenditure.
In summary, after what is laid out above, it can be stated that a sequence of increasing or decreasing defence expenditure and government debt has a rather evident running order over a short period of time, and over a longer period of time, as in total calculations, as for separate explored countries. During fluctuations in defence expenditure (stable-decrease–increase), the duration of the existence of government debt in one or another status tends to last longer. The analysis does not provide any clear answers in terms of how much any fluctuations in the government debt trajectory are caused by defence expenditure, and cannot thereby confirm or deny the H2 hypothesis. Even so, some interrelations were obtained. Moreover, it is evident that any relationship depends upon the certain period of time over which one form or another of any such interrelation will tend to appear.
4.2. Discussion
The originality of the study lies in the lack of research into EU and NATO countries concerning the relationship between government debt and defence expenditure within the context of sustainability. This has become even more important in light of the onset of a pandemic, with the entire world going through a health crisis, economic growth in many countries declining or turning negative, and countries tending to maintain or increase defence funding due to internal and external threats. In addition, this is a particularly important issue for small countries, which often have budgetary constraints, as they are often forced to borrow on international markets to ensure their public security. The current pandemic situation and its consequences are likely to pose new challenges for public finance management and decision-making in terms of the development of public welfare. Therefore, in order to be able to measure and evaluate how some indicators may affect others, examining their levels of interdependence is an important outcome in terms of reaching further decisions, which are related to public finance management. Moreover, this investigation expands upon the range of available scientific studies and may be an incentive for other scientists to conduct similar studies in other EU and NATO countries. In addition, given the fact that economic development, government debt, and security are components of the SDGs, maintaining a balance between defence financing, government debt, and growth is becoming an important tool when it comes to achieving the 2030 sustainable development goals.
The originality and importance of this research are underlined by Figure 3, below. This figure links the current study with possible directions for further research.
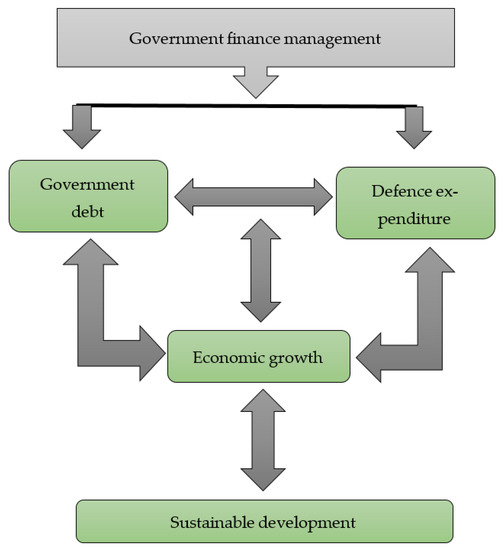
Figure 3.
Inter-linkages of government debt, defence, and sustainable development. Source: authors’ elaboration.
Defence expenditure and government debt are particularly important areas of government financial management and operations. Coherence in these areas is important for public security and sustainable development. In this article, the authors confine themselves to assessing the relationship between defence expenditure and government debt. Other possible links, such as government debt and economic growth, defence and economic growth, or government finance management and economic growth were not analysed in detail in this article. It should be noted that although defence indicators are not directly reflected in sustainable development goals, they do correlate with sustainable development goals, as shown by a previous study [64]. Synergistic feedback exists between security, government debt, and other SDGs. A failure to meet the SDGs may expose humanity to a global catastrophic or existential risk [65]. Ensuring security is an essential condition when it comes to achieving the goals of sustainable development.
The results of this research in some sense converge with findings by Looney and Frederiksen [45], and Khan et al. [50], stating that the relationship between defence expenditure and government debt may be positive in some cases and negative in others. Looney and Frederiksen [45] detected a negative relationship in relatively resource-constrained countries and a positive one in relatively resource-unconstrained countries. Khan et al. [50] suggested that defence expenditure generally increases the external debt in those countries, which have been studied. However, in the case of Europe and Central Asia, the relationships turned out to be the opposite. We found that, in Estonia, the correlation between defence expenditure and external debt is statistically significant and positive.
Meanwhile, Latvia, Slovakia, and Slovenia demonstrated a negative interrelationship between these two variables. Statistically insignificant relationships were found in Luxembourg, Denmark and Lithuania. Moreover, the investigation into the government debt–defence expenditure nexus in Estonia has supported the results of previous studies by Ahmed [47], and Khan et al. [50]. The results of the research to an extent reflect the finding by Shahbaz et al. [18] who indicated the existence of an interrelationship between defence expenditure and government debt. As we revealed in this paper, a rise in defence expenditure increases government debt, but in certain periods of time only. Meanwhile, in other periods of time, defence expenditure increases while debt remains stable or decreases. In addition, the results show that government debt can increase but defence expenditure can simultaneously remain stable or even decreases. This disagrees with the results by Dunne et al. [51], Sezgin [52], and Feridum [53], which revealed that defence spending has no impact on debt.
The evaluation of the relationship between defence expenditure and government debt allows policymakers of small countries to incorporate the findings into their defence planning, and their allocation and debt management processes. The authors suggest that the findings could be used to expand the range of research into other EU or NATO countries, while also applying the insights in university studies through teaching subjects that are related to defence economics, finance management, public safety, and other areas. The authors acknowledge that the attempt by this research is perhaps incomplete and disputable. An appropriate selection of research methods and a research timescale, along with a precise view of the phenomena, opens up new aspects of interrelations for future study.
5. Conclusions
The research aims to evaluate the relationship between government debt and defence expenditure by population size in small economies, such as those of Lithuania, Latvia, Estonia, Denmark, Slovakia, and Slovenia, within the period between 2005 and 2019. This issue is particularly relevant in the current pandemic situation, with the entire world going through a public health crisis, economic growth in many countries declining or turning negative, and countries tending to maintain or increase defence funding due to internal and external threats. Moreover, in recognising that economic development, government debt, and security are components of the SDGs, maintaining a balance between defence financing, government debt, and growth is becoming an important tool in terms of achieving the 2030 sustainable development goals. Based on findings in previous research on areas of impact which can be caused by defence expenditure in terms of government debt, the following two hypotheses were formulated: H1—a strong and positive statistically-significant correlation relationship exists between government debt and defence expenditure for the specific country in question; H2—unidirectional causality between government debt and defence expenditure exists, with any increase in defence expenditure also increasing government debt for that specific country.
The results of the investigation revealed that, in total, defence expenditure as a share of GDP correlates statistically significantly with government gross debt. The authors detected a strong and a negative relationship, which became apparent for Latvia, Slovakia, and Slovenia. Such results contradict the presumption that was reached in hypothesis H1. Meanwhile, in Estonia, the relationship between the variable comes out as strong and positive. This has confirmed H1. Generally, the correlation relationship between government gross debt and defence expenditure, as well as defence expenditure by the main category, such as personnel, equipment, infrastructure, and other expenditure areas, tends to vary across countries. In most statistically significant cases, the relationship is both strong and negative. A statistically significant and positive correlation was detected only in the relationship between defence expenditure for personnel and government gross debt. Therefore, hypothesis H1 is confirmed only partially.
During any fluctuation in terms of defence expenditure, the duration of government debt in one or other of its status areas tends to last longer, although the investigation does not provide any clear answer about how much any fluctuations in government debt trajectory may be caused by defence expenditure. Therefore, we cannot confirm or deny the H2 hypothesis. For any clear identification of the causality between defence expenditure and government debt, additional research is required in the future. In general, the authors assume that regardless of the level of economic development of a country, increasing defence spending is a more political and strategic decision than an economic one.
This investigation was bounded by the relationship between defence expenditure and government debt, while also adding in breakdowns of defence expenditure on the basis of any military activities which they may support. Based on the assumption which is provided by the phrase ceteris paribus, the authors did not consider other indicators as having an impact upon government gross debt or economic performance. Despite the limitations, the authors believe that the results which were obtained may allow policymakers of small countries to incorporate the findings into their defence planning, and their allocation and debt management processes. In conclusion, the findings of the research could be involved in the process of planning national defence budgets and in achieving sustainable development goals for 2030.
Author Contributions
Conceptualisation, G.D. and V.Č.; methodology, V.Č.; software, V.Č.; validation, V.Č., and D.P.; formal analysis, G.D.; investigation, V.Č.; resources, G.D.; data curation, V.Č.; writing (original draft preparation), G.D.; writing (review and editing), V.Č. and D.P.; visualisation, V.Č.; supervision, G.D. All authors have read and agreed to the published version of the manuscript.
Funding
This research received no external funding.
Institutional Review Board Statement
Not applicable.
Informed Consent Statement
Not applicable.
Data Availability Statement
The authors have used secondary data from Eurostat and NATO databases for the investigation. Database links have been provided in the references list.
Conflicts of Interest
The authors declare no conflict of interest.
References
- Bivainis, J.; Butkevičius, A. Nacionalinio biudžeto išlaidų planavimas [National Budget Expenditure Planning]. Pinigu Stud. 2002, 4, 20–36. [Google Scholar]
- Frorach, G. Managing Finances. In Defence Management: An Introduction; Security and Defence Management Series; Geneva Centre for the Democratic Control of Armed Forces: Geneva, Switzerland, 2009; pp. 93–123. [Google Scholar]
- Musayev, V. Externalities in Military Spending and Growth: The Role of Natural Resources as a Channel through Conflict. Def. Peace Econ. 2014, 27, 378–391. [Google Scholar] [CrossRef]
- Johnson, A.U.; Hove, K.H.; Lillekvelland, T. Country survey: Military expenditure and defence policy in Norway 1970–2013. Def. Peace Econ. 2015, 28, 669–685. [Google Scholar] [CrossRef]
- Khan, K.; Su, C.-W.; Rizvi, S.K.A. Guns and Blood: A Review of Geopolitical Risk and Defence Expenditures. Def. Peace Econ. 2020, 1–17. [Google Scholar] [CrossRef]
- Kollias, C.K.; Manolas, G.; Paleologouc, S.-M. Military expenditure and government debt in greece: Some preliminary empirical findings. Def. Peace Econ. 2004, 15, 189–197. [Google Scholar] [CrossRef]
- Turner, A.J.W. Estimated UK employment dependent on ministry of defence expenditure and defence exports. Def. Peace Econ. 2004, 15, 331–342. [Google Scholar] [CrossRef]
- Karagol, E.K. Defence expenditures and external debt in Turkey. Def. Peace Econ. 2005, 16, 117–125. [Google Scholar] [CrossRef]
- Özsoy, O. Government Budget Deficits, Defence Expenditure and Income Distribution: The Case of Turkey. Def. Peace Econ. 2008, 19, 61–75. [Google Scholar] [CrossRef]
- Karagol, E.T.; Turhan, A. External Debt, Defence Expenditures and Political Business Cycles in Turkey. Def. Peace Econ. 2008, 19, 217–224. [Google Scholar] [CrossRef]
- Ang, J.B. Finance and Inequality: The Case of India. South. Econ. J. 2010, 76, 738–761. [Google Scholar] [CrossRef]
- Feridun, M.; Sawhney, B.; Shahbaz, M. The Impact of Military Spending on Economic Growth: The Case of North Cyprus. Def. Peace Econ. 2011, 22, 555–562. [Google Scholar] [CrossRef]
- Ahmed, A.D. Debt Burden, Military Spending and Growth in Sub-Saharan Africa: A Dynamic Panel Data Analysis. Def. Peace Econ. 2012, 23, 485–506. [Google Scholar] [CrossRef]
- Chairil, T.; Sinaga, D.S.; Febrianti, A.I. Relationship between military expenditure and economic growth in ASEAN: Evidence from Indonesia. J. ASEAN Stud. 2013, 1, 106–121. [Google Scholar] [CrossRef]
- Duella, A. Military Burden and Economic Growth: Evidence from a Multivariate Cointegration Analysis. J. Glob. Econ. 2014, 2, 119. [Google Scholar] [CrossRef]
- Khalid, M.A.; Mustapha, A.B. Long-run relationship and causality tests between military expenditure and economic growth in India. Econ. Financ. Lett. 2014, 1, 49–58. [Google Scholar] [CrossRef]
- Qiong, L.; Junhua, H. Military Expenditure and Unemployment in China. Procedia Econ. Financ. 2015, 30, 498–504. [Google Scholar] [CrossRef]
- Shahbaz, M.; Shabbir, M.S.; Butt, M.S. Does Military Spending Explode External Debt in Pakistan? Def. Peace Econ. 2013, 27, 718–741. [Google Scholar] [CrossRef]
- Wolde-Rufael, Y. Defence Spending and Income Inequality in Taiwan. Def. Peace Econ. 2014, 27, 1–14. [Google Scholar] [CrossRef]
- Wolde-Rufael, Y. Military expenditure and income distribution in South Korea. Def. Peace Econ. 2015, 27, 571–581. [Google Scholar] [CrossRef]
- Huang, T.-Y.; Wu, P.-C.; Liu, S.-Y. Defense–Growth Causality: Considerations of Regime-Switching and Time- and Country-Varying Effects. Def. Peace Econ. 2016, 28, 568–584. [Google Scholar] [CrossRef]
- Caruso, R.; Di Domizio, M. Military spending and budget deficits: The impact of US military spending on public debt in Europe (1988–2013). Def. Peace Econ. 2016, 28, 534–549. [Google Scholar] [CrossRef]
- Azam, M.; Feng, Y. Does military expenditure increase external debt? Evidence from Asia. Def. Peace Econ. 2017, 28, 550–567. [Google Scholar] [CrossRef]
- Niazi, M.K.S. Economic growth in relation to defence expenditure, external debt and foreign aid (a case study of Pakistan). Def. Resour. Manag. 21 Century 2017, 12, 362–388. [Google Scholar]
- Sharif, A.; Afshan, S. Does Military Spending Impede Income Inequality? A Comparative Study of Pakistan and India. Glob. Bus. Rev. 2017, 19, 257–279. [Google Scholar] [CrossRef]
- Zhang, Y.; Wang, R.; Yao, D. Does defence expenditure have a spillover effect on income inequality? A cross-regional analysis in China. Def. Peace Econ. 2016, 28, 731–749. [Google Scholar] [CrossRef]
- Zhang, Y.; Liu, X.; Xu, J.; Wang, R. Does military spending promote social welfare? A comparative analysis of the BRICS and G7 countries. Def. Peace Econ. 2016, 28, 686–702. [Google Scholar] [CrossRef]
- Waszkiewicz, G. Defence spending and economic growth in the Visegrad countries. Panoeconomicus 2018, 67, 539–556. [Google Scholar] [CrossRef]
- Abbas, S.; Wizarat, S. Military Expenditure and External Debt in South Asia: A Panel Data Analysis. Peace Econ. Peace Sci. Public Policy 2018, 24, 24. [Google Scholar] [CrossRef]
- Graham, J.C.; Mueller, D. Military Expenditures and Income Inequality among a Panel of OECD Countries in the Post-Cold War Era, 1990–2007. Peace Econ. Peace Sci. Public Policy 2019, 25. [Google Scholar] [CrossRef]
- Gül, E.; Torusdag, M. Analysis of the effects of defense expenditures on income distribution and economic development with panel asymmetric causality test: BRICS Countries and Turkey Case. Int. J. Contemp. Econ. Adm. Sci. 2019, 9, 1–23. [Google Scholar]
- Michael, C.; Stelios, R. The effect of military spending on income inequality: Evidence from NATO countries. Empir. Econ. 2018, 58, 1305–1337. [Google Scholar] [CrossRef]
- Bataineh, I.M. The impact of government expenditures on economic growth in Jordan. Interdiscip. J. Contemp. Res. Bus. 2012, 4, 1320–1338. [Google Scholar]
- Ben-Gad, M.; Ben-Haim, Y.; Peled, D. Allocating Security Expenditures under Knightian Uncertainty: An Info-Gap Approach. Def. Peace Econ. 2020, 31, 830–850. [Google Scholar] [CrossRef]
- Sanchez-Juarez, I.L.; García-Almada, R. Public Debt, Public Investment and Economic Growth in Mexico. Int. J. Financ. Stud. 2016, 4, 6. [Google Scholar] [CrossRef]
- Casares, E.R. A relationship between external public debt and economic growth. Stud. Econ. 2015, 30. Available online: http://www.scielo.org.mx/scielo.php?script=sci_arttext&pid=S0186-72022015000200219 (accessed on 11 May 2021).
- Eurostat. Government Gross Debt. Available online: https://ec.europa.eu/eurostat/databrowser/view/sdg_17_40/default/table?lang=en (accessed on 1 February 2021).
- NATO. Defence Expenditure. Available online: https://www.NATO.int/cps/en/NATOhq/topics_49198.htm (accessed on 1 February 2021).
- Potrafke, N. Partisan politics: The empirical evidence from OECD panel studies. J. Comp. Econ. 2017, 45, 712–750. [Google Scholar] [CrossRef]
- Solomon, B.; Stone, C. Accrual budgeting and defence funding: Theory and simulations. Def. Peace Econ. 2013, 24, 211–227. [Google Scholar] [CrossRef]
- Potrafke, N. Does government ideology influence budget composition? Empirical evidence from OECD countries. Econ. Gov. 2010, 12, 101–134. [Google Scholar] [CrossRef]
- Le Roux, L. Parliamentary oversight of public expenditure management: A focus on the security services. Afr. Secur. Rev. 2006, 15, 33–41. [Google Scholar] [CrossRef]
- Dunne, J.P.D.; Perlo-Freeman, S.P.-F.; Soydan, A.S. Military expenditure and debt in small industrialised economies: A panel analysis. Def. Peace Econ. 2004, 15, 125–132. [Google Scholar] [CrossRef]
- Brzoska, M. Research Communication: The Military Related External Debt of Third World Countries. J. Peace Res. 1983, 20, 271–277. [Google Scholar] [CrossRef]
- Looney, R.E.; Frederiksen, P. Defense Expenditures, External Public Debt and Growth in Developing Countries. J. Peace Res. 1986, 23, 329–337. [Google Scholar] [CrossRef]
- Zaman, K.; Shah, I.A.; Khan, M.M.; Ahmad, M. Impact of Military Expenditure and Economic Growth on External Debt: New Evidence from a Panel of SAARC Countries. J. Econ. Soc. Stud. 2013, 3, 131–149. [Google Scholar] [CrossRef]
- Karagöl, E. The Relationship between External Debt, Defence Expenditures and Gnp Revisited: The Case of Turkey. Def. Peace Econ. 2006, 17, 47–57. [Google Scholar] [CrossRef]
- Sánchez-Juárez, I.; Garcia-Almada, R.M.; Bustillos, H.B. The Relationship between Total Production and Public Spending in Mexico: Keynes versus Wagner. Int. J. Financ. Res. 2015, 7, 109. [Google Scholar] [CrossRef][Green Version]
- Kamran, A.; Ahmed, S. Impact of military spending on external debt in indebt developing countries: A cross country analysis. In Proceedings of the Tenth International Conference on Management Science and Engineering Management, Baku, Azerbaijan, 30 August–2 September 2016; Advances in Intelligent Systems and Computing. Xu, J., Hajiyev, A., Nickel, S., Gen, M., Eds.; Springer: Singapore, 2017; Volume 502. [Google Scholar] [CrossRef]
- Khan, L.; Arif, I.; Waqar, S. The Impact of Military Expenditure on External Debt: The Case of 35 Arms Importing Countries. Def. Peace Econ. 2020, 31, 1–12. [Google Scholar] [CrossRef]
- Dunne, J.P.D.; Perlo-Freeman, S.P.-F.; Soydan, A.S. Military expenditure and debt in South America. Def. Peace Econ. 2004, 15, 173–187. [Google Scholar]
- Sezgin, S. An empirical note on external debt and defence expenditures in Turkey. Def. Peace Econ. 2004, 15, 199–203. [Google Scholar] [CrossRef][Green Version]
- Feridun, M. An economic analysis of the military expenditure and external debt in Argentina. Economic Analysis Working Papers (2002–2010). Atl. Rev. Econ. 2005, 4, 1–20. [Google Scholar]
- Daud, S.N.M.; Podivinsky, J.M. Revisiting the role of external debt in economic growth of developing countries. J. Bus. Econ. Manag. 2012, 13, 968–993. [Google Scholar] [CrossRef][Green Version]
- Shkolnyk, I.; Koilo, V. The relationship between external debt and economic growth: Empirical evidence from Ukraine and other emerging economies. Invest. Manag. Financ. Innov. 2018, 15, 387–400. [Google Scholar] [CrossRef]
- Al Kharusi, S.; Ada, M.S. External Debt and Economic Growth: The Case of Emerging Economy. J. Econ. Integr. 2018, 33, 1141–1157. [Google Scholar] [CrossRef]
- Ehikioya, B.I.; Omankhanlen, A.E.; Osuma, G.O.; Inua, O.I. Dynamic Relations between Public External Debt and Economic Growth in African Countries: A Curse or Blessing? J. Open Innov. Technol. Mark. Complex. 2020, 6, 88. [Google Scholar] [CrossRef]
- Rickli, J.-M. European small states’ military policies after the Cold War: From territorial to niche strategies. Hist. Econ. Soc. Bull. 2008, 21, 307–325. [Google Scholar] [CrossRef]
- Eurostat. Population on 1 January 2020. Available online: https://appsso.eurostat.ec.europa.eu/nui/show.do?dataset=demo_pjan&lang=en (accessed on 1 April 2021).
- Frankfort-Nachmias, C.; Leon-Guerrero, A.; Georgiann, D. Social Statistics for a Diverse Society; SAGE Publications, Inc.: London, UK, 2020. [Google Scholar]
- Kleinbaum, D.G.; Kupper, L.L.; Muller, K.E.; Nizam, A. Applied Regression Analysis and Other Multivariable Methods, 3rd ed.; Thomson Brooks/Cole Publishing Co.: Boston, MA, USA, 1998. [Google Scholar]
- Corder, G.W.; Foreman, D.I. Nonparametric Statistics: A Step-by-Step Approach; Wiley: Hoboken, NJ, USA, 2014. [Google Scholar]
- Blossfeld, H.-P.; Rohwer, G. Techniques of Event History Modeling. New Approaches to Causal Analysis; Lawrence Erlbaum Associates: Mahwah, NJ, USA, 2002. [Google Scholar]
- Meidutė-Kavaliauskienė, I.; Dudzevičiūtė, G.; Maknickienė, N. Military and demographic inter-linkages in the context of the Lithuanian sustainability. J. Bus. Econ. Manag. 2020, 21, 1508–1524. [Google Scholar] [CrossRef]
- Cernev, T.; Fenner, R. The importance of achieving foundational sustainable development goals in reducing global risk. Futures 2020, 115, 102492. [Google Scholar] [CrossRef]


Publisher’s Note: MDPI stays neutral with regard to jurisdictional claims in published maps and institutional affiliations. |
© 2021 by the authors. Licensee MDPI, Basel, Switzerland. This article is an open access article distributed under the terms and conditions of the Creative Commons Attribution (CC BY) license (https://creativecommons.org/licenses/by/4.0/).