Article

Inactivation of Algae and Plankton by Ultrasonic Cavitation

Department of Pure and Applied Physics, Faculty of Engineering Science, Kansai University, 3-3-35 Yamate-cho, Suita-shi, Osaka 564-8680, Japan
*
Authors to whom correspondence should be addressed.
Sustainability 2021, 13(12), 6769; https://doi.org/10.3390/su13126769
Submission received: 20 May 2021 / Revised: 11 June 2021 / Accepted: 12 June 2021 / Published: 15 June 2021

Abstract

:
Microbial treatment by ultrasonic waves has been attracting attention as a useful water treatment technology because it does not use special chemicals and the equipment is simple. In addition, because microbial cells are destroyed during treatment, it can be applied to ingredient extraction technology. Although ultrasonic cavitation bubbles are thought to be involved in the processing mechanism, the details of the mechanism remain unclear. The purpose of this study was to elucidate the destruction mechanism of algae, microcapsules, and plankton by ultrasonic waves. Each sample was irradiated with ultrasonic waves over a wide range of frequencies, and frequency dependence was observed in all the samples. For algae and microcapsules, we matched the frequencies against the resonance frequency calculated based on the mechanical resonance model using adjacent ultrasonic cavitation bubbles. As a result, a good match was found. For plankton, partial damage to the shape was observed after ultrasonic irradiation, suggesting that shear stress, which is a local action caused by bubbles, was involved. By estimating the shear stress value based on the vibration equation of bubble, it was confirmed that the tendencies match.

1. Introduction

Water treatment technology is essential for conservation of water environments. For example, algae and plankton overgrowth can cause ecosystem collapse and unpleasant odor. Although various methods exist for treating excess microorganisms, such as addition of algae-killing agents, flocculants, bioconcentration, and ozone treatment [1,2,3,4,5], there are concerns about the effects of chemicals on the natural environment and the human body. In addition, ozone treatment might cause damage to equipment due to its corrosiveness. An alternative is ultrasonic water treatment technology, which has been attracting attention as a water treatment method that has less impact on the surrounding natural environment and causes less damage to equipment [6]. In addition to improving water quality and inactivating microorganisms, ultrasonic water treatment is also expected to extract active ingredients by destroying microbial cells.
Ultrasonic cavitation is a phenomenon in which a large number of minute bubbles are generated by negative pressure when a liquid such as water is irradiated by a strong ultrasonic wave [7,8,9]. Ultrasonic cavitation bubbles expand and contract with ultrasonic pressure fluctuations before eventually collapsing. Assuming adiabatic compression, the internal temperature of bubbles during contraction is 5000 K or higher, and the internal pressure is several hundred atmospheres or higher [10,11]. The generation of this kind of high-temperature and high-pressure field thermally decomposes the gas in the bubble (nitrogen, oxygen, etc.) and produces oxidizing agents such as OH radicals and hydrogen peroxide [12,13,14]. This is called the chemical action of ultrasonic cavitation bubbles. In addition, the strong expansion and contraction of ultrasonic cavitation bubbles exerts various physical actions on the surrounding media and objects [15,16,17]. A force is applied to the surrounding medium due to the expansion and contraction of the bubbles, and shear stress is generated. When a bubble collapses, shock waves propagate in a spherical wave shape and microjets that hit the surrounding objects are generated [18,19,20]. These actions are exploited in industry and have a wide range of applications including cleaning, polymerization or decomposition of macromolecules, component extraction, microcapsule destruction, and microbial inactivation [21,22,23,24,25,26,27,28,29,30,31,32,33]. Among studies by other researchers on the inactivation of algae, Joyce et al., (2010) showed the frequency dependence on the inactivation of Microcystis aeruginosa, a type of cyanobacteria [34]. In addition, Wu et al., (2012) found that in the inactivation of Microcystis aeruginosa, a shear force acts on high-power 20 kHz ultrasonic waves, and radicals act on medium-power 580 kHz ultrasonic waves [35]. Kong et al., (2019) confirmed that cells were physically destroyed by ultrasound in the inactivation of Microcystis aeruginosa [36]. As an example of active ingredient extraction from algae, Gerde et al., (2012) conducted ultrasonic irradiation experiments on Schizochytrium limacinum and Chlamydomonas reinhardtii and confirmed the release of chlorophyll a and carotenoids from the cells [37]. Peng et al., (2020) reported that intracellular chlorophyll a was released as a result of ultrasonic irradiation of Anabaena flos-aquae, a type of cyanobacteria [38].
In this study, ultrasonic irradiation experiments were conducted on fine samples, including algae, microcapsules, and plankton. In order to elucidate the destruction mechanism of each sample, ultrasonic waves with frequencies of 20, 400, 1000, 2200, 3300, and 4300 kHz were applied to algae and microcapsule suspensions. In addition, ultrasonic waves with frequencies of 26, 200, 430, and 950 kHz were applied to a plankton suspension. The mechanisms of algae and microcapsule destruction were investigated based on the destruction rate after ultrasonic irradiation. In addition, the mechanism of plankton destruction was investigated by the inactivation rate of plankton at each frequency and observation with an optical microscope.

2. Ultrasonic Destruction of Algae and Microcapsule

2.1. Experimental Setup for Algae and Microcapsules

2.1.1. Algae

In this experiment, three types of algae were used: Chaetoceros gracilis, Chaetoceros calcitrans, and Nannochloropsis sp. The Chaetoceros gracilis and Chaetoceros calcitrans were purchased from Yanmar Holdings Co., Ltd. (Osaka, Japan), while Nannochloropsis sp. was purchased from ISC Co., Ltd. (Fukuoka, Japan). C. gracilis and C. calcitrans belong to the diatoms and are unicellular eukaryotic algae with siliceous shells. Nannochloropsis sp. belongs to the eustigmatophyceans, is unicellular, and has a cell wall. Figure 1 shows optical photomicrographs of each type of algae before ultrasonic irradiation. The particle size of each type was measured using a nanoparticle size analyzer (SALD-7500 nano, Shimadzu, Tokyo, Japan), and the mode diameters were found to be about 5.0, 4.7, and 2.6 µm, respectively. The Young’s modulus of each alga was measured using a scanning probe microscope (SPM-9700, Shimadzu) and was found to be 91, 142, and 29 MPa, respectively. The concentration of the algae was adjusted to 107 cells/mL by using purified water produced by ultrapure water production equipment.

2.1.2. Microcapsules

Microcapsules were used as pseudoalgae. Figure 2 shows optical photomicrographs of each microcapsule before ultrasonic irradiation. The microcapsules (Chemitech, Tokyo, Japan) used in this experiment were fats and oils encapsulated in a melamine spherical shell. The volume ratio of shell to content was 1:4, and the thickness of the shell was about 7% of the radius. Before ultrasonic irradiation, all capsules are spherical. The samples used were polydisperse microcapsules A with a mode diameter of about 11.8 µm and polydisperse microcapsules B with a mode diameter of about 4.6 µm. The mode diameter of each microcapsule was measured using a laser diffraction particle size distribution analyzer (SALD-2300, Shimadzu). The Young’s modulus of each microcapsule was measured using a scanning probe microscope (SPM-9700, Shimadzu) and was found to be 73 and 33 MPa, respectively. The concentration of capsules was adjusted to 107 capsules/mL by using purified water produced by ultrapure water production equipment.

2.1.3. Sonication

Figure 3 shows a block diagram of the experimental setup. This system is based on our design in which the important parameters (e.g., frequency, acoustic power, and temperature) in the reactor can be easily changed. This system also makes it possible to study the exact effect of ultrasonic cavitation using a small sample volume. The frequencies of the ultrasonic waves used in the experiment were 20, 400, 1000, 2200, 3300, and 4300 kHz. Because 20 kHz is used in many other studies [39,40,41], it was also adopted in this study. The sample tank used was a combination of a homemade cylindrical stainless-steel tank (inner diameter 41 mm, height 120 mm) and either a base for holding a stainless-steel bottom plate (when using 20 kHz) or a disk-type piezoelectric (PZT) transducer (400, 1000, 2200, 3300, 4300 kHz). The suspension was directly irradiated from the upper part of the sample tank using a horn-type transducer (VC750, Sonics & Materials, Inc., Newtown, CT, USA) with a diameter of 13 mm at 20 kHz. At other frequencies, a disk-type PZT transducer (Fuji Ceramics, Fujinomiya, Japan) with a diameter of 30 mm was installed at the bottom of the sample tank, and the suspension was directly irradiated. Sound power was measured by the calorimetry method and was constant at 10 ± 1 W in all experiments [42]. Cooling water was circulated outside the sample tank, and the sample temperature was kept constant at 15 ± 1 °C. A 100-mL sample was irradiated for 10 min and a sample was taken every 2 min. All experiments were performed 3 times to ensure reproducibility.

2.1.4. Evaluation Methods

The ultrasonic destruction rate was calculated using an optical microscope (IX73, Olympus, Tokyo, Japan) and a hemocytometer (8100204, Hirschmann, Stuttgart, Germany). Four optical micrographs were taken of each sample, and undamaged cells were counted before and after ultrasonic irradiation. The destruction in algae and microcapsule cell numbers after sonication for n minutes ( CN n ) was calculated using the following equation from the number of cells counted at n min CN n and the original number of cells at 0 min CN 0 [33]:
DR   [ % ] = ( CN 0 CN n CN 0 ) × 100 .

2.2. Algae and Microcapsule Results

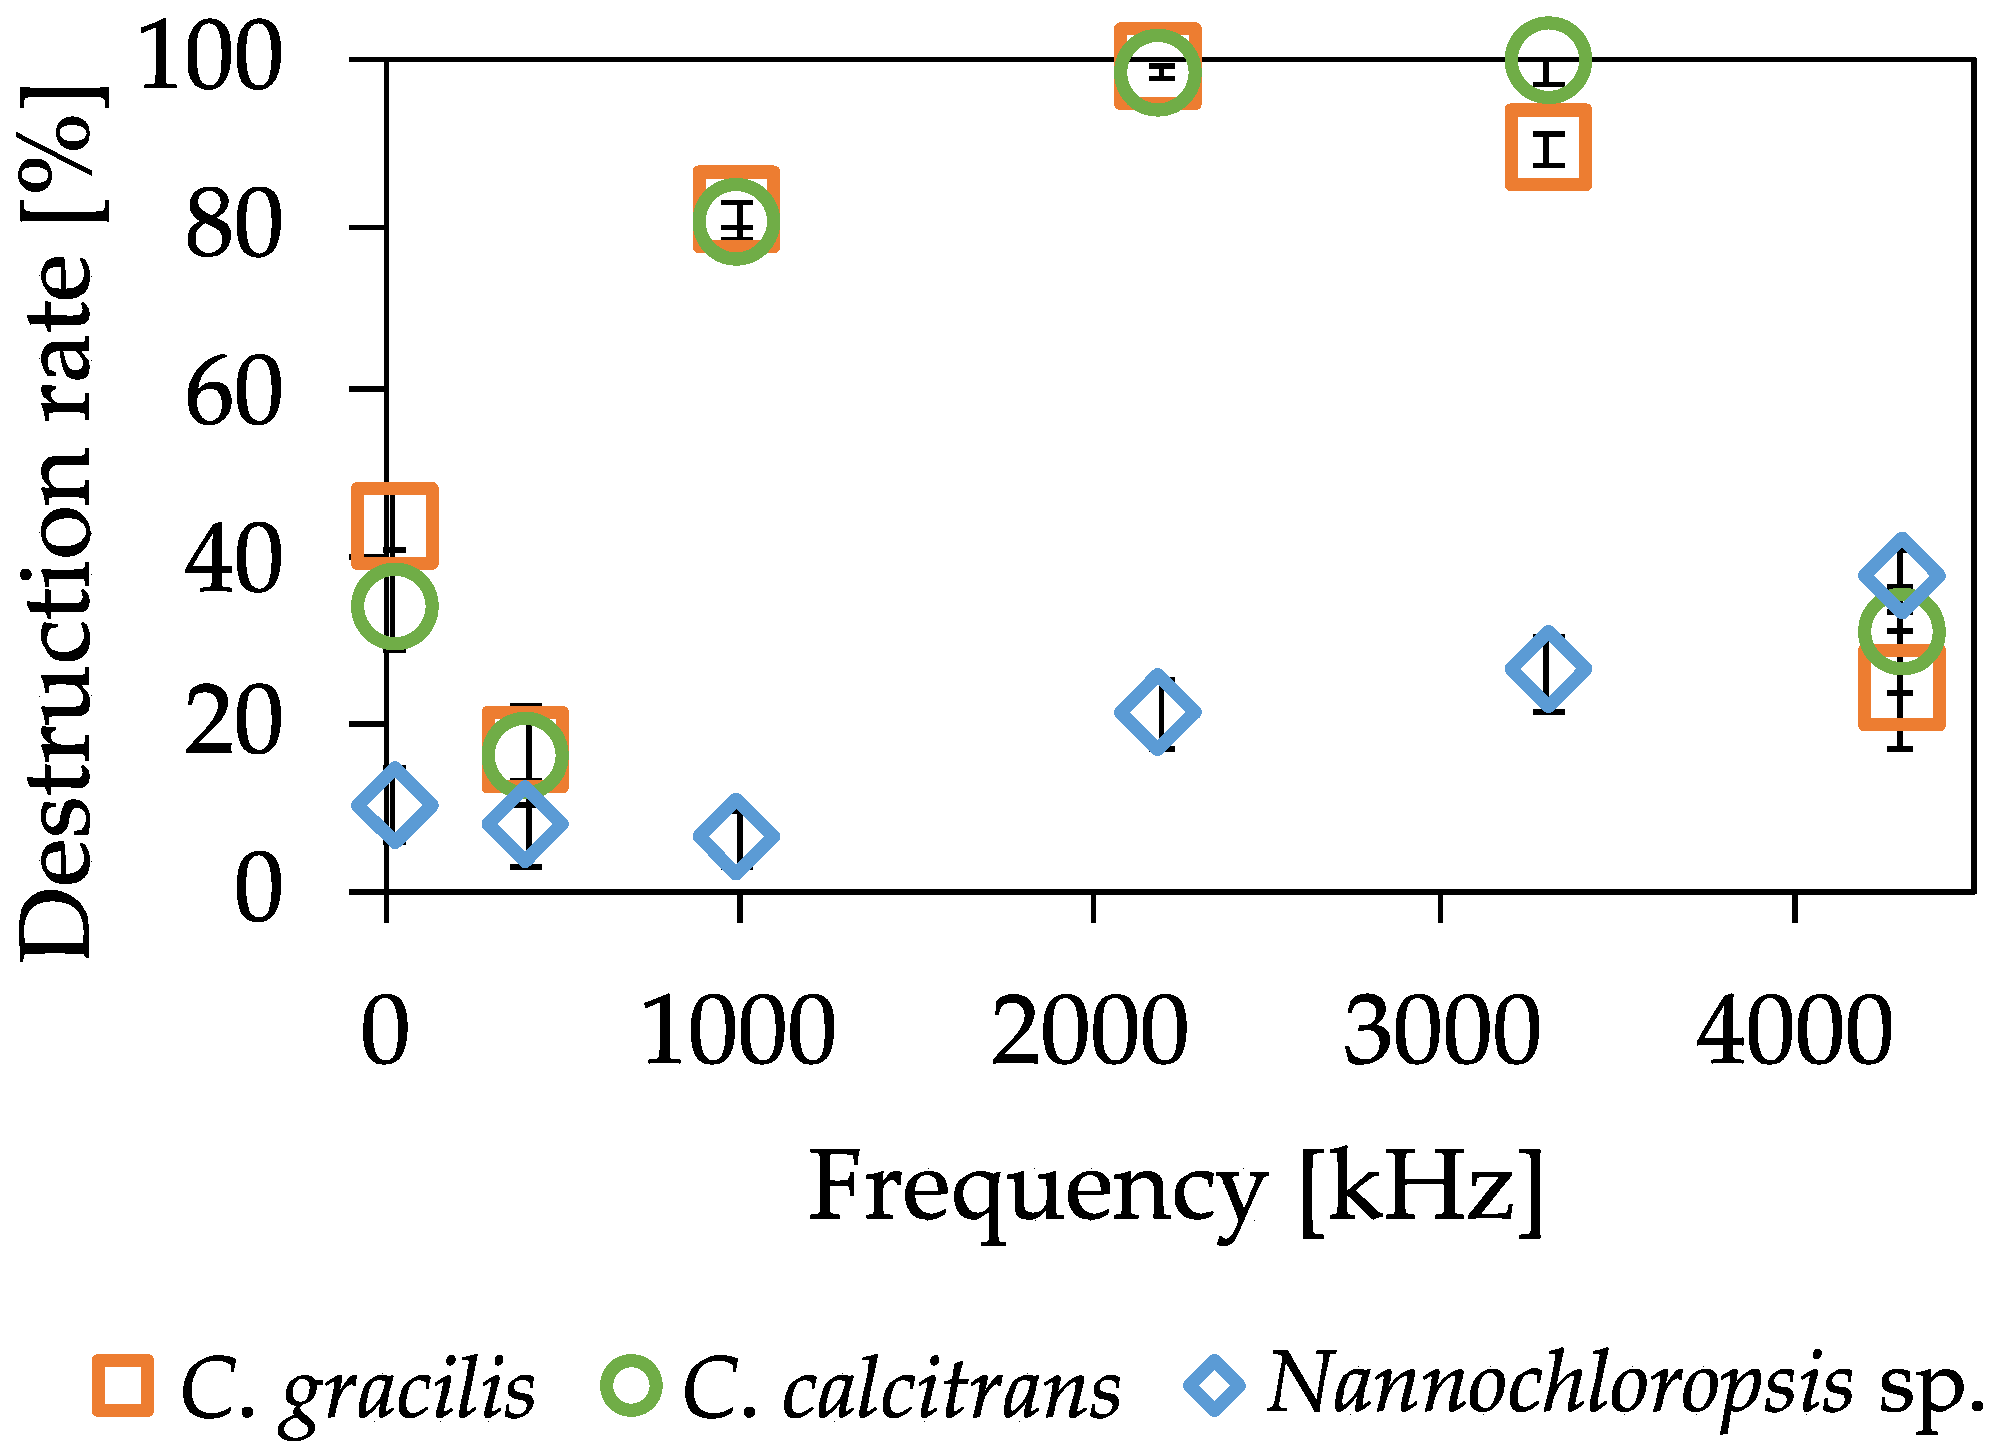
2.2.1. Algae Results

Figure 4 shows optical photomicrographs of C. gracilis 2 min after ultrasonic irradiation at each frequency. Cells counts were obtained using these images, and the destruction rate was calculated according to Equation (1). A similar analysis was performed on C. calcitrans and Nannochloropsis sp. to examine the frequency dependence of the fracture rate. Figure 5 shows the destruction rate of the algae used in this experiment at each frequency. The irradiation time was 2 min, and the sound power was 10 W. The ultrasonic destruction effect on C. gracilis was highest at 2200 kHz and lowest at 400 kHz. The ultrasonic destruction effect on C. calcitrans was highest at of 3300 kHz and lowest at 400 kHz. The ultrasonic destruction effect on Nannochloropsis sp. was highest at 4300 kHz and lowest at 400 kHz. Frequency dependence was observed in the ultrasonic destruction of the algae used in this experiment. However, because the experimental setup was different at 20 kHz, the ultrasonic intensity at 20 kHz differed from that at the other frequencies.

2.2.2. Microcapsule Results

Figure 6 and Figure 7 show the destruction rates of microcapsules A with a mode diameter of about 11.8 µm and microcapsules B with a mode diameter of about 4.6 µm at each frequency. The irradiation time was 30 min, and the sound power was 10 W. As shown in Figure 6, the ultrasonic destruction effect on microcapsules A was highest at 2200 kHz and lowest at 400 kHz. Furthermore, Figure 8 shows the particle size distribution before and after ultrasonic wave irradiation at 2200 kHz, which indicates the typical particle size change. Figure 8 shows the ultrasonic destruction effect on microcapsules B was highest at 4300 kHz and lowest at 400 kHz. However, because the experimental setup was different at 20 kHz, the ultrasonic intensity at 20 kHz differed from the other frequencies.

2.3. Discussion of Algae and Microcapsules

Zinin et al. proposed a mechanical resonance model with adjacent cavitation bubbles as a mechanism for the destruction of microorganisms (E. coli, M. hangatei, yeast, etc.) [43,44]. This model regards microorganisms as spherical particles. Vibration analysis of algae and microcapsules was therefore performed based on the mechanical resonance model as follows. We treated the algae and microcapsules as spheres with very thin elastic shells. Because the degree of deformation was maximized at n = 2 (quadrupole mode), this vibration mode was used in the analysis. The quadrupole mode has a much larger amplitude of oscillation displacement than does the dipole mode, so it is more likely to contribute to destruction. When a hard shell is considered, the mechanical resonance frequency fk of the sphere with the shell can be approximately expressed by the following equations.
f k 1 2 π K A ρ i a 3 ,
K A = Eh 2 ( 1 ν ) ,
Here, KA is the surface bulk modulus, ρi ≈ 1000 kg/m3 is the density inside the shell, a [m] is the radius of the sphere, E [Pa] is Young’s modulus, h [m] is the film thickness, and ν ≈ 0.5 is Poisson’s ratio.
Using Equation (2), the mechanical resonance frequencies of algae and microcapsules were calculated. Table 1 shows the analysis results for the algae and microcapsules used in this experiment and the optimal frequency for destruction calculated in the experiment.
For both algae and microcapsules, the mechanical resonance frequency and the optimal frequency for destruction were in agreement. Therefore, mechanical resonance due to adjacent bubbles is thought to be one of the causes of destruction of algae and microcapsules. Although C. calcitrans and microcapsule B are almost the same size, the mechanical resonance frequency and optimal frequency for destruction differ. This suggests that the destruction of algae and microcapsules by ultrasonic waves depends not only on the size but also on the structure and physical properties of the sample being irradiated with ultrasonic waves.

3. Ultrasonic Destruction of Plankton

3.1. Experimental Setup for Plankton

3.1.1. Plankton

The seawater containing plankton used in this series of experiment was collected in Himeji, Japan. It mainly contains zooplankton of size 50 µm or more. When dilution was required, filtered seawater was used as the diluent. The concentration of plankton was adjusted to 400,000 cells/m3. All the experiments were performed within 72 h of the arrival of seawater containing plankton so that the state of plankton did not change. Figure 9 shows an optical micrograph of a single plankton before ultrasonic irradiation. The main type of plankton observed in the experiments is shown in the photograph.

3.1.2. Sonication

Figure 10 shows a block diagram of the experimental setup. A cylindrical stainless steel sample tank (inner diameter 48 mm × height 170 mm) was installed above the 26, 200, 430, and 950 kHz ultrasonic generators (QUAVA mini, Kaijo Corporation, Tokyo, Japan). The suspension was directly irradiated with ultrasonic waves. The sound power was the same as that in the previous experimental setup (10 W). Cooling water was circulated outside the sample tank, and the sample temperature was kept constant at 20 ± 1 °C. A 100 mL sample was irradiated with ultrasonic waves for up to 30 min. All experiments were performed 3 times for reproducibility.

3.1.3. Evaluation Methods

Two evaluation methods were used. One involved the inactivation rate of plankton after ultrasonic irradiation. Plankton was fluorescently stained with fluorescein diacetate (FDA), and the number of fluorescences emitted by living cells with respect to excitation light was measured by a viable organism counter (VOA1000K, Satake, Hiroshima, Japan). The concentration of surviving plankton was determined based on the number of detections. The inactivation rate was calculated from the concentration of surviving plankton. The other evaluation method was observation by optical microscope. An inverted research microscope (IX73, Olympus) was used to examine the destruction by ultrasonic waves based on the presence or absence of shape changes before and after ultrasonic irradiation.

3.2. Results for Plankton

Figure 11 shows the plankton inactivation rate at each frequency. The inactivation rate differed depending on the frequency of the irradiated ultrasonic waves. It was confirmed that the inactivation rate increased with irradiation time. At 26 kHz, the inactivation rate increased with irradiation time until it reached almost 100% after 10 min of irradiation. At 200 kHz, the inactivation rate was about 90% after 1 min of irradiation and about 99% after 5 min of irradiation. At 430 kHz, the inactivation rate was about 86% after 10 min of irradiation, and at 950 kHz, it was about 78%, both of which were relatively low values. After 30 min of irradiation, the inactivation rate exceeded 90% at all frequencies used in the experiment. The above findings suggest that the plankton-inactivating effect increases in the order of 200 kHz, 26 kHz, 430 kHz, and 950 kHz among the frequencies used in this work.
Figure 12a–d shows optical micrographs of plankton after 10 min of ultrasonic irradiation at each frequency. The scale bar is 200 µm. At 26 kHz, few plankton retained their original shape, and plankton parts were scattered in the observation area. At 200 kHz, there were many individuals whose parts were torn and body contents were released to outside their body. At 430 kHz, there were few external changes, but many individuals were found with released contents. Some individuals had partial dents and tears. At 950 kHz, broken antennae were confirmed. The shape change of plankton was partial.

3.3. Discussion of Plankton

Given that the shape of plankton is far from spherical, it is unlikely that the destruction mechanism is mechanical resonance due to adjacent cavitation bubbles.
As shown in Figure 12, physical changes were confirmed in the plankton after ultrasonic irradiation. Because the shape change was partial, shear stress, which is a local stress generated from cavitation bubbles, was thought to be the plankton destruction mechanism. Figure 13 shows a schematic diagram of shear stress. As the cavitation bubbles expand and contract, a force is applied to the surrounding liquid medium and shear stress is generated. The value of shear stress σ s can be estimated by the Equation (4) below [45].
σ s = μ | dV dx | μ | V R 0 | = μ | R ˙ R 0 | ,
Here, µ [Pa·s] is the viscosity, V [m/s] is the bubble wall velocity, R0 [m] is the initial bubble radius, and R ˙ [m/s] is the time derivative of the bubble radius. In this shear stress calculation, the target area is only near the bubbles, and the attenuation of shear stress due to the propagation distance is not considered. The bubble wall velocity (time derivative of the bubble radius) was obtained by solving the Keller–Miksis equation [46], which represents the vibration amplitude of the bubble. The equation is shown below.
( 1 1 c R ˙ ) R R ¨ + 3 2 ( 1 1 3 c R ˙ ) R ˙ 2 = 1 ρ ( 1 + 1 c R ˙ + R c d dt ) × { ( P 0 + 2 σ R 0 ) ( R 0 R ) 3 γ 2 σ R 0 4 μ R ˙ R P 0 + P s sin ω t } ,
Here, c [m/s] is the speed of sound of the liquid, ρ [kg/m3] is the density of the liquid, t [s] is the time, P0 [Pa] is the atmospheric pressure, σ [N/m] is the surface tension, R0 [m] is the initial bubble radius, R [m] is the bubble radius, γ is the specific heat ratio, μ [Pa·s] is the viscosity, Ps [Pa] is the sound pressure amplitude, and ω [rad/s] is the angular frequency. The values of each parameter in the calculation are shown in Table 2 below.
For the sound pressure amplitude PS, the value was calculated using the following formula.
P S = 2 ρ cW US A ,
Here, WUS [W] is the sound power and A [m2] is the area of the oscillator. Figure 14 shows a graph plotting the calculation results for shear stress.
For the ultrasonic waves at frequency range used in the experiment, the value of the shear stress decreased with increasing frequency. In addition, the initial bubble diameter, which indicates the peak value of shear stress, increased with increasing frequency. Compared with Figure 11, there was agreement between the magnitude relationship with the inactivation rate and the magnitude relationship with the shear stress in the ultrasonic waves after 200 kHz. At 200 kHz, it was inferred that the bubble size distribution at each frequency was involved in the inactivation rate of 26 kHz, which was the largest shear stress. Tsochatzidis et al., (2001) reported that the bubble size distribution at 20 kHz is distributed over a diameter of about 3 to 40 μm and that there is a high frequency of bubbles with a size of around 10 µm [47]. Therefore, it is thought that the size distribution is almost the same even at 26 kHz. Furthermore, according to Brotchie et al., (2009), the bubble size distribution at 213 kHz is about 4–9 µm in diameter, and this bubble size distribution was measured for bubbles that undergo vigorous expansion and contraction that cause sonoluminescence [48]. Comparing the shear stresses in the region corresponding to the bubble size distribution at each frequency, we can see that 200 kHz exceeds the shear stress value at 26 kHz. From the above, it was considered possible that many bubbles exerted a higher shear stress when irradiated at 200 kHz.

4. Conclusions

We elucidated the mechanism of microbial treatment by ultrasonic waves. As a result of irradiating algae, microcapsules, and plankton with ultrasonic waves over a wide range of frequencies, frequency dependence was observed in all the samples. The algae and microcapsules were compared with the resonance frequency calculation based on the mechanical resonance model using adjacent ultrasonic cavitation bubbles. As a result, a good match between the experimental resonance frequency and the theoretical resonance frequency was confirmed. In addition, despite the experimental resonance frequencies having the same size, they differed in the destruction of algae (Chaetoceros calcitrans) and microcapsules (microcapsules B), suggesting that the frequency might also depend on the physical characteristics of the sample. When the shape of the plankton after ultrasonic irradiation was observed by optical microscope, partial damage was observed. It is thought that the partial damage received by plankton was related to the shear stress, which is a local action from the bubbles. The bubble wall velocity was calculated based on the Keller–Miksis equation, which is an equation expressing bubble vibration, and the value of shear stress was estimated. At high frequencies, the relationship between frequency dependence and theoretical shear stress was consistent. Disagreement in the trends at low frequencies was considered from the viewpoint of the bubble size distribution at each frequency. This suggested that the number of bubbles capable of exerting high shear stress varies depending on the frequency.

Author Contributions

Data curation, A.H.; Funding acquisition, K.Y.; Investigation, F.S.; Project administration, K.Y.; Writing—original draft, A.H.; Writing—review & editing, F.S. All authors have read and agreed to the published version of the manuscript.

Funding

This research was funded by JSPS KAKENHI, grant number JP18K04036.

Institutional Review Board Statement

Not applicable.

Informed Consent Statement

Not applicable.

Data Availability Statement

Data can be provided upon request from the corresponding author.

Acknowledgments

The authors would like to thank S. Ogawa, M. Imasaka, and S. Nishi of FURUNO ELECTRIC Co., Ltd., for providing experimental samples and measuring instruments and giving valuable comments.

Conflicts of Interest

The authors declare no conflict of interest.

References

  1. Chen, J.-J.; Yeh, H.-H. The mechanisms of potassium permanganate on algae removal. Water Res. 2005, 39, 4420–4428. [Google Scholar] [CrossRef] [PubMed]
  2. Xie, P.; Ma, J.; Fang, J.; Guan, Y.; Yue, S.; Li, X.; Chen, L. Comparison of Permanganate Preoxidation and Preozonation on Algae Containing Water: Cell Integrity, Characteristics, and Chlorinated Disinfection Byproduct Formation. Environ. Sci. Technol. 2013, 47, 14051–14061. [Google Scholar] [CrossRef] [PubMed]
  3. Li, L.; Zhu, C.; Xie, C.; Shao, C.; Yu, S.; Zhao, L.; Gao, N. Kinetics and mechanism of Pseudoanabaena cell inactivation, 2-MIB release and degradation under exposure of ozone, chlorine and permanganate. Water Res. 2018, 147, 422–428. [Google Scholar] [CrossRef]
  4. Bishop, W.M.; Richardson, R.J.; Willis, B.E. Comparison of Partitioning and Efficacy between Copper Algaecide Formulations: Refining the Critical Burden Concept. Water Air Soil Pollut. 2018, 229, 300. [Google Scholar] [CrossRef]
  5. Ellgehausen, H.; Guth, J.A.; Esser, H.O. Factors determining the bioaccumulation potential of pesticides in the individual compartments of aquatic food chains. Ecotoxicol. Environ. Saf. 1980, 4, 134–157. [Google Scholar] [CrossRef]
  6. Mahvi, A.H. Application of Ultrasonic Technology for Water and Wastewater Treatment. Iran. J. Public Health 2009, 38, 1–17. [Google Scholar]
  7. Suslick, K.S. Sonochemistry. Science 1990, 247, 1439–1445. [Google Scholar] [CrossRef]
  8. Suslick, K.S.; Flannigan, D.J. Inside a Collapsing Bubble: Sonoluminescence and the Conditions during Cavitation. Annu. Rev. Phys. Chem. 2008, 59, 659–683. [Google Scholar] [CrossRef] [Green Version]
  9. Mason, T.J.; Paniwnyk, L.; Lorimer, J.P. The uses of ultrasound in food technology. Ultrason. Sonochem. 1996, 3, S253–S260. [Google Scholar] [CrossRef]
  10. Suslick, K.S.; Hammerton, D.A.; Cline, R.E. Sonochemical hot spot. J. Am. Chem. Soc. 1986, 108, 5641–5642. [Google Scholar] [CrossRef]
  11. Ashokkumar, M.; Grieser, F.A. Comparison between Multibubble Sonoluminescence Intensity and the Temperature within Cavitation Bubbles. J. Am. Chem. Soc. 2005, 127, 5326–5327. [Google Scholar] [CrossRef]
  12. Schmitt, F.O.; Johnson, C.H.; Olson, A.R. Oxidations Promoted by Ul-Trasonic Radiation. J. Am. Chem. Soc. 1929, 51, 370–375. [Google Scholar] [CrossRef]
  13. Mason, T.J.; Lorimer, J.P.; Bates, D.M.; Zhao, Y. Dosimetry in sonochemistry: The use of aqueous terephthalate ion as a fluorescence monitor. Ultrason. Sonochem. 1994, 1, S91–S95. [Google Scholar] [CrossRef]
  14. Ashokkumar, M.; Grieser, F. Ultrasound assisted chemical processes. Rev. Chem. Eng. 1999, 15, 41–83. [Google Scholar] [CrossRef]
  15. Suslick, K.S. Sonochemistry, Kirk-Othmer Encyclopedia of Chemical Technology, 4th ed.; John Wiley & Sons Inc.: New York, NY, USA, 2007; pp. 516–541. [Google Scholar]
  16. Iida, Y.; Tuziuti, T.; Yasui, K.; Kozuka, T.; Towata, A. Protein release from yeast cells as an evaluation method of physical effects in ultrasonic field. Ultrason. Sonochem. 2008, 15, 995–1000. [Google Scholar] [CrossRef]
  17. Bai, L.; Xu, W.; Tian, Z.; Li, N. A High-Speed Photographic Study of Ultrasonic Cavitation near Rigid Boundary. J. Hydrodynam. B 2008, 20, 637–644. [Google Scholar] [CrossRef]
  18. Holzfuss, J.; Rüggeberg, M.; Billo, A. Shock Wave Emissions of a Sonoluminescing Bubble. Phys. Rev. Lett. 1998, 81, 5434–5437. [Google Scholar] [CrossRef] [Green Version]
  19. Lamminen, M.O.; Walker, H.W.; Weavers, L.K. Mechanisms and factors influencing the ultrasonic cleaning of particle-fouled ceramic membranes. J. Membr. Sci. 2004, 237, 213–223. [Google Scholar] [CrossRef]
  20. Zhang, Y.; Zhang, Z.; Wu, J.; Liu, Y.; Zhang, M.; Yang, C.; He, M.; Gong, X.; Zhang, Z.; Wang, Z.; et al. Study on fracture of tungsten wire induced by acoustic cavitation at different hydrostatic pressures and driving electric powers. Ultrason. Sonochem. 2020, 68, 105232. [Google Scholar] [CrossRef]
  21. Keswani, M.; Raghavan, S.; Deymier, P.; Verhaverbeke, S. Megasonic cleaning of wafers in electrolyte solutions: Possible role of electro-acoustic and cavitation effects. Microelectron. Eng. 2009, 86, 132–139. [Google Scholar] [CrossRef] [Green Version]
  22. Mason, T.J. Ultrasonic cleaning: An historical perspective. Ultrason. Sonochem. 2016, 29, 519–523. [Google Scholar] [CrossRef]
  23. Shiba, K.; Takemura, Y.; Mizukoshi, Y.; Yamamoto, K. Effects of primary C1–C6 linear alcohol addition and sonochemically decomposed products on multi-bubble sonoluminescence. Jpn. J. Appl. Phys. 2019, 58, SGGD14. [Google Scholar] [CrossRef]
  24. Vinatoru, M. An overview of the ultrasonically assisted extraction of bioactive principles from herbs. Ultrason. Sonochem. 2001, 8, 303–313. [Google Scholar] [CrossRef]
  25. Zhang, L.; Zhou, C.; Wang, B.; Yagoub, A.E.-G.A.; Ma, H.; Zhang, X.; Wu, M. Study of ultrasonic cavitation during extraction of the peanut oil at varying frequencies. Ultrason. Sonochem. 2017, 37, 106–113. [Google Scholar] [CrossRef]
  26. Inui, A.; Honda, A.; Yamanaka, S.; Ikeno, T.; Yamamoto, K. Effect of ultrasonic frequency and surfactant addition on microcapsule destruction. Ultrason. Sonochem. 2021, 70, 105308. [Google Scholar] [CrossRef]
  27. Joyce, E.M.; Phull, S.S.; Lorimer, J.P.; Mason, T.J. The development and evaluation of ultrasound for the treatment of bacterial suspensions. A study of frequency, power and sonication time on cultured Bacillus species. Ultrason. Sonochem. 2003, 10, 315–318. [Google Scholar] [CrossRef]
  28. Tsukamoto, I.; Yim, B.; Stavarache, C.E.; Furuta, M.; Hashiba, K.; Maeda, Y. Inactivation of Saccharomyces cerevisiae by ultrasonic irradiation. Ultrason. Sonochem. 2004, 11, 61–65. [Google Scholar] [CrossRef]
  29. Gao, S.; Hemar, Y.; Ashokkumar, M.; Paturel, S.; Lewis, G.D. Inactivation of bacteria and yeast using high-frequency ultrasound treatment. Water Res. 2014, 60, 93–104. [Google Scholar] [CrossRef] [PubMed]
  30. Gao, S.; Lewis, G.D.; Ashokkumar, M.; Hemar, Y. Inactivation of microorganisms by low-frequency high-power ultrasound: 1. Effect of growth phase and capsule properties of the bacteria. Ultrason. Sonochem. 2014, 21, 446–453. [Google Scholar] [CrossRef]
  31. Hashimoto, Y.; Otani, Y.; Yabunaka, A.; Ikeuchi, R.; Yamamoto, K. Inactivation of Escherichia coli, Saccharomyces cerevisiae and Bacillus subtilis by ultrasonic cavitation. Acoust. Sci. Technol. 2020, 41, 877–884. [Google Scholar] [CrossRef]
  32. Kurokawa, M.; King, P.M.; Wu, X.; Joyce, E.M.; Mason, T.J.; Yamamoto, K. Effect of sonication frequency on the disruption of algae. Ultrason. Sonochem. 2016, 31, 157–162. [Google Scholar] [CrossRef] [PubMed] [Green Version]
  33. Yamamoto, K.; King, P.M.; Wu, X.; Mason, T.J.; Joyce, E.M. Effect of ultrasonic frequency and power on the disruption of algal cells. Ultrason. Sonochem. 2015, 24, 165–171. [Google Scholar] [CrossRef] [PubMed]
  34. Joyce, E.M.; Wu, X.; Mason, T.J. Effect of ultrasonic frequency and power on algae suspensions. J. Environ. Sci. Health A 2010, 45, 863–866. [Google Scholar] [CrossRef] [PubMed]
  35. Wu, X.; Joyce, E.M.; Mason, T.J. Evaluation of the mechanisms of the effect of ultrasound on Microcystis aeruginosa at different ultrasonic frequencies. Water Res. 2012, 46, 2851–2858. [Google Scholar] [CrossRef] [PubMed]
  36. Kong, Y.; Peng, Y.; Zhang, Z.; Zhang, M.; Zhou, Y.; Duan, Z. Removal of Microcystis aeruginosa by ultrasound: Inactivation mechanism and release of algal organic matter. Ultrason. Sonochem. 2019, 56, 447–457. [Google Scholar] [CrossRef]
  37. Gerde, J.A.; Montalbo-Lomboy, M.; Yao, L.; Grewell, D.; Wang, T. Evaluation of microalgae cell disruption by ultrasonic treatment. Bioresour. Technol. 2012, 125, 175–181. [Google Scholar] [CrossRef] [PubMed]
  38. Peng, Y.; Zhang, Z.; Wang, M.; Shi, X.; Zhou, Y.; Zhou, Y.; Kong, Y. Inactivation of harmful Anabaena flos-aquae by ultrasound irradiation: Cell disruption mechanism and enhanced coagulation. Ultrason. Sonochem. 2020, 69, 105254. [Google Scholar] [CrossRef]
  39. Wei, Z.; Kosterman, J.A.; Xioa, R.; Pee, G.Y.; Cai, M.; Weavers, L.K. Designing and characterizing a multi-stepped ultrasonic horn for enhanced sonochemical performance. Ultrason. Sonochem. 2015, 27, 325–333. [Google Scholar] [CrossRef] [Green Version]
  40. Calinescu, I.; Vartolomei, A.; Gavrila, A.I.; Vinatoru, M.; Mason, T.J. A reactor designed for the ultrasonic stimulation of enzymatic esterification. Ultrason. Sonochem. 2019, 54, 32–38. [Google Scholar] [CrossRef]
  41. Vinatoru, M.; Toma, M.; Radu, O.; Filip, P.I.; Lazurca, D.; Mason, T.J. The use of ultrasound for the extraction of bioactive principles from plant materials. Ultrason. Sonochem. 1997, 4, 135–139. [Google Scholar] [CrossRef]
  42. Kikuchi, T.; Uchida, T. Calorimetric method for measuring high ultrasonic power using water as a heating material. J. Phys. Conf. Ser. 2011, 279, 012012. [Google Scholar] [CrossRef]
  43. Zinin, P.V.; Allen, J.S., III; Levin, V.M. Mechanical resonances of bacteria cells. Phys. Rev. E 2005, 72, 061907. [Google Scholar] [CrossRef]
  44. Zinin, P.V.; Allen, J.S., III. Deformation of biological cells in the acoustic field of oscillating bubble. Phys. Rev. E 2009, 79, 021910. [Google Scholar] [CrossRef] [Green Version]
  45. Zuo, Y.Y.J.; Hébraud, P.; Hemar, Y.; Ashokkumar, M. Quantification of high-power ultrasound induced damage on potato starch granules using light microscopy. Ultrason. Sonochem. 2012, 19, 421–426. [Google Scholar] [CrossRef] [PubMed]
  46. Keller, J.B.; Miksis, M. Bubble oscillations of large amplitude. J. Acoust. Soc. 1980, 68, 628–633. [Google Scholar] [CrossRef] [Green Version]
  47. Tsochatzidis, N.A.; Guiraud, P.; Wilhelm, A.M.; Delmas, H. Determination of Velocity, Size and Concentration of Ultrasonic Cavitation Bubbles by the Phase-Doppler Technique. Chem. Eng. Sci. 2001, 56, 1831–1840. [Google Scholar] [CrossRef]
  48. Brotchie, A.; Grieser, F.; Ashokkumar, M. Effect of Power and Frequency on Bubble-Size Distributions in Acoustic Cavitation. Phys. Rev. Lett. 2009, 102, 084302. [Google Scholar] [CrossRef]
Figure 1. Optical photomicrographs of (a) C. gracilis, (b) C. calcitrans, and (c) Nannochloropsis sp. Scale bar is 50 µm.
Sustainability 13 06769 g001
Figure 2. Optical photomicrographs of (a) microcapsules A and (b) microcapsules B. Scale bar is 50 µm.
Sustainability 13 06769 g002
Figure 3. Schematic diagram of sonication system at (a) 20 kHz and (b) 400, 1000, 2200, 3300, and 4300 kHz.
Sustainability 13 06769 g003
Figure 4. Optical photomicrographs of C. glaciris after sonication for 2 min at (a) 20 kHz, (b) 400 kHz, (c) 1000 kHz, (d) 2200 kHz, (e) 3300 kHz, and (f) 4300 kHz. Scale bar is 50 µm.
Sustainability 13 06769 g004
Figure 5. Frequency dependence of destruction rate in each type of algae.
Sustainability 13 06769 g005
Figure 6. Frequency dependence of destruction rate in microcapsules A.
Sustainability 13 06769 g006
Figure 7. Frequency dependence of destruction rate in microcapsules B.
Sustainability 13 06769 g007
Figure 8. Typical particle size change: Particle size distribution of microcapsules A before and after irradiation with ultrasonic waves of 2200 kHz for 30 min.
Sustainability 13 06769 g008
Figure 9. Optical photomicrograph of a single plankton. Scale bar is 200 µm.
Sustainability 13 06769 g009
Figure 10. Experimental apparatus for sonication at 26, 200, 430, and 950 kHz.
Sustainability 13 06769 g010
Figure 11. Inactivation rate of a plankton at each frequency.
Sustainability 13 06769 g011
Figure 12. Optical photomicrograph of plankton after sonication at (a) 26 kHz, (b) 200 kHz, (c) 430 kHz, and (d) 950 kHz. Scale bar is 200 µm.
Sustainability 13 06769 g012
Figure 13. Schematic diagram of the shear stress from a cavitation bubble.
Sustainability 13 06769 g013
Figure 14. Shear stress versus initial bubble diameter at each frequency.
Sustainability 13 06769 g014
Table 1. Calculated resonance frequencies and best frequencies for destruction of algae and microcapsules.
AlgaeResonance Frequency
[kHz]
Best Frequency
[kHz]
C. gracilis40002200
C. calcitrans44003300
Nannochloropsis sp.49004300
MicrocapsuleResonance frequency
[kHz]
Best frequency
[kHz]
Microcapsules A19002200
Microcapsules B50004300
Table 2. Calculation parameters.
ParametersValue
c [m/s]1520
ρ [kg/ m 3 ]1027
P 0 [Pa]1.013 × 10 5
σ [N/m]0.0735
R 0 [m]0.1~150 × 10 6
in 0.1 µm increments
γ1.4
μ [Pa·s]0.001036
P S [Pa]2.1 × 10 5 (at 10 W)
ω [rad/s]Frequency dependent
Publisher’s Note: MDPI stays neutral with regard to jurisdictional claims in published maps and institutional affiliations.

