1. Introduction
Since entering the industrial era, global greenhouse gas emissions have increased rapidly, and China is the country with the most greenhouse gas emissions in the world [
1]. Excessive emissions of greenhouse gases (mainly CO
2) lead to climate change problems, and greenhouse gas emissions are one of the main problems in developing and emerging countries [
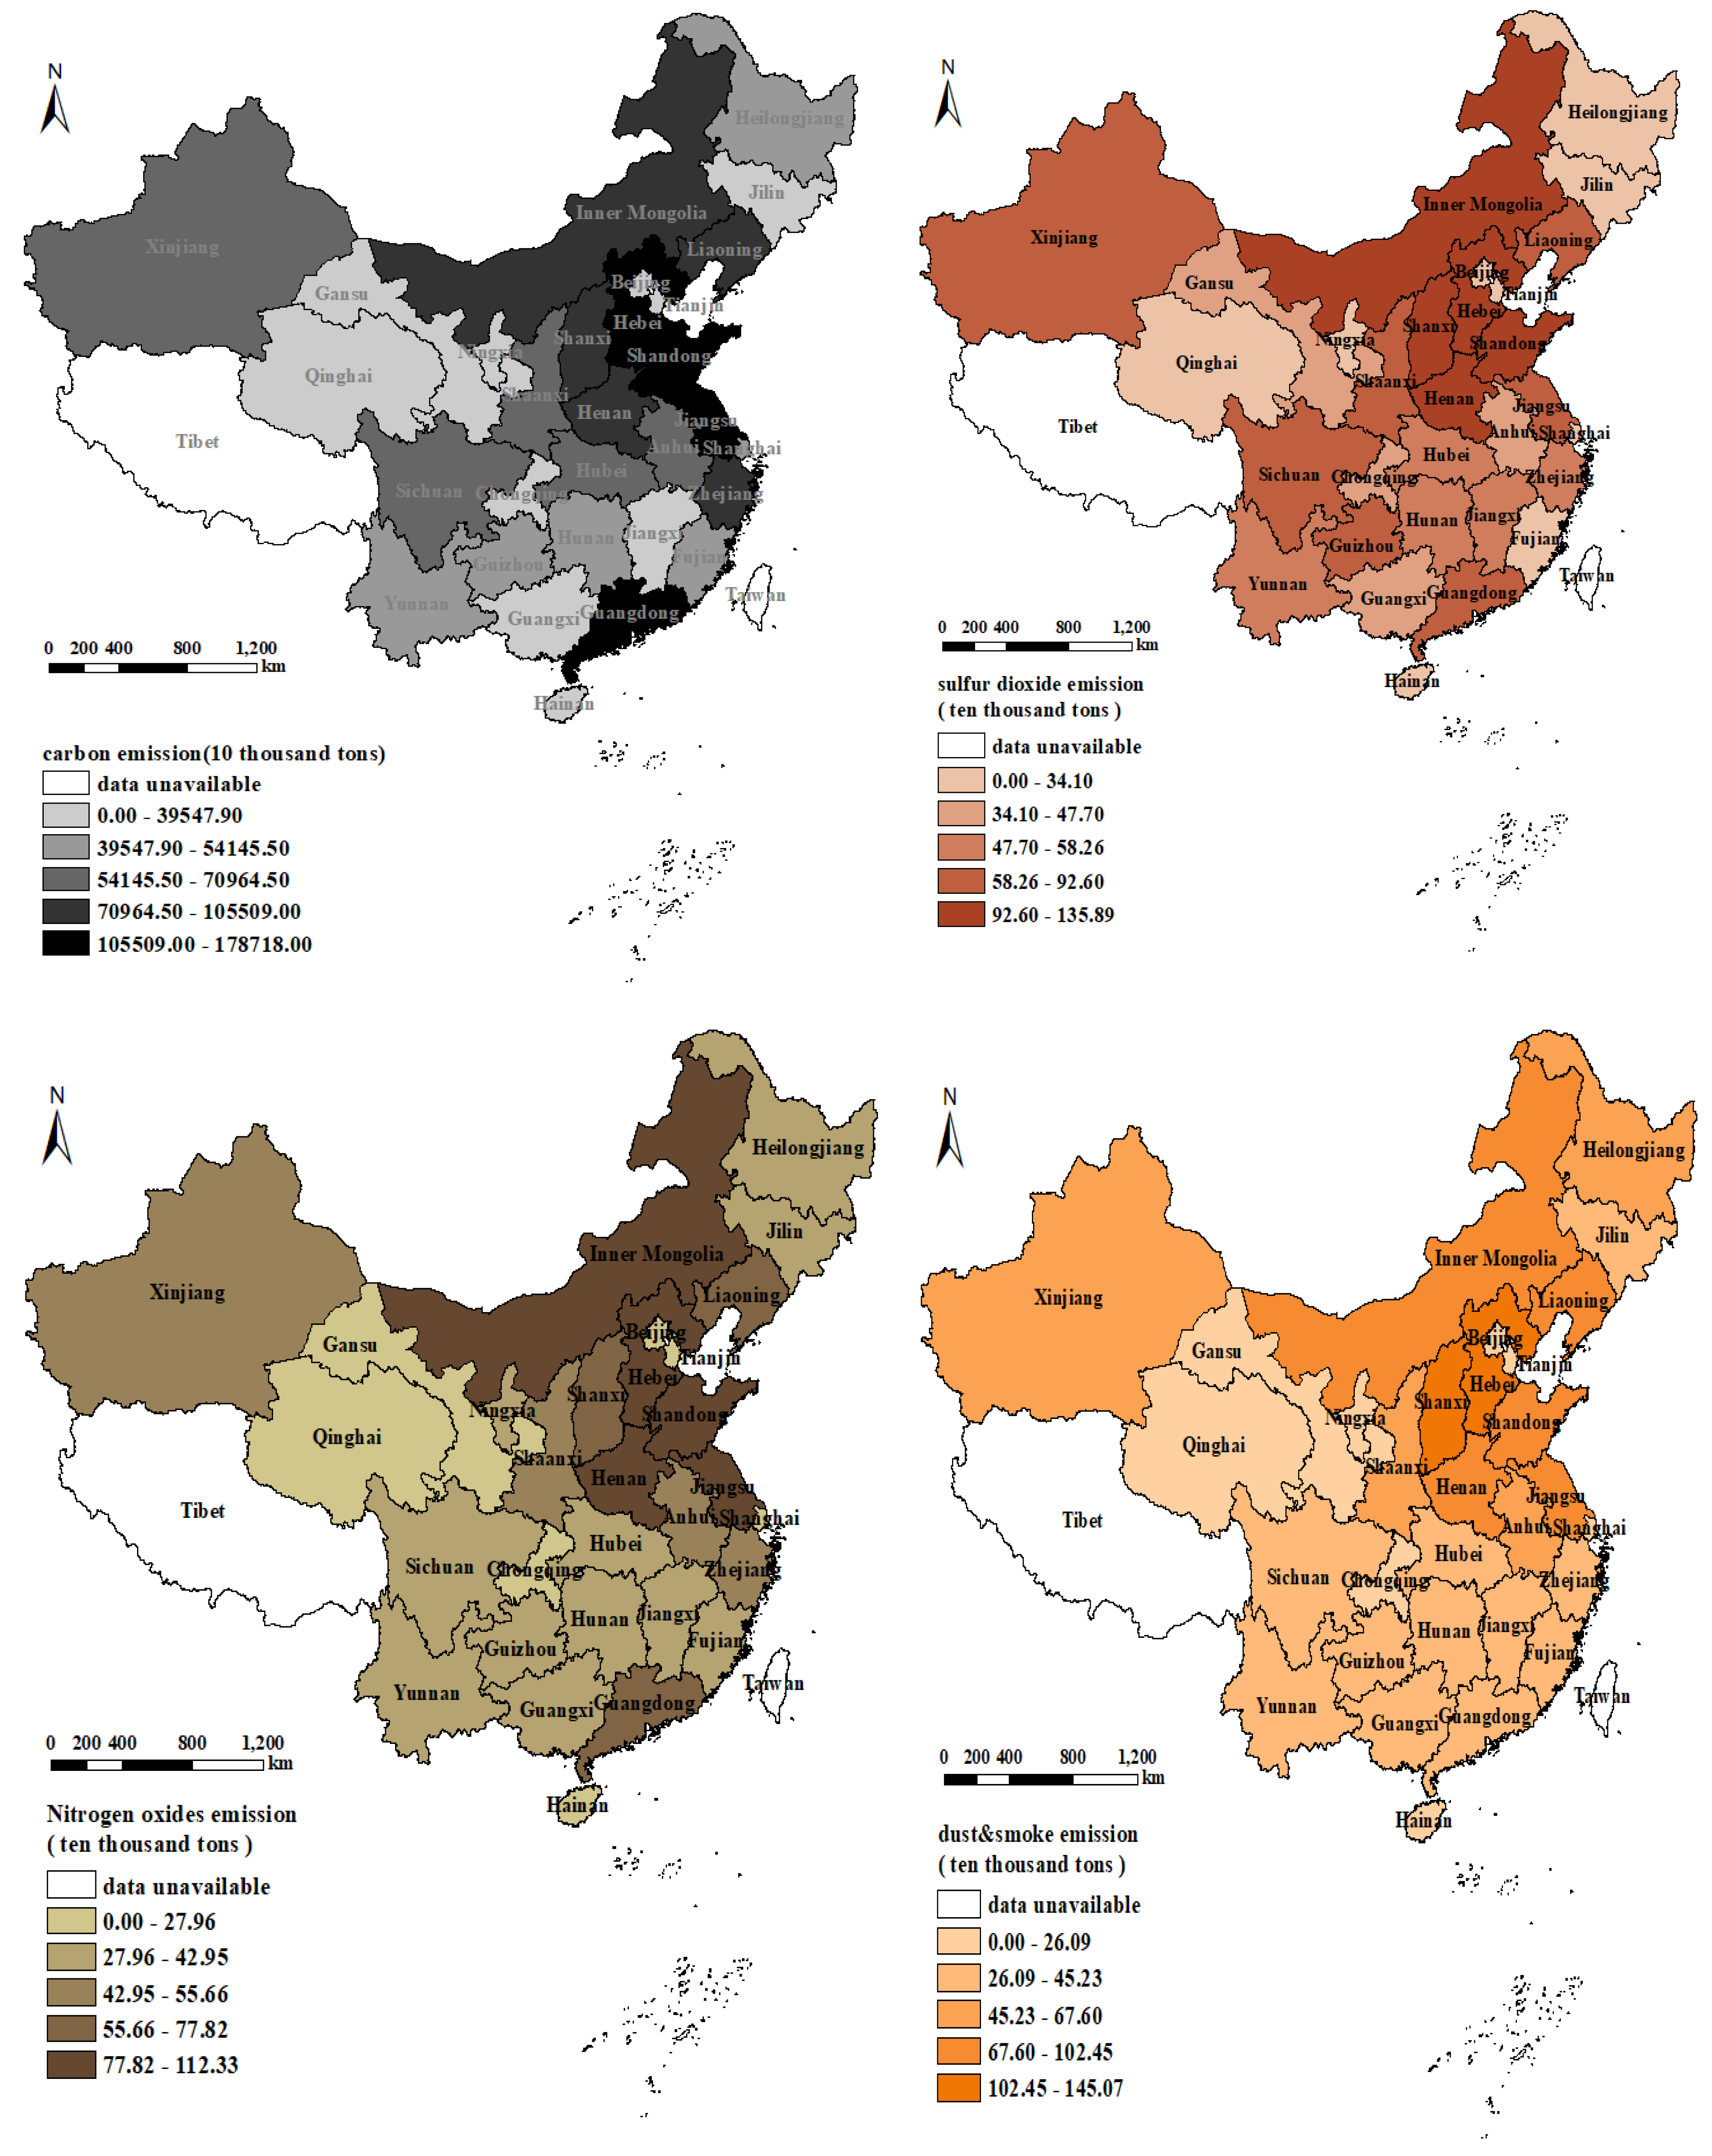
2]. The distribution of China’s carbon emissions in 2014 is shown in
Figure 1. To this end, countries signed the Paris Climate Agreement in 2016. In addition, at the Climate Ambition Summit in December 2020, Chinese President Xi Jinping pledged to strive for the peak carbon dioxide emissions by 2030 and strive to achieve carbon neutrality by 2060.
At the same time, China is also facing serious local air pollution problems [
3]. China has become the country with the largest SO
2 emissions in the world [
4]. China’s NOx and DS emissions are also very serious. The distribution of sulfur dioxide, nitrogen oxides, and smoke and dust emissions in China in 2014 is shown in
Figure 1. SO
2, NOx, and DS cause air pollution problems such as acid rain and smog, which have caused great troubles to China’s economic development.
The country with the most serious losses due to air pollution is China. In 2018, China’s losses were 6.6% of its GDP [
5]. An important cause of air pollution in China is the burning of coal. China is currently the world’s largest coal consumer. Since 2011, China’s coal consumption has accounted for about 50% of the global total [
6]. Coal still accounted for 59% of China’s energy structure until 2018 [
7]. Considering that when fossil fuels (especially coal) are burned, regional air pollution and greenhouse gas emissions are always co-produced, so there must be potential common interests [
8].
Climate change and air pollution issues, especially in developing countries, are two major challenges that have attracted global attention [
3]. As the largest developing country, China is facing this huge challenge. The problem of climate change and air pollution come together, so the solution should also be coordinated governance. The emissions of SO
2, NOx, and CO
2 are inherent results of fossil fuel combustion, which provides a potential synergistic effect of controlling greenhouse gas and air pollutant emissions at the same time [
9]. However, in actual operation, the complementarity of controlling air pollution and climate change are often overlooked. The response to climate change and environmental pollution control are managed separately by the National Development and Reform Commission (NDRC) and the Environmental Protection Department in China, and the control of both has been artificially separated.
Therefore, we need to use quantitative empirical methods to prove the existence of synergistic emission reduction effect and measure it. The benefits of coordinated emission reduction are divided into two aspects. On the one hand, the synergistic effect of air pollutant emission reduction brought about by greenhouse gas emission reduction, and the other is the greenhouse gas emission reduction effect brought about by air pollutant emission reduction. Since the reduction of air pollution brought about by greenhouse gas reduction has stronger practical significance, this article mainly focuses on the former.
On the one hand, China’s industrial sector is the main source of carbon dioxide emissions. In 2016, China’s industrial sector accounted for 68.44% of China’s carbon dioxide emissions [
10]. On the other hand, China’s industrial sector is also the main source of air pollutants [
11]. In 2015, industrial SO
2, NOx and smoke (dust) emissions accounted for 83.73%, 63.80% and 80.14% of the national emissions respectively [
12]. Therefore, the industrial sector is the source of climate change and air pollution in China. What kind of policy combination the industrial sector implements can most effectively realize the coordinated governance of climate change and air pollution in China is of vital importance to policy makers, and this is also the focus of this article. Therefore, this article takes China’s industry as a research case, from the perspective of collaborative control. Taking the coordinated emission reduction effect of comprehensive air pollutants caused by China’s industrial carbon emission reduction as the starting point, using China’s inter-provincial panel data over the years, empirical methods are used to quantify the industrial air pollutant emission reduction benefits brought about by industrial carbon emission reduction.
In addition, this article also demonstrates the possible transmission path of the synergistic control effect. The empirical results show that there is a synergistic treatment benefit between climate change and air pollution in China’s industrial sector. Every 1000 tons of carbon reduction in the industrial sector will result in 1 ton of air pollutant reduction. The increase in R&D expenditure in the energy and power sector can significantly promote the reduction of air pollutants in the industrial sector. Environmental regulations can promote synergistic emission reduction effects, while R&D expenditures in the energy and power sector and the increase in clean energy in the energy structure will weaken the synergy emission reduction effect. It will be better if R&D funds are directly invested in air pollutant reduction activities. However, in eastern, central, and western China, the synergy between industrial carbon emission reduction and air pollutant emission reduction is not the same. Therefore, it is necessary to formulate regionally differentiated emission reduction policies.
The main innovations of this paper are as follows: (1) This paper uses an econometric model to quantitatively calculate the emission reduction of air pollutants caused by China’s industrial carbon emission reduction, and uses empirical methods to measure the synergistic control effect of climate change and air pollution. (2) This article integrates the indicators for measuring comprehensive air pollution, and incorporates the three air pollutants SO2, NOx, and DS into a unified framework. In this way, an objective and comprehensive evaluation of the effects of air pollution reduction has been achieved. (3) This article explores several ways of coordinated control of climate change and air pollution and provides an important reference for policy making.
The structure of this paper is as follows: First, it explains the challenges China faces in the coordinated governance of climate change and air pollution. Secondly, it reviewed the relevant literature on the coordinated governance of climate change and air pollution. Thirdly, a modeling method and strategic plan are proposed. Fourth, results and discussion. Finally, in
Section 5, conclusions and policy implications are drawn.
2. Literature Review
In recent decades, China has faced the dual pressures of increasingly severe climate change and air pollution. The large emissions of CO
2 and air pollutants SO
2 and NOx are the main causes of climate change and air pollution in China. The emissions of SO
2, NOx and CO
2 are inherent results of fossil fuel combustion, which provides a potential synergistic effect to simultaneously control greenhouse gas and air pollutant emissions [
9]. One policy (such as climate policy) may have a positive or negative impact on another policy (such as air pollution control), and this interaction is called common interest in the literature [
8]. Research on the common interests of reducing greenhouse gas (GHG) and air pollution emissions began mainly in the 1990s. In recent years, scholars have become increasingly interested in this field, and research on common interests has gradually increased. Research on common interests helps to accurately measure the net cost of a policy in policy evaluation, and thus helps decision makers achieve multiple policy goals in a combination of policies [
13].
Research on common interests has shown that environmental policies to alleviate air pollution can also bring many benefits to the environment, health, and economy. Morgenstern et al. [
14] found that the policy of phasing out small boilers in central Taiyuan, China, has brought significant carbon emission reduction benefits (about 50% to 95% reduction). Xu and Masui [
15] found that introducing SO
2 control policies in China can achieve supplementary carbon emission reduction benefits. Chae [
16] found that switching to low-sulfur fuels can achieve air quality improvement and carbon dioxide emission reduction targets at the lowest cost. Agee et al. [
17] found that there is a considerable combination of SO
2, NOx and CO
2, and disregarding this commonality will increase the cost of pollution control. Cao et al. [
18] found that China’s SO
2 control policy in the Tenth Five-Year Plan not only avoided huge damage to public health, but also brought considerable net benefits to GDP.
Policies to mitigate climate change will also bring additional environmental benefits. Schwanitz et al. [
19] analyzed the common benefits of mitigating climate change and supporting non-climate goals. Burtraw et al. [
20] also found that actions to slow down the accumulation of greenhouse gases in the atmosphere will also reduce traditional air pollutants, which often produce auxiliary benefits locally and in the short term. Nam et al. [
21] assessed the potential synergy between pollution and climate control in China and the United States, and found that the control of SO
2 and NOx emissions would lead to a corresponding reduction in carbon emissions, which was summarized as the cross-elasticity of emissions control. Nemet et al. found that the estimated value of the co-benefits of air quality brought about by climate change mitigation ranged from US
$2 to US
$196 per ton of carbon dioxide, with an average value of USD 49 per ton of carbon dioxide. The co-benefits of developing countries are the highest [
22]. Cao et al. [
18] found that a moderate carbon tax can not only significantly reduce carbon dioxide emissions, but also reduce local air pollution more than expected during the “Eleventh Five-Year Plan” period. The health benefits of a carbon tax alone are equivalent to 0.2% of GDP, which exceeds the reduction in GDP.
Existing studies have explored the environmental, economic, and health effects of climate change control policies and air pollution control policies, as well as the common benefits of the two, but still have the following shortcomings: (1) Although the CGE-based general equilibrium model can quantify the environmental and health effects of a policy, it still does not accurately calculate the size of the synergistic emission reduction effect of a policy. (2) Research on the synergistic effects of climate change control policies on air pollution often only focuses on the environmental benefits of a certain pollutant, but lacks a comprehensive measurement of SO2, NOx, DS and other pollutants. (3) There is a lack of empirical research on the path of coordinated control of air pollution reduction caused by climate change control policies.
3. Methodology
3.1. Theoretical Basis
The synergy effect first appeared in the third assessment report issued by the Intergovernmental Panel on Climate Change (IPCC) in 2001, and its meaning is the social and economic benefits of policies and actions to mitigate greenhouse gas emissions.
Kaya (1989) [
23] put forward the identity equation for studying the influencing factors of carbon emissions and has been widely used. The initial form is as follows:
Among them, i is the type of energy, ICE is the total industrial CO2 emissions, E is the total primary energy consumption, Y is the gross domestic product, and P is the population factor.
However, as the possible influencing factors are continuously explored, the research perspective is constantly updated. Based on in-depth exploration, this article expands the classic Kaya identity and adds a variable—comprehensive air pollution. Because a single type of air pollutant cannot comprehensively measure the emissions of industrial air pollutants, the main indicators for measuring industrial air pollution in this article are SO
2, NOx, dust and smoke. Considering the respective limitations of each pollutant, this article reduces the dimensions of these indicators to obtain a comprehensive pollutant emission indicator, to make an objective and comprehensive evaluation of air pollution as far as possible. This paper draws on the method of Liu et al. [
24] and combines the principal component analysis to obtain the weight of each pollutant index, and finally calculates the comprehensive air pollution index. The calculation formula is as follows:
where,
is the weight of each pollutant,
is the pollutant component.
This article has been expanded on the basis of Kaya identities and added the synergistic effect of CO
2 emissions on comprehensive air pollutants, as shown below:
In the above formula, j represents different types of energy, k represents different regions, ICAP represents industrial comprehensive air pollutant emissions, ICE represents industrial CO2 emissions, E is physical energy consumption, Y is regional GDP, P is the population size. stands for , which is the comprehensive air pollution caused by unit industrial CO2 emissions. This is also the subject of this study, the quantitative relationship between industrial carbon emissions and industrial comprehensive air pollution emissions. represents , which is the CO2 emission factor of various energy sources, and this part is a constant. stands for , which is the energy structure. Since hydropower, wind power and other power generation methods rarely produce carbon emissions, carbon emissions are mainly generated by thermal power generation. The proportion of coal and oil consumption in thermal power generation remains between 85% and 90% throughout the year, with little fluctuation, so the energy structure effect can be ignored. stands for , which is energy consumption per unit of GDP, which is used to measure energy efficiency. stands for , which is GDP per capita, which is used to measure economic development.
This article refers to Ang [
25] to perform the full differential processing of Equation (3), as shown below:
Among them,
δ is a constant, so it is zero after partial differentiation, and the second part on the right side of Equation (3) is zero. Referring to Hou and Shi [
26] on the factor decomposition principle of CO
2 emissions in the energy and power industry, this paper uses Equation (4) to calculate the definite integral within the time interval [
T,
T +
t], and we can get:
The meaning of Equation (5) is to sum up the changes in air pollutant emissions caused by the synergy effect, energy structure effect, energy efficiency effect, economic development effect, and population effect to obtain the total change in air pollutant emissions. Using the logarithmic average weight addition decomposition method, we can get:
Equation (6) classifies the influencing factors of air pollutant emissions, corresponding to the five effects of Equation (5).
3.2. Model Setting
Based on the above factor decomposition process, industrial comprehensive air pollution reduction (ICAPR) and industrial carbon reduction (ICR) can be expressed as shown in Equations (7) and (8):
Considering the energy rebound effect: The U-shaped relationship between economic output and energy consumption, and the EKC curve: the relationship between environmental pollution and per capita income is an inverted U-shaped curve. Therefore, the benchmark regression model of this article is set as follows:
In Equation (9), k represents different regions, t represents time, and m is the number of control variables. and respectively represent the industrial comprehensive air pollution reduction (ICAPR) and industrial carbon emission reduction (ICR) in the k region during the t period. , and respectively represent regional GDP per capita, power industry energy efficiency and population density. are other control variables, and represent the fixed effects of time and individual respectively, is a random error term, is a constant term.
The analysis of the conduction path of the synergistic emission reduction effect mainly discusses the interaction of the related factors between air pollutant emissions and greenhouse gas emissions. Due to the interaction between the related factors, the synergistic effect is conducted. The envisaged transmission path is as follows: the greenhouse gas is the starting point of the path, and other economic, social, and technological factors are used as variables that exert influence. This paper uses an econometric model to quantify the impact of these variables on industrial comprehensive air pollutant emissions reduction through industrial CO
2 emissions reductions, that is, the synergistic effect between carbon emissions reduction and comprehensive air pollutants. Based on model (9), by adding interaction terms between related explanatory variables and industrial CO
2 emission reductions, to illustrate the conduction path of industrial CO
2 emission reduction activities on air pollution emission reduction, the model design is as follows:
The relevant variables in the formula are energy structure (ES), R&D expenditure (RDE), and environmental regulation (ER).
3.3. Variables and Data
The explained variable in this article is the industrial comprehensive air pollution reduction (ICAPR). To comprehensively measure the impact of industrial air pollution emissions SO
2, NOx, and DS, this article draws on the method of Liu et al. [
24]. Firstly, the dimensionality reduction of the indicators is performed, and the weight of each relevant indicator is calculated through the factor score matrix and the variance contribution rate of the common factor, and finally these 3 indicators are integrated into an indicator—industrial comprehensive air pollution:
In Equation (11), k is the type of pollutant. w is the weight of the corresponding pollutant, and X is the corresponding air pollutant emission.
The explanatory variable of this article is industrial carbon reduction (ICR). This article adopts the mainstream IPCC accounting method. However, because it is difficult to obtain industrial carbon emissions data by region, this article uses the weighting method to measure the carbon emissions of each province. The specific calculation methods of industrial carbon emission reductions in various provinces are as follows:
where
k represents nine different energy sources, including: coal, coke, crude oil, gasoline, kerosene, diesel, fuel oil, natural gas, and electricity.
represents the national total consumption of
k types of energy during the
t period.
represents the national industrial consumption of
k types of energy during the
t period.
represents the total consumption of
k types of energy in the region
i in the period
t.
represents the carbon emission coefficient of
k types of energy.
Based on previous studies, this article selects the following variables that affect air pollution and carbon emission:
RDE. R&D expenditures in the energy and power industry. The investment in research and development is still one of the most important ways to reduce carbon emissions [
27]. China’s power industry plays an important role in reducing carbon dioxide (CO
2) and air pollutant emissions [
28]. Therefore, this paper selects the R&D expenditure in the power industry as one of the expansion paths of the synergistic emission reduction effect.
Energy structure (ES). Li et al. found that the proportion of clean energy consumption restrained the emission of air pollutants, and the proportion of fossil energy was positively correlated with the emission of air pollutants [
29]. The development of clean energy has greatly reduced regional haze pollution [
30]. Therefore, this paper selects the proportion of clean energy in industrial energy consumption as the energy structure variable.
Environmental Regulation (ER). There are many indicators for measuring the intensity of environmental regulations. This article refers to Zhu et al. [
31], and chooses the number of environmental punishment cases as a substitute variable for the intensity of environmental regulation.
GDP per capita (PGDP). Environmental pollution will change with the growth of per capita GDP, and the increase of per capita GDP will reduce the environmental impact to a certain level [
32].
Energy Efficiency (EE). The energy efficiency in this paper is defined as the industrial output value per ton of standard coal energy consumption.
The proportion of urban population (PUP) and population density (PD). The former is calculated by the proportion of urban population in the total population of the region, as a representative variable to measure the level of urbanization. The latter is calculated by the ratio of the total population of the region to the land area.
Temperature (TEM). Temperature is used as a natural factor index. The average temperature of each region is adopted in this paper. Since the annual average temperature of each province is difficult to obtain, this paper selects the average temperature of major cities in each province as the representative of the province.
The data selected in this article are panel data from 2008 to 2014 in 30 Chinese provinces except Hong Kong, Macau, Taiwan and Tibet Autonomous Region. See
Table 1 for data sources and descriptions of related variables.


