Article

Evaluation and Dynamic Evolution of Eco-Efficiency of Resource-Based Cities—A Case Study of Typical Resource-Based Cities in China

1
College of Public Administration, Nanjing Agricultural University, Nanjing 210095, China
2
Business School, Jiangsu Normal University, Xuzhou 221116, China
*
Authors to whom correspondence should be addressed.
Sustainability 2021, 13(12), 6802; https://doi.org/10.3390/su13126802
Submission received: 8 May 2021 / Revised: 7 June 2021 / Accepted: 9 June 2021 / Published: 16 June 2021

Abstract

:
Evaluation and dynamic evolution of eco-efficiency of resource-based cities is of great significance for ecological restoration, industrial transformation and sustainable development of resource-based cities. Based on the data of 40 resource-based cities from 2012 to 2017, we first study eco-efficiency of resource-based cities from both static and dynamic aspects by super-efficiency DEA and the Malmquist index. Additionally, then, we analyze its dynamic evolution trend by Kernel density estimation. The main results are as follows: First, the eco-efficiency shows a steady growth trend; growing cities are the highest, followed by regenerative cities and mature cities, declining cities are the lowest. Second, technological progress has the greatest contribution to growth of eco-efficiency, and scale efficiency restricts its growth. Third, efficiency distribution of resource-based cities with different life cycles show different characteristics of evolution, and the regional gap is narrowing gradually. Finally, management implications are put forward based on the empirical conclusions.

1. Introduction

A resource-based city is developed with the exploitation of rich natural resources, and it is a special type of city that takes development and utilization of resources as the leading industry to support economic development of the whole city [1]. Most natural resources mentioned are mineral resources, including forest resources. The resource industry includes not only development of mineral resources, but also primary processing of mineral resources, such as iron and steel industry and non-ferrous metallurgical industry [2]. As a supplier of basic energy and industrial raw materials, resource-based cities have made great contributions to economic development in China. In the process of sustainable development of resource-based cities, eco-environmental protection is not only a guarantee, a carrier, further a restricting factor for sustainable development of resource-based cities. However, due to long-term predatory and extensive development, resource-based cities are seriously inadequate in the treatment and protection of the eco-environment, and are faced with severe eco-environmental problems, such as resource depletion, land desertification, deforestation, air pollution, etc. [3]. It seriously hinders sustainable development of resource-based cities. How to protect eco-environment while promoting sustainable development of resource-based cities has become an urgent problem to be solved. Eco-efficiency is an appropriate measure for resource-based cities to change the mode of economic development [4].
Environmental policy plays an important role in protection of eco-environment. For example, China emphasizes the necessity of protecting and improving the eco-environment with unprecedented determination and efforts in the 19th CPC National Congress and 2021 government work report. The Kitakyushu area of Japan has effectively alleviated eco-environmental problems through the development of environmental industry. Resource-based cities in the United States promote the development and reuse of polluted areas by considering environmental and economic benefits. The Ruhr Industrial Zone in Germany implements ecological restoration and protection in mining areas to improve the attractiveness of environment to foreign investment. With the exploitation of resources for a long time, resource-based cities are generally faced with serious problems such as environmental pollution and ecological destruction. Many resource-based and industrialized countries pay more attention to eco-environmental protection of resource-based cities. The evaluation of eco-efficiency is of great significance for ecological restoration, industrial transformation and enhancing the ability of sustainable development of resource-based cities [5].
This study makes an in-depth discussion on eco-efficiency and dynamic evolution of 40 resource-based cities in China, and divides resource-based cities into stages according to resource development cycle to further reveal the stage differences of dynamic evolution of eco-efficiency and achieve theoretical and practical innovation to a certain extent. Firstly, from the research perspective, existing research on eco-efficiency mostly focuses on specific cities, industries and enterprises, but lack measurement and comparative analysis of eco-efficiency of resource-based cities. Therefore, this study uses calculation and dynamic evolution analysis of eco-efficiency of resource-based cities by constructing an evaluation index system. Secondly, in terms of research methods, existing studies mainly use data envelopment analysis (DEA), emergy analysis and fuzzy integrated evaluation to evaluate eco-efficiency, among which results measured by ordinary DEA method have some deficiencies because they are easy to be affected by special points. Therefore, this study uses super-efficiency DEA to evaluate eco-efficiency. Compared with the ordinary DEA method, super-efficiency DEA considers the impact of random factors on the output and can clearly calculate efficiency of each decision unit in the sample value, which better reflects eco-efficiency of resource-based cities. Thirdly, in terms of research content, existing studies lack a classification analysis for resource-based cities with different life cycles. This study divides resource-based cities into growing cities, mature cities, declining cities and regenerative cities, and analyzes dynamic evolution law of eco-efficiency of resource-based cities, so as to provide some reference for sustainable development of resource-based cities.
The rest of this study is organized as follows: Section 2 combs the literature. Section 3 expounds the basic model. Section 4 is empirical analysis. Section 5 is discussions. Section 6 concludes the study.

2. Literature Review

Eco-efficiency is the ratio of socio-economic output to environmental impact [6]. The concept of eco-efficiency was first put forward by Xiao and Sturm in 1990, that is, the ratio of value output increment to environmental impact increment [7]. Since then, scholars continue to define concept of eco-efficiency. Among them, the concept of the World Commission on Industry and Commerce for Sustainable Development is widely recognized, that is, “eco-efficiency” refers to the provision of products and services with price competitive advantages that can meet human needs and improve the quality of life, while gradually reducing ecological impact and resource intensity of the whole life cycle to a level consistent with carrying capacity of the earth, and at the same time achieve the goal of coordinated development of environment and society [8]. Although there is no unified definition of eco-efficiency in academic circles, the core idea is to achieve the maximum economic output with the least resource consumption and environmental pollution [9]. As sustainable development has become the mainstream direction of world economic development, “eco-efficiency” has gradually become focus of scholars and managers all over the world.
Urban eco-efficiency reflects overall coordination among various elements of a city, including allocation level of urban resources, energy, management, operation, infrastructure and reasonable degree of management, which is the embodiment of comprehensive state of cities [10]. Scholars have made abundant research achievements on eco-efficiency evaluation, which provides theoretical support and reference for study of eco-efficiency in resource-based cities. These studies mainly discuss evaluation of eco-efficiency from the perspectives of industry [11] and region [12]. At present, studies on industrial eco-efficiency are mainly focused on mining industry [13], industry [14], agriculture and animal husbandry [15], tourism [16], construction industry [17], higher education [18], etc. Liu et al. [19] and Yin et al. [20] used DEA model to measure eco-efficiency of the forestry industry and a mineral resources city. Lin et al. [21] used super-efficiency DEA model to evaluate eco-efficiency of tourism industry in Jiangxi province. Ren [22] measured agro-ecological efficiency of Lanxi urban agglomeration. Studies on regional eco-efficiency mainly focus on national, regional, provincial and municipal levels, county areas, ecological industries and industrial parks [23,24,25]. Camarero et al. [26] used DEA model to assess the convergence in eco-efficiency of a group of 22 OECD countries. Koskela [27] used expert evaluation method to measure eco-efficiency of Finnish forest industry.
Studies on eco-efficiency of resource-based cities are mainly carried out from following perspectives. Firstly, to explore eco-efficiency of different resource types. Li et al. [28] used factor analysis to measure eco-efficiency of 16 resource-based cities in China. It was found that eco-efficiency of resource-based cities decreases gradually in the order of coal, metal, comprehensive and oil. Xu et al. [29] used super-efficiency DEA to calculate eco-efficiency of coal resource-based cities. The results showed that eco-efficiency of coal resource-based cities shows a steady growth trend; eco-efficiency in the eastern region is significantly higher than that in the central and western regions. Wang et al. [30] used grey correlation model to evaluate eco-efficiency of industrial coupling symbiosis network in oil and gas resource-based cities. Secondly, to explore eco-efficiency of resource-based cities with different life cycles. Yin et al. [31] used super-efficient SBM-Malmquist to explore eco-efficiency of renewable resource-based cities from three dimensions of location, scale and type. It was found that eco-efficiency of renewable resource-based cities is generally high and shows a fluctuating upward trend during the study period, and differences of eco-efficiency among different cities tend to decrease. Thirdly, to explore eco-efficiency of resource-based cities as a whole. Chen et al. [32] calculated eco-efficiency of 32 resource-based cities by super-efficiency DEA. The results showed that overall eco-efficiency of resource-based cities fluctuates little and shows a trend of rapid growth in the near future, and there is a large difference in eco-efficiency between regions, which is much higher in the west than that in the central and eastern cities. Technological progress is the main reason to promote growth of eco-efficiency, and scale efficiency restricts growth of eco-efficiency. Huang et al. [33] evaluated eco-efficiency of resource-based cities in China based on emergy ecological footprint method. It was found that, compared with livable cities, eco-efficiency of resource-based cities is low, and the type of resources and size of cities have a greater impact on eco-efficiency.
Through sorting out and summarizing relevant literature, it is found that scholars have been paying close attention to the study of eco-efficiency, and research results are relatively rich, but there are still following limitations: (1) The existing studies mainly focus on following three levels of enterprises, industries and regions, while studies on eco-efficiency of resource-based cities are relatively few, and research objects are only focused on a certain type of resource-based cities; (2) studies on eco-efficiency are mainly based on efficiency evaluation and influencing factors, and few scholars analyze dynamic evolution characteristics of eco-efficiency; and (3) the main research methods of eco-efficiency are economic-environmental ratio evaluation method, eco-efficiency index evaluation analysis method [34], material flow analysis method (SFA), ecological footprint method (EF), parameter analysis method and data envelopment analysis method (DEA) [35,36]. However, there are few studies on evaluation of eco-efficiency by using super-efficiency DEA. All these provide a good theoretical and empirical reference for this study.

3. Data and Methodology

3.1. Model and Method

3.1.1. Super Efficiency DEA

Data envelopment analysis (DEA) is a method proposed by Charnes and Cooper, which is used to evaluate relative effectiveness of different decision-making units [37]. The core idea of DEA to evaluate eco-efficiency of resource-based cities is that the higher measured overall efficiency is, the higher eco-efficiency is, the better eco-environment is. There are many methods to measure eco-efficiency in the existing literature, and specific contents are shown in Table 1. In contrast, the DEA method cannot only solve the problems of multi-input, single-output, multi-input and multi-output, but also use mathematical linear programming model to judge whether decision-making unit is on the effective frontier or not, and obtain corresponding efficiency of each decision-making unit. However, results calculated by ordinary DEA method cannot deal with the case that multiple efficiency values are equal to 1 and cannot carry out effective ranking and analysis. The super-efficiency DEA model takes into account the problem of factor relaxation, which is a relatively comprehensive efficiency evaluation model. The super-efficiency DEA includes pollutant index and economic index, which can correctly calculate eco-efficiency of the decision-making system. The eco-efficiency emphasizes unity of economic value and environmental benefits and uses the minimum resource consumption for the maximum economic benefits, which is consistent with input and output in super-efficient DEA [38]. Therefore, super-efficiency DEA has been widely used in the study of eco-efficiency. The mathematical expression of super-efficiency DEA is shown in Equation (1):
M i n θ s . t . { i = 1 j 1 n X j λ j + S = θ X 0 i = 1 j 1 n X j λ j S + = Y 0 λ j 0 ,   j = 1 , 2 , , k , , n S 0 , S + 0
In Equation (1), θ refers to super-efficiency value of decision-making unit; X and Y refer to input variables and output variables, respectively; S and S + refer to relaxation variables and residual variables, respectively; λ represents proportion of combinations in the effective decision making unit DMU( λ < 1 means increasing economies of scale; λ = 1 means that economies of scale remain unchanged; λ > 1 means diminishing economies of scale.); when θ < 1, if S 0 or S + 0 , it indicates that decision unit has not reached the optimal efficiency, and there is still room for improvement; and when θ 1 , if S 0 and S + 0 , it indicates that input-output of decision-making unit has reached the optimal efficiency.

3.1.2. Malmquist Index

It needs to be clear that super-efficiency DEA model mentioned above cannot directly observe dynamic changes of eco-efficiency of resource-based cities, but only compare relative efficiency values between the DMU of decision-making units in the group. Therefore, in order to decompose eco-efficiency of resource-based cities and analyze dynamic image mechanism, it is necessary to introduce Malmquist index model. The Malmquist index means that in a specific period, when production technology does not change, the decision-making unit DMU of multiple input and output variables, it uses ratio of distance function to measure the changing relationship between input and output. The mathematical expression of Malmquist index is shown in Equation (2):
T F P = [ D t ( x t + 1 , y t + 1 ) D t ( x t , y t ) × D t + 1 ( x t + 1 , y t + 1 ) D t + 1 ( x t , y t ) ] 1 2
In Equation (2), if T F P < 1 , it means that total factor productivity in period t + 1 is lower than that in period t, on the contrary, total factor productivity is increased. Total factor productivity (TFP) = Technical progress index (TC) × Comprehensive technical efficiency change index (EC), Comprehensive technical efficiency change index (EC) = pure technical efficiency change index (PE) × scale efficiency change index (SE). For mathematical expressions, see Equations (3) and (4):
T F P = D t + 1 ( x t + 1 , y t + 1 ) D t ( x t , y t ) × [ D t + 1 ( x t + 1 , y t + 1 ) D t + 1 ( x t , y t ) × D t ( x t + 1 , y t + 1 ) D t ( x t , y t ) ] 1 2 = E C × T C
T F P = D v t + 1 ( x t + 1 , y t + 1 ) D v t ( x t , y t ) × [ D v t ( x t , y t ) D v t + 1 ( x t + 1 , y t + 1 ) × D c t + 1 ( x t + 1 , y t + 1 ) D c t + 1 ( x t , y t ) ] × [ D c t ( x t , y t ) D c t + 1 ( x t , y t ) × D c t ( x t + 1 , y t + 1 ) D c t + 1 ( x t + 1 , y t + 1 ) ] 1 2 = P E × S E × T C
That is, T F P = E C × T C = P E × S E × T C .
In Equations (3) and (4), EC indicates degree to which technical efficiency contributes to total factor productivity; PE indicates the impact of level of production management on productivity ( P E < 1 means lower efficiency, on the contrary, it means improvement); SE indicates efficiency change brought by change in scale reward ( S E < 1 means that optimal scale is not reached, otherwise it is close to the optimal scale); and TC indicates the degree of change in production technology ( T C < 1 indicates a decline in production technology, on the contrary, it means improvement).

3.1.3. Kernel Density Estimation

Kernel density estimation is a common non-parametric density estimation method, which does not need to set a model in advance and can be used to describe distribution pattern of random variables [39]. It is an important tool to show dynamic evolution trend of random variables. Therefore, this study uses Kernel density estimation method to describe dynamic evolution trend of eco-efficiency of 40 resource-based cities in China from 2012 to 2017. Now, it is assumed that eco-efficiency of resource-based cities is x, and its density function is f(x), then probability density of point x is given by Equation (5):
f ( x ) = 1 n h i = 1 n K [ X i x h ]
In the above equation, n represents total number of samples, h represents bandwidth, K[x] is a Kernel density function and X i is an independent and identically distributed sample observation. When using Kernel density estimation method to estimate dynamic evolution of eco-efficiency of resource-based cities, it is necessary to select appropriate bandwidth and kernel function, the smaller bandwidth is, the less smooth density function curve is, but it can improve estimation accuracy; the greater bandwidth is, the smoother density function curve is, but it will reduce estimation accuracy [40]. This study uses data-based automatic bandwidth, see Equation (6):
h = 0.9 n 1 5 × m i n { s , ( Q 3 4 Q 1 4 ) ÷ 1.34 }
where Q 3 and Q 1 represent upper quartile and lower quartile, respectively. Q 3 / 4 Q 1 / 4 represents quartile interval, and s represents sample standard deviation.
There are usually four types of Kernel density functions: Gaussian kernel function, trigonometric kernel function, quadrangular kernel function and Epanechnikov kernel function. The selection is based on the density of packet data. Among them, Gaussian kernel function can provide intuitive and dynamic distribution map to identify law of difference, and can better reflect distribution location, shape and extensibility [41] of eco-efficiency of resource-based cities. Empirical research shows that the less packet data is used, the more likely it is to choose Gaussian kernel function [42]. Therefore, in this study, Gaussian kernel function is selected to estimate dynamic evolution of eco-efficiency of resource-based cities in China. The specific Equation (7) is as follows:
K [ x ] = 1 2 π e 1 2 x
As nonparametric estimation has no definite function expression, it is usually used to investigate its distribution change by means of graph comparison. Specifically, the graph of Kernel density estimation result is made and observed, to obtain the location, shape and other information of variable distribution [43].

3.2. Research Indicators and Data Sources

The basic idea of eco-efficiency is the least input and the maximum output, that is, the maximum economic benefit with the least environmental resources, which is in line with evaluation principle of super-efficiency DEA [44]. The evaluation of eco-efficiency of resource-based cities refers to how much economic output is under certain resource input and environmental input, or how much resource and environmental input is under premise of certain economic output. The existing studies mainly use environmental pollution and resource consumption as input indicators, and economic aggregate as output indicators to build eco-efficiency evaluation index system of resource-based cities, but due to different research objects, there are some differences in the selection of specific variables [45]. Yang et al. [25] and Chen et al. [32] used wastewater discharge, waste gas discharge and solid waste discharge to reflect environmental pollution, used water resources, electricity consumption and manpower consumption to reflect resource consumption, and used urban GDP to reflect economic aggregate. On this basis, Xu et al. [29] increased energy consumption and land resource consumption in terms of resource consumption, which makes the index system more perfect.
This study draws lessons from eco-efficiency index of German environmental and economic accounting [46]. There are six indicators of eco-efficiency designed in German environmental and economic accounting. The environmental pollution in the index system corresponds to resource consumption, and indicators of wastewater discharge, exhaust gas discharge and solid discharge selected by environmental pollution are also corresponding to land, water, electricity, manpower and energy consumption selected by resource consumption. By combing relevant literature [47,48], eco-efficiency of resource-based cities requires us to reduce environmental consumption while considering economic benefits, that is, to exchange the minimum consumption of eco-environmental pollution for the maximum social and economic benefits. In the analysis process of super-efficiency DEA model, we usually use income index to measure output index system and use cost index to measure input index system. Therefore, based on construction principles of the index system, this study chooses resource consumption and environmental pollution as input index and total economic output as output index to construct evaluation index system of eco-efficiency of resource-based cities.
The evaluation index system of eco-efficiency of resource-based cities is constructed from three aspects: resource input, environmental input and economic output. In terms of resource consumption, consider consumption of land, water, electricity, manpower and energy, including land utilization ratio, total urban water consumption, total electricity consumption of the whole society, number of employees at the end of the year and unit GDP energy consumption. In terms of environmental pollution, in accordance with requirements of the national total control target for energy saving and emission reduction, use industrial wastewater discharge density and chemical oxygen demand discharge to reflect wastewater discharge, use industrial sulfur dioxide emission and industrial smoke (dust) discharge to reflect waste gas discharge, use comprehensive utilization rate of industrial solid waste and harmless treatment rate of domestic waste to reflect solid discharge. In terms of total economic output, urban GDP is used as the indicator of economic output. See Table 2.
The classification of resource-based cities is based on evaluation of resource guarantee ability and sustainable development ability [49]. First of all, two evaluation index values of resource guarantee ability and sustainable development ability are measured according to different calculation index system, and then two-dimensional combination analysis is carried out by using cluster analysis method according to two evaluation index values [50]. Resource-based cities are divided into four categories: growing cities, mature cities, declining cities and regenerative cities. The resource development of growing cities is in the rising stage, with great potential for resource security and sufficient stamina for economic and social development, which is the supply and reserve base of energy resources in China. The development of mature cities is in a stable stage, with strong resource security capacity and a high level of economic and social development, which is the core area for security of energy resources in China at the present stage. The declining cities tend to be depleted of resources, economic development lags behind, people’s livelihood problems are prominent and pressure of eco-environment is great, which are the key and difficult areas to speed up the transformation of mode of economic development. The regenerative cities have basically got rid of dependence on resources, and economy and society have begun to step into track of benign development, which is the leading area for resource-based cities to change mode of economic development.
Resource-based cities are abundant in variety and quantity in China. How to select empirical samples for both development stage and city type becomes the key to evaluation. With regard to selection of sample cities, based on “National Resource-based City Sustainable Development Plan (2013–2020)”, considering completeness and representativeness of data in resource-based cities, 40 resource-based cities are selected as research object. Including growing cities (5), mature cities (18), declining cities (11), regenerative cities (6), covering all types of resource-based cities, namely coal resource-based cities (15), petroleum resource-based cities (8), metallurgical resource-based cities (6), forestry resource-based cities (3) and comprehensive resource-based cities (2). The total amount of sample cities can reflect overall situation of eco-efficiency of resource-based cities in different life cycle (see Table 3). This study selects data of 40 resource-based cities in China from 2012 to 2017. The data are mainly derived from 2013–2018 China city statistical yearbook, statistical yearbooks of provinces and cities, statistical bulletins and environmental quality bulletins.

4. Results

4.1. Static Evaluation of Eco-Efficiency of Resource-Based Cities Based on Super-Efficiency DEA

This study calculates super-efficiency values of resource-based cities year by year based on super-efficiency DEA (see Table 4). By calculating mean of eco-efficiency in each city for 6 years and drawing lessons from division of it in Tapio [51], Vehmas [52] and Yang et al. [53], this study illustrates the impact of economic growth on resources and environment. Forty resource-based cities are divided into four levels by natural fracture method, and the division standard of each level is based on eco-efficiency range: level 1 (below 0.6), level 2 (0.6, 0.9), level 3 (0.9, 1) and level 4 (more than 1). According to the standard, it is divided into superior eco-cities, good eco-cities, medium eco-cities and poor eco-cities, to explore relationship between eco-efficiency and urban economic development of resource-based cities. The classification of each city is shown in Table 5.
From the perspective of resource-based cities as a whole, the average eco-efficiency of 40 resource-based cities is at the level of 0.505 and 0.730 from 2012 to 2017, showing a steady upward trend. The eco-efficiency of resource-based cities exceeded the average level of 0.629 in the past six years in 2014, indicating that since the 19th CPC National Congress stressed the need to improve system and mechanism of resource conservation and eco-environment protection, resource-based cities have made great efforts in eco-environmental protection and achieved good results.
From the perspective of life cycle classification, the average eco-efficiency values of growing cities, mature cities, declining cities and regenerative cities are 0.832, 0.626, 0.460 and 0.779, respectively. The eco-efficiency of growing cities is the highest, followed by regenerative cities and mature cities, and declining cities are the lowest. Growing cities are in the early stage of development, which can balance relationship between economic development and eco-environment and have achieved remarkable results in eco-environment management. The eco-efficiency of mature cities is at a medium level, which indicates that mature cities have gradually formed their own development characteristics after being honed in the growing period. The eco-efficiency of declining cities is basically less than 0.5, the reason is that most resource-based cities follow the concept of “pollution first and then treatment”, blindly pursue urban economic development and adopt extensive methods of resource exploitation. It has caused great damage to the eco-environment, so speeding up structural adjustment, developing new high-end industries and establishing an ecological industrial system are the road to development of declining cities. The average eco-efficiency value of regenerative cities is 0.779, second only to growing cities, which is 0.832. It can be seen that after learning from the recession period, regenerative cities have gradually realized that urban transformation and development must pay attention to eco-environment protection.
According to classification of eco-efficiency of the 40 cities, there are 6 cities located in the fourth level, that is, superior eco-cities, accounting for 15% of the total sample cities; there are 4 cities located in the third level, that is, good eco-cities, accounting for 10% of the total sample cities; there are 8 cities located in the second level, that is, medium eco-cities, accounting for 20% of the total sample cities; and there are 22 cities located in the first level, that is poor eco-cities, accounting for 55% of the total sample cities. It is worth noting that among the 22 poor eco-cities, there are 8 resource-based cities in the recession period, accounting for 72.7% of the total declining cities. Therefore, for declining cities, it is a top priority to explore the path suitable for urban transformation and development.
Remark 1.
The eco-efficiency of resource-based cities shows a steady upward trend. Specifically, it is the highest in growing cities, followed by regenerative cities and mature cities, and declining cities are the lowest.

4.2. Dynamic Decomposition of Total Factor Eco-Efficiency of Resource-Based Cities Based on Malmquist Index

The study uses DEAP 2.1 to calculate Malmquist index and its decomposition of 40 resource-based cities from 2012 to 2017. The results are shown in Table 6. The TFP value of the total factor eco-efficiency growth rate of 40 sample cities is generally greater than 1 from 2012 to 2017, with an average annual growth rate of 5.3%. It reflects the dynamic growth trend of overall eco-efficiency of resource-based cities. From the perspective of cities, cities with the highest eco-efficiency are Puyang, Daqing, Jiaozuo, Baiyin and Yichun. There are 12 cities whose eco-efficiency is less than 1, among which Jincheng has the lowest annual growth value, and its comprehensive technical efficiency is only 0.753, which is the most important factor leading to decrease of TFP value. From the dynamic decomposition of total factor productivity, the annual growth rates of technological progress index and pure technical efficiency index show an increasing trend, increasing by 7.8% and 0.2%, respectively. It can be seen that from 2012 to 2017, technological progress is the main factor to promote growth of eco-efficiency of resource-based cities.
From the perspective of the life cycle, cities with TFP values greater than 1 are mature cities, declining cities and regenerative cities, indicating that resource-based cities with different life cycles pay more attention to urban eco-environmental protection. Among them, declining cities have the highest TFP value, and the average annual growth rate of total factor eco-efficiency is 11%, which is higher than 4.2% in mature cities and 9.5% in regenerative cities. It can be seen that while seeking transformation and development, declining cities pay more attention to urban development and eco-environment protection, while growing cities have just sprung up, their economic development is relatively slow, and their awareness of eco-environment protection is still shallow, so the TFP value is negative. The values of comprehensive technical efficiency, technological progress index, pure technical efficiency and scale efficiency of regenerative cities are all greater than 1, which shows that regenerative cities have gradually realized the importance of eco-environment for urban transformation and development after the period of maturity and decline, and actively look for alternative industries and carry out transformation and upgrading of traditional industries, which has formed a good development trend. However, only technological progress index and pure technology efficiency of growth cities, mature cities, and decline cities are greater than 1, and others are less than 1. This fully illustrates that resource-based cities pay more attention to economic development, failing to properly handle relationship between environmental protection and resource consumption.
From the perspective of technological progress indexes, there are 14 cities with a growth rate of more than 10%, including 1 growing city (Songyuan), 7 mature cities (Jixi, Hebi, Dongying, Daqing, Jinchang, Heihe, Mudanjiang), 4 declining cities (Hegang, Liyang, Baishan, Yichun) and 2 regenerative cities (Jiaozuo, Tangshan), which shows that mature cities have become more mature in the development of urban science and technology after experiencing the period of growth. After experiencing the period of growth and maturity, declining cities and regenerative cities have gradually realized the importance of eco-environment to economic development of cities and strived to seek technological progress to solve ecological crisis. There are eight resource-based cities with negative growth rate (Liupanshui, Yulin, Shizuishan, Hezhou, Linfen, Jincheng, Handan and Lijiang), of which three cities are growing cities (Hezhou, Liupanshui and Yulin), because growing cities are still in the stage of exploration and development, lack of development experience and relatively backward technical level, which have become the main reasons that hinder urban development. It is worth noting that resource-based cities with negative growth rates are mainly distributed in the western and central regions of China. Limited by the level of economic development, slow development of science and technology and insufficient policy support, these areas suffer from low eco-efficiency.
From the perspective of pure technical efficiency indexes, there are 11 cities with pure technical efficiency values greater than 1, including 5 mature cities, 3 declining cities, and 3 regenerative cities. There are six cities with pure technical efficiency values less than 1, including five mature cities and one declining city. There are 23 cities with pure technical efficiency values equal to 1, including 5 growing cities, 8 mature cities, 7 declining cities and 3 regenerative cities. The pure technical efficiency values of growing cities are all equal to 1, and that of regenerative cities are all greater than or equal to 1, which indicates that the level of production management of resource-based cities is relatively high in these two stages. However, in mature and declining cities, there are some cities whose pure technical efficiency is less than 1, indicating that the cities still need to strengthen their own organization and management level in these two stages. It is worth noting that four cities of mature cities with pure technology less than 1 are coal resource-based cities. It can be seen that mature coal cities pay too much attention to their own development while neglecting eco-environment protection.
From the perspective of scale efficiency indexes, there are 16 cities with a scale efficiency value of less than 1 (including 1 growing city, 7 mature cities, 5 declining cities and 3 regenerative cities), accounting for 40% of selected sample cities. There are 24 cities with scale efficiency values greater than (or equal to 1) (including 4 growing cities, 11 mature cities, 6 declining cities and 3 regenerative cities), accounting for 60% of selected sample cities. Therefore, for about 40% of resource-based cities, the scale efficiency index will inhibit improvement of eco-efficiency. Under the circumstance that overall scale efficiency value is low, the scale efficiency value of eco-environment of growing cities is basically greater than (or equal to) 1, indicating that growing cities attach more importance to industrial production scale at the initial stage of development and are better than cities at other stages in terms of production factors and scale matching.
Remark 2.
Remark 2. The TFP value of mature city, declining city and regenerative city is more than 1, and that of growing city is less than 1. Technological progress is the main factor to promote the increase of eco-efficiency in resource-based cities.
Figure 1 shows the trend of TFP of 40 resource-based cities over time. The TFP of eco-environment in resource-based cities presents a wave-like change trend of “decreasing first and then increasing and then decreasing”, with an average annual growth rate of 5.3%. The period of significant growth in TFP occurred in the year of 2015 to 2016, with a growth rate of 33.7%, and then began to decline significantly, with the largest decline of 45.2% in the year of 2016 to 2017. It can be seen that eco-efficiency of resource-based cities has been ineffective in recent years, or even intensified. Combined with previous analysis, the average eco-efficiency of resource-based cities in different life cycle is increasing year by year, but its growth rate fluctuates, which also shows that with the rapid development of resource-based cities, how to balance relationship between ecological protection and economic development is still a problem to be studied for a long time.

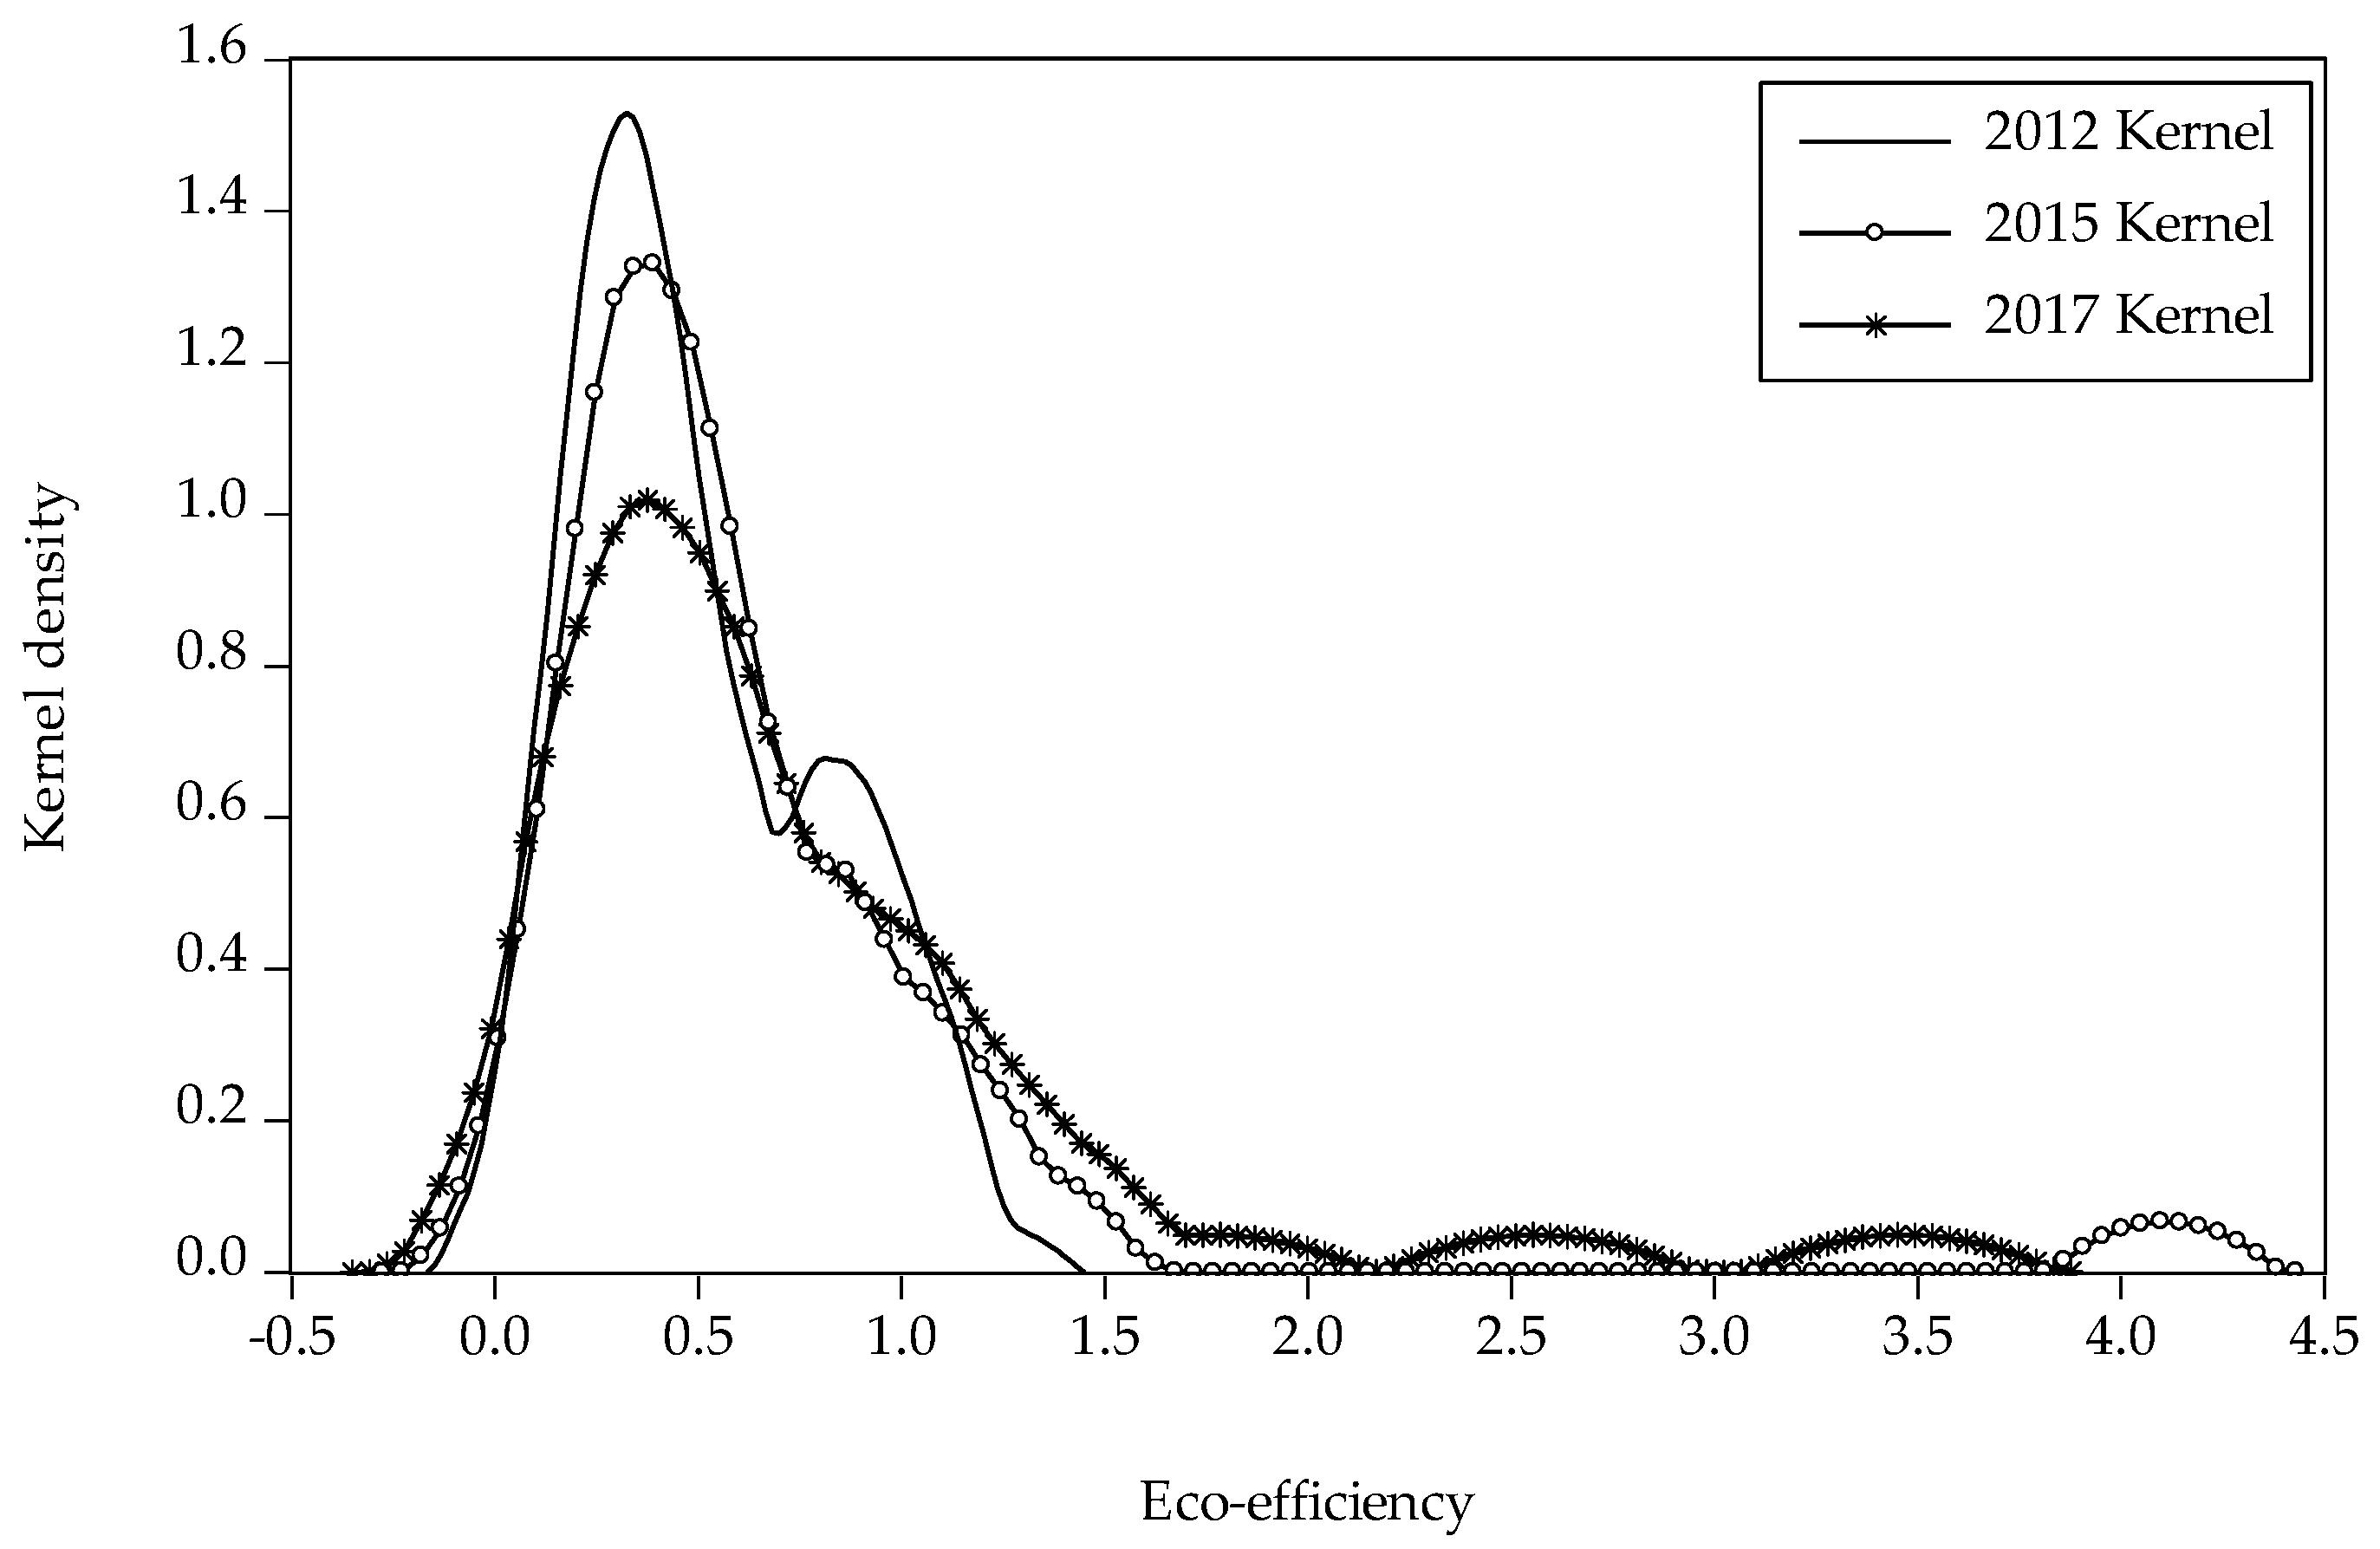
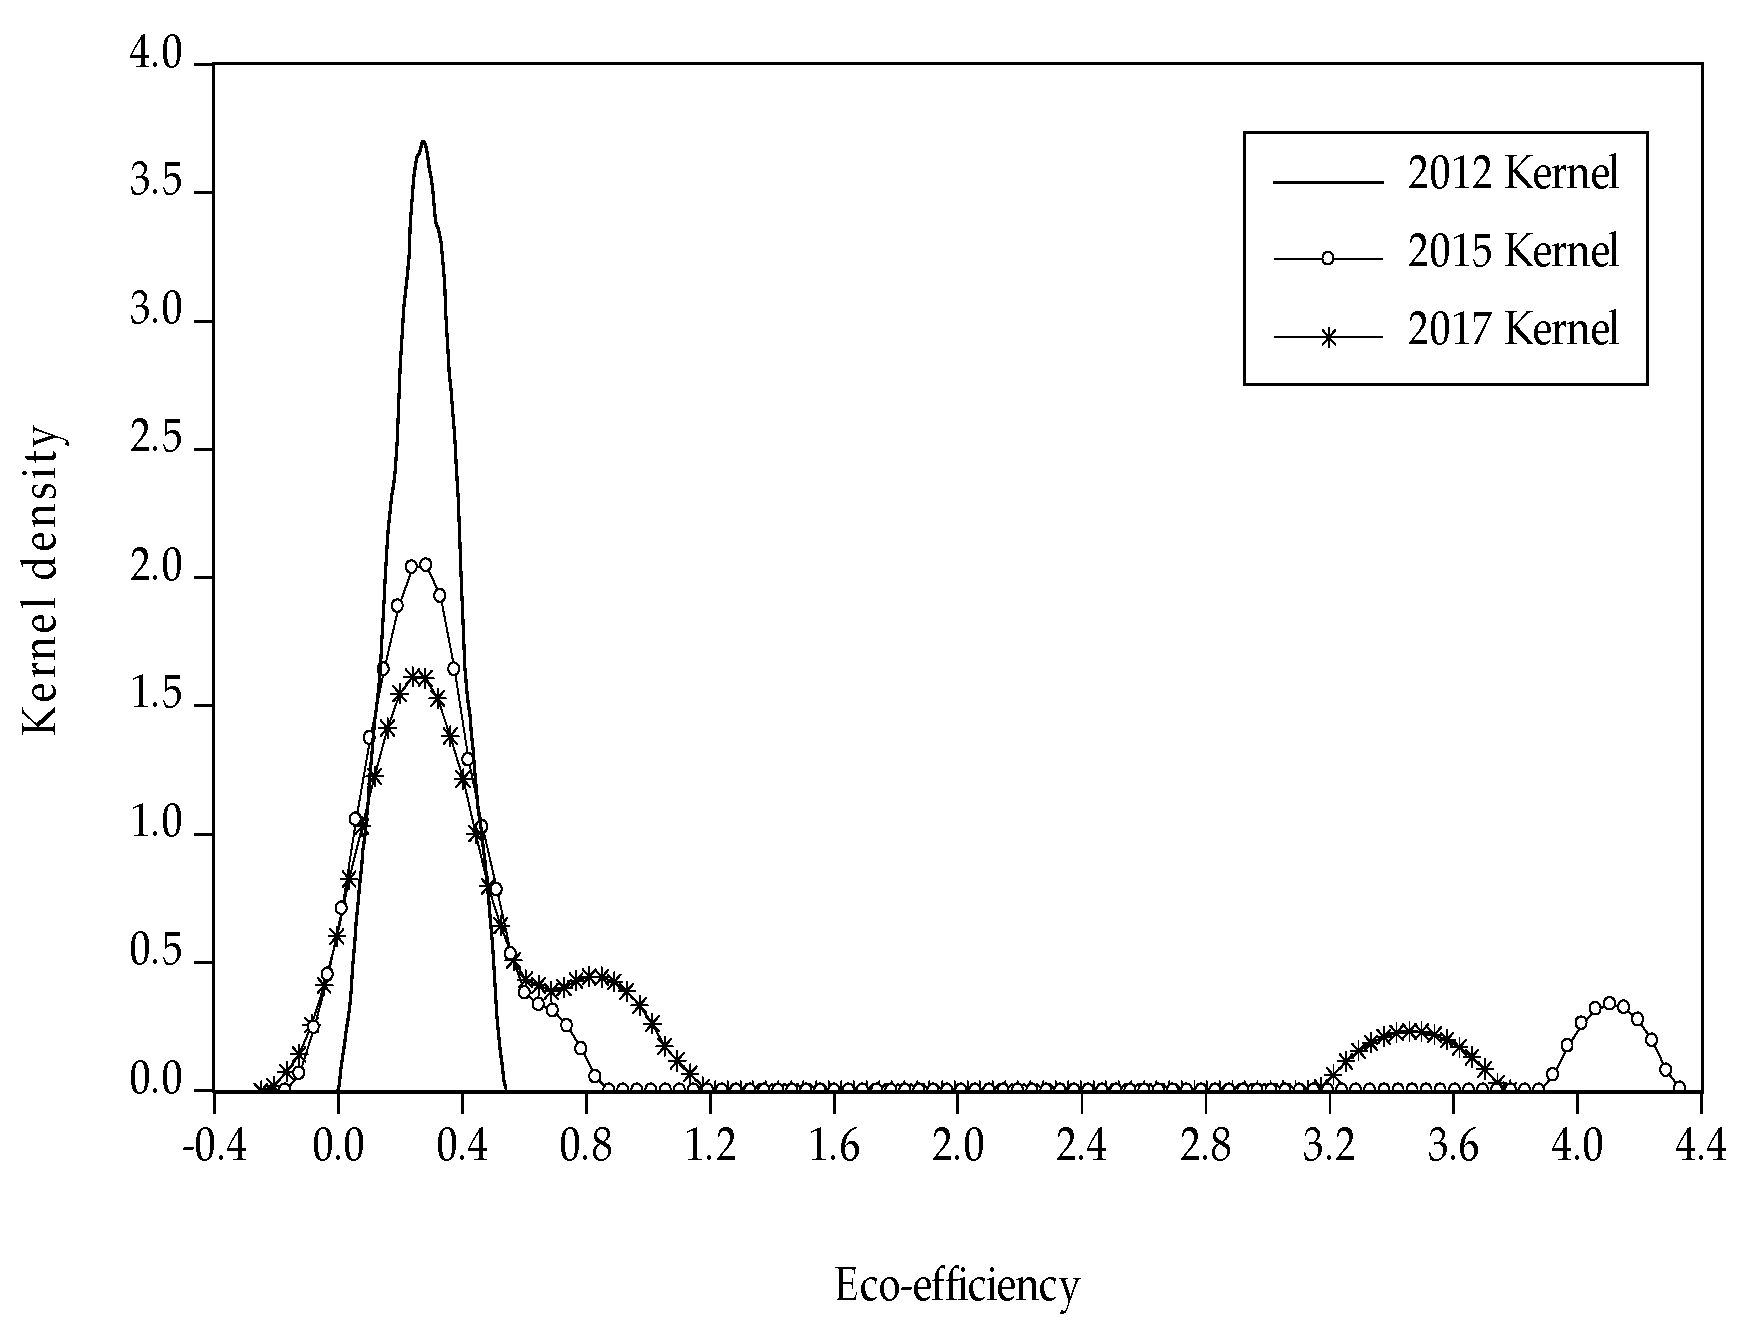
4.3. Analysis on Dynamic Evolution of Eco-Efficiency of Resource-Based Cities

By selecting super-efficiency values of three time nodes in 2012, 2015 and 2017, this study uses Eviews to draw kernel density curve of eco-efficiency of 40 resource-based cities on the time node [54], and analyzes changes and dynamic evolution of eco-efficiency of growing cities, mature cities, declining cities and regenerative cities on the time axis, as is shown in Figure 2, Figure 3, Figure 4, Figure 5 and Figure 6.
As can be seen from Figure 2, on the whole, the center of kernel density estimation curve moves to right, the peak value decreases gradually and the change interval goes through the process of “expanding first and then shrinking”. From the perspective of the wave peak, it changes from the sharp peak to the wide peak, and there is a tendency to form a small peak gradually on the right side of the distribution curve, which indicates that overall eco-efficiency of resource-based cities is in a state of continuous growth, and the gap of eco-efficiency in resource-based cities with different life cycles is gradually narrowing. Specifically, in 2015, compared with 2012, the number of peaks reduces, the peak value decreases, the center of density function moves slightly to right, but the amplitude is small, and the interval of change gradually increases, which indicates that during this period, eco-efficiency of resource-based cities with different life cycle shows an overall growth trend, but the gap is more obvious. Compared with 2015 and 2017, the peak changes from the sharp peak to the wide peak, the peak continues to decrease, the center of density function basically changes little, the right tail of the curve moves slightly to left and rises upward, there is a tendency to form a small peak, and the interval of change gradually narrows, which shows that the gap of eco-efficiency in resource-based cities is significantly narrowed in different life cycles. The reason is that resource-based cities with different life cycles pay more and more attention to eco-environment, which makes the gap narrow gradually.
From the observation of Figure 3, it can be found that during the sample survey, eco-efficiency of growing cities continues to move to right, the peak value shows a slight downward trend, and the interval of change continues to increase, gradually forming a “one-main and one-small” pattern. This shows that overall eco-efficiency of growing cities continues to increase during the period of investigation, but the regional gap widens. The reason is that growing cities are in the early stage of development and can pay attention to eco-environmental protection. However, due to unbalanced development between cities, the gap in eco-environmental governance has widened. In Figure 4, density function center of eco-efficiency of mature cities moves slightly to left, with the peak rising first and then falling, and the change interval continues to expand. The pattern changes from “two-main” to “one-main”, with the main peak becoming gentle and the small peak on the right side of the curve gradually disappearing. In general, the regional gap in eco-efficiency of mature cities is expanding. The reason is that mature cities speed up urban development process after the period of growth, but production conditions and resource endowment of different cities are different, so are the speed and scale of promoting development of resource-based cities.
As can be seen from Figure 5, on the whole, the peak value of eco-efficiency of declining cities shows a continuous downward trend during the period of investigation period, and the change interval experiences a process of “expanding first and then shrinking”. From the perspective of the wave peak, two small peaks are formed on the right side of density function, developing from single polarization to multi-polarization gradually, which indicates eco-efficiency of declining cities shows a downward trend on the whole, and the regional differences of eco-efficiency expand obviously, and then slightly shrink. The reason is that declining cities are facing a dilemma of resource depletion and urban exhaustion due to the decline of urban development level, and eco-efficiency is also gradually declining, while declining cities have actively explored the way of urban transformation to solve the dilemma of urban development, making the regional gap narrow gradually. It is found in Figure 6 that the center of density function of eco-efficiency in regenerative cities keeps moving to right, the peak value decreases at first and then increases, with the change interval expanding. The pattern changes from “two-main” to “one-main and one-small”, and the main peak tends to be flat. It shows that eco-efficiency of regenerative cities is gradually increasing, and the regional gap is widening, because regenerative cities realize the importance of eco-environmental protection after the period of growth, maturity and decline. However, due to different levels of urban development, there are regional differences in the eco-efficiency.
Combined with Figure 3, Figure 4, Figure 5 and Figure 6, it is found that from the position of density function, the density function of mature cities and declining cities tends to shift slightly to left, and the density function of growing cities and regenerative cities tends to move to right, which shows that eco-efficiency of mature cities and declining cities has a decreasing trend, while eco-efficiency of growing cities and mature cities has an increasing trend. From the perspective of interval span of density function, the span of declining cities is the largest, followed by growing cities and mature cities, and the interval span of regenerative cities is the smallest. This indicates that the change degree of eco-efficiency of resource-based cities with different life cycle is different, but the regional gap of eco-efficiency of declining cities is the largest compared with other cities. From the center of density function, the peak gap of declining cities is the largest, mature cities are the second, regenerative cities are close behind, and the peak gap of growing cities is the smallest, which shows that growing cities have the greatest intensity of eco-efficiency, followed by regenerative cities, and declining cities have the least intensity of eco-efficiency.
Remark 3.
The regional gap of eco-efficiency in resource-based cities is narrowing gradually. Growing cities exert the greatest efforts on eco-efficiency, followed by regenerative cities and mature cities, and declining cities are the least.

5. Discussions

This study uses super-efficiency DEA to calculate eco-efficiency of 40 resource-based cities from 2012 to 2017. Results show that eco-efficiency of resource-based cities is in the following order: growing cities, regenerative cities, mature cities and declining cities, which is consistent with conclusion drawn by Ai et al. [55]. Chen et al. [32] used resource and environmental indicators to study eco-efficiency of resource-based cities and conclude that eco-efficiency of resource-based cities is in the order of mature cities, growth cities, regenerative cities and declining cities, which is different from conclusion of this study. The growing cities are the most abundant in natural resources, but utilization efficiency of mineral resources is not very high, economic development is in the initial stage, social infrastructure is relatively imperfect, and eco-efficiency is relatively good at this time. Regenerative cities have undergone a series of transformation and development measures during the recession. The urban industrial structure has got rid of original heavy dependence on resources, economic development has been injected with new vitality and reborn, and urban development has entered a new stage. Therefore, eco-efficiency is better than that of mature cities. Due to large-scale expansion and growth of industries in mature cities, level of economic development based on energy consumption is constantly improving. At the same time, the eco-environment begins to deteriorate, resulting in dominant situation of resource-based industries and low eco-efficiency. Declining cities are facing the situation of “mine exhaustion and city decline”. The economic scale of cities begins to decline gradually, environmental problems become more prominent and eco-efficiency is the lowest.
The Malmquist index is used to dynamically decompose eco-efficiency of resource-based cities, it is concluded that technological progress promotes the growth of TFP value, which makes the greatest contribution to it, and comprehensive technical efficiency restricts the growth of TFP value, which is consistent with existing research. Chen et al. [32] thought that the TFP value of resource-based cities is in the order of growth cities, declining cities, regenerative cities and mature cities from high to low, while results of this study show that the TFP value of declining cities is the highest and growing cities is the lowest. The main reasons are: When seeking transformation and development, declining cities strive to change mode of economic development, change original industrial model of relying only on mining resources, and pay more attention to urban development and eco-environment protection. While growing cities are in the early stages of growth, excessive reliance on resource industries and vigorous exploitation of energy and resources has a great negative effect on natural resources and eco-environment. The level of eco-efficiency changes with continuous development of cities, so the TFP value is negative.
Han et al. [47] used Kernel density estimation to analyze dynamic evolution characteristics of regional eco-efficiency in China and conclude that there is a certain inertia in the level of eco-efficiency, and grade transfer is mostly concentrated between adjacent grades. Chen et al. [56] used Kernel density estimation to analyze evolution of urban eco-efficiency in Yangtze River economic belt and conclude that overall difference of urban eco-efficiency is large but shows a shrinking trend, the intra-regional difference of urban eco-efficiency in lower reaches is always the largest, and the regional difference between upstream and downstream is the largest. At present, there is a lack of research on evolution of eco-efficiency, and there are no scholars to study dynamic evolution of eco-efficiency of resource-based cities. This study uses Kernel density estimation to analyze dynamic evolution of eco-efficiency of resource-based cities, to provide a theoretical basis for construction of ecological civilization and sustainable development of resource-based cities in China. The study shows that the eco-efficiency of growing cities shows an increasing trend, and the regional gap expands. The eco-efficiency of mature cities shows a decreasing trend, and the regional gap continues to expand. The eco-efficiency of declining cities shows a downward trend, and the regional gap expands at first and then narrows, but the span of change interval is the largest. The eco-efficiency of regenerative cities shows an increasing trend, second only to growing cities, and the regional gap is enlarged, but it is not obvious.

6. Conclusions and Management Implications

We explore static and dynamic changes of eco-efficiency of resource-based cities by taking data from 2012 to 2017 in 40 resource-based cities in China. Super-efficiency DEA, Malmquist index and Kernel density estimation methods are used in the study. The conclusions are as follows:

6.1. Conclusions

The super-efficiency DEA model is used to statically analyze eco-efficiency of resource-based cities. The eco-efficiency of 40 resource-based cities shows a steady upward trend from 2012 to 2017, and the year with the highest eco-efficiency is 2017, which is 0.730. The average value of eco-efficiency of growing cities is the highest, followed by mature cities and declining cities, and the average value of eco-efficiency of regenerative cities is the lowest. In the life cycle division, values of eco-efficiency cities are as follows from high to low: growing cities, regenerative cities, mature cities and declining cities.
The Malmquist index is used to dynamically decompose eco-efficiency of resource-based cities. It can be found that the TFP value of eco-efficiency of resource-based cities is greater than 1, indicating that eco-efficiency of resource-based cities is increasing dynamically. The TFP values of resource-based cities from high to low are declining cities, regenerative cities, mature cities and growing cities. The technological progress promotes the growth of TFP value, which makes the greatest contribution to TFP value, while the comprehensive technical efficiency restricts the growth of TFP value. From the mean value, the scale efficiency value is 0.975, indicating that the production scale of most resource-based cities has not reached the optimal level. It can be seen that the scale efficiency index has a greater impact on the comprehensive technical efficiency index.
The kernel density estimation is used to analyze dynamic evolution of eco-efficiency of resource-based cities. It can be seen that overall eco-efficiency of resource-based cities shows a continuous growth trend, and the gap of eco-efficiency of resource-based cities with different life cycles has obviously expanded at first and then narrowed slightly. The eco-efficiency of growing cities shows an increasing trend, and the regional gap has widened; eco-efficiency of mature cities shows a decreasing trend, and the regional gap continues to expand; eco-efficiency of declining cities shows a downward trend, and the regional gap expands at first and then narrows, but the span of change interval is the largest; and eco-efficiency of regenerative cities shows an increasing trend, second only to growing cities, and the regional gap is enlarged, but not obvious.

6.2. Management Implications

According to results of Malmquist index, from the perspective of technological progress, resource-based cities should strengthen investment in eco-environmental protection, pay attention to technological innovation and effectively improve efficiency and level of eco-environment in resource-based cities. Based on the comprehensive technical efficiency, resource-based cities should improve level of management services, strengthen management of environmental protection technology innovation, enhance strength of urban innovation and strive to make the environment ecological and green [57]. In view of scale efficiency, resource-based cities should standardize and guide agglomeration development of environmental protection industry and realize large-scale and agglomeration development of industry through environmental policy, investment policy and other policies.
In terms of results of Kernel density, resource-based cities should flexibly adjust input model of urban factors according to actual situation of urban development and implement differentiated and efficient eco-environmental protection measures. Cities with low eco-efficiency should actively strengthen exchanges and cooperation and learn from each other’s experience in eco-environment management; those with higher eco-efficiency should actively assume more responsibility for environmental protection and promote improvement of eco-efficiency in other resource-based cities.
This study is not without limitations. First, this study constructs an evaluation index system of eco-efficiency and selects evaluation indicators on the basis of existing research. In the following study, indicators should be selected according to characteristics of different types of resource-based cities, which is more scientific. Second, due to the limitation of data collection, this study only selects research data for 6 years from 2012 to 2017, and then will continue to expand the research and update existing data to make analysis results more accurate.

Author Contributions

Conceptualization, X.G. (Xingcheng Ge) and J.X.; methodology, X.G. (Xingcheng Ge); software, X.G. (Xingcheng Ge); validation, X.G. (Xingcheng Ge), J.X. and Y.X.; formal analysis, X.G. (Xingcheng Ge) investigation, X.G. (Xingcheng Ge); resources, X.G. (Xingcheng Ge); data curation, X.G. (Xin Guo); writing—original draft preparation, X.G. (Xingcheng Ge); writing—review and editing, X.G. (Xingcheng Ge); visualization, X.G. (Xingcheng Ge); supervision, D.Y.; project administration, J.X.; funding acquisition, J.X. All authors have read and agreed to the published version of the manuscript.

Funding

This research was funded by Chinese National Funding of Social Sciences (No. 19BJY066), Qinglan Project of Jiangsu Province of China (Su Teacher 2017 No.15), Key Project of Philosophy and Social Science of Jiangsu Province (No. 2018SJZDI090), Priority Academic Program Development of Jiangsu Higher Education Institutions (PAPD).

Institutional Review Board Statement

Not applicable.

Informed Consent Statement

Not applicable.

Data Availability Statement

Not applicable.

Conflicts of Interest

The authors declare no conflict of interest.

References

  1. Li, L.; Lei, Y.L.; Pan, D.Y.; Si, C.Y. Research on Sustainable Development of Resource-Based Cities Based on the DEA Approach: A Case Study of Jiaozuo, China. Math. Probl. Eng. 2016, 3, 1–10. [Google Scholar] [CrossRef] [Green Version]
  2. Zhang, S.J. Definition and classification of resource-based cities. Chin. Foreign Entrep. 2011, 24, 3. [Google Scholar]
  3. Wang, D.; Ji, X.; Li, C.; Gong, Y.X. Spatiotemporal Variations of Landscape Ecological Risks in a Resource-Based City under Transformation. Sustainability 2021, 13, 5297. [Google Scholar] [CrossRef]
  4. Yu, H.L.; Dong, S.C.; Li, Y.; Li, Z.H.; Li, F. Contrastive Study of the Circular Economy of Coal Resource City Based on Ecological Efficiency and C Model. J. Resour. Ecol. 2016, 7, 323–333. [Google Scholar]
  5. Qiu, F.D.; Yuan, H.; Zhu, C.G.; Guo, M.M. Effects and Influencing Factors of Industrial Transformation in Renewable Resource-based cities. Econ. Geogr. 2018, 38, 68–78. [Google Scholar]
  6. Gu, D.; Xu, X.J. The Influence of Industrial Structure Optimization and Upgrading on Ecological Efficiency in China. Ecol. Econ. 2020, 36, 58–67. [Google Scholar]
  7. Schaltegger, S.; Sturm, A. Ecological rationality: Approaches to design of ecology-oriented management instruments. Die Unternehm. 1990, 4, 273–290. [Google Scholar]
  8. WBSCD. Eco-Efficiency Leadership for Improved Economic and Environmental Performance; WBSCD: Geneva, Switzerland, 1996; pp. 3–16. [Google Scholar]
  9. Ren, Y.F.; Fang, C.L.; Lin, X.Q. Evaluation of eco-efficiency of four major urban agglomerations in eastern coastal areas of China. Acta Geogr. Sin. 2017, 72, 2047–2063. [Google Scholar]
  10. Deilmann, C.; Lehmann, I.; Reißmann, D.; Hennersdorf, J. Data envelopment analysis of cities-Investigation of the ecological and economic efficiency of cities using a benchmarking concept from production management. Ecol. Indic. 2016, 67, 798–806. [Google Scholar] [CrossRef]
  11. Pérez, U.; María, L.A.; Wall, A. Eco-efficiency among dairy farmers: The importance of Socio-economic characteristics and farmer attitudes. Environ. Resour. Econ. 2016, 64, 559–574. [Google Scholar] [CrossRef]
  12. Benedetta, C.; Donatella, V.; Giulio, F.; Federica, D.L.; Donatella, P. Assessing agricultural eco-efficiency in Italian Regions. Ecol. Indic. 2020, 116, 114–126. [Google Scholar]
  13. Wang, Z.M.; Zhao, Y.Z. Study on Ecological efficiency of rare Earth Industry in China. J. Ind. Technol. Econ. 2014, 33, 110–115. [Google Scholar]
  14. Zheng, J.L.; Peng, X.T. Study on Synergetic Development of compound Ecological efficiency system of High Energy-consuming Industrial Cluster. J. Chongqing Univ. Technol. (Soc. Sci.) 2018, 32, 30–38. [Google Scholar]
  15. Rafał, B.; Jerzy, B. Eco-Efficiency in Measuring the Sustainable Production of Agricultural Crops. Sustainability 2020, 4, 1418. [Google Scholar]
  16. Liu, J.; Zhang, J.; Fu, Z. Tourism eco-efficiency of Chinese coastal cities-Analysis based on the DEA-Tobit model. Ocean Coastal. Manag. 2017, 164–170. [Google Scholar] [CrossRef]
  17. Zheng, Y.M.; Yin, S.H. An empirical study on the Ecological efficiency of Forestry Industry—Based on Panel data Analysis of 15 provinces. Forestry Econ. 2016, 38, 36–40. [Google Scholar]
  18. Gu, X.W.; Li, G.J.; Wang, Q.; Liu, J.X.; Ding, Y. Ecological efficiency of higher Education—Ecological footprint of University Campus. J. Glaciol. Geol. 2005, 3, 418–425. [Google Scholar]
  19. Liu, Z.C.; Zhang, C.C. Study on Evaluation of Ecological efficiency and production efficiency of Tea Industry in China—Empirical Analysis based on DEA method. Ecol. Sci. 2017, 36, 111–117. [Google Scholar]
  20. Yin, Q.; Wang, Y.D.; Wan, K.D.; Wang, D.L. Evaluation of Green Transformation Efficiency in Chinese Mineral Resource-Based Cities Based on a Three-Stage DEA Method. Sustainability 2020, 12, 9455. [Google Scholar] [CrossRef]
  21. Lin, W.K.; Lin, B. Evaluation of Ecological efficiency of Regional Tourism Industry and its Spatial difference—A case study of Jiangxi Province. East. China Econ. Manag. 2018, 32, 19–25. [Google Scholar]
  22. Ren, H.X. Comprehensive Measurement of Agricultural Ecological efficiency based on DEA Model. Stat. Decis. 2019, 35, 99–103. [Google Scholar]
  23. Wang, Z.; Liu, Q. Spatiotemporal evolution of tourism ecological efficiency in the Yangtze River economic belt and its interactive response with tourism economy. J. Nat. Resour. 2019, 34, 1945–1961. [Google Scholar]
  24. Ratner, S. Dynamic Problems of Estimation of Ecological-Economic Efficiency of Regions Based on Basic Models of Data Envelopment Analysis. Autom. Remote Control 2019, 80, 2245–2258. [Google Scholar] [CrossRef]
  25. Yang, S.; Wang, Q.M.; Liu, B.Q. Evaluation of Ecological Efficiency in Resource-based Cities Taking Shandong Province as an Example. Agric. Eng. 2018, 5, 49–53. [Google Scholar]
  26. Camarero, M.; Castillo, J.; Andrés, J.P.; Cecilio, T. Eco-efficiency and convergence in OECD countries. Environ. Resour. Econ. 2013, 1, 87–106. [Google Scholar] [CrossRef] [Green Version]
  27. Koskela, M. Measuring eco-efficiency in the Finnish forest industry using public data. J. Cleaner Prod. 2015, 98, 316–327. [Google Scholar] [CrossRef]
  28. Li, H.J.; Long, R.Y.; Lan, X.P. Evaluation of Ecological efficiency of Resource-based cities. Resour. Sci. 2010, 32, 1296–1300. [Google Scholar]
  29. Xu, J.F.; Tian, S.Y.; Zhan, Q.Y. Evaluation of Ecological efficiency of Coal Resource-based cities in China. Urban Probl. 2016, 12, 85–93. [Google Scholar]
  30. Wang, Y.Q.; Jiang, B.Y.; Zhao, T.M.; Yin, Z.H. Evaluation of ecological efficiency of industrial coupling symbiosis network in eco-industrial parks of oil and gas resource-based cities. Sci. Technol. Manag. Res. 2019, 39, 51–58. [Google Scholar]
  31. Yin, Q.Q.; Qiu, F.D. Heterogeneity of ecological efficiency and analysis of industrial structure in renewable resource-based cities. Geogr. Geo-Inf. Sci. 2019, 35, 119–125. [Google Scholar]
  32. Chen, H.; Chen, P.; Luo, Y. Evaluation of Ecological efficiency of Resource-based cities in China based on Super-efficiency DEA Model. J. Dalian Univ. Technol. (Soc. Sci.) 2015, 36, 34–40. [Google Scholar]
  33. Huang, X.Q.; Wang, T.T. Evaluation of Ecological efficiency of Resource-based cities. Sci. Res. Manag. 2015, 36, 70–78. [Google Scholar]
  34. Zhao, Y.; Wang, S.; Liu, Q.; Liu, X. The spatial differentiation of the coupling relationship between urbanization and the eco-environment in countries globally: A comprehensive assessment. Ecol. Model 2017, 360, 313–327. [Google Scholar] [CrossRef]
  35. Wang, Z.; Feng, C. A performance evaluation of the energy, environmental, and economic efficiency and productivity in China: An application of global data envelopment analysis. Appl. Energy 2015, 147, 617–626. [Google Scholar] [CrossRef]
  36. Lee, T.; Yeo, G.; Thai, V. Environmental efficiency analysis of port cities: Slacks-based measure data envelopment analysis approach. Transp. Policy 2014, 33, 82–88. [Google Scholar] [CrossRef]
  37. Charnes, A.; Cooper, W.W.; Rhodes, E. Measuring the Efficiency of Decision Making Units. Eur. J. Oper. Res. 1978, 2, 429–444. [Google Scholar] [CrossRef]
  38. Barnabé, W. Economic growth and greenhouse gases in Europe: A non-radial multi-sector nonparametric production-frontier analysis. Energy Econ. 2018, 74, 51–62. [Google Scholar]
  39. Gao, T.M. Application and Example of Econometric Analysis Method and Modeling Eviews; Tsinghua University Press: Beijing, China, 2016. [Google Scholar]
  40. Chen, M.; Liu, H.; Sun, Y. Spatial differences and Distribution Dynamics of Financial Development of five Urban agglomerations in China: 2003–2013. J. Quant. Tech. Econ. 2016, 33, 130–144. [Google Scholar]
  41. Quah, D. Galton′s Fallacy and Tests of the Convergence Hypothesis. Scand. J. Econ. 1993, 95, 427–443. [Google Scholar] [CrossRef]
  42. Sala, X. The world distribution of income: Falling poverty and covergence, period. Q. J. Econ. 2006, 21, 351–397. [Google Scholar] [CrossRef]
  43. Yang, Y.K.; Sun, C.Z. Evaluation of Land-Sea Coordination degree and Analysis of Spatio-temporal difference in Bohai Rim area. Resour. Sci. 2014, 36, 691–701. [Google Scholar]
  44. Viet-Ngu, H.; Mohammad, A. Input-orientated date envelopment analysis framework for measuring and decomposing economic, environment and ecological efficiency: An application to OECD agriculture. Environ. Resour. Econ. 2012, 51, 431–452. [Google Scholar]
  45. Laurens, C.; Bram, D.R.; Barnabé, W. Multi-output efficiency with good and bad outputs. Eur. J. Oper. Res. 2015, 240, 872–881. [Google Scholar]
  46. Hoh, H.; Scoer, K.; Seibel, S. Eco-Efficiency Indicatorsin German Environmental-Economic Accounting. 2002. Available online: https://content.iospress.com/articles/statistical-journal-of-the-united-nations-economic-commission-for-europe/sju00516 (accessed on 9 June 2021).
  47. Han, Z.L.; Wang, Q.W.; Liu, T.B.; Yan, X.L. Spatio-temporal dynamic distribution and evolution trend of ecological efficiency in China. Stat. Decis. 2019, 35, 85–88. [Google Scholar]
  48. Qiu, S.F.; Zhu, D.J. Design and application of ecological efficiency index in China. Sci. Technol. Manag. Res. 2007, 1, 20–24. [Google Scholar]
  49. Yu, J.H.; Li, J.M.; Zhang, W.Z. Identification and Comprehensive Classification of Resource-based cities in China. Acta Geogr. Sin. 2018, 73, 677–687. [Google Scholar]
  50. Zhang, W.Z.; Yu, J.H.; Wang, D. Research on the Sustainable Development of Resource-Based Cities in China; Science Press: Beijing, China, 2014. [Google Scholar]
  51. Tapio, P. Towards a theory of decoupling: Degrees of decoupling in the EU and the case of road traffic in Finland between 1970 and 2001. Transp. Policy 2005, 12, 137–151. [Google Scholar] [CrossRef] [Green Version]
  52. Vehmas, J.; Luukkanen, J.; Kaivo-Oja, J. Linking analyses and environmental Kuznets curves for aggregated material flows in the EU. J. Cleaner Prod. 2007, 15, 1662–1673. [Google Scholar] [CrossRef]
  53. Yang, L.; Yang, Y.T. Evaluation of eco-efficiency in China from 1978 to 2016: Based on a modified ecological footprint model. Sci. Total. Environ. 2019, 662, 581–590. [Google Scholar] [CrossRef]
  54. Yan, J.Y.; Hou, M.Y. Study on the dynamic Evolution of Technical efficiency of Mineral Resources Industry chain in China. China. Min. Mag. 2018, 27, 50–55. [Google Scholar]
  55. Ai, J. Study on the Measurement and Promotion Countermeasures of Ecological Efficiency of Resource-Based Cities in China; China Univ Min Technol: Xuzhou, China, 2019. [Google Scholar]
  56. Chen, M.H.; Liu, W.F.; Wang, S.; Liu, Y.X. Spatial pattern and Evolution trend of Urban Ecological efficiency in the Yangtze River Economic Belt. Resour. Sci. 2020, 42, 1087–1098. [Google Scholar]
  57. Xing, M.L.; Luo, F.Z. Comparative Study on the Optimization Path of Industrial Value Chain in China’s Resource-Based Cities. Sustainability 2018, 10, 1338. [Google Scholar] [CrossRef] [Green Version]
Figure 1. Trend of TFP in resource-based cities.
Sustainability 13 06802 g001
Figure 2. Dynamic evolution of eco-efficiency in 40 resource-based cities.
Sustainability 13 06802 g002
Figure 3. Dynamic evolution of growing cities.
Sustainability 13 06802 g003
Figure 4. Dynamic evolution of mature cities.
Sustainability 13 06802 g004
Figure 5. Dynamic evolution of declining cities.
Sustainability 13 06802 g005
Figure 6. Dynamic evolution of regenerative cities.
Sustainability 13 06802 g006
Table 1. Comparison of evaluation methods of eco-efficiency.
Evaluation MethodAdvantages and CharacteristicsShortcomings
Economic-environmental ratio evaluation methodTraditional eco-efficiency evaluation method; simple to calculate and easy to master.(1) It is easy to ignore contribution of other factors to eco-efficiency, and the representativeness is not strong.
(2) Vulnerable to seasonal reasons.
Evaluation and analysis of eco-efficiency indexThe selected indicators are helpful to analyze efficiency of projects in different dimensions, which is closer to actual situation.(1) The evaluation index is complex and it is difficult to determine relative efficiency.
(2) It is easy to be influenced by subjective factors.
(3) The quantity of input and output is required to be the same.
Substance Flow Analysis (SFA)The tracking index of sustainable development and concise environmental pressure can be obtained.
Make up for limitations caused by monetary units
The links between environmental impacts caused by material flow and material flow index are weakened.
Only considering changes in the environment and economic system, changes of material flow within system is not considered
Ecological footprint (EF)The calculation method is simple, easy to understand.
It has a wide range of applications.
It cannot effectively reflect future development trend and detect change process.
It is more ecological, but neglects the sustainability of economy.
Parameter analysis methodLower requirements for data types.
It is more suitable for long-term forecast of economic aggregate.
It can easily lead to a large gap between simulated production conditions and actual economic conditions.
It cannot solve problem of sample data superposition under different types of input factors.
Nonparametric analysis method (DEA)The efficiency of multi-input and multi-output of different measurement units can be measured.
The problem of subjective weight can be avoided and it is suitable for comparing efficiency between units to be evaluated.
It can provide useful efficiency improvement information for management decision makers.
The result of calculation is a relative value, not an absolute value.
The unit to be evaluated should be homogeneous.
The accuracy of data is required to be high, and there are quantitative requirements.
It cannot be dealt with when values of input and output are negative.When the sample is insufficient, it is easy to misstate inefficient unit as efficient unit.
Table 2. Evaluation index system of eco-efficiency of resource-based cities.
Index TypeItemized IndexSpecific VariableVariable DescriptionUnit
Input indexResource consumptionLand resource consumptionLand utilization ratio (X1)Percentage
Water resources consumptionTotal urban water consumption (X2)10,000 tons
Power consumptionTotal electricity consumption of the whole society (X3)MW·hour
Manpower consumptionNumber of employees at the end of the year (X4)Ten thousand people
Energy consumptionUnit GDP energy consumption (X5)Tons of standard coal/10,000 CNY
Environmental pollutionWastewater dischargeDischarge density of industrial wastewater (X6)10,000 tons/square kilometre
Chemical oxygen demand emissions (X7)10,000 tons
Exhaust emissionindustrial sulfur dioxide emission (X8)Tons
Industrial smoke (powder) dust emission (X9)Tons
Solid dischargeComprehensive utilization rate of industrial solid waste (X10)Percentage
Harmless treatment rate of municipal solid waste (X11)Percentage
Output indexEconomic aggregateUrban GDPUrban GDP (Y)Billion CNY
Table 3. List of 40 resource-based cities.
Life CycleGrowing CitiesMature CitiesDeclining CitiesRegenerative Cities
City Type
Coal citiesLiupanshui, YulinLinfen, Datong, Jincheng, Jixi, Huainan, Hebi, PingdingshanShaoguan, Fuxin, Hegang, Wuhai, ShizuishanJiaozuo
Oil citiesSongyuan, QingyangDongying, Daqing, KaramayPuyangPanjin, Nanyang
Metallurgical citiesHezhouBenxi, Chenzhou, Panzhihua, JinchangTongling, BaiyinMaanshan
Forestry cities Jilin, Heihe, MudanjiangBaishan, YichunLijiang
Comprehensive cities HandanLiaoyuanTangshan
Table 4. Ecological super efficiency values of 40 resource-based cities from 2012 to 2017.
Life CycleCities201220132014201520162017Mean
Growing periodLiupanshui0.3520.5100.4920.5430.6060.6880.532
Yulin1.1721.1021.0311.2941.4502.5651.436
Songyuan1.0101.2660.9791.0441.2520.9421.082
Qingyang0.5730.5470.5560.6200.9401.0510.715
Hezhou0.3920.3740.3430.3240.5160.4120.394
Means of growing cities0.7000.7600.6800.7650.9531.1320.832
Mature periodLinfen0.8160.7480.5300.4930.5030.4780.595
Datong0.3010.3980.3110.3970.3800.6410.405
Jincheng0.4120.4220.4170.4150.4270.1390.372
Jixi0.2120.4650.2140.242 0.3420.3830.310
Huainan0.2810.2790.2600.2610.3250.3660.295
Hebi0.2330.2460.2840.3230.4080.3450.307
Pingdingshan0.4670.4500.4720.4820.5260.1600.426
Dongying0.9520.9871.0111.1011.1121.7671.155
Daqing0.9762.0551.1370.8551.0591.0551.190
Karamay0.7030.6440.6310.4620.4230.8120.613
Benxi0.7260.7240.8020.7130.3210.4100.616
Chenzhou0.6700.7450.8220.9161.2460.3410.790
Panzhihua0.4530.4840.4600.5120.5790.8260.552
Jinchang0.2830.2630.2850.2940.3300.3780.306
Jilin0.7851.0730.9080.7920.9041.1930.943
Heihe0.7680.9060.8281.3661.0451.2951.035
Mudanjiang0.3200.8090.5180.4860.9640.2760.562
Handan0.9940.6890.6830.7070.8910.8240.798
Means of mature cities0.5750.6880.5870.6010.6550.6490.626
Declining periodShaoguan0.4040.5140.3820.4050.4570.2340.399
Fuxin0.2020.2100.2120.1900.1780.1850.196
Hegang0.1500.3300.1020.1060.2170.0760.164
Wuhai0.2940.2860.3540.3110.2970.3030.308
Shizuishan0.3010.3340.3590.3840.6100.8840.479
Puyang0.3370.3800.5020.0570.9263.4640.944
Tongling0.2470.2450.2580.2460.3270.4140.290
Baiyin0.2420.2550.2050.2050.3340.7670.335
Baishan0.4260.5751.9200.6390.4060.2740.707
Yichun0.1120.5030.1324.1100.1580.1680.864
Liaoyuan0.2950.4400.2600.3430.5610.3820.380
Means of declining cities0.2740.3700.4260.6360.4060.6500.460
Regenerative periodJiaozuo0.5520.5910.6760.6880.7871.2840.763
Panjin0.4000.4310.4280.4050.3260.6110.434
Nanyang0.8960.9090.9280.9421.7150.3490.957
Maanshan0.3990.4340.4540.4120.4620.5410.450
Lijiang0.1230.1564.5000.1520.1580.5900.947
Tangshan0.9571.0671.0271.0541.3281.3121.124
Means of regenerative cities0.5550.5981.3360.6090.7960.7810.779
Overall means of sample cities0.5050.5960.6670.6320.6450.7300.629
Table 5. Classification of eco-efficiency of 40 resource-based cities from 2012 to 2017.
LevelCitiesEvaluation
Level 4Yulin, Songyuan, Dongying, Daqing, Heihe, Tangshan (6 in total)Superior eco-cities
Level 3Jilin, Puyang, Nanyang, Lijiang (4 in total)Good eco-cities
Level 2Qingyang, Karamay, Benxi, Chenzhou, Handan, Baishan, Yichun, Jiaozuo (8 in total)Medium eco-cities
Level 1Liupanshui, Hezhou, Linfen, Datong, Jincheng, Jixi, Huainan, Hebi, Pingdingshan, Panzhihua, Jinchang, Mudanjiang, Shaoguan, Fuxin, Hegang, Wuhai, Shizuishan, Tongling, Baiyin, Liaoyuan, Panjin, Maanshan (22 in total)Poor eco-cities
Table 6. Annual average Malmquist index and decomposition of 40 resource-based cities from 2012 to 2017.
Life CycleCityEffch
(EC = PE × SE)
Techch
(TC)
Pech
(PE)
Sech
(SE)
Tfpch
(TFP = EC × TC)
Growing periodLiupanshui1.0420.9251.0001.0420.964
Yulin1.0000.9701.0001.0000.970
Songyuan1.0001.1451.0001.0001.145
Qingyang1.0001.0281.0001.0001.028
Hezhou0.8780.9821.0000.8780.862
Means of growing cities0.9841.0101.0000.9840.994
Mature periodLinfen0.9040.9470.9680.9350.856
Datong1.1111.0401.0381.0701.156
Jincheng0.7530.9210.9860.7640.693
Jixi1.0361.1441.0111.0251.185
Huainan1.0491.0130.9761.0741.062
Hebi0.9481.1201.0110.9371.061
Pingdingshan0.7611.0840.9740.7820.826
Dongying1.0001.1981.0001.0001.198
Daqing1.0001.3611.0001.0001.361
Karamay1.0001.0661.0001.0001.066
Benxi0.8691.0420.9780.8890.905
Chenzhou0.8451.0721.0000.8450.906
Panzhihua1.0671.0621.0071.0601.133
Jinchang1.0191.1221.0001.0191.144
Jilin1.0001.0341.0001.0001.034
Heihe1.0001.1011.0001.0001.101
Mudanjiang0.9141.1981.0300.8881.096
Handan1.0000.9741.0001.0000.974
Means of mature cities0.9601.0830.9990.9601.042
Declining periodShaoguan0.8631.0390.9660.8940.897
Fuxin0.9621.0471.0090.9531.007
Hegang0.8441.2141.0190.8281.025
Wuhai1.0311.0211.0001.0311.053
Shizuishan1.1570.9971.0001.1571.153
Puyang1.0811.3761.0381.0411.487
Tongling1.0121.0741.0001.0121.087
Baiyin1.1681.0731.0001.1681.254
Baishan0.9251.1261.0000.9251.042
Yichun1.0031.2211.0001.0031.224
Liaoyuan0.9461.0371.0000.9460.981
Means of declining cities0.9991.1111.0030.9961.110
Regenerative periodJiaozuo1.0681.1831.0151.0521.264
Panjin0.9951.0801.0240.9721.075
Nanyang0.9041.0801.0000.9040.976
Maanshan0.9981.0611.0160.9821.059
Lijiang1.0910.9701.0001.0911.059
Tangshan1.0001.1391.0001.0001.139
Means of regenerative cities1.0091.0861.0091.0001.095
Overall means of sample cities0.9771.0781.0020.9751.053
Publisher’s Note: MDPI stays neutral with regard to jurisdictional claims in published maps and institutional affiliations.

