Article

Health Risk and Water Quality Assessment of Surface Water in an Urban River of Bangladesh

by
Md. Foysal Hasan
1,
Md. Nur-E-Alam
1,
Mohammed Abdus Salam
1,*,
Hafizur Rahman
2,
Shujit Chandra Paul
3,
Aweng Eh Rak
4,
Balram Ambade
5 and
Abu Reza Md. Towfiqul Islam
6
1
Department of Environmental Science and Disaster Management, Noakhali Science and Technology University, Noakhali 3814, Bangladesh
2
Department of Environmental Science and Management, School of Environment and Life Sciences, Independent University, Bangladesh (IUB), Dhaka 1229, Bangladesh
3
Department of Applied Chemistry and Chemical Engineering, Noakhali Science and Technology University, Noakhali, Sonapur 3814, Bangladesh
4
Faculty of Earth Science University, Jeli Campus, University Malaysia Kelantan, Jeli 17600, Malaysia
5
Department of Chemistry, National Institute of Technology Jamshedpur, Jharkhand 831014, India
6
Department of Disaster Management, Begum Rokeya University, Rangpur 5400, Bangladesh
*
Author to whom correspondence should be addressed.
Sustainability 2021, 13(12), 6832; https://doi.org/10.3390/su13126832
Submission received: 9 March 2021 / Revised: 10 May 2021 / Accepted: 12 May 2021 / Published: 17 June 2021

Abstract

:
Despite significant contributions to the national economy of Bangladesh, various urban developments, massive industrial and growing shipping activities are making the water of many urban rivers, including Karnaphuli River, extremely polluted. To find out the pollution sources and their possible health effects, 45 water samples were collected from 15 sampling stations. Investigation of six physicochemical parameters (pH, temperature, total dissolved solids, conductivity, salinity, and turbidity) through in-situ measurements and eight heavy metals (Cd, Cr, Cu, Fe, Mn, Ni, Pb, and Zn) status using atomic absorption spectrophotometer (AAS) was carried out in this research. Both the physicochemical parameters and heavy metals exceeded the World Health Organization (WHO)’s permeable threshold limit. The calculated hazard quotient (HQ) and hazard index (HI) ingestion values indicate non-carcinogenic risk both for adults and children, but dermal exposure was within the safety limit. Carcinogenic risk analysis revealed that Cd could cause a risk of cancer in those using the river water for a long period. Spatial analysis and metal pollution index (MPI) results exhibit that downstream of the river water is more polluted than upstream of the river. Overall, the findings of this study imply that polluted water is a threat to human health and the results will also help to undertake proper management strategies and incorporate monitoring programs that study river water for the implementation of safety measures to protect human health.

1. Introduction

Surface water provides vital support for human and aquatic organisms in several ways [1]. The river water quality is a very important factor concerning human health and aquatic ecosystems [2]. Anthropogenic and human development activities and wastewater discharge are deteriorating river water quality day by day. The gradual decrease of river water quality is considered a serious concern because it threatens the sustainability of the aquatic ecosystem [3]. Besides, heavy metals are toxic, persistent, and ubiquitous and become global concerning pollutants in the aquatic environment [4]. To meet the massive population demands, different anthropogenic and natural activities such as industrial effluent discharge, municipal effluents, chemical manufacturing, wastewater discharge, agricultural runoff, bedrock weathering, metal smelting, etc. are continuously deposited in river water and sediments and, finally, accumulate in aquatic organisms through the food chain [4,5,6]. The chemistry of heavy metals in an aquatic environment depends profoundly on the behavior of water physicochemical parameters. The physicochemical parameters such as pH temperature, salinity, electric conductivity, TDS, and turbidity affect the heavy metal composition and its toxicity level. However, enrichment of toxic heavy metals makes water unsuitable for drinking, industrial use, and agricultural purposes because exposure to polluted water is creating a risk to human health and its surrounding ecosystem [7,8]. Heavy metals that surpass accepted standards can pose a high risk to ecosystems due to their indefatigable biogeochemical effects, ecological impacts, and bio-accumulative and non-biodegradable nature. Hydrophyte ecosystems around the world have been pervaded by not only natural but also anthropogenic activities [9,10,11,12].
The use of contaminated water has health effects and if people use it for a long time, then various types of acute and chronic health problems occur [13]. To date, few studies have been conducted to assess the Karnaphuli River water quality. Therefore, water pollution studies need to check whether the use of this polluted water has any health effect on people [14,15,16]. In this study, health risk assessment was performed according to different pathways based on USEPA guidelines [17]. The USEPA has suggested two types of assessments (non-carcinogenic and carcinogenic risk assessment) in their international agency for cancer (IARC) report [14,15]. The health risk assessment for two population groups (adults and children) were done base on their body weight and exposure time. Increasing developmental and industrial activities along the river were identified as the cause of this pollution which was making the water unsuitable for use [18,19,20,21]. To the best of our knowledge, there has been no study conducted yet to investigate the water physicochemical parameters and heavy metal pollution from upstream to downstream of the river. As water pollution is largely varied by surrounding anthropogenic activities, a systematic investigation is essential to understand water quality status including heavy metal pollution levels covering the whole river from the upstream to downstream portion. Yet, systematic assessment of surface water quality and associated human health risk in a polluted urban river in Bangladesh is inadequate. This study was intended to investigate the pollution status, heavy metal distribution, and potential health risks generated from the downstream of the river. The key objectives of this study were to (1) investigate the water quality and contamination of heavy metal in water; (2) identify the source and concentration distribution pattern through different statistical and correlation analysis; (3) appraise the human health risk using different indices like hazard quotient, hazard index, and carcinogenic risk; (4) evaluate the spatial source differences and hazard index of each metal in the river focusing comprehensive information on the river water contamination. Multivariate statistical analyses such as the Pearson correlation, hierarchal cluster analysis, and principal component analysis (PCA) were employed to find out the relationship between the variables and possible source identification of the metal contamination [22,23]. PCA is a popular data-driven method that is used to organize and reduce complex datasets to create a set of a small number of factors. The results can be applied to increase water management efficiency to protect water resources as well as prevent hazardous heavy metal contamination of its consumers.

2. Materials and Methods

2.1. Study Area

The Karnaphuli River is a highly valued water resource in Bangladesh that originates from Mizoram, India, and flows 270 km southwest through the Chittagong hill tracts and Chittagong city into the Bay of Bengal. The country’s main port area and, at the same time, the commercial capital makes this area as well as the river very important. A relatively higher water current was observed because of the direct mixing of river water with the Bay of Bengal which provides Karnaphuli River with a strong self-purification ability. However, the pollutant load mixed with the marine environment is threatened to the blue economy of Bangladesh. The area of the river is comprised of temperate and semi-humid regions. Among 15 different sampling locations, downstream sample points (stations 7 to 15) were located near higher industrial activities. Various agricultural and fishing activities were observed near the upstream sampling station except for station 2 which is near the Karnaphuli paper industry (Figure 1). These sources are continuously inputting a huge quantity of pollutants into the river. Apart from these, salinity intrusion from the Bay of Bengal is also altering the physicochemical properties of the river ecosystem area and accelerating river water contamination [19].

2.2. Sampling

Water samples were collected from 15 different sites with three replicates from upstream to downstream of the Karnaphuli River. The global positioning system (GPS) was used to determine the actual coordinates of the selected sampling stations and to re-confirm the location of stations (Figure 1). Sample stations were selected based on different point and non-point sources and the collected samples were directly stored in 100 mL of pre-sterilized (washed with a phosphate-free soap, rinsed with 20% HNO3, followed by distilled water and finally dried in air before taking in the sample location) polypropylene bottles. The collected samples were labeled properly and put in an icebox as soon as possible. We collected three replicates’ samples from within a 5 m circle of a sample location. Samples were collected at a depth of 0.25–1 m. Before collecting the sample, the bottles were cleaned three times by rinsing well with the sample water. After collecting the sample, we filtered the water samples through a 0.45 µm filter paper and have the final elute.

2.3. In-Situ Measurement of Physical Parameters

A multi-parameters (Multi 3010 IDS) portable field instrument was used for in-situ measurement of five parameters: pH, temperature, total dissolved solids, conductivity, and salinity. A portable turbidity meter (2020 we/wi) was used for measuring the turbidity of water. In-situ measurement was done at 15 selected stations with three replicates from each location.

2.4. Sample Processing and Analysis

Samples were taken to the laboratory and analyzed for trace metals by atomic absorption spectrometry (VARIAN, Palo Alto, CA, USA, model AA2407). After taking the sample to the laboratory, a few drops of 5% HNO3 acid were added to it to combat the biological growth and precipitation of metal. The final elute was used to determine the heavy metal concentration by atomic absorption spectrometry. One mL of stock solution with the addition of 1 mL of HCL and 1 mL of Potassium Iodide was mixed in 20 mL beakers. Then, added to this solution was a volume of 10 mL of distilled water. Finally, this extracted solution was run directly in AAS for the determination of heavy metal in the sample. The concentration of selected heavy metals (Cd, Cr, Cu, Fe, Mn, Ni, Pb, and Zn) was determined by the direct flame method. First, the AAS was calibrated following the manufacturer’s recommendation. Then, the metal concentration was calculated for each sample of interest by plotting the AAS reading on the standard curve. All the analyses were performed in triplicate for assuring analytical reliability.

2.5. Quality Control

We have used standard methods NIST-SRM-1640 (natural water) for laboratory analysis. Quality control methods included replication of test, standardized adjustment, and uses of analytical grade chemical. We use blanks and spikes and standard operational procedures for maintaining the quality of the determination of heavy metals. The multiparameter instruments used for in-situ measurements (pH, temperature, total dissolved solids, conductivity, and salinity) were washed with distilled water before measurement and we ran a blank sample before each turbidity sample measurement with a turbidity meter. The Atomic Absorption Spectrometer (AAS) was calibrated based on the standard laboratory measures. The wavelengths (nm) of AAS were 324.8, 217.0, 228.8, 357.9, 232.0, 248.3, 213.9, 279.5 for Cu, Pd, Cd, Cr, Ni, Fe, Zn, Mn respectively. The AAS has detection limits (mg/L) of 0.001 for measuring all heavy metals except Fe and Zn which were 0.08 and 0.03, respectively. Triplicate measures of each sample were taken to minimize the errors.

2.6. Risk Assessment of Metals in Water

2.6.1. Hazard Quintet and Hazard Index

Water from rivers is used for various purposes such as drinking, industrial raw water, and other usages by the people. Using polluted water can cause acute and chronic effects on human health through physicochemical and biological processes [24]. Risk assessment was applied to the concentration of the studied metal to identify the exposure, tendency of the toxic elements to coagulate in the human body, and check for the probability of non-carcinogenic and carcinogenic risk. Many scientific methods are explored by USEPA for assessing risk using contaminated water. In this study, mainly two pathways of element exposure from contaminated water to the human body were considered: (i) through water consumption (ingestion) and (ii) through skin exposure (dermal). Thus, reference doses and the chronic daily intake (CDI) were compared to the studied elements and were calculated for both adults and children based on US Environmental Protection Agency (USEPA) standards. The estimated doses of exposure through ingestion and dermal were calculated using Equations (1) and (2), respectively, adopted from [24,25,26]:
CDI ingestion = EC   ×   Ing   R   ×   EF   ×   ED BW ×   AT
CDI   dermal = EC   × SA ×   AF ×   ABS ×   ET ×   EF ×   ED ×   CF   BW ×   AT
where EC is the metals concentration (mg/L); IngR is the ingestion rate (l day−1) (for adult: 2.5, child: 0.78; [17]; EF is the exposure frequency (day year−1) (365) [17]; ED is the exposure duration (year) (for adult: 70, child: 6) [27]; BW is the bodyweight (kg) (for adult: 70, child: 15) [28]; AT is the average time (day) (ED × 365) [17]; SA is the exposed skin area (cm2) (5700) [29]; AF is the adherence factor (mg cm2) (0.07) [29]; ABSd is the dermal absorption fraction (0.03) [29]; the exposure time (ET) is 0.6 (hour day−1) [24]; CF is the conversion factor (kg mg−1) (10−6) [27]. Moreover, non-carcinogenic risk (CR) to human population related to the metal contamination of water was assessed by calculating hazard quotient (HQ) and hazard index (HI) using Equations (3)–(5) prescribed by [17,24,27]:
HQ ingestion = CDI ingestion RfD ingestion
HQ dermal = CDI dermal   RfD dermal  
HI   =   Σ   H Q i
where i represents the HQ of each element, and RfD ingestion and RfD dermal are the reference dose for oral and dermal exposures, respectively, expressed in mg/kg/day, based on USEPA. Risk-based concentrations for all metals were obtained from USEPA standards [29,30,31] except Pb, which was derived from the guidelines of the World Health Organization [32]. The RfD ingestion and RfD dermal values are as follows: Fe-0.3, Al-1, Mn-0.02, Cu-0.04, Zn-0.3, Ni-0.02, Cd-0.0005, V-0.001, Cr- 0.003, and Pb-0.0014 for RfD ingestion and Fe-0.045, Al-0.2, Mn-0.0008, Cu-0.012, Zn-0.06, Ni-0.0054, Cd-0.000005, Cr-0.000015, Co-0.06, and Pb-0.00042 for RfD dermal. If the HI and HQ values become >1 for a long term which indicates a high risk for human health [26,32].

2.6.2. Carcinogenic Risks

The probability of developing cancer using polluted river water during a lifetime was estimated by multiplying CDI values with the cancer slope factor (SF) [28,33]. The carcinogenic risk was estimated both for an individual metal (Riski) and multiple metals (Risk total) were calculated from Equations (6) and (7), respectively:
Carcinogenic   Risk i =   CDI × SF
Carcinogenic   Risk   Total = i = 1 m j = 1 n Risk   ij
where Carcinogenic Risk for an individual denotes the probability during the lifetime of an individual exposed to carcinogens, and Carcinogenic Risk total is the sum of cancer risk for heavy metal i in exposure pathway j. SF (mg kg−1 day−1) represents the cancer slope factor. Among the five metals, As, Cd, and Cr are identified as human carcinogens and Pb is classified as a probable human carcinogen by the International Agency for Research on Cancer [34]. The applied oral slope factors were as follows: 1.5 for As, 0.0085 for Pb, 0.5 for Cr, and 15 for Cd. For managing the risk, the cancer risk from 1 × 10⁻⁶ to 1 × 10⁻⁴ is considered acceptable or tolerable [27].

2.6.3. Metal Pollution Index (MPI)

Cumulative impacts of the metals on water quality were calculated by the Metal Pollution Index (MPI) [34,35]. The MPI for a particular station was calculated by the sum of the ratios between the concentration of selected metals and their respective maximum allowable concentration (MAC) as represented in Equation (6). The MACs were taken from the drinking water standards of Bangladesh [36] and standards for Ni have been taken from the New York State Department of Environmental Conservation (NYSDEC) water quality standards and criteria of maximum concentration (CMC), respectively, as prescribed by [31].
MPI = C i MAC I
The degree of anthropogenic influence of metals on water quality and to classify water quality at different sampling stations was expressed through a six-category ranking system as used in [35]. An MPI of < 0.3 represents very pure (Class I), 0.3–1.0 represents pure (Class II), 1.0–2.0 represents slightly affected (Class III), 2.0–4.0 represents moderately affected (Class IV), 4.0–6.0 represents strongly affected (Class V), and > 6.0 represents seriously affected (Class VI).

2.7. Statistical Methods

For comparison of the spatial differences of the water quality parameters from upstream to downstream of the Karnaphuli river, various statistical analyses such as Pearson’s correlation, principal component analysis (PCA), hierarchical agglomerative cluster analysis (CA), and metal pollution index (MPI) were used. All of the data processes were conducted using Microsoft Office 2016, ArcGIS 10.1, and the statistical software package SPSS 25.0 for Windows (SPSS Inc., Chicago, IL, USA, 2002) and origin lab. The Kolmogorov–Smirnov (K-S) test was deployed to detect the normality among water quality parameters whereas the Levene test was carried out to check the consistency of the surface water data patterns. To check the differences in the water quality parameters with a confidence level of p < 0.05 by one-way ANOVA experiment.

3. Results and Discussions

3.1. Analysis of Physical Parameters

Temperature, salinity, pH, conductivity, total dissolved solids, and turbidity play a significant and crucial role in element distribution patterns in river water. No significant variance among the physical parameters of the analyzed datasets in the study area was found with the one-way ANOVA test. Physicochemical parameters sample data according to sample location is provided in Table 1. There was a very low fluctuation in temperature (degree Celsius) ranged from 29.8 (S4) to 31.9 (S2), indicating the well-mixed and shallow nature of the river [37]. A wide range of variations of salinity was observed from the upstream to the downstream (0 in S1 to 3.2 in S8) of the river water. The river connected directly with the Bay of Bengal shows that average electric conductivity (EC) values rising towards the sea, and its consequent values, ranged from 0.09 ± 0 to 5.83 ± 0.01 mS/cm, which was higher than the WHO’s limit of 1000 μS/cm [32]. The average spatial pH values varied from 5.78 ± 0.081 to 7.60 ± 0.193 during the in-situ study, which was within the WHO’s permissible limit (6.5–8.5) for drinking water at the upstream area [38]. In the middle and the downstream of the river, pH values were lower than the permissible values of the WHO, indicating the acidic condition of the river water. Total dissolved solids of the fifteen sampling stations fluctuated from 0.09 ± 0.001 g/L to 5.83 ± 0.015 g/L. The TDS of the river increased towards the downstream of the river which exceeded the WHO’s permissible limit of drinking water [39]. The water turbidity reported in this study was generally higher from upstream to downstream of the river. For upstream, station S1 showed the lowest the turbidity, and the highest was found in station S15. Freshwater introduction from major rainfall events and mountain waterfall might be a possible reason for low turbidity in the upstream whereas a higher amount of industrial effluent and color and washing sediments could be a reason for the higher amount of turbidity in the downstream of the river.

3.2. Concentration of Heavy Metals in Water and their Spatial Variability in the River

The concentration of the elements in the present study was likened with the permissible limit of WHO for drinking water [32] and with the permissible limit of Bangladesh public health safety to pursue the adverse impact on the biota [36]. Fe showed maximum concentration among all the stations of the studied elements. Drown by the weathering process from the earth’s crust may be the reason behind this result of Fe. The average value of eight heavy metals generally followed the decreasing order Fe > Mn > Zn > Pb > Ni > Cd > Cr > Cu but dissimilarities in this order were observed in different stations.
All elements have shown a high density in downstream from the middle of the river. The increase in the concentration of elements like Mn, Cd, Cr, Cu, Zn, Ni, and Fe was particularly high from upstream to downstream (Table 2). The study elements showed variations in different stations which are spatially depicted for the selected metal in Figure 2 and Figure 3. The concentration of Cd was increased from the middle to the downstream of the river. The mean concentration of Cd was found to be 0.017 mg/L (ranging from 0.013 to 0.029 mg/L), the concentration of Cd was higher in the downstream of the river, suggesting the increased industrial activity in this region. Combustion of coal for industrial purposes, industrial waste incineration, metal alloys, and industrial sewage runoff acted as the source for Cd in water [5,39]. Although the studied concentrations exceeded the permissible limits (0.003 mg/L for Cd) recommended by WHO, a wide range of variation was recorded for Fe (range 0.693 to 12.517 (mg/L); average: 4.336. Water samples were found to be toxic to the consumers of these elements as per the permissible values prescribed by the WHO [32]. Different oxides, hydroxides, and different weathering processes may cause this type of variation. The sources of Fe not only involved atmospheric deposition but also the weathering of rocks, and human activities such as a huge load of industrial and urban effluents [40]. Fe could possess both positive and negative impacts on the water column: the high concentration level could enhance the intake of highly toxic inorganic As (III) by aquatic organisms, thereby causing an adverse health impact, but, at the same time, it could also help in the reduction of more toxic Cr (IV) to less toxic Cr (III) and make Cd less bioavailable [40,41]. The average concentration of Mn was found to be 1.527 mg/L (ranging from 0.47 to 2.88 mg/L), thereby reaching its maximum value in the downstream (S15), exceeding the WHO’s limit of 0.500 mg/L in different stations [32]. Discharges from the adjacent power plant, paper mill, electric power generation, manufacturing of commercial refrigeration arsenal, and similar types of industry may cause a higher amount of Mn in the river water [5,42]. The concentration of Zn (mg/L) (ranging from 0.04 to 0.107) was observed with the average concentration of 0.059 mg/L which is much lower than the permissible limit of 3.000 mg/L [32]. The concentration of Cr varied between 0.003 and 0.009 (mg/L), with the highest concentration recorded at the downstream sites (S14, S12) of the river mainly because of the runoff toward the downstream [43,44]. The highest concentration was also under the WHO’s permissible limit of 0.05 mg/L and thus can possess no threat to aquatic life. The spatial concentration of Ni (mg/L) ranged between 0.002 and 0.037 (average value: 0.018) with an increasing trend toward the downstream of the river with the maximum values in (S12).
The concentration of Cu (0.004–0.011) mg/L; mean value: 0.007 mg/L) was found to be lower than the WHO’s permissible limit of 2.000 mg/L [32]. In contrast, the low concentration of the element might be related to either the microbial uptake or the low discharge of this element from different points and non-point sources [45]. The concentration of Pb throughout the upstream to the downstream of the Karnaphuli River varied between 0.003 and 0.064 mg/L (mean value: 0.022 mg/L), which exceeded the threshold values of the world average (0.0002 mg/L) as well as the permissible limit of the WHO (0.010 mg/L) [31,45]. Wastewater from industries such as the paint industry, oil industry, ship breaking industry, and cosmetic industry use Pb for various purposes that may cause it to mix with the river [46,47]. Besides, chemical manures from agricultural land in the upland area that persist in the environment might also contribute to the higher lead concentration in the river [48,49,50].
Spatial analysis was done by the inverse distance weighting (IDW) method for different values of selected metals by which we can measure the probable risky area of affecting human health [14,51]. The main justification for using this IDW method is that it can accurately calculate spatially distributed values quickly, compared to the kriging method and also inbuilt-in ArcGIS platform. The spatial distribution was done to find the variation of a metal concentration from upstream to downstream of the river, where the green color indicates the low concentration and the red color a high concentration of different metals.
For Mn and Zn, a similar pattern of high concentration is seen downstream of the river where anthropogenic and agricultural activities are dominant. Cd and Pd are observed to be moderate on the middle to high in sample stations 1 and 2 of the rivers. Karnaphuli paper industry is situated near there and huge agricultural activities occur beside sample stations 1 and 2. A moderate amount of Cd and Pb in the S8–S10 was detected, where different garment, shoe, chemical, and fertilizer industries are located. Their direct discharge could be the reason for the higher concentration of selected metal in those areas. Cr is observed from moderate to high at the upstream to the middle of the river where different industrial activities occur. Ni is observed to be higher in the middle of the river from spatial distribution. The concentration of all the measured elements in the mainstream of Karnaphuli River showed an increasing trend from upstream to downstream. However, different metal intentness does not show any specific pattern mainly due to the variability in the input of chemical load from other tributaries such as Kaptai Lake and Halda River, and also inputs from domestic and industrial effluents. Figure 2 shows that the element concentrations were very low in the upstream except Zn, Fe, Cd, and Pb. Agricultural activities and paper meal pollution in these areas may be related to these results. The elemental assemblage reaching may be very low values mainly because of the freshwater intrusion and low level of industrial discharge just before the sampling point. The concentration of most elements starts to increase and the highest peak for almost all the elements was found near (S10, S11) and (S14, S15), maybe due to the presence of unloading sites in the area. In general, the concentration of different metals showed an increasing trend along the river channel to the downstream. The population density is generally high beside the downstream region of the river, commencing population density as the major factor for elemental concentration.

3.3. Health Risk Assessment of Heavy Metals

The average annual CDI and HQ values are presented in Figure 3. Both the routes of exposure (ingestion and dermal absorption) revealed a similar decreasing trend for both the populations as: Fe > Mn > Zn > Pb > Ni > Cd > Cu > Cr, where Fe showed the highest consuming and absorbing element respectively with 0.1549 mg/L/day and 4.45 × 10⁻⁷ mg/L/day for adults and 0.2255 mg/L/day and 2.08 × 10⁻⁶ mg/L/day for children. The results also indicate the total consumption and absorption of the elements were the highest at (S14, S15) followed by (S10, S11) for both population groups (Figure 3). The calculated result of the CDI ingestion pathway shows higher exposure than dermal pathways. This study shows the same highest exposure for a child than an adult in both ingestion and dermal processes (Figure 3).
However, the CDI (ingestion) values for Fe, Cd, Mn, Pb, Ni, and Zn were found to be higher in the downstream for both adults and children, which might be attributed to the river water contamination through multiple industrial and municipal wastes. HQ and HI of different routes of exposure were used to evaluate non-carcinogenic risk. The average spatial HQ (ingestion and dermal) values were well within the safety limit (HQ < 1) except Mn and Cd, and the HQ (ingestion) of these elements was found to be much higher than HQ dermal. HQ results show that Mn and Cd had non-carcinogenic risk in the ingestion pathway for both population groups. Results also revealed that the risk is higher for children. Almost similar ingestion and dermal values were observed for both population groups in order as follows: Mn > Cd > Pb > Fe > Zn > Cr > Ni > Cu. Greater HQ dermal values of Mn and Cd were observed where a child is more affected than an adult. The present result ascertained that there might be rare chances of contamination through the exposure routes as previously discussed, and there may be very little health threat for humans in terms of surface water intake and absorption from the studied regions.
The spatial distribution of HI along the river is mapped through the IDW process by which we identified the risky stations that could have health risks in using the river water. The yellow color indicates the less hazardous area but the red color indicates the high-risk area for water use (Figure 4). The HI ingestion for adults and children ranged from 3.0816 (S4) to 8.5082 (S14) (average value: 5.136 ± 1.645) and 4.487 (S4) to 12.388 (S14) (average value: 7.478 ± 2.394), respectively, thereby suggesting non-carcinogenic health risk for both the population groups in the ingestion pathway (Figure 5). The cumulative result of HI values suggested that all the stations are below the risk limit (HI > 1) for both the population groups, although children are affected more than adults. HI, dermal values ranged from (0.002 to 0.004) for children and (0.0002 to 0.0006) for adults, which is very alarming because it is reported that one-third of a million children are affected by water-borne diseases every year [52]. The spatial distribution also demonstrated that the HI values in the downstream of the river are higher than the upstream, which might be due to the disposal of the sewages and other landfilled wastes together with terrestrial runoff, industrial effluents, and municipal waste from the city area. Thus, among the studied elements, Fe, Cd, Mn, and Pb contribute the most to the non-carcinogenic risk for both the exposure groups. The local people who lived near the river may be more affected by the river water. They have used river water for various purposes than any other [53]. If any measure were not taken to protect river water pollution from industry or other development activities, the calculated HI and HQ will become more alarming and non-carcinogenic risks using the river water will be complex.

3.4. Cancer Risk Assessment

People use water through the ingestion pathway higher than the dermal adsorptions, there is a high possibility of cancer risk through the ingestion process. However, the risk was calculated only for Cd, Pb, and, Cr as slope factor (SF) values were available only for these elements. Generally, the considered acceptable range of cancer risk ranged from 10−6 to 10−4 [27]. The calculated CR values for the elements ranged from 9.11 × 10⁻⁷ to 1.54 × 10⁻² for adults and from 1.3 × 10⁻⁶ to 2.24 × 10⁻² for children, as shown in Table 3. Although, almost every station crossed the safety limit of Cd, Cr except Pb. Therefore, Cd and Cr were considered as the major contributors of CR, and children seemed to be affected more than adults. From Figure 6, it can be seen that human health is at risk from using this river water mainly from a higher concentration of Cd. Their cumulative carcinogenic risk is more threatening than individual elemental risks.
The calculated values remained toward the higher end of the CR, which is unacceptable, and exceeding these values might pose detrimental health hazards to the exposed population. Cumulatively, the cancer risk is higher for both adults and children than individually.

3.5. Metal Pollution Index (MPI)

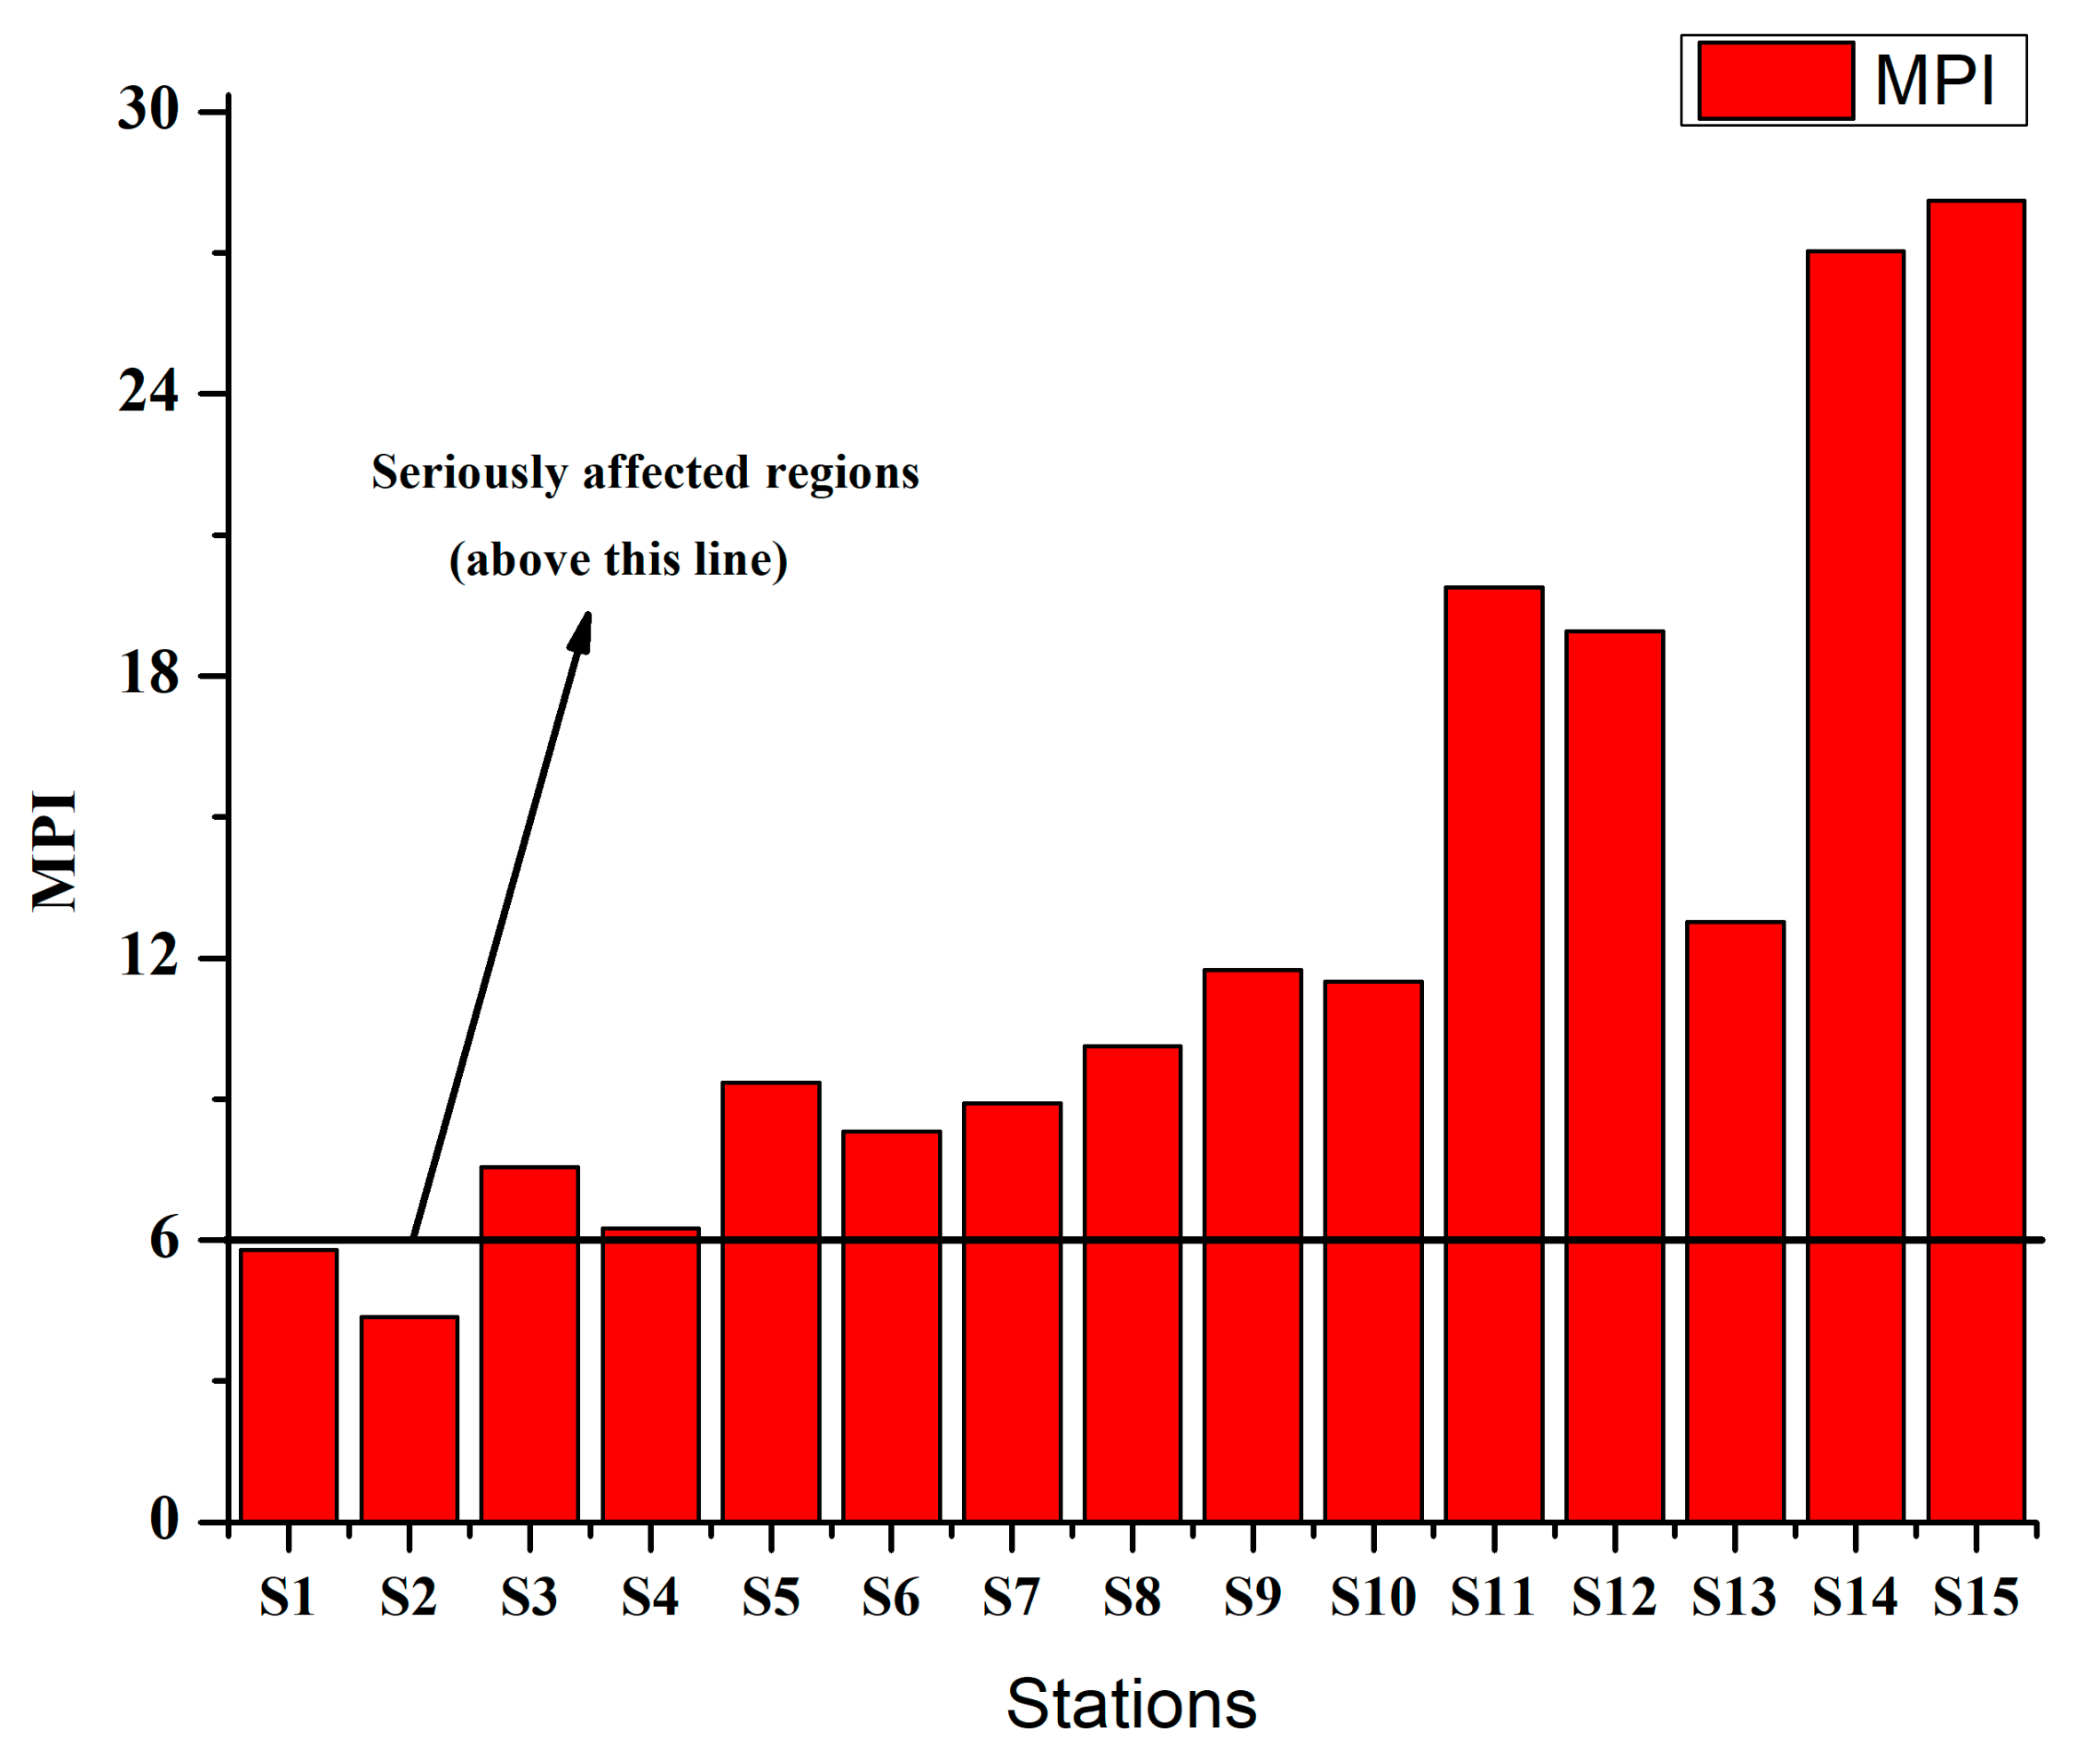
The MPI for a particular station was calculated by the sum of the ratios between the concentration of selected metals and their respective maximum allowable concentration (MAC). The contamination level was checked for understanding the pollution status of different stations using MPI. Figure 7 indicates that metal pollution in the Karnaphuli River is higher in the downstream than the upstream. The accumulation of metals from different nearby sources is responsible for this condition in the downstream of the river. MPI results showed that only S2 stood in class V, which indicates a strongly affected area where all other stations were in a seriously affected area. MPI results also indicated that the pollution level is the highest in the S14 and S15 indicating a high pollution load in these stations.

3.6. Source Identification

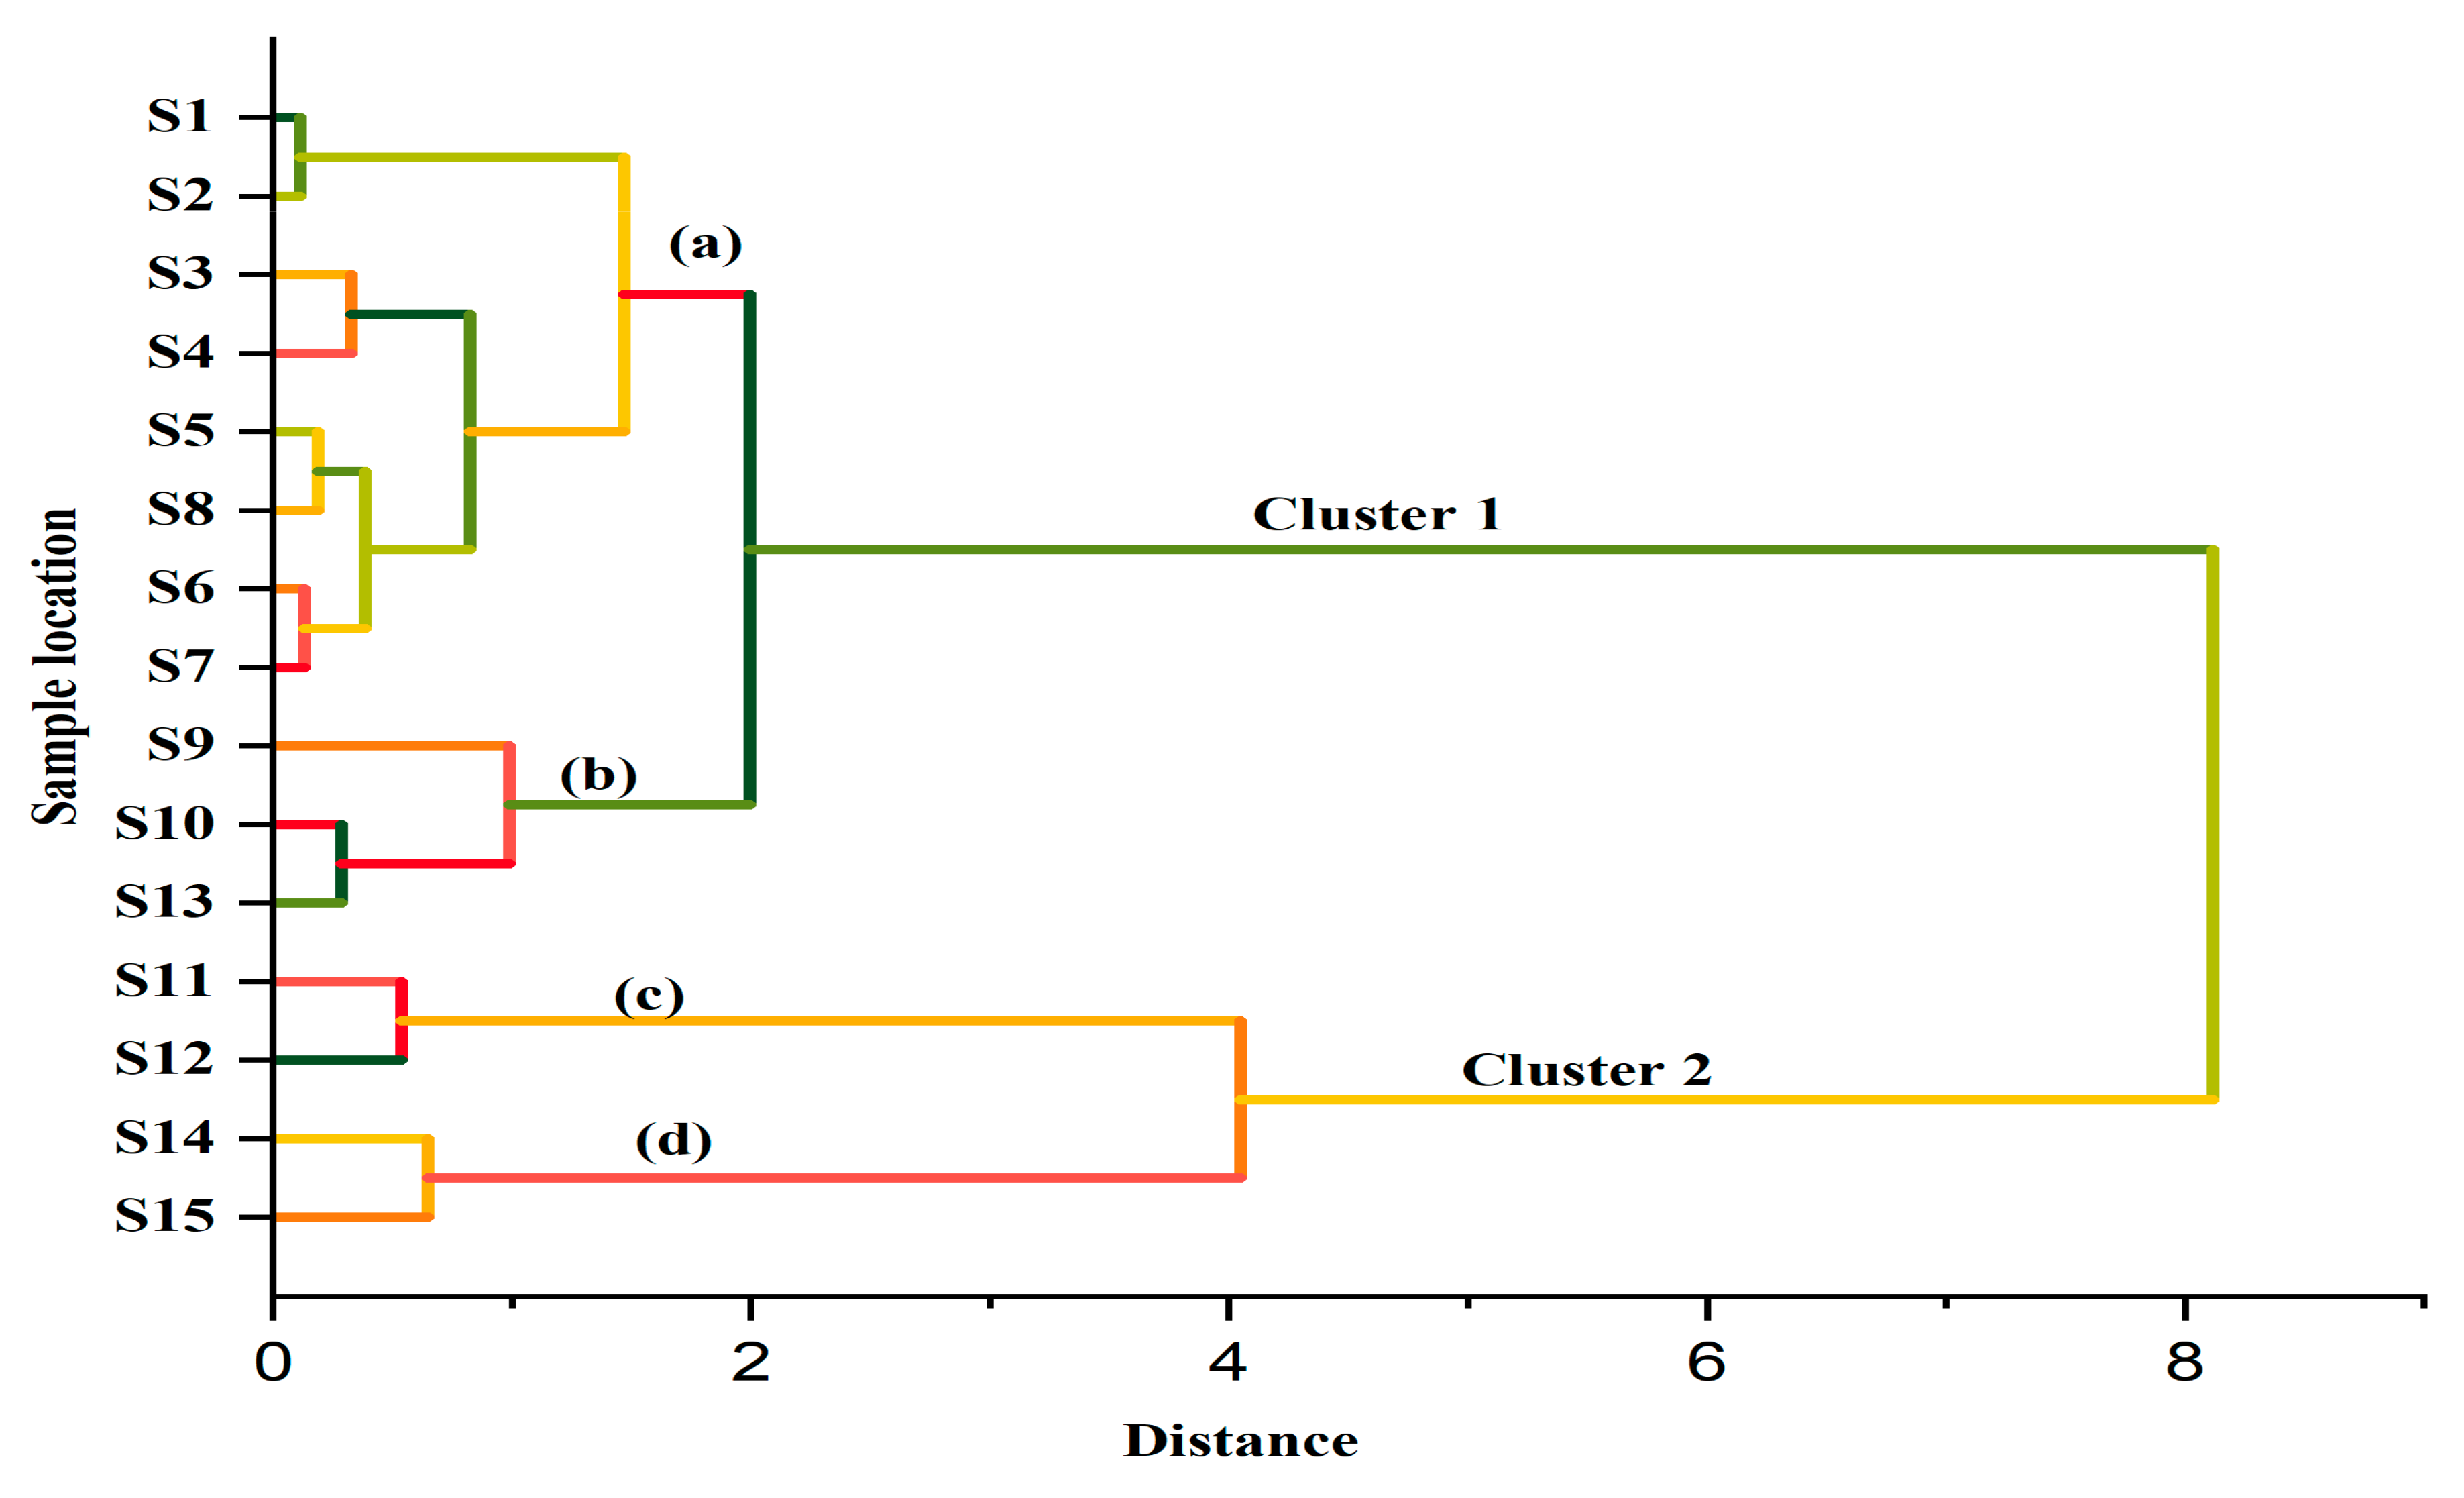
Similarity or dissimilarity between studied stations was investigated through multivariate hierarchical cluster analysis (HCA) based on sources and chemical reactivity of the elements and hydrodynamics of the river water. Ward’s method using the Euclidian distance single linkage was used as the measure of similarity [54]. The result represented two statistically significant and distinct clusters, the first cluster comprising two sub-clusters, “(a)” and “(b)”, where (a) indicates the station (S1–S8) and (b) indicates the station (S9, S10, S13)) and Cluster 2 including subclass (c and d) indicate the station (S11, S12, S14, and S15) based on similar sources of contamination (Figure 8). Huge pollution load from industry may be responsible for indication these stations separately in cluster analysis.
Stations of cluster 2, situated in the downstream region, accounted for the highest accretive concentration of the elements owing to some specific industrial stresses such as sand scavenging activities, and industrial effluents from paper cement, chemical, fertilizer, shipping, and oil industries, as well as nearby fervent power stations, etc. [16,55]. The consistency of the trace element concentrations in the contiguous stations might be ascribed to the potential unidentified point sources coupled with limited radiating impact downstream of the river. Deterioration of the water quality from point and diffuse sources is also manifested, as several elements (Pb, Mn, Fe, and Cd) exceeded the WHO’s threshold values to be considered as priority pollutants and thereby pose a considerable health concern at the studied stations. Cluster 1 may differ from cluster 2 on the sources of pollution [56]. Among two subclasses, (a) includes stations which were near the anthropogenic sources like aquaculture, agricultural activities, and paper industry, but, for (b), it may be that the differences are due to nearby chemical and salts industry [22]
Pearson’s correlation is useful for investigating associations between parameters by presenting the overall congruence of the dataset [3,57]. A Pearson’s correlation was used to identify correlations between the selected metals and physicochemical parameters. The correlation between metals is depicted in Figure 9 and shows a strong positive correlation between Cu-Fe, Cu-Mn, Cu-Zn, Fe-Mn, Fe-Zn, and Mn-Zn (p < 0.01), which indicates their common sources in the river water. A strong negative correlation between Cu-Pb, Fe-Pb, Mn-Pb, Cd-Mn, Cd-Zn, Pb-Ni, Cd-Ni, and Cr-Ni (p < 0.01) indicates that they may be derived from different sources. The overall correlation matrix among metals indicated that Ni might come from completely diverse sources which is uncommon in the case of other metals.
The correlation between physical parameters was depicted in Figure 10 with their regression trend. From the figure, a strong positive correlation between salinity-EC, salinity-TDS, salinity-turbidity, EC-TDS, EC-turbidity, and TDS-turbidity (p < 0.05) has been observed in this study. A higher concentration of sediment and saline water with higher EC in the river bed flow indicates contamination of the water in this region. High pH values promote adsorption and precipitation of metal ions in water through complex formation, while low pH values can weaken the strength of metal association resulting in clear water in the upstream rather than the downstream of the river. A negative association between temperature with the salinity, EC, TDS, turbidity (p < 0.05), and between pH with salinity, EC, TDS, and turbidity is observed.
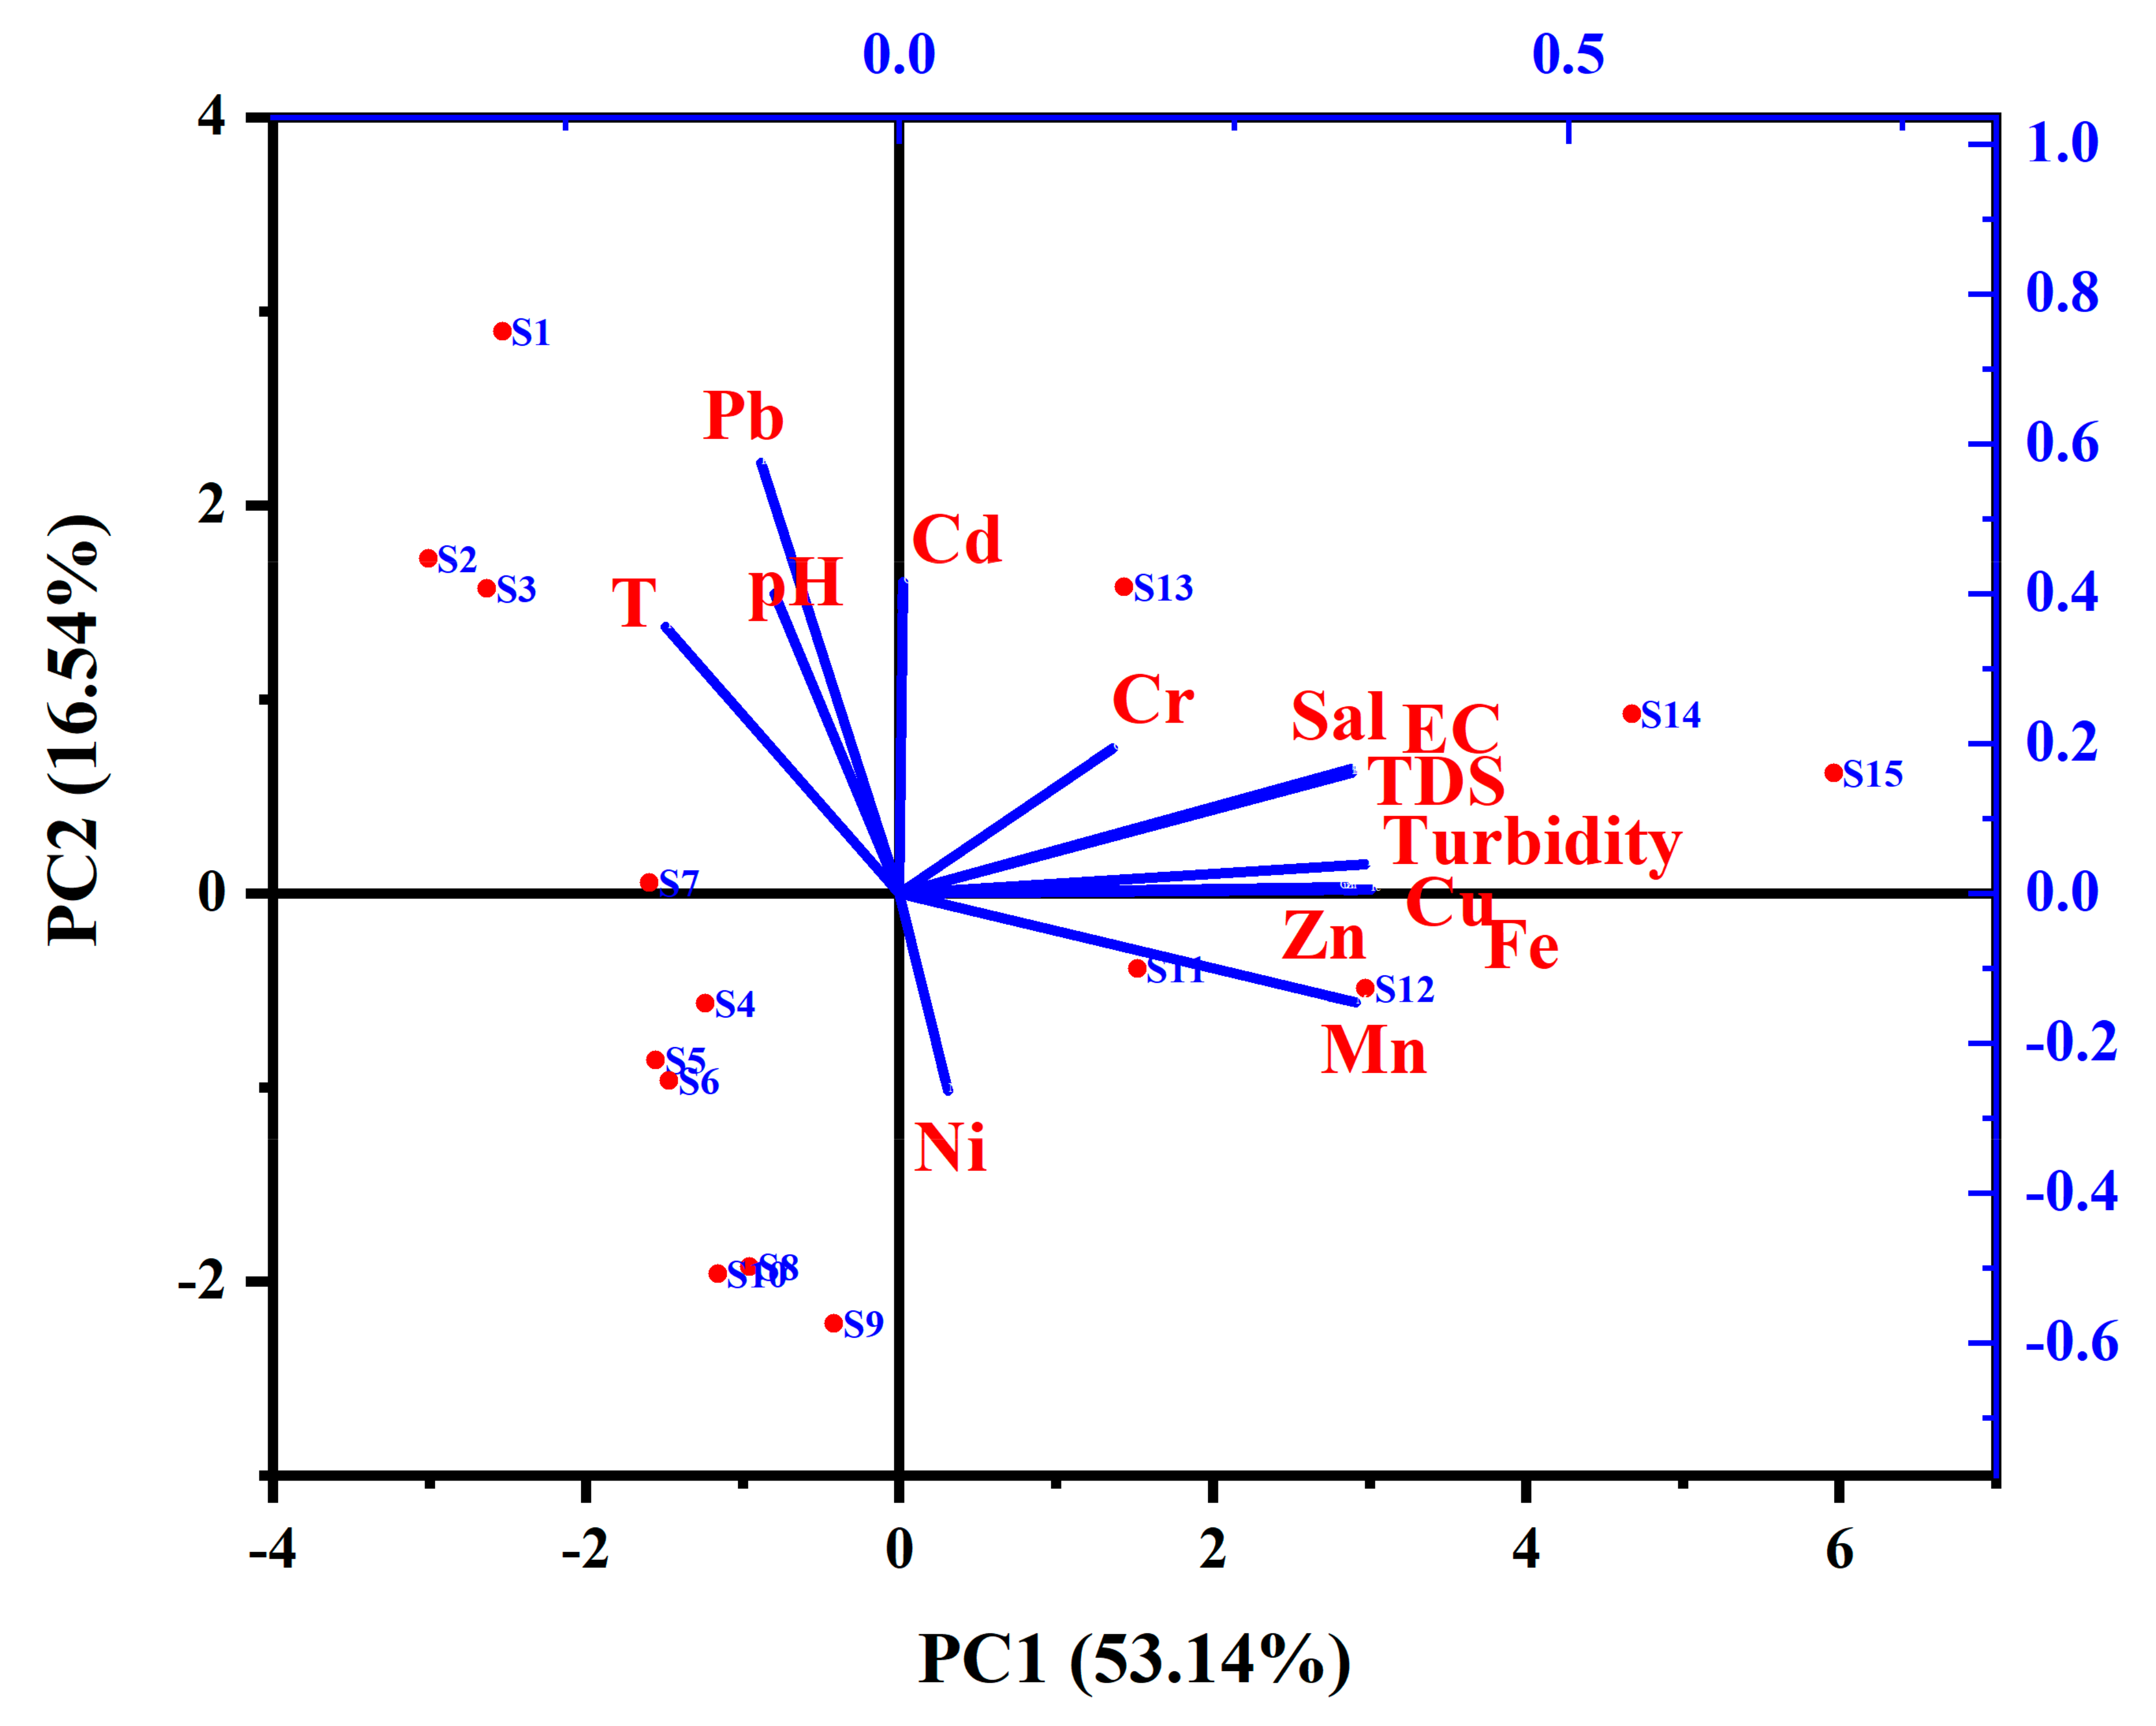
PCA was conducted to explore the trace element origins and their correlation with the water parameters by diminution of the dataset to several influencing factors. The factor loadings were classified as ‘strong’, ‘moderate’, and ‘weak’ according to the superlative loading values. Out of the PCA factors, the contribution of the first three PCA factors was the highest and accounted for 80.08% of the total variances (Figure 11). The contribution of the remaining eleven factors is not mentioned here as their contribution was very small. The first factor, PC1, was responsible for 53.14% of the total variance (eigenvalue = 7.45), and had weak correlation with increasing Cu (0.33), Fe (0.35), Mn (0.34), Zn (0.33), salinity (0.34), EC (0.34), TDS (0.34), and turbidity (0.35). Again, PC2 was responsible for 16.54% of the total variances (eigenvalue = 2.32) and had a moderately strong correlation with increasing of Pb (0.57) and was poorly correlated with temperature, pH, Cd, and Cr. Between the significant factors (eigenvalue > 1), PC3 was responsible for a 10.36% variance (eigenvalue = 1.45). Considering the PCI, it can be said that Cu, Zn, Mn, and Zn came from similar stations and correlated with physicochemical parameters: salinity, EC, TDS, and turbidity. PCA analysis indicates that Ni contribution sources are far from other sources which also support the results of the correlation matrix. Similar results of PCA analysis were observed by Salam et al. [3], in a sediment study of Perak river, Malaysia, and six major rivers in Bangladesh [15]. Scores and loading plots of PCA strongly support the results of the Pearson correlation and hierarchical cluster analysis. Huge industrial load and residential areas waste are mixing with the downstream of the river which maybe acted as the factor behind their availability in those stations. In the upstream of the river, industrial activities such as paper industry and agricultural activities and their direct mixing may be the possible reason for the factor with PC2 and their availability on those stations.

4. Conclusions

Human health risk and pollution status of Karnaphuli river water were analyzed in this study. Fe, Mn, Pb, Cd, and Ni concentrations among all studied metals were higher than the WHO’s drinking water standard. The ingestion rate of Fe, Mn, Zn, Pb, Cd, and Ni showed higher contamination among the studied metals. HQ and HI ingestion showed non-carcinogenic risk for both population groups, but dermal exposure showed no risk. Moreover, a child was more than 1.5 times more susceptible to using the river water than an adult. Carcinogenic risk analysis revealed that Cd could have a cancer risk for lifetime use of the river water. Spatial analysis and cluster analysis almost revealed the same result, where downstream of the river water is more polluted. The principal component analysis showed that natural crust producing Fe and agricultural activities releasing metal such as Zn, Mn, and Cu were higher in the river water. The overall study revealed that a huge pollution load is mixing with river water from industrial effluents and other anthropogenic activities and human health risk tendency becomes higher day by day. In this study, we used Flame AAS for water analysis which is a pristine method for water quality analysis. Using new laboratory analyses such as ICP-MS may provide more accurate and detectable results, which are very important for water quality analysis. In addition to this study, we took a one-season sample. If sampling can be done separately in the monsoon and winter seasons, then a better conclusion may be possible. In the near future, we are interested in studying the river water quality in different seasons. Therefore, this study suggests proper water management at the policy implementation level, incorporation of monitoring programs, proper waste, and wastewater treatment for the safeguarding of human health using the river water.

Author Contributions

Conceptualization, M.A.S., M.N.-E.-A. and M.F.H.; methodology, M.A.S., M.N.-E.-A. and M.F.H.; software, M.F.H. and M.N.-E.-A.; validation, M.A.S., A.E.R. and A.R.M.T.I.; formal analysis, M.N.-E.-A. and M.F.H.; investigation, M.F.H., M.A.S. and M.N.-E.-A.; resources, M.A.S.; data curation, H.R. and M.A.S.; writing—original draft preparation, M.F.H. and M.N.-E.-A.; writing—review and editing, H.R., S.C.P., B.A. and A.R.M.T.I.; visualization, M.F.H., M.N.-E.-A. and A.E.R.; supervision, M.A.S.; project administration, M.A.S.; funding acquisition, M.A.S., A.E.R. and H.R. All authors have read and agreed to the published version of the manuscript.

Funding

The work was supported by the research grants of Research Cell, Noakhali Science and Technology University (No: NSTU/RC/20/B-83).

Institutional Review Board Statement

Not applicable.

Informed Consent Statement

Not applicable.

Data Availability Statement

Data are available on the request on corresponding author.

Acknowledgments

Authors thank Bangladesh Agricultural Research Institute (BARI), Gazipur, Bangladesh for providing the laboratory facilities. The authors are also thankful to Department of Environmental Science and Disaster Management, Noakhali Science and Technology University for giving logistic support and allowing to conduct the research.

Conflicts of Interest

The authors declare no conflict of interest.

References

  1. Bhuyan, M.S.; Bakar, M.A.; Akhtar, A.; Hossain, M.B.; Ali, M.M.; Islam, M.S. Heavy Metal Contamination in Surface Water and Sediment of the Meghna River, Bangladesh. Environ. Nanotechnol. Monit. Manag. 2017, 8, 273–279. [Google Scholar] [CrossRef]
  2. Kazi, T.G.; Afridi, H.I.; Kazi, N.; Jamali, M.K.; Arain, M.B.; Jalbani, N.; Kandhro, G.A. Copper, Chromium, Manganese, Iron, Nickel, and Zinc Levels in Biological Samples of Diabetes Mellitus Patients. Biol. Trace Elem. Res. 2008, 122, 1–18. [Google Scholar] [CrossRef] [PubMed]
  3. Salam, M.A.; Kabir, M.M.; Yee, L.F.; Khan, M.S. Water Quality Assessment of Perak River, Malaysia. Pollution 2019, 5, 637–648. [Google Scholar]
  4. Salam, M.A.; Fazlin, S.; Othman, B.; Khan, S.; Kabir, M.M.; Bashundhra, R.A. Assessment of Water Quality and Sedimentary Nutrient Status of Tumpat Mangrove Swamp Forest at Kelantan Delta, Malaysia. BJoST 2019, 1, 21–28. [Google Scholar]
  5. Caruso, B.S.; Bishop, M. Seasonal and Spatial Variation of Metal Loads from Natural Flows in the Upper Tenmile Creek Watershed, Montana. Mine Water Environ. 2009, 28, 166–181. [Google Scholar] [CrossRef]
  6. Giri, S.; Singh, A.K. Assessment of Surface Water Quality Using Heavy Metal Pollution Index in Subarnarekha River, India. Water Qual. Expo. Health 2014, 5, 173–182. [Google Scholar] [CrossRef]
  7. Islam, M.S.; Ahmed, M.K.; Raknuzzaman, M.; Habibullah-Al-Mamun, M.; Islam, M.K. Heavy Metal Pollution in Surface Water and Sediment: A Preliminary Assessment of an Urban River in a Developing Country. Ecol. Indic. 2015, 48, 282–291. [Google Scholar] [CrossRef]
  8. Zhang, Y.; Guo, F.; Meng, W.; Wang, X.Q. Water Quality Assessment and Source Identification of Daliao River Basin Using Multivariate Statistical Methods. Environ. Monit. Assess. 2009, 152, 105–121. [Google Scholar] [CrossRef]
  9. Nazeer, S.; Hashmi, M.Z.; Malik, R.N. Heavy Metals Distribution, Risk Assessment and Water Quality Characterization by Water Quality Index of the River Soan, Pakistan. Ecol. Indic. 2014, 43, 262–270. [Google Scholar] [CrossRef]
  10. Jain, C.K. Metal Fractionation Study on Bed Sediments of River Yamuna, India. Water Res. 2004, 38, 569–578. [Google Scholar] [CrossRef]
  11. Wang, J.; Liu, G.; Lu, L.; Zhang, J.; Liu, H. Geochemical Normalization and Assessment of Heavy Metals (Cu, Pb, Zn, and Ni) in Sediments from the Huaihe River, Anhui, China. Catena 2015, 129, 30–38. [Google Scholar] [CrossRef]
  12. Liu, W.; Ma, L.; Li, Y.; Abuduwaili, J.; Uulu, S.A. Heavy Metals and Related Human Health Risk Assessment for River Waters in the Issyk−kul Basin, Kyrgyzstan, Central Asia. Int. J. Environ. Res. Public Health 2020, 17, 3506. [Google Scholar] [CrossRef]
  13. Singh, U.K.; Kumar, B. Pathways of Heavy Metals Contamination and Associated Human Health Risk in Ajay River Basin, India. Chemosphere 2017, 174, 183–199. [Google Scholar] [CrossRef]
  14. Emenike, P.G.C.; Tenebe, I.; Ogarekpe, N.; Omole, D.; Nnaji, C. Probabilistic Risk Assessment and Spatial Distribution of Potentially Toxic Elements in Groundwater Sources in Southwestern Nigeria. Sci. Rep. 2019, 9, 15920. [Google Scholar] [CrossRef] [Green Version]
  15. Islam, A.; Islam, H.; Mia, M.U.; Khan, R.; Habib, M.A.; Bodrud-Doza, M.; Siddique, M.; Chu, R. Co-Distribution, Possible Origins, Status and Potential Health Risk of Trace Elements in Surface Water Sources from Six Major River Basins, Bangladesh. Chemosphere 2020, 249, 126180. [Google Scholar] [CrossRef]
  16. Islam, A.T.; Shen, S.; Bodrud-Doza, M.; Rahman, M.A.; Das, S. Assessment of trace elements of groundwater and their spatial distribution in Rangpur district, Bangladesh. Arabian J. Geosci. 2017, 10, 95. [Google Scholar] [CrossRef]
  17. US Environmental Protection Agency (US EPA). Risk Assessment Guidance for Superfund, Volume I: Human Health Evaluation Manual (Part A); Office of Emergency and Remedial Response: Washington, DC, USA, 1989.
  18. Li, K.; Cui, S.; Zhang, F.; Hough, R.; Fu, Q.; Zhang, Z.; Gao, S.; An, L. Concentrations, Possible Sources and Health Risk of Heavy Metals in Multi-Media Environment of the Songhua River, China. Int. J. Environ. Res. Public Health 2020, 17, 1766. [Google Scholar] [CrossRef] [Green Version]
  19. Karim, M.; Das, S.K.; Paul, S.C.; Islam, M.F.; Hossain, M.S. Water Quality Assessment of Karrnaphuli River, Bangladesh Using Multivariate Analysis and Pollution Indices. Asian J. Environ. Ecol. 2018, 7, 1–11. [Google Scholar] [CrossRef]
  20. Ahmed, A.S.S.; Sultana, S.; Habib, A.; Ullah, H.; Musa, N.; Hossain, M.B.; Rahman, M.M.; Sarker, M.S.I. Bioaccumulation of Heavy Metals in Some Commercially Important Fishes from a Tropical River Estuary Suggests Higher Potential Health Risk in Children than Adults. PLoS ONE 2019, 14, e0219336. [Google Scholar] [CrossRef] [Green Version]
  21. Rahman, M.S.; Hossain, M.B.; Babu, S.M.O.F.; Rahman, M.; Ahmed, A.S.S.; Jolly, Y.N.; Choudhury, T.R.; Begum, B.A.; Kabir, J.; Akter, S. Source of Metal Contamination in Sediment, Their Ecological Risk, and Phytoremediation Ability of the Studied Mangrove Plants in Ship Breaking Area, Bangladesh. Mar. Pollut. Bull. 2019, 141, 137–146. [Google Scholar] [CrossRef]
  22. Bodrud-Doza, M.D.; Islam, A.T.; Ahmed, F.; Das, S.; Saha, N.; Rahman, M.S. Characterization of Groundwater Quality using Water Evaluation Indices, Multivariate Statistics and Geostatistics in Central Bangladesh. Water Sci. 2016, 30, 19–40. [Google Scholar] [CrossRef] [Green Version]
  23. Rahman, M.M.; Islam, A.R.M.T.; Shammi, M. Emerging Trends of Water Quality Monitoring and Applications of Multivariate Tools. In Water Engineering Modeling and Mathematic Tools; Samui, P., Bonakdari, H., Deo, R., Eds.; Elsevier Science Publishing Co Inc.: New York, NY, USA, 2021. [Google Scholar] [CrossRef]
  24. Wu, B.; Zhao, D.Y.; Jia, H.Y.; Zhang, Y.; Zhang, X.X.; Cheng, S.P. Preliminary Risk Assessment of Trace Metal Pollution in Surface Water from Yangtze River in Nanjing Section, China. Bull. Environ. Contam. Toxicol. 2009, 82, 405–409. [Google Scholar] [CrossRef]
  25. US Environmental Protection Agency (US EPA). Quantitative Uncertainty Analysis of Super Fund Residential Risk Path Way Models for Soil and Ground Water: White Paper; Office of Health and Environmental Assessment: Oak Ridge, TN, USA, 1996.
  26. De Miguel, E.; Iribarren, I.; Chacón, E.; Ordoñez, A.; Charlesworth, S. Risk-Based Evaluation of the Exposure of Children to Trace Elements in Playgrounds in Madrid (Spain). Chemosphere 2007, 66, 505–513. [Google Scholar] [CrossRef]
  27. US Environmental Protection Agency (US EPA). Supplemental Guidance for Developing Soil Screening Levels for Superfund Sites, Appendix D-Dispersion Factors Calculations; US Environmental Protection Agency: Washington, DC, USA, 2002.
  28. US Environmental Protection Agency (US EPA). Human Health Evaluation Manual, Supplemental Guidance, Standard Default Exposure Factors; US Environmental Protection Agency: Washington, DC, USA, 1991.
  29. US Environmental Protection Agency (US EPA). Exposure Factors Handbook; United States Environmental Protection Agency: Washington, DC, USA, 2011. Available online: http://cfpub.epa.gov/ncea/risk/recordisplay.cfm.deid.236252 (accessed on 10 September 2020).
  30. US Environmental Protection Agency (US EPA). Integrated Risk Information System (IRIS); United States Environmental Protection Agency: Washington, DC, USA, 2010. Available online: http://www.Epa.Gov/irrris/index.infml (accessed on 12 September 2020).
  31. US Environmental Protection Agency (US EPA). ENERGY STAR Overview of 2006 Achievements; United States Environmental Protection Agency: Washington, DC, USA, 2006.
  32. WHO. Guidelines for Drinking-Water Quality, 3rd ed.; Word Health Organanization: Geneva, Switzerland, 2006. [Google Scholar]
  33. Chen, S.C.; Liao, C.M. Health Risk Assessment on Human Exposed to Environmental Polycyclic Aromatic Hydrocarbons Pollution Sources. Sci. Total Environ. 2006, 366, 112–123. [Google Scholar] [CrossRef]
  34. Zhang, L.; Mo, Z.; Qin, J.; Li, Q.; Wei, Y.; Ma, S.; Xiong, Y.; Liang, G.; Qing, L.; Chen, Z.; et al. Change of Water Sources Reduces Health Risks from Heavy Metals via Ingestion of Water, Soil, and Rice in a Riverine Area, South China. Sci. Total Environ. 2015, 530–531, 163–170. [Google Scholar] [CrossRef]
  35. Bhattacharya, B.D.; Nayak, D.C.; Sarkar, S.K.; Biswas, S.N.; Rakshit, D.; Ahmed, M.K. Distribution of Dissolved Trace Metals in Coastal Regions of Indian Sundarban Mangrove Wetland: A Multivariate Approach. J. Clean. Prod. 2015, 96, 233–243. [Google Scholar] [CrossRef]
  36. Department of Public Health Engineering (DPHE). Available online: http://old.dphe.gov.bd/index.php?option=com_content&view=article&id=125&Itemid=133 (accessed on 15 September 2020).
  37. Mitra, S.; Ghosh, S.; Satpathy, K.K.; Bhattacharya, B.D.; Sarkar, S.K.; Mishra, P.; Raja, P. Water Quality Assessment of the Ecologically Stressed Hooghly River Estuary, India: A Multivariate Approach. Mar. Pollut. Bull. 2018, 126, 592–599. [Google Scholar] [CrossRef]
  38. Reza, R.; Singh, G. Heavy Metal Contamination and Its Indexing Approach for River Water. Int. J. Environ. Sci. Technol. 2010, 7, 785–792. [Google Scholar] [CrossRef] [Green Version]
  39. WHO. Water, Sanitation and Hygiene Links to Health Facts and Figures; World Health Organization: Geneva, Switzerland, 2004. [Google Scholar]
  40. Mahato, M.K.; Singh, P.K.; Tiwari, A.K. Evaluation of Metals in Mine Water and Assessment of Heavy Metal Pollution Index of East Bokaro Coalfield Area, Jharkhand, India. Int. J. Earth Sci. Eng. 2014, 7, 1611–1618. [Google Scholar]
  41. Khang, H.V.; Hatayama, M.; Inoue, C. Arsenic Accumulation by Aquatic Macrophyte Coontail (Ceratophyllum Demersum L.) Exposed to Arsenite, and the Effect of Iron on the Uptake of Arsenite and Arsenate. Environ. Exp. Bot. 2012, 83, 47–52. [Google Scholar] [CrossRef]
  42. Wu, X.; Jia, Y.; Zhu, H. Bioaccumulation of Cadmium Bound to Ferric Hydroxide and Particulate Organic Matter by the Bivalve M. Meretrix. Environ. Pollut. 2012, 165, 133–139. [Google Scholar] [CrossRef] [PubMed]
  43. Malm, O.; Pfeiffer, W.C.; Fiszman, M.; Azcue, J.M. Transport and Availability of Heavy Metals in the Paraiba Do Sul-Guandu River System, Rio de Janeiro State, Brazil. Sci. Total Environ. 1988, 75, 201–209. [Google Scholar] [CrossRef]
  44. Subrahmanyam, K.; Yadaiah, P. Assessment of the Impact of Industrial Effluents on Water Quality in Patancheru and Environs. India. Hydrogeol. 2001, 9, 297–312. [Google Scholar] [CrossRef]
  45. Lee, J.M.; Boyle, E.A.; Echegoyen-Sanz, Y.; Fitzsimmons, J.N.; Zhang, R.; Kayser, R.A. Analysis of Trace Metals (Cu, Cd, Pb, and Fe) in Seawater Using Single Batch Nitrilotriacetate Resin Extraction and Isotope Dilution Inductively Coupled Plasma Mass Spectrometry. Anal. Chim. Acta 2011, 686, 93–101. [Google Scholar] [CrossRef] [PubMed] [Green Version]
  46. Klavinš, M.; Briede, A.; Rodinov, V.; Kokorite, I.; Parele, E.; Klavina, I. Heavy Metals in Rivers of Latvia. Sci. Total Environ. 2000, 262, 175–183. [Google Scholar] [CrossRef]
  47. Buragohain, M.; Bhuyan, B.; Sarma, H.P. Seasonal Variations of Lead, Arsenic, Cadmium and Aluminium Contamination of Groundwater in Dhemaji District, Assam, India. Environ. Monit. Assess. 2010, 170, 345–351. [Google Scholar] [CrossRef] [PubMed]
  48. Wuana, R.A.; Okieimen, F.E. Heavy Metals in Contaminated Soils: A Review of Sources, Chemistry, Risks and Best Available Strategies for Remediation. ISRN Ecol. 2011, 2011, 402647. [Google Scholar] [CrossRef] [Green Version]
  49. Marchiol, L.; Assolari, S.; Sacco, P.; Zerbi, G. Phytoextraction of Heavy Metals by Canola (Brassica Napus) and Radish (Raphanus Sativus) Grown on Multicontaminated Soil. Environ. Pollut. 2004, 132, 21–27. [Google Scholar] [CrossRef]
  50. Achary, M.S.; Panigrahi, S.; Satpathy, K.K.; Prabhu, R.K.; Panigrahy, R.C. Health Risk Assessment and Seasonal Distribution of Dissolved Trace Metals in Surface Waters of Kalpakkam, Southwest Coast of Bay of Bengal. Reg. Stud. Mar. Sci. 2016, 6, 96–108. [Google Scholar] [CrossRef]
  51. Ismail, A.; Toriman, M.E.; Juahir, H.; Zain, S.M.; Habir, N.L.A.; Retnam, A.; Kamaruddin, M.K.A.; Umar, R.; Azid, A. Spatial Assessment and Source Identification of Heavy Metals Pollution in Surface Water Using Several Chemometric Techniques. Mar. Pollut. Bull. 2016, 106, 292–300. [Google Scholar] [CrossRef] [Green Version]
  52. Neff, T.M.W. Disease Control Priorities, Third Edition (Volume 2): Reproductive, Maternal, Newborn, and Child Health. Available online: https://elibrary.worldbank.org/doi/pdf/10.1596/978-1-4648-0348-2#page=183 (accessed on 26 August 2020).
  53. Paul, D. Research on Heavy Metal Pollution of River Ganga: A Review. Ann. Agrar. Sci. 2017, 15, 278–286. [Google Scholar] [CrossRef]
  54. Shin, J.Y.; Artigas, F.; Hobble, C.; Lee, Y.S. Assessment of Anthropogenic Influences on Surface Water Quality in Urban Estuary, Northern New Jersey: Multivariate Approach. Environ. Monit. Assess. 2013, 185, 2777–2794. [Google Scholar] [CrossRef]
  55. Ali, M.M.; Ali, M.L.; Islam, M.S.; Rahman, M.Z. Preliminary Assessment of Heavy Metals in Water and Sediment of Karnaphuli River, Bangladesh. Environ. Nanotechnol. Monit. Manag. 2016, 5, 27–35. [Google Scholar] [CrossRef] [Green Version]
  56. Mohiuddin, K.M.; Zakir, H.M.; Otomo, K.; Sharmin, S.; Shikazono, N. Geochemical Distribution of Trace Metal Pollutants in Water and Sediments of Downstream of an Urban River. Int. J. Environ. Sci. Technol. 2010, 7, 17–28. [Google Scholar] [CrossRef] [Green Version]
  57. Salam, M.A.; Paul, S.C.; Shaari, F.I.; Rak, A.E.; Ahmad, R.B.; Kadir, W.R. Geostatistical Distribution and Contamination Status of Heavy Metals in the Sediment of Perak River, Malaysia. Hydrology 2019, 6, 30. [Google Scholar] [CrossRef] [Green Version]
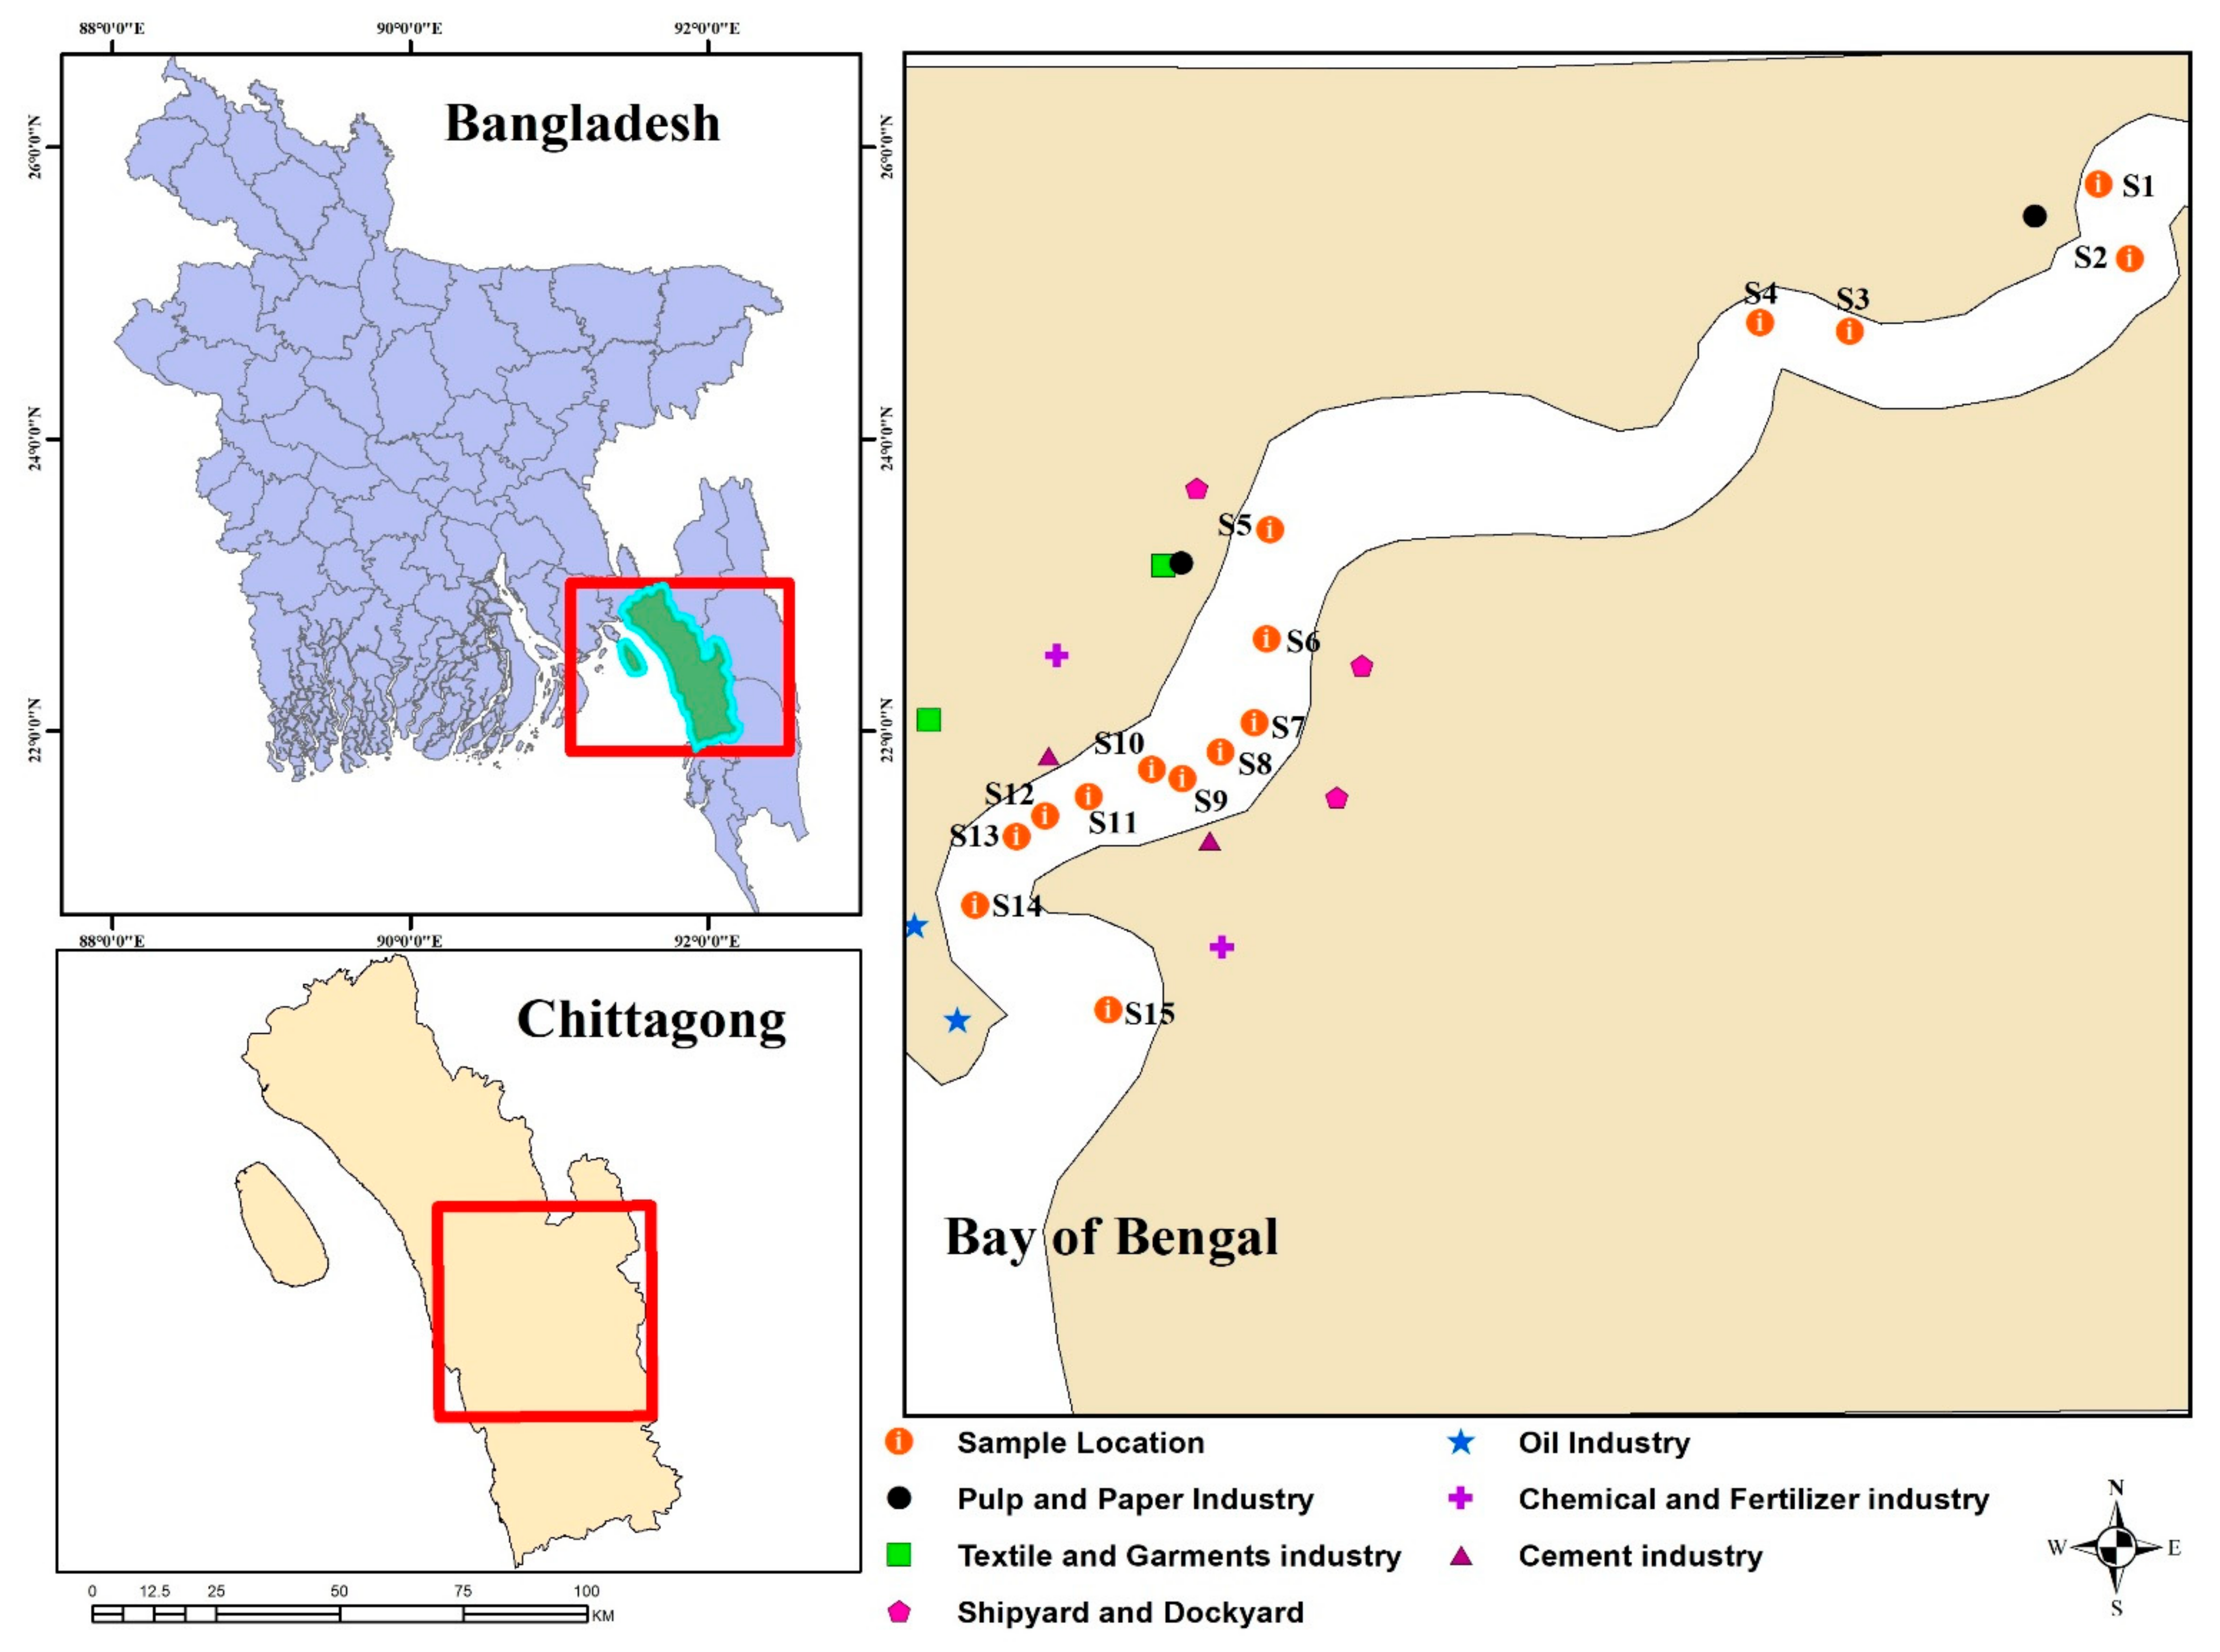
Figure 1. Map of the sampling stations showing the industrial belt.
Sustainability 13 06832 g001
Figure 2. Spatial distribution of metals in Karnaphuli river.
Sustainability 13 06832 g002
Figure 3. Graphical representation of investigated metals CDI (ingestion, dermal) and HQ (ingestion, dermal) for children and adults.
Sustainability 13 06832 g003aSustainability 13 06832 g003b
Figure 4. Spatial distribution of HI ingestion values both for adults and children.
Sustainability 13 06832 g004
Figure 5. Boxplot representation of Hazard index (HI) values.
Sustainability 13 06832 g005
Figure 6. Total Carcinogenic risks from different pathways: (a) Total carcinogenic risk for child, (b) Total carcinogenic risk for adult.
Sustainability 13 06832 g006
Figure 7. Schematic diagram of calculated metal pollution index (MPI) for selected metals.
Sustainability 13 06832 g007
Figure 8. Hierarchical cluster diagram of sites, distances reflect the degree of association between different sites based on the dissimilarity of metal concentration of surface water.
Sustainability 13 06832 g008
Figure 9. Correlation of heavy metal concentration. ** Correlation is significant at the 0.01 level (2-tailed).
Sustainability 13 06832 g009
Figure 10. Pearson’s correlation among physicochemical properties of the surface water of Karnaphuli River. * Correlation is significant at the 0.05 level (2-tailed).
Sustainability 13 06832 g010
Figure 11. Loading plot and biplot of principal component analysis for heavy metals at all of the investigated sites.
Sustainability 13 06832 g011
Table 1. Tabulation of the Physicochemical parameters of the surface water of Karnaphuli River.
Physicochemical Parameters
Sample
Station
Temperature
(°C)
pHSalinityEC
(mS/cm)
TDS
(g/L)
Turbidity
(NTU)
S130.57.00 ± 0.1200.09 ± 0.0020.09 ± 0.0024.93 ± 0.91
S231.97.12 ± 0.3300.10 ± 0.0150.10 ± 0.0155.22 ± 0.98
S330.97.60 ± 0.1900.15 ± 0.0170.15 ± 0.01720.23 ± 2.2
S429.87.25 ± 0.1200.09 ± 00.09 ± 0.0016.33 ± 0.77
S530.06.83 ± 0.0500.13 ± 0.0350.13 ± 0.03540.10 ± 12.23
S629.85.86 ± 0.1600.13 ± 0.0060.13 ± 0.00632.37 ± 1.95
S730.15.78 ± 0.0800.14 ± 0.0340.14 ± 0.03539.20 ± 4.39
S830.25.92 ± 0.1400.12 ± 0.0110.12 ± 0.01146.13 ± 6.5
S929.95.86 ± 0.0600.19 ± 0.0160.19 ± 0.01734.47 ± 19.73
S1030.25.93 ± 0.1100.17 ± 0.0070.17 ± 0.00786.10 ± 7.65
S1130.36.36 ± 0.251.67 ± 0.213.19 ± 0.373.19 ± 0.36115.03 ± 31.41
S1230.06.61 ± 0.182.90 ± 0.175.30 ± 0.2795.31 ± 0.284125.93 ± 21.69
S1330.46.50 ± 0.43.00 ± 0.15.44 ± 0.2165.44 ± 0.22692.73 ± 19.13
S1429.96.24 ± 0.083.03 ± 0.065.59 ± 0.1255.59 ± 0.122242.30 ± 37.62
S1529.96.39 ± 0.23.20 ± 05.83 ± 0.015.83 ± 0.015319.93 ± 73.24
Mean30.36.48 ± 0.60.92 ± 1.3910.38 ± 0.0761.78 ± 2.4880.73 ± 91.19
Range29.8–31.95.78–7.600–3.200.09–5.830.09–5.834.93–319.93
Bangladesh
Standard
20–30-0-110
WHO-6.5–8.5-1--
Table 2. Tabulation of the heavy metals of the surface water of Karnaphuli River.
Heavy Metals (mg/L)
Sample
Station
CuFeMnZnPbCdCrNi
S10.006 ± 0.0020.75 ± 0.070.56 ± 0.150.043 ± 0.0060.064 ± 0.0160.029 ± 0.0080.007 ± 0.0010.017 ± 0.004
S20.006 ± 0.0010.69 ± 0.210.47 ± 0.090.047 ± 0.0060.037 ± 0.0080.018 ± 0.0060.003 ± 0.0010.014 ± 0.003
S30.004 ± 0.0011.66 ± 0.371.04 ± 0.180.043 ± 0.0060.058 ± 0.0140.014 ± 0.0030.006 ± 0.0010.017 ± 0.008
S40.007 ± 0.0011.45 ± 0.610.79 ± 0.110.067 ± 0.0060.006 ± 0.0030.017 ± 0.0030.006 ± 0.0020.024 ± 0.006
S50.005 ± 0.0012.26 ± 0.641.43 ± 0.330.05 ± 0.010.005 ± 0.0020.014 ± 0.0020.005 ± 0.0010.008 ± 0.001
S60.005 ± 0.0012.17 ± 0.711.13 ± 0.120.047 ± 0.0150.007 ± 0.0020.016 ± 0.0030.007 ± 0.0020.002 ± 0.002
S70.005 ± 0.0012.29 ± 0.821.16 ± 0.280.04 ± 0.010.037 ± 0.210.018 ± 0.0030.008 ± 0.0010.008 ± 0.001
S80.007 ± 0.0012.27 ± 0.621.62 ± 0.480.053 ± 0.0150.007 ± 0.0020.014 ± 0.0040.005 ± 0.0030.028 ± 0.01
S90.008 ± 0.0012.93 ± 0.841.85 ± 0.230.063 ± 0.0120.003 ± 0.0010.013 ± 0.0030.003 ± 0.0020.019 ± 0.009
S100.006 ± 0.0023.82 ± 0.591.4 ± 0.160.043 ± 0.0150.004 ± 0.0020.017 ± 0.0050.003 ± 0.0010.037 ± 0.013
S110.007 ± 0.0028.49 ± 1.782.09 ± 0.80.057 ± 0.0150.007 ± 0.0040.016 ± 0.0030.008 ± 0.0020.024 ± 0.008
S120.009 ± 0.0017.96 ± 1.482.02 ± 0.530.083 ± 0.0120.007 ± 0.0020.016 ± 0.0030.003 ± 0.0020.03 ± 0.007
S130.007 ± 0.0023.9 ± 1.341.67 ± 0.620.067 ± 0.0210.050 ± 0.0190.016 ± 0.0050.004 ± 0.0010.008 ± 0.003
S140.010 ± 0.00211.88 ± 2.192.79 ± 0.290.08 ± 0.010.024 ± 0.0260.019 ± 0.0050.009 ± 0.0020.012 ± 0.003
S150.011 ± 0.00112.52 ± 1.822.88 ± 0.480.107 ± 0.0120.013 ± 0.0110.019 ± 0.0050.009 ± 0.0020.018 ± 0.005
Mean0.007 ± 0.0024.34 ± 3.931.53 ± 0.720.059 ± 0.0190.022 ± 0.0220.017 ± 0.0040.006 ± 0.0020.018 ± 0.01
Range0.004–0.0110.693–12.5170.470–2.8800.04–0.1070.003–0.0640.013–0.0290.003–0.0090.002–0.037
Bangladesh
Standard
10.3–1.00.150.050.0050.050.1
WHO2.0000.3000.5003.0000.0100.0030.0500.020
Table 3. Spatial Cancer Risk (CR) distribution of selected elements through the ingestion of water for adults and children.
AdultStationChild
PbCdCr PbCdCr
1.95 × 10−51.54 × 10−21.19 × 10−412.84 × 10−52.24 × 10−21.73 × 10⁻⁴
1.11 × 10−59.82 × 10−35.36 × 10−521.62 × 10−51.43 × 10−27.80 × 10⁻⁵
1.75 × 10−57.32 × 10−31.07 × 10−432.55 × 10−51.07 × 10−21.56 × 10⁻⁴
1.72 × 10−69.11 × 10−31.13 × 10−442.50 × 10−61.33 × 10−21.65 × 10⁻⁴
1.62 × 10−67.50 × 10−38.33 × 10−552.36 × 10−61.09 × 10−21.21 × 10⁻⁴
2.12 × 10−68.75 × 10−31.25 × 10−q463.09 × 10−61.27 × 10−21.82 × 10−4
1.13 × 10−59.46 × 10−31.37 × 10−471.65 × 10−51.38 × 10−21.99 × 10⁻⁴
2.23 × 10−67.32 × 10−38.33 × 10−583.24 × 10−61.07 × 10−21.21 × 10⁻⁴
9.11 × 10−77.14 × 10−35.95 × 10−591.33 × 10−61.04 × 10−28.67 × 10⁻⁵
1.11 × 10−69.29 × 10−35.36 × 10−5101.62 × 10−61.35 × 10−27.80 × 10−5
2.02 × 10−68.75 × 10−31.37 × 10−4112.95 × 10−61.27 × 10−21.99 × 10−4
2.23 × 10−68.75 × 10−35.95 × 10−5123.24 × 10−61.27 × 10−28.67 × 10−5
1.52 × 10−58.57 × 10−37.14 × 10−5132.21 × 10−51.25 × 10−21.04 × 10−4
7.18 × 10−61.02 × 10−21.67 × 10−4141.05 × 10−51.48 × 10−22.43 × 10−4
3.85 × 10−61.02 × 10−21.61 × 10−4155.60 × 10−61.48 × 10−22.34 × 10−4
Publisher’s Note: MDPI stays neutral with regard to jurisdictional claims in published maps and institutional affiliations.