
Eco-Efficiency and Human Capital Efficiency: Example of Small- and Medium-Sized Family Farms in Selected European Countries


Abstract
:1. Introduction
2. Materials and Methods
3. Results and Discussion
4. Conclusions
Funding
Data Availability Statement
Conflicts of Interest
Appendix A

| Effect | Multivariate Tests of Significance, Sigma-Restricted Parameterisation and Effective Hypothesis Decomposition | |||||
|---|---|---|---|---|---|---|
| Test | Value | F | Effect df | Error df | p | |
| Lithuania | ||||||
| Intercept | Wilks | 0.03197 | 7215.209 | 4 | 953 | 0 |
| Pillai’s | 0.96803 | 7215.209 | 4 | 953 | 0 | |
| Hotelling’s | 30.28419 | 7215.209 | 4 | 953 | 0 | |
| Roy’s | 30.28419 | 7215.209 | 4 | 953 | 0 | |
| Class–Economic Measure | Wilks | 0.44485 | 75.272 | 12 | 2521.693 | 0 |
| Pillai’s | 0.57154 | 56.19 | 12 | 2865 | 0 | |
| Hotelling’s | 1.2113 | 96.063 | 12 | 2855 | 0 | |
| Roy’s | 1.18056 | 281.859 | 4 | 955 | 0 | |
| Moldavia | ||||||
| Intercept | Wilks | 0.0015 | 87,392.7 | 4 | 525 | 0 |
| Pillai’s | 0.9985 | 87,392.7 | 4 | 525 | 0 | |
| Hotelling’s | 665.8491 | 87,392.7 | 4 | 525 | 0 | |
| Roy’s | 665.8491 | 87,392.7 | 4 | 525 | 0 | |
| Class–Economic Measure | Wilks | 0.4659 | 38.75 | 12 | 1389.311 | 0 |
| Pillai’s | 0.5445 | 29.22 | 12 | 1581 | 0 | |
| Hotelling’s | 1.1243 | 49.06 | 12 | 1571 | 0 | |
| Roy’s | 1.1043 | 145.49 | 4 | 527 | 0 | |
| Poland | ||||||
| Intercept | Wilks | 0.01241 | 13,703.89 | 4 | 689 | 0 |
| Pillai’s | 0.98759 | 13,703.89 | 4 | 689 | 0 | |
| Hotelling’s | 79.55813 | 13,703.89 | 4 | 689 | 0 | |
| Roy’s | 79.55813 | 13,703.89 | 4 | 689 | 0 | |
| Class–Economic Measure | Wilks | 0.55019 | 38.5 | 12 | 1823.214 | 0 |
| Pillai’s | 0.45182 | 30.63 | 12 | 2073 | 0 | |
| Hotelling’s | 0.81391 | 46.64 | 12 | 2063 | 0 | |
| Roy’s | 0.80941 | 139.83 | 4 | 691 | 0 | |
| Romania | ||||||
| Intercept | Wilks | 0.001 | 255,497 | 4 | 865 | 0 |
| Pillai’s | 0.999 | 255,497 | 4 | 865 | 0 | |
| Hotelling’s | 1181.489 | 255,497 | 4 | 865 | 0 | |
| Roy’s | 1181.489 | 255,497 | 4 | 865 | 0 | |
| Class–Economic Measure | Wilks | 0.788 | 17.9 | 12 | 2288.866 | 0 |
| Pillai’s | 0.221 | 17.2 | 12 | 2601 | 0 | |
| Hotelling’s | 0.257 | 18.5 | 12 | 2591 | 0 | |
| Roy’s | 0.199 | 43.1 | 4 | 867 | 0 | |
| Serbia | ||||||
| Intercept | Wilks | 0.0024 | 53,456.87 | 4 | 517 | 0 |
| Pillai’s | 0.9976 | 53,456.87 | 4 | 517 | 0 | |
| Hotelling’s | 413.5928 | 53,456.87 | 4 | 517 | 0 | |
| Roy’s | 413.5928 | 53,456.87 | 4 | 517 | 0 | |
| Class–Economic Measure | Wilks | 0.7117 | 15.64 | 12 | 1368.145 | 0 |
| Pillai’s | 0.2904 | 13.91 | 12 | 1557 | 0 | |
| Hotelling’s | 0.4022 | 17.28 | 12 | 1547 | 0 | |
| Roy’s | 0.3948 | 51.22 | 4 | 519 | 0 | |
| Approximate Probabilities for Post Hoc Test Error: MS = 7.7283, df = 956.00 | ||||
| Class | A | B | C | D |
| Lithuania | ||||
| A | 0.000008 | 0.000008 | 0.000008 | |
| B | 0.000008 | 0.000008 | 0.000008 | |
| C | 0.000008 | 0.000008 | 0.000008 | |
| D | 0.000008 | 0.000008 | 0.000008 | |
| Moldavia | ||||
| Approximate Probabilities for Post Hoc Test Error: MS = 0.00800, df = 528.00 | ||||
| A | 0.175025 | 0.000008 | 0.000008 | |
| B | 0.175025 | 0.003461 | 0.000008 | |
| C | 0.000008 | 0.003461 | 0.000008 | |
| D | 0.000008 | 0.000008 | 0.000008 | |
| Poland | ||||
| Approximate Probabilities for Post Hoc Test Error: MS = 0.00831, df = 692.00 | ||||
| A | 0.042334 | 0.000008 | 0.000008 | |
| B | 0.042334 | 0.001839 | 0.000008 | |
| C | 0.000008 | 0.001839 | 0.000008 | |
| D | 0.000008 | 0.000008 | 0.000008 | |
| Romania | ||||
| Approximate Probabilities for Post Hoc Test Error: MS = 0.01336, df = 868.00 | ||||
| A | 0.953136 | 0.449550 | 0.000008 | |
| B | 0.953136 | 0.186084 | 0.000008 | |
| C | 0.449550 | 0.186084 | 0.000008 | |
| D | 0.000008 | 0.000008 | 0.000008 | |
| Serbia | ||||
| Approximate Probabilities for Post Hoc Test Error: MS = 0.00384, df = 520.00 | ||||
| A | 0.568489 | 0.004685 | 0.000008 | |
| B | 0.568489 | 0.170860 | 0.000008 | |
| C | 0.004685 | 0.170860 | 0.000008 | |
| D | 0.000008 | 0.000008 | 0.000008 | |
| Approximate Probabilities for Post Hoc Test Error: MS = 0.37664, df = 956.00 | ||||
| Class | A | B | C | D |
| Lithuania | ||||
| A | 0.040667 | 0.000010 | 0.000008 | |
| B | 0.040667 | 0.069839 | 0.000008 | |
| C | 0.000010 | 0.069839 | 0.000008 | |
| D | 0.000008 | 0.000008 | 0.000008 | |
| Moldavia | ||||
| Approximate Probabilities for Post Hoc Test Error: MS = 0.05969, df = 528.00 | ||||
| A | 0.721033 | 0.007419 | 0.000008 | |
| B | 0.721033 | 0.135821 | 0.000008 | |
| C | 0.007419 | 0.135821 | 0.000008 | |
| D | 0.000008 | 0.000008 | 0.000008 | |
| Poland | ||||
| Approximate Probabilities for Post Hoc Test Error: MS = 0.19308, df = 692.00 | ||||
| A | 0.995328 | 0.029125 | 0.000008 | |
| B | 0.995328 | 0.055737 | 0.000008 | |
| C | 0.029125 | 0.055737 | 0.000739 | |
| D | 0.000008 | 0.000008 | 0.000739 | |
| Romania | ||||
| Approximate Probabilities for Post Hoc Test Error: MS = 0.23331, df = 868.00 | ||||
| A | 0.652231 | 0.870734 | 0.138152 | |
| B | 0.652231 | 0.978958 | 0.005210 | |
| C | 0.870734 | 0.978958 | 0.018855 | |
| D | 0.138152 | 0.005210 | 0.018855 | |
| Serbia | ||||
| Approximate Probabilities for Post Hoc Test Error: MS = 0.01240, df = 520.00 | ||||
| A | 0.982202 | 0.231287 | 0.000008 | |
| B | 0.982202 | 0.426294 | 0.000008 | |
| C | 0.231287 | 0.426294 | 0.000008 | |
| D | 0.000008 | 0.000008 | 0.000008 | |
References
- Kostov, P.; Lingard, J. Subsistence agriculture in transition economies: Its roles and determinants. J. Agric. Econ. 2004, 55, 565–579. [Google Scholar] [CrossRef]
- Mathijs, E.; Noev, N. Subsistence farming in Central and Eastern Europe—Empirical evidence from Albania, Bulgaria, Hungary, and Romania. East. Eur. Econ. 2004, 42, 72–89. [Google Scholar] [CrossRef]
- Davidova, S.; Fredriksson, L.; Bailey, A. Subsistence and semi-subsistence farming in selected EU new member states. Agric. Econ. 2009, 40, 733–744. [Google Scholar] [CrossRef] [Green Version]
- Wiggins, S.; Kirsten, J.; Llambi, L. The Future of Small Farms. World Dev. 2010, 38, 1341–1348. [Google Scholar] [CrossRef]
- Pari, L.; Suardi, A.; Forleo, M.B.; Coaloa, D.; Palmieri, N. Environmental Impacts and Economic Performance of Major Oil Crops in Italy. In Proceedings of the 26th European Biomass Conference: Setting the Course for a Biobased Economy, Copenhagen, Denmark, 14–18 May 2018; pp. 1444–1449. [Google Scholar]
- Gancone, A.; Pubule, J.; Rosa, M.; Blumberga, D. Evaluation of agriculture eco-efficiency in Latvia. In Proceedings of the International Scientific Conference—Environmental and Climate Technologies (Conect 2017), Riga, Latvia, 10–12 May 2017; Volume 128, pp. 309–315. [Google Scholar] [CrossRef]
- Becker, B.E.; Huselid, M.A. Strategic human resource management: Where do we go from here? J. Manag. 2006, 32, 898–925. [Google Scholar] [CrossRef] [Green Version]
- Schultz, T.W. Inwestment in Human Capital; The Free Press: New York, NY, USA, 1976. [Google Scholar]
- Odonkor, S.T.; Adom, P.K. Environment and health nexus in Ghana: A study on perceived relationship and willingness-to-participate (WTP) in environmental policy design. Urban Clim. 2020, 34, 12. [Google Scholar] [CrossRef]
- Stępień, S.; Czyżewski, B.; Sapa, A.; Borychowski, M.; Poczta, W.; Poczta-Wajda, A. Eco-efficiency of small-scale farming in Poland and its institutional drivers. J. Clean. Prod. 2021, 279, 123721. [Google Scholar] [CrossRef]
- Matuszczak, A.; Kryszak, L.; Czyzewski, B.; Lopatka, A. Environment and political economics: Left-wing liberalism or conservative leftism—Which is better for eco-efficiency? Evidence from Poland. Sci. Total Environ. 2020, 743, 140779. [Google Scholar] [CrossRef]
- Czyżewski, B.; Guth, M. Impact of Policy and Factor Intensity on Sustainable Value of European Agriculture: Exploring Trade-Offs of Environmental, Economic and Social Efficiency at the Regional Level. Agriculture 2021, 11, 78. [Google Scholar] [CrossRef]
- Czyżewski, B.; Matuszczak, A.; Muntean, A. Approaching environmental sustainability of agriculture: Environmental burden, eco-efficiency or eco-effectiveness. Agric. Econ. Zemed. Ekon. 2019, 65, 299–306. [Google Scholar] [CrossRef]
- Dimopoulos, P.; Kokkoris, I.P. Protection and Management of Species, Habitats, Ecosystems and Landscapes: Current Trends and Global Needs. Forests 2020, 11, 1244. [Google Scholar] [CrossRef]
- Becker, G.S. Human Capital; NBER: New York, NY, USA, 1975. [Google Scholar]
- Laroche, M.; Merette, M.; Ruggeri, G.C. On the concept and dimensions of human capital in a knowledge-based economy context. Can. Public Policy Anal. Polit. 1999, 25, 87–100. [Google Scholar] [CrossRef]
- Crook, T.R.; Todd, S.Y.; Combs, J.G.; Woehr, D.J.; Ketchen, D.J. Does Human Capital Matter? A Meta-Analysis of the Relationship Between Human Capital and Firm Performance. J. Appl. Psychol. 2011, 96, 443–456. [Google Scholar] [CrossRef]
- Kwilinski, A.; Vyshnevskyi, O.; Dzwigol, H. Digitalization of the EU Economies and People at Risk of Poverty or Social Exclusion. J. Risk Financ. Manag. 2020, 13, 142. [Google Scholar] [CrossRef]
- Youndt, M.A.; Snell, S.A.; Dean, J.W.; Lepak, D.P. Human resource management, manufacturing strategy, and firm performance. Acad. Manag. J. 1996, 39, 836–866. [Google Scholar] [CrossRef]
- Chen, M.C.; Cheng, S.J.; Hwang, Y.C. An empirical investigation of the relationship between intellectual capital and firms’ market value and financial performance. J. Intellect. Cap. 2005, 6, 159–167. [Google Scholar] [CrossRef]
- Dess, G.G.; Shaw, J.D. Voluntary turnover, social capital, and organizational performance. Acad. Manag. Rev. 2001, 26, 446–456. [Google Scholar] [CrossRef]
- Grant, R.M. Prospering in dynamically-competitive environments: Organizational capability as knowledge integration. Organ. Sci. 1996, 7, 375–387. [Google Scholar] [CrossRef]
- Kor, Y.Y.; Mahoney, J.T. How dynamics, management, and governance of resource deployments influence firm-level performance. Strateg. Manag. J. 2005, 26, 489–496. [Google Scholar] [CrossRef]
- Kwon, H. Economic Theories of Low-Wage Work. J. Hum. Behav. Soc. Environ. 2014, 24, 61–70. [Google Scholar] [CrossRef]
- Yoon, G.W.; Ryu, S.H. A Study of the Human Capital Efficiency in the Korean Online Game Business using Non-parametric Analysis Model (DEA). J. Korea Game Soc. 2009, 9, 81–94. [Google Scholar]
- Mandrzejewska-Smól, I. Wiek i doświadczenie jako atrybuty działalności zawodowej. In Praca Człowieka w XXI Wieku: Konteksty —Wyzwania—Zagrożenia; Gerlach, R., Ed.; Wydawnictwo Uniwersytetu Kazimierza Wielkiego: Bydgoszcz, Poland, 2008; (Age and experience as attributes of professional activity. In Human Work in XXI Century: Contexts—Challenges—Threats; Gerlach, R., Ed.; Publishing House of the Kazimierz Wielki University: Bydgoszcz, Poland, 2008). [Google Scholar]
- Göbel, C.; Zwick, T. Which personnel measures are effective in increasing productivity of old workers? Are personnel measures effective in increasing productivity of old workers? Labour Econ. 2013, 22, 80–93. [Google Scholar] [CrossRef]
- Ruzik-Sierdzińska, A.; Lis, M.; Potoczna, M.; Belloni, M.; Villosio, C. Age and Productivity. Human Capital Accumulation and Depreciation; CASE Network Reports, No. 114/2013; CASE-Center for Social and Economic Research: Warszawa, Poland, 2012. [Google Scholar]
- Jeffery, M.L.; Guetschow, J.; Gieseke, R.; Gebel, R. PRIMAP-crf: UNFCCC CRF data in IPCC 2006 categories. Earth Syst. Sci. Data 2018, 10, 1427–1438. [Google Scholar] [CrossRef] [Green Version]
- Borychowski, M.; Stepien, S.; Polcyn, J.; Tosovic-Stevanovic, A.; Calovic, D.; Lalic, G.; Zuza, M. Socio-Economic Determinants of Small Family Farms’ Resilience in Selected Central and Eastern European Countries. Sustainability 2020, 12, 10362. [Google Scholar] [CrossRef]
- Wojdalski, J.; Niżnikowski, R. Energia, woda i środowisko w produkcji mleczarskiej —Zarys problematyki. Przegląd Hod. 2019, 87, 24–29, (Energy, water and environment in dairy production—An outline of issues. Anim. Prod. Rev. 2019, 87, 24–29). [Google Scholar]
- Zhang, Y.L.; Xiao, X.; Cao, R.B.; Zheng, C.H.; Guo, Y.R.; Gong, W.X.; Wei, Z.C. How important is community participation to eco-environmental conservation in protected areas? From the perspective of predicting locals’ pro-environmental behaviours. Sci. Total Environ. 2020, 739, 10. [Google Scholar] [CrossRef]
- Charmondusit, K.; Phatarachaisakul, S.; Prasertpong, P. The quantitative eco-efficiency measurement for small and medium enterprise: A case study of wooden toy industry. Clean Technol. Environ. Policy 2014, 16, 935–945. [Google Scholar] [CrossRef]
- Anwar, S.N.B.M.; Alvarado, V.; Hsu, S.-C. A socio-eco-efficiency analysis of water and wastewater treatment processes for refugee communities in Jordan. Resour. Conserv. Recycl. 2021, 164, 105196. [Google Scholar] [CrossRef]
- Spitzeck, H.; Chapman, S. Creating shared value as a differentiation strategy—The example of BASF in Brazil. Corp. Gov. Int. J. Bus. Soc. 2012, 12, 499–510. [Google Scholar] [CrossRef] [Green Version]
- Kharazishvili, Y.; Kwilinski, A.; Grishnova, O.; Dzwigol, H. Social Safety of Society for Developing Countries to Meet Sustainable Development Standards: Indicators, Level, Strategic Benchmarks (with Calculations Based on the Case Study of Ukraine). Sustainability 2020, 12, 8953. [Google Scholar] [CrossRef]
- Matuszczak, A. Ewolucja Kwestii Agrarnej a Środowiskowe Dobra Publiczne; Instytut Ekonomiki Rolnictwa i Gospodarki Żywnościowej—Państwowy Instytut Badawczy: Warszawa, Poland, 2020; (Evolution of the Agrarian Issue and Environmental Public Goods; Institute of Agricultural and Food Economics—National Research Institute: Warsaw, Poland, 2020). [Google Scholar]
- Staniszewski, J. Attempting to Measure Sustainable Intensification of Agriculture in Countries of The European Union. J. Environ. Prot. Ecol. 2018, 19, 949–957. [Google Scholar]
- Polakova, J.; Soukup, J. Results of Implementing Less-Favoured Area Subsidies in the 2014-2020 Time Frame: Are the Measures of Environmental Concern Complementary? Sustainability 2020, 12, 10534. [Google Scholar] [CrossRef]
- Jin, T.Y.; Li, M. Does education increase pro-environmental willingness to pay? Evidence from Chinese household survey. J. Clean. Prod. 2020, 275, 9. [Google Scholar] [CrossRef]
- Golas, M.; Sulewski, P.; Was, A.; Kloczko-Gajewska, A.; Pogodzinska, K. On the Way to Sustainable Agriculture-Eco-Efficiency of Polish Commercial Farms. Agriculture 2020, 10, 438. [Google Scholar] [CrossRef]
- You, H.Y.; Zhang, X.L. Eco-Efficiency of Intensive Agricultural Production and Its Influencing Factors in China: An Application of DEA-Tobit Analysis. Discret. Dyn. Nat. Soc. 2016, 14. [Google Scholar] [CrossRef]
- Cheng, C.Y.; Ren, J.M.; Wang, R.S.; Liu, F. Eco-efficiency assessment of farming activity in China. Nat. Resour. Sustain. Dev. 2012, 361–363, 1776. [Google Scholar] [CrossRef]
- Van Grinsven, H.J.M.; Van Eerdt, M.M.; Westhoek, H.; Kruitwagen, S. Benchmarking Eco-Efficiency and Footprints of Dutch Agriculture in European Context and Implications for Policies for Climate and Environment. Front. Sustain. Food Syst. 2019, 3, 17. [Google Scholar] [CrossRef] [Green Version]
- Grzelak, A. Accumulation of assets in farms covered by the FADN farm accountancy system in Poland—the economic and eco-efficiency context. Manag. Pol. 2019, 23, 281–294. [Google Scholar] [CrossRef] [Green Version]
- Canan, S.; Ceyhan, V. The link between production efficiency and opportunity cost of protecting environment in TR83 region, Turkey. Environ. Sci. Pollut. Res. 2020, 27, 35112–35125. [Google Scholar] [CrossRef]
- Czyzewski, B.; Sapa, A.; Kulyk, P. Human Capital and Eco-Contractual Governance in Small Farms in Poland: Simultaneous Confirmatory Factor Analysis with Ordinal Variables. Agriculture 2021, 11, 46. [Google Scholar] [CrossRef]
- Woessmann, L. Educational production in Europe. Econ. Policy 2005, 20, 445–504. [Google Scholar] [CrossRef]
- Dudek, M.; Wrzaszcz, W. On the Way to Eco-Innovations in Agriculture: Concepts, Implementation and Effects at National and Local Level. The Case of Poland. Sustainability 2020, 12, 4839. [Google Scholar] [CrossRef]
- Adeniyi, D.A.; Dinbabo, M.F. Efficiency, food security and differentiation in small-scale irrigation agriculture: Evidence from North West Nigeria. Cogent Soc. Sci. 2020, 6. [Google Scholar] [CrossRef]
- Repar, N.; Jan, P.; Dux, D.; Nemecek, T.; Doluschitz, R. Implementing farm-level environmental sustainability in environmental performance indicators: A combined global-local approach. J. Clean. Prod. 2017, 140, 692–704. [Google Scholar] [CrossRef] [Green Version]

| Name of Synthetic Measure | Name of Variable | Type of Variable | Weight |
|---|---|---|---|
| Human capital | Professional experience | Stimulant | 0.693 |
| Education | Stimulant | 0.082 | |
| Agricultural qualification | Stimulant | 0.030 | |
| Participation in continuing education: farm owner | Stimulant | 0.023 | |
| Participation in continuous education: spouse | Stimulant | 0.017 | |
| Participation in continuing education: other adults | Stimulant | 0.007 | |
| Participation in social/cultural events: farm owner | Stimulant | 0.024 | |
| Participation in social/cultural events: spouse | Stimulant | 0.028 | |
| Participation in social/cultural events: other adults | Stimulant | 0.030 | |
| Membership in any organisation, association, club, etc.: farm owner | Stimulant | 0.030 | |
| Membership in any organisation, association, club, etc.: spouse | Stimulant | 0.025 | |
| Membership in any organisation, association, club, etc.: other adults | Stimulant | 0.012 | |
| Environmental | CH4 emission per hectare | Destimulant | 0.221 |
| N emission per hectare | Destimulant | 0.228 | |
| Soil organic matter balance, tonnes per hectare | Destimulant | 0.130 | |
| Mineral fertiliser consumption, tonnes per hectare | Destimulant | 0.097 | |
| Expenses for plant protection products per year per hectare | Destimulant | 0.096 | |
| Fuel expenses per year per hectare | Destimulant | 0.099 | |
| Electricity expenses per year per hectare | Destimulant | 0.129 |
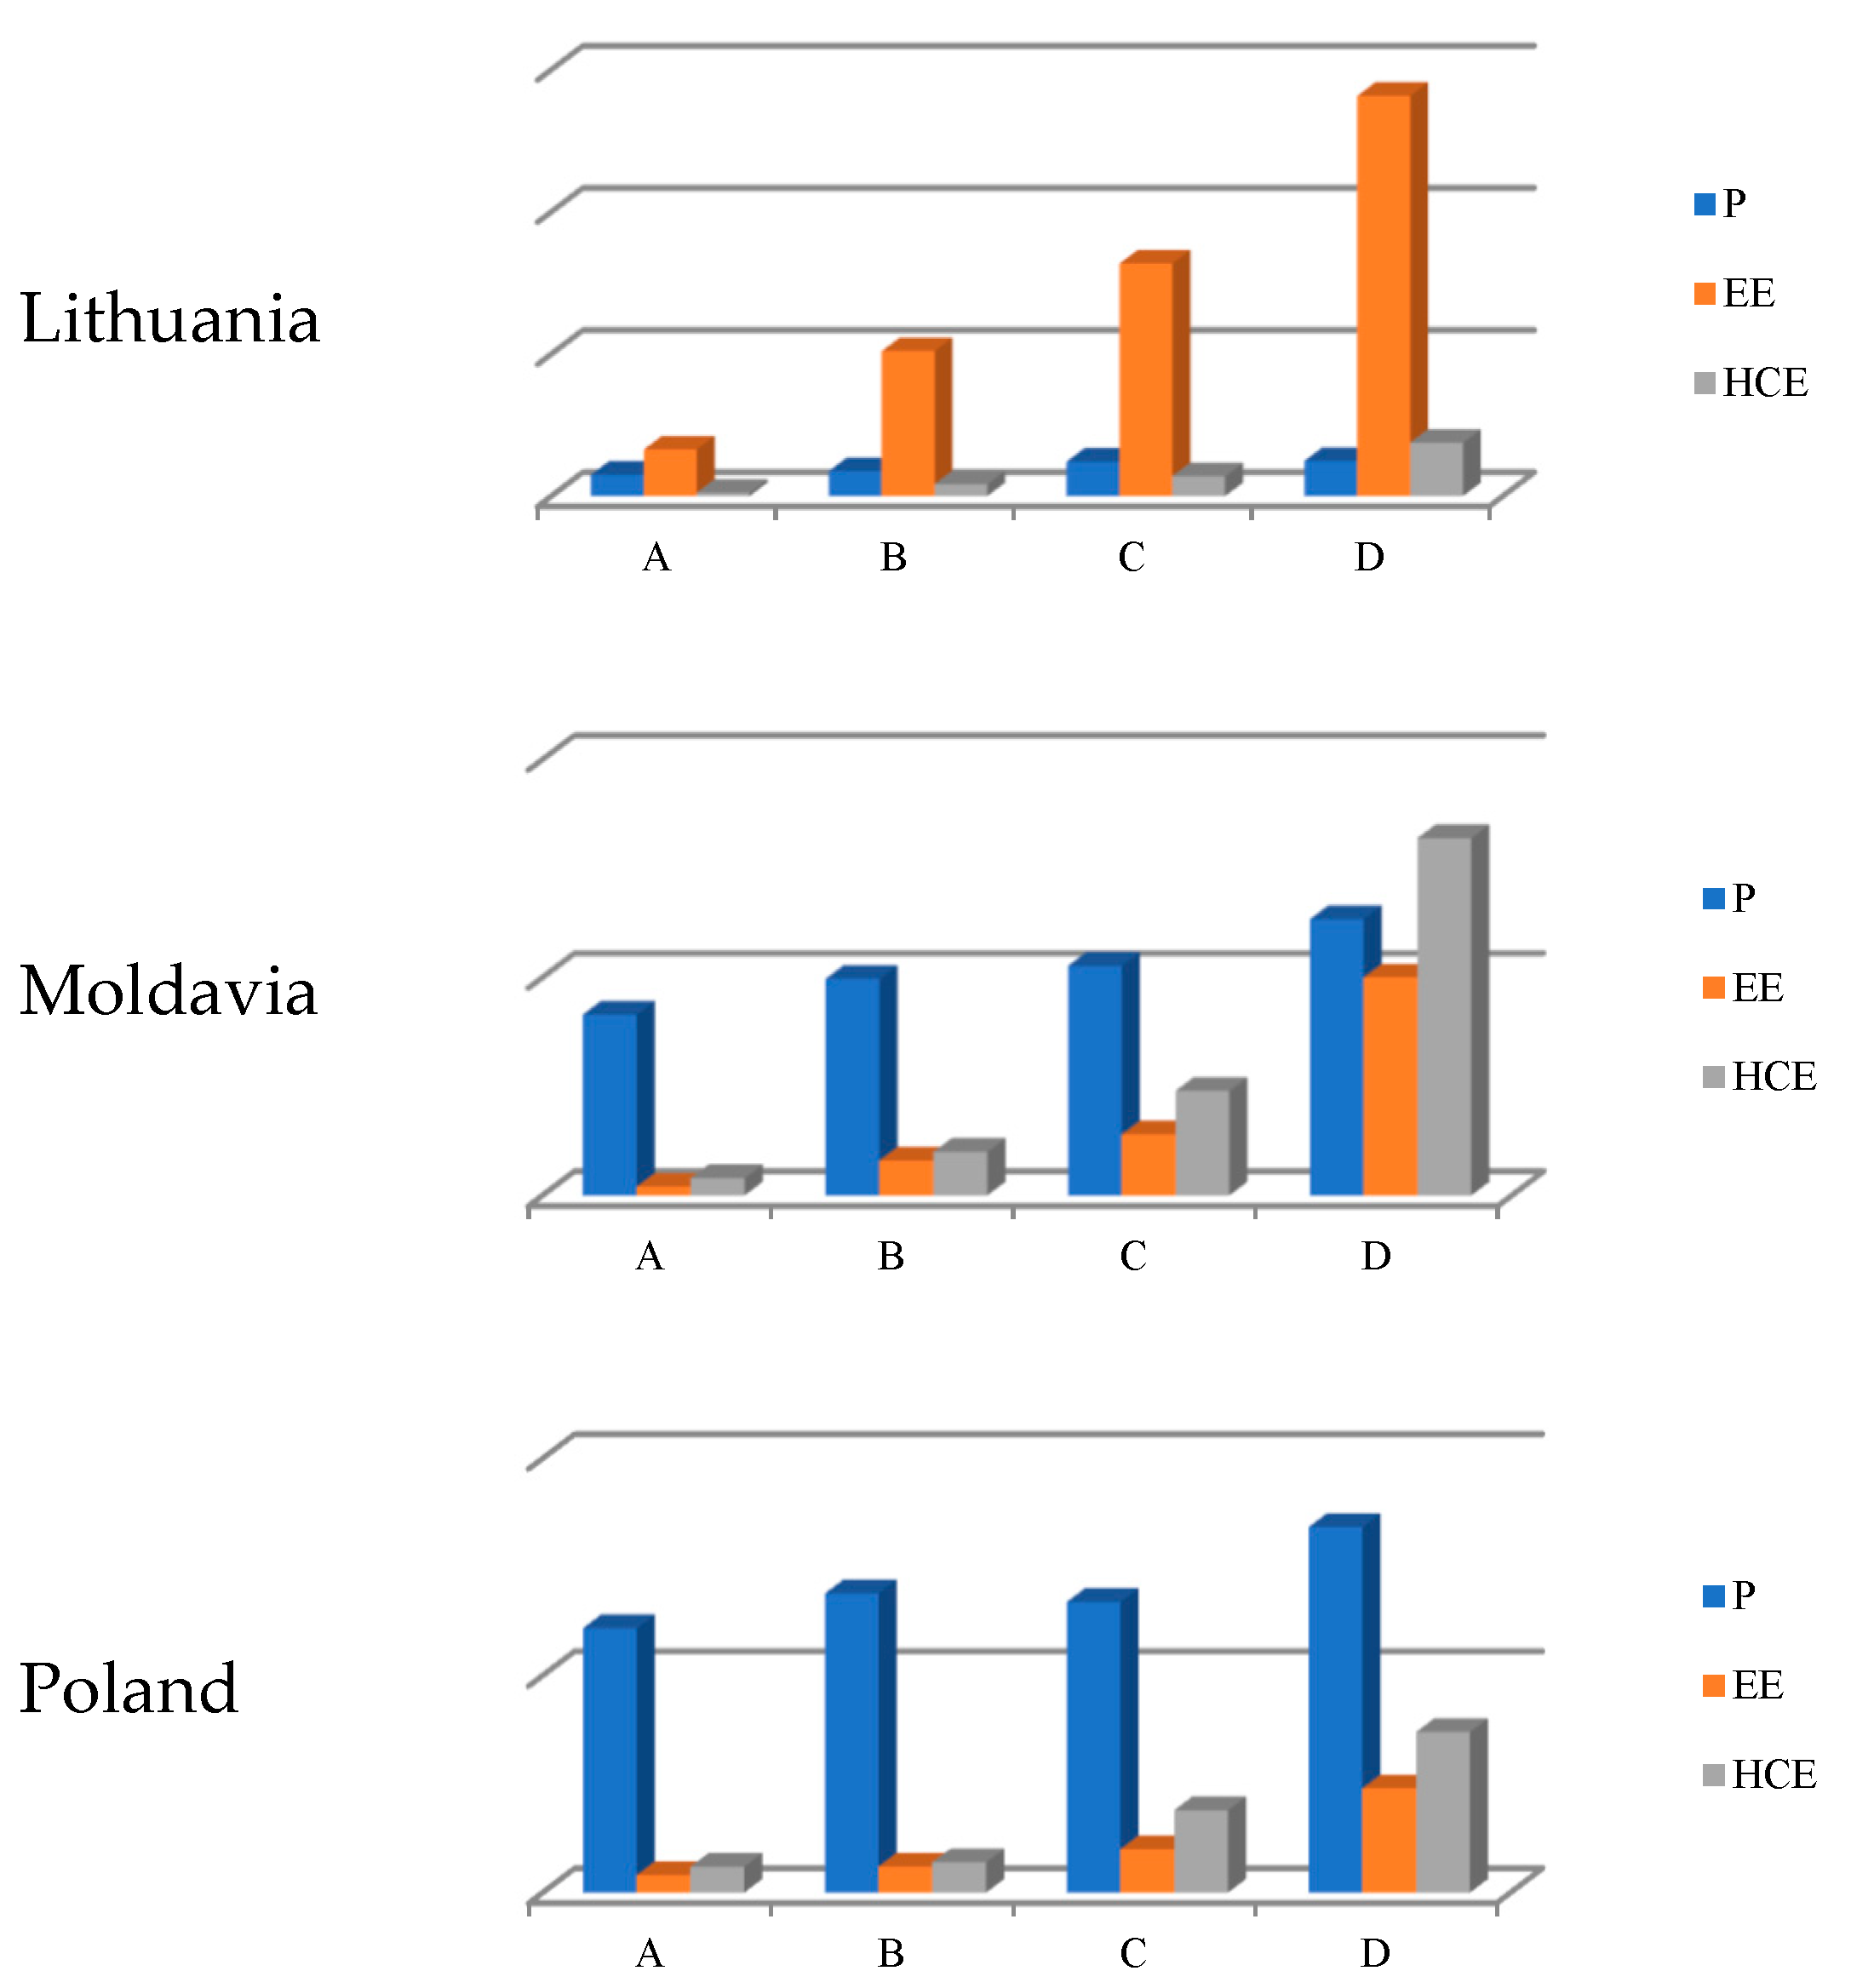
| K | N | P | Measures | ||||
|---|---|---|---|---|---|---|---|
| E | KL | S | EE | HCE | |||
| Lithuania | |||||||
| B | 240 | 8.82 | 0.1112 | 0.804 | 0.0829 | 2.5532 | 0.212 |
| C | 240 | 12.16 | 0.2033 | 0.7352 | 0.0857 | 4.0938 | 0.3487 |
| D | 240 | 12.42 | 0.4334 | 0.7132 | 0.0821 | 7.0416 | 0.9399 |
| Moldavia | |||||||
| A | 133 | 4.15 | 0.0116 | 0.708 | 0.7892 | 0.0148 | 0.0194 |
| B | 133 | 4.97 | 0.0294 | 0.7115 | 0.7945 | 0.0371 | 0.0508 |
| C | 133 | 5.27 | 0.0585 | 0.6562 | 0.7845 | 0.0747 | 0.1154 |
| D | 133 | 6.34 | 0.1966 | 0.6643 | 0.7821 | 0.2524 | 0.4139 |
| Poland | |||||||
| A | 174 | 12.18 | 0.03 | 0.7975 | 0.7958 | 0.0392 | 0.0586 |
| B | 174 | 13.78 | 0.0512 | 0.8126 | 0.8035 | 0.0649 | 0.0698 |
| C | 174 | 13.39 | 0.0785 | 0.7798 | 0.8039 | 0.1 | 0.1889 |
| D | 174 | 16.84 | 0.1872 | 0.7607 | 0.7957 | 0.2425 | 0.3696 |
| Romania | |||||||
| A | 218 | 1.39 | 0.0563 | 0.7337 | 0.7286 | 0.0775 | 0.1776 |
| B | 218 | 4.06 | 0.0531 | 0.7161 | 0.7414 | 0.0717 | 0.1239 |
| C | 218 | 8.11 | 0.0698 | 0.7558 | 0.7441 | 0.0939 | 0.1422 |
| D | 218 | 37.08 | 0.136 | 0.753 | 0.7447 | 0.1826 | 0.2769 |
| Serbia | |||||||
| A | 131 | 3.93 | 0.0074 | 0.6906 | 0.7481 | 0.0099 | 0.0179 |
| B | 131 | 3.71 | 0.0146 | 0.708 | 0.7409 | 0.0198 | 0.0231 |
| C | 131 | 4.5 | 0.0263 | 0.6919 | 0.7419 | 0.0355 | 0.044 |
| D | 131 | 4.39 | 0.0791 | 0.6701 | 0.7385 | 0.108 | 0.1445 |
| Name | N | Class | Mean Values | SS Effect | Contrast 1 (1;0;0;−1) | Contrast 2 (0;1;0;−1) | Contrast 3 (0;0;1;−1) | Contrast 4 (1;−1;0;0) | Contrast 5 (0;1;−1;0) |
|---|---|---|---|---|---|---|---|---|---|
| Lithuania | |||||||||
| Eco-Efficiency | 240 | A | 0.8219 | 5015.8 | 0.93 | 0.48 | 0.21 | 0.07 | 0.06 |
| 240 | B | 2.5532 | |||||||
| 240 | C | 4.0938 | |||||||
| 240 | D | 7.0416 | |||||||
| Human Capital Efficiency | 240 | A | 0.0638 | 106.1 | 0.87 | 0.60 | 0.40 | 0.02 | 0.02 |
| 240 | B | 0.2120 | |||||||
| 240 | C | 0.3487 | |||||||
| 240 | D | 0.9399 | |||||||
| Moldavia | |||||||||
| Eco-Efficiency | 133 | A | 0.0148 | 4.651 | 0.81 | 0.66 | 0.45 | 0.01 | 0.02 |
| 133 | B | 0.0371 | |||||||
| 133 | C | 0.0747 | |||||||
| 133 | D | 0.2524 | |||||||
| Human Capital Efficiency | 133 | A | 0.0194 | 13.001 | 0.80 | 0.67 | 0.46 | np | 0.02 |
| 133 | B | 0.0508 | |||||||
| 133 | C | 0.1154 | |||||||
| 133 | D | 0.4139 | |||||||
| Poland | |||||||||
| Eco-Efficiency | 174 | A | 0.0391 | 4.299 | 0.84 | 0.64 | 0.41 | 0.01 | 0.03 |
| 174 | B | 0.0649 | |||||||
| 174 | C | 0.1000 | |||||||
| 174 | D | 0.2425 | |||||||
| Human Capital Efficiency | 174 | A | 0.0586 | 10.899 | 0.77 | 0.72 | 0.26 | np | 0.11 |
| 174 | B | 0.0698 | |||||||
| 174 | C | 0.1889 | |||||||
| 174 | D | 0.3696 | |||||||
| Romania | |||||||||
| Eco-Efficiency | 218 | A | 0.0775 | 1.7435 | 0.69 | 0.77 | 0.49 | np | 0.03 |
| 218 | B | 0.0717 | |||||||
| 218 | C | 0.0939 | |||||||
| 218 | D | 0.1826 | |||||||
| Human Capital Efficiency | 218 | A | 0.1775 | 3.0469 | 0.35 | 0.84 | 0.65 | np | np |
| 218 | B | 0.1239 | |||||||
| 218 | C | 0.1422 | |||||||
| 218 | D | 0.2769 | |||||||
| Serbia | |||||||||
| Eco-Efficiency | 131 | A | 0.0099 | 0.7745 | 0.81 | 0.66 | 0.44 | np | 0.02 |
| 131 | B | 0.0198 | |||||||
| 131 | C | 0.0354 | |||||||
| 131 | D | 0.1079 | |||||||
| Human Capital Efficiency | 131 | A | 0.0179 | 1.3773 | 0.76 | 0.70 | 0.48 | np | np |
| 131 | B | 0.0230 | |||||||
| 131 | C | 0.0439 | |||||||
| 131 | D | 0.1445 | |||||||
Publisher’s Note: MDPI stays neutral with regard to jurisdictional claims in published maps and institutional affiliations. |
© 2021 by the author. Licensee MDPI, Basel, Switzerland. This article is an open access article distributed under the terms and conditions of the Creative Commons Attribution (CC BY) license (https://creativecommons.org/licenses/by/4.0/).
Share and Cite
Polcyn, J. Eco-Efficiency and Human Capital Efficiency: Example of Small- and Medium-Sized Family Farms in Selected European Countries. Sustainability 2021, 13, 6846. https://doi.org/10.3390/su13126846
Polcyn J. Eco-Efficiency and Human Capital Efficiency: Example of Small- and Medium-Sized Family Farms in Selected European Countries. Sustainability. 2021; 13(12):6846. https://doi.org/10.3390/su13126846
Chicago/Turabian StylePolcyn, Jan. 2021. "Eco-Efficiency and Human Capital Efficiency: Example of Small- and Medium-Sized Family Farms in Selected European Countries" Sustainability 13, no. 12: 6846. https://doi.org/10.3390/su13126846