Article

Temporal and Spatial Distributions of Waste Facilities and Solid Waste Management Strategies in Rural and Urban Saskatchewan, Canada

Faculty of Engineering and Applied Science, University of Regina, Regina, SK S4S 0A2, Canada
*
Author to whom correspondence should be addressed.
Sustainability 2021, 13(12), 6887; https://doi.org/10.3390/su13126887
Submission received: 9 May 2021 / Revised: 13 June 2021 / Accepted: 15 June 2021 / Published: 18 June 2021
(This article belongs to the Special Issue Rural Sustainable Environmental Management II)

Abstract

:
Saskatchewan has the highest number of landfills per capita in Canada. Given the lower population density and the skewed spatial population distribution, comprehensive analysis of municipal solid waste management systems in Saskatchewan is inherently difficult. Most of the published waste studies however focus on city-level waste management, and there is a lack of literature with respect to the rural areas. In this study, landfills and transfer stations are examined temporally and spatially using Geographic Information System. Landfills and transfer stations from 2017 and 2020 were plotted against census division land area, annual budget, and population density to study temporal changes. Saskatchewan witnessed a 54% reduction in the number of landfills and a 55% increase in number of transfer stations between 2017 and 2020. The replacement of landfills with transfer stations are more noticeable in divisions 8, 9, and 16. Regression analysis is conducted, and landfill closure operation show no obvious correlation to division land area, annual budget, or population density. Rural division 18, representing Northern Saskatchewan, has approximately 45% of the land area in the province and has the lowest population density. The findings suggest different waste management strategies are required for urban and rural areas. The results of this study will help policy makers to better implement solid waste management strategies in urban and rural areas.

1. Introduction

Effective municipal solid waste management (MSWM) demands careful planning, prudent investment, and ongoing monitoring and quality assurance program [1]. In North America, landfills and waste transfer stations play a more dominant role in waste treatment than incineration and other waste-to-energy technologies, probably due to air emissions and residuals such as dioxins, furans, bottom, and fly ashes associated with the municipal waste incineration process [2].
Canada has one of the highest per capita waste generation rates across the globe [3]. As of 2019, the estimated annual waste generation per capita in Canada was 36.1 metric tons, followed by Bulgaria and United States with 26.7 and 25.9 metric tons, respectively [4]. However, literature on MSWM in Canada is limited, especially in Western and Central Canada [5,6]. Data sources are often limited to internal municipal documents, outdated government records, historic company annual reports, or otherwise unpublished internal reports not easily accessible to the general public. The shared managerial responsibilities and roles by all three levels of government (municipal, provincial, and federal) have further complicated the waste data availability issue. In Canada, the federal government is mainly responsible for exportation and importation of hazardous waste, whereas provincial government is mainly responsible for regulation of waste management facilities and inter-provincial waste management issues [7]. Municipalities look after the daily control and monitoring of waste management programs and landfill operations at a city level [6]. In Canada, recycling programs for various waste streams are less well-structured. Waste management responsibilities regarding different recycling programs often overlap in Canada.
The lack of reliable and complete data sets and the complexity of waste management regulatory bodies are universally reported across the globe and are problematic in planning of MSWM systems [8], implementation of new MSWM technology, and deploying information systems supporting various MSWM programs [9,10]. The situation is more pronounced in remote area and northern region, where population density is much lower.
Many analytical tools have been proposed to improve the design of MSWM systems in different geographical locations, some of them with respect to the use of indices and indicators [11]. A diversion size indicator (DSI) was used to measure efficiency in a waste management system [12,13]. Another study analyzed various input-output indicators on evaluation of Canadian MSWM system and reported a lack of standardization and comparability between indicators [13]. The use of input-output indices may be suitable and appropriate to assess the efficiency and effectiveness of a MSWM system, but more work is needed to examine the MSWM system in rural and remote areas.
Land disposal is the most common solid waste treatment method in Canada. About 97% of the waste in Canada which requires final disposal is sent to landfills and only 3% is incinerated [14]. According to Statistics Canada, 24.9 million tons of solid waste was disposed in Canadian landfills in 2016 [15]. The three Canadian Prairie provinces (Alberta, Saskatchewan, and Manitoba) had an estimated 7.9 landfills per hundred thousand people in 2017 [16,17]. In comparison, the United States had an estimated 0.5 landfills per hundred thousand people in 2015 [18]. Many waste management strategies have been investigated and implemented in various Canadian cities [19]. Factors such as urbanization, consumption behaviors, lifestyle, and household generation characteristics have been studied [20]. However, the large geographical area of the country, uneven distribution of population, large proportion of rural regions, and insufficient governance in remote areas present many technical and administrative challenges for the development of efficient MSWM systems in Canada [21,22].
The dependency on landfills as the primary waste treatment method is more pronounced in the Canadian Prairie provinces (Alberta, Saskatchewan, and Manitoba) [2,4]. In these provinces, strategical siting of landfills and waste transfer stations becomes more important and play a vital role in the efficiency and effectiveness of MSWM. Waste transfer facilities in Saskatchewan serve as a link between a community’s waste generation sites and the final disposal sites such as landfills. Transfer stations temporally store waste from multiple collection vehicles and transfer wastes into larger, high-volume transfer vehicles for better economic efficiency [23]. The use of transfer stations is highly practical and sustainable since consolidating shipments reduces energy consumption [24].
Recently, the use of geographical information system (GIS) has been widely adopted to site waste facilities [25]. Aerial photography, spaceborne, and airborne sensors improve our understandings on the planning and management of waste facilities [26]. Time-consuming field surveys and ground monitoring programs are rapidly replaced by various remote sensing technologies [27]. The use of GIS as a mapping tool in rural and remote regions is not only cost effective, but it also helps to create a digital data inventory for temporal and spatial analyses [28].
A meta-analysis on economic performance of waste sector has highlighted the need of theoretical background required to develop an efficient MSWM system [29]. Literature review suggests that most waste studies did not explicitly consider rural areas and the role of transfer station on the design, planning, and operation of MSWM. For example, a Sri Lankan waste study on urban areas along the southeastern coast of the country examined existing complexities of MSWM processes and practices [30]. The study, however, neglects the rural areas where waste management lacked the most due to shortage of governance and resources. GIS and Multi-Criteria Decision Analysis (MCDA) were used to site and optimize landfills in a sub-area of the state of Sao Paulo but the potential impacts of transfer stations were ignored [31].
This study addresses the above concerns and analyzes both landfills and transfer stations temporally and spatially in Saskatchewan. The total area of Saskatchewan is about 651,000 km2 [32], and there are clear divisions of urban and rural areas. In this study, rural area is defined as the area left over after the population centers have been identified using the latest Statistics Canada population data [33]. Rural areas include small towns, villages, developed and undeveloped lands, agricultural lands, and remote and wilderness areas [33]. The objectives of the study are to (i) examine temporal and spatial changes of landfills and transfer stations in Saskatchewan between 2017 and 2020 using GIS tools, (ii) analyze key indicators on MSWM planning and landfill closure using regression analysis, and (iii) investigate the effectiveness of MSWM strategies using a Landfill-Transfer Station ratio (LTR).
Unlike other waste studies focusing on specific urban centers, this study explicitly examines MSWM systems in both rural and urban regions. An original indicator, Landfill Transfer Station Ratio (LTR), is proposed and implemented in this study to examine evolution of MSWM strategies and managerial trend. Canadians rely on permanent land disposal as their primary waste treatment method despite of various limitations of the landfill technology [34,35,36]. The use of the proposed indicator is novel, and the ratio can be implemented in other jurisdictions with high proportion of rural areas. The results of this study will help policy makers to better monitor and implement MSWM strategies in their regions of governance.

2. Materials and Methods

2.1. Study Area

The study area, the province of Saskatchewan, is shown in red in the map embedded in Table 1. The map was constructed using ArcGIS 10.7.1 [37]. Saskatchewan is one of the Prairie provinces and shares its borders with Alberta to the west, the Northwest Territories to the north, Manitoba to the east and the United States to the south [38]. Table 1 displays key geographical information of the province [32,39].
Saskatchewan is divided into 18 census divisions, with division identification numbers ascending south to north. Out of the total land area of the province, about 45% of the land area (approximately 270,000 km2) is represented by a single division (division 18), covering all of Northern Saskatchewan. The most populated cities, Saskatoon and Regina, are located in Division 15 and Division 6, respectively. In total, about 61 population centers are identified in Saskatchewan. In this study, any area outside the boundary of these population centers is considered as a rural area. The same classification is used to differentiate rural and urban waste facilities.

2.2. Data Acquisition

Majority of the data and shapefiles used in this study were obtained from the provincial government’s open data portals. Geospatial data of landfills and transfer stations were obtained from Saskatchewan geohub [40]. Annual budget in Canadian dollars (CAD) assigned to rural municipalities was obtained from government municipal revenue sharing portal [41]. Rural municipality is a type of incorporated municipality created by ministerial order, similar to counties in the western United States [42]. A census division contains multiple rural municipalities and thus the assigned budgets of encompassed rural municipalities are combined to obtain the total budget for a given census division. Population density of each census division was calculated using population data [43] and land area of each division [40].

2.3. Landfill Transfer Station Ratio (LTR)

A landfill transfer station ratio for each census division was computed to examine the evolution of MSWM during the three-year study period. As shown in Equation (1), the ratio is defined at each individual division and includes only operational waste facilities. Closed or inactive waste facilities are ignored. If there is no operational transfer station, the LTR is not defined.
LTR = Number   of   Operational   Landfills Number   of   Operational   Waste   Transfer   Stations ,
Since waste transfer stations and disposal sites play two different roles in MSWM in Saskatchewan, the LTR combines these waste facilities into a practical indicator for comparison purposes. The proposed LTR is only applicable when assessing waste facilities spatial design within a pre-determined boundary. Federal census division boundaries were chosen in this study, but the method is equally applicable to different boundaries. The use of LTR is believed to be more appropriate than other “per capita” parameters since it better captures the spatial aspect of MSWM design.

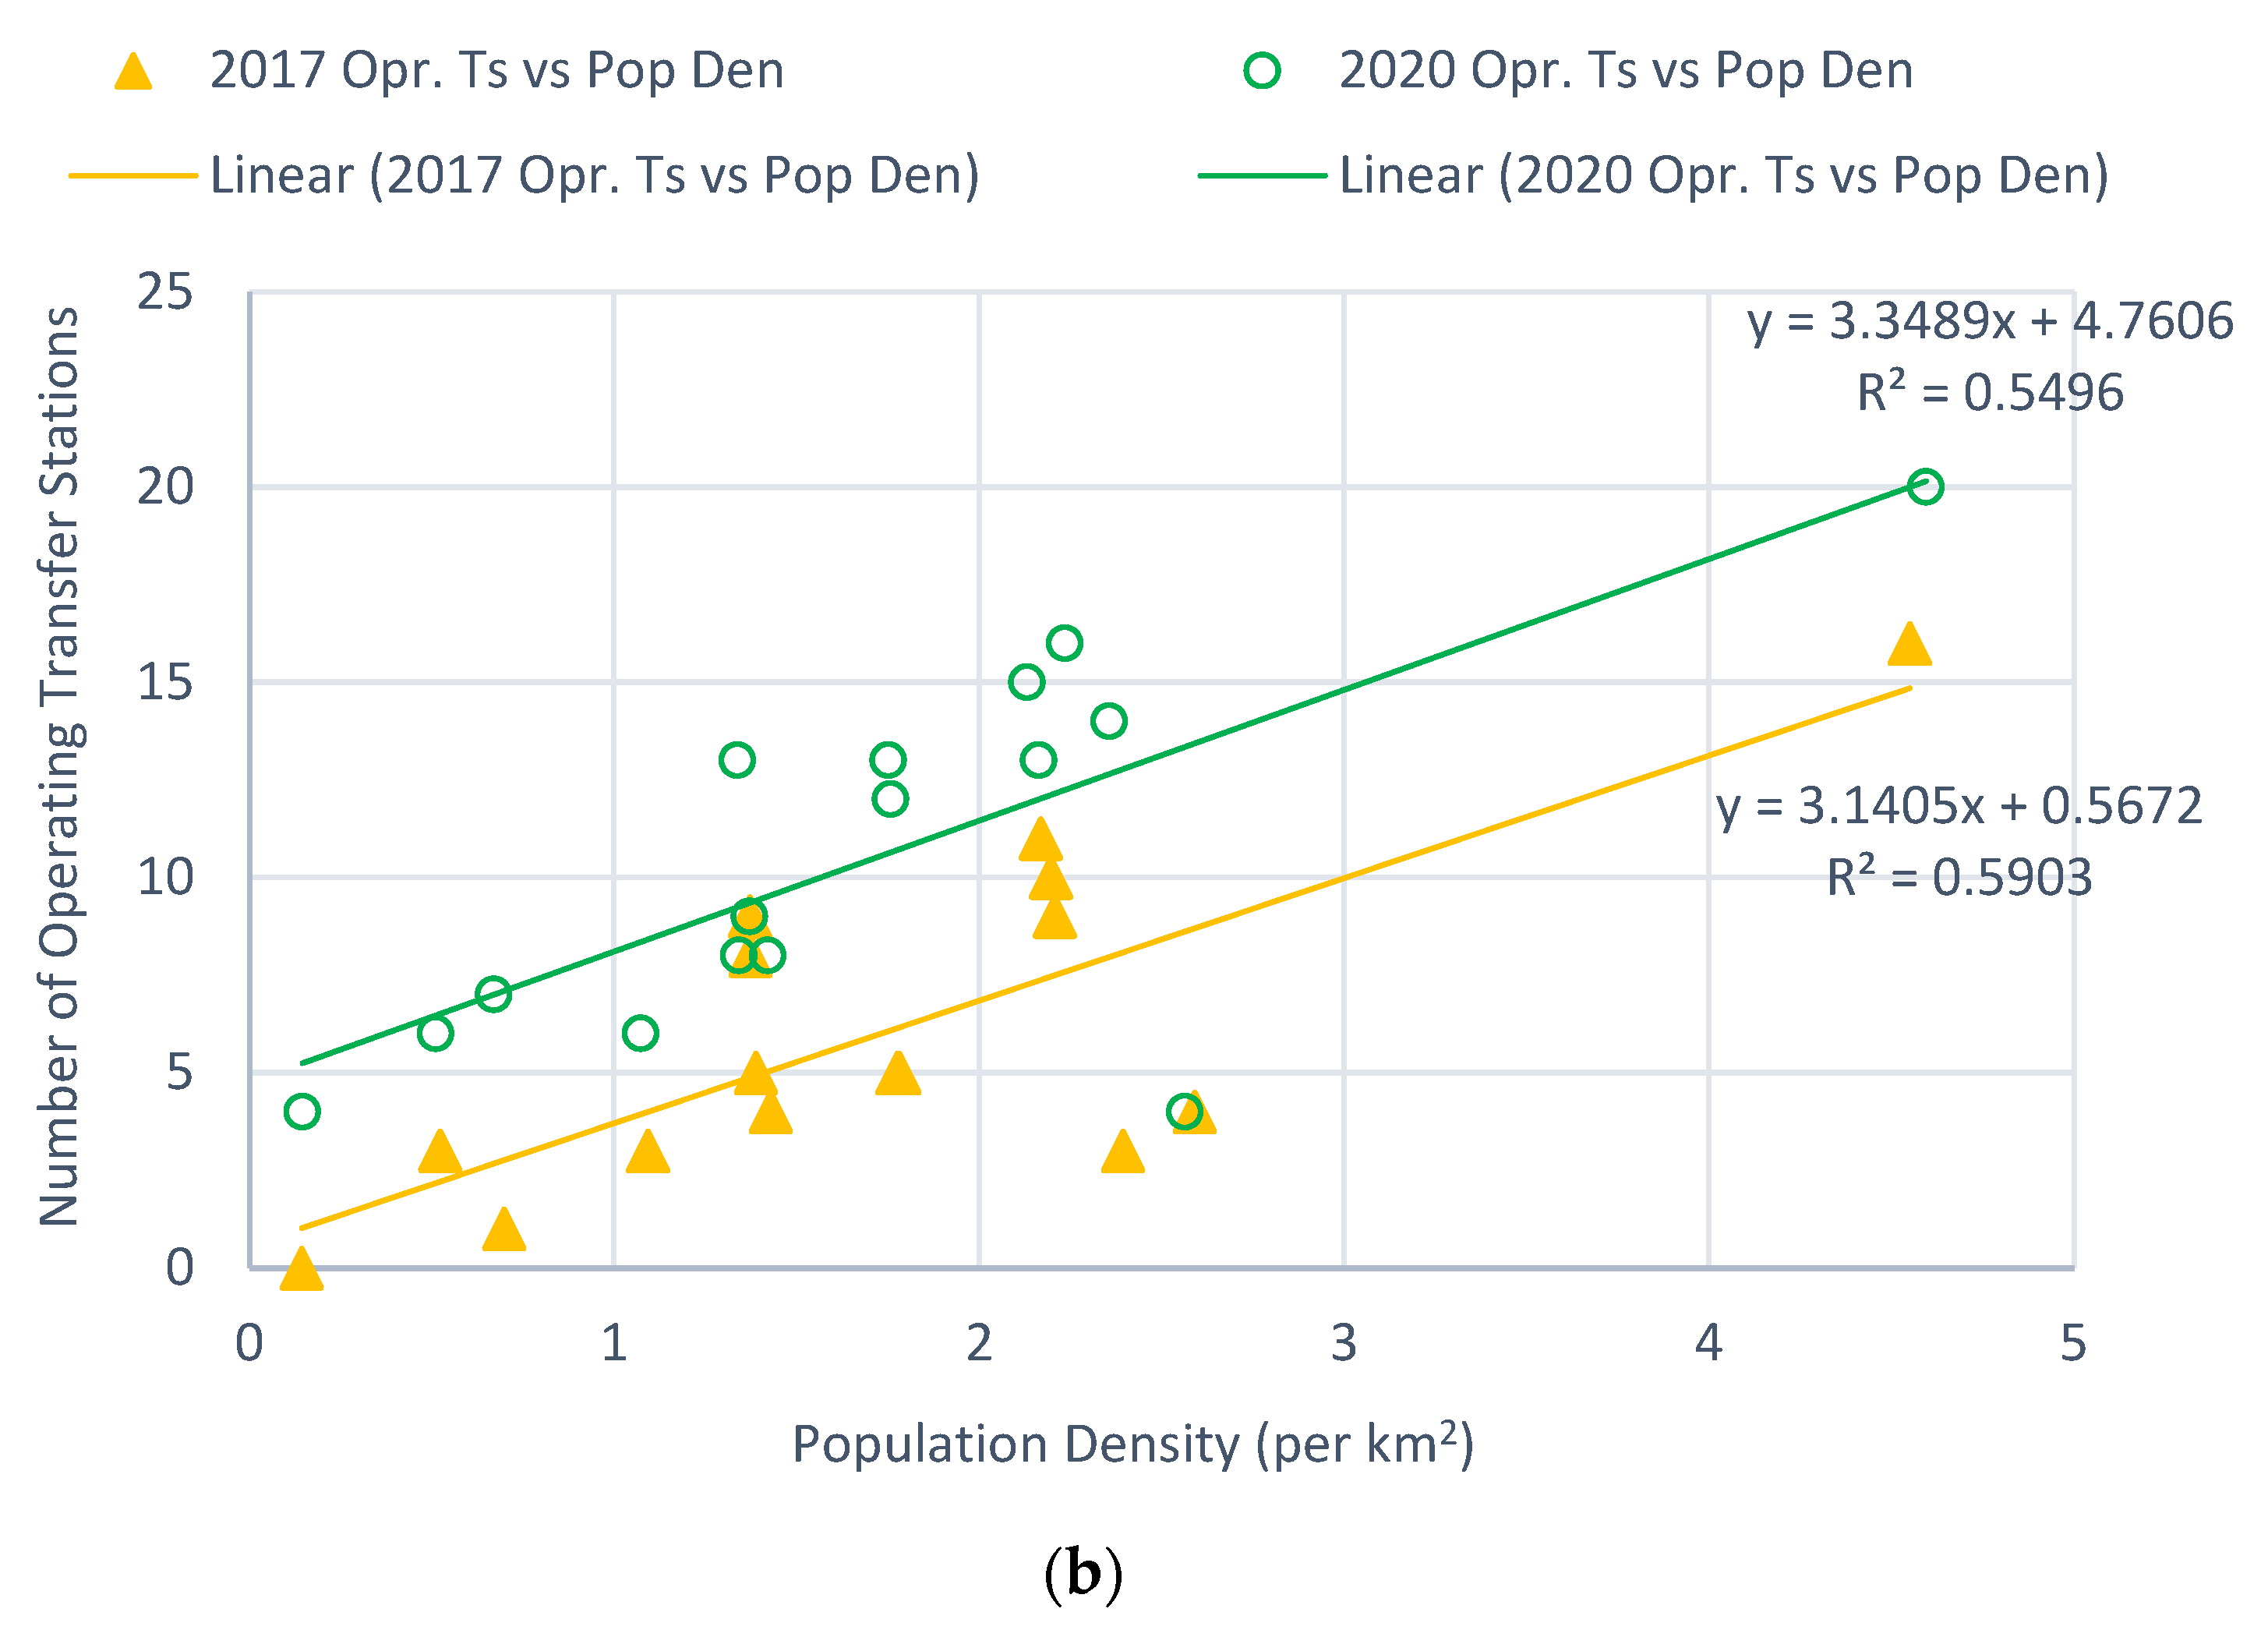
2.4. Regression Analysis

Simple linear regression analysis was conducted to investigate the potential relationships of the variables [44]. This linear model is shown below (Equation (2)):
Y = a + bX + ,
where, ‘Y’ is dependent variable, ‘X’ is independent variable, ‘a’ is the intercept, ‘b’ is the slope and ‘ ’ is the residual error. The coefficient of determination (R2) measures the fit of the linear regression line. The regression analysis is used to show the potential relationships between the variables, and no linear relationship between the variable is asserted. As discussed in Section 3, most of the relationships appear non-linear.

3. Results and Discussion

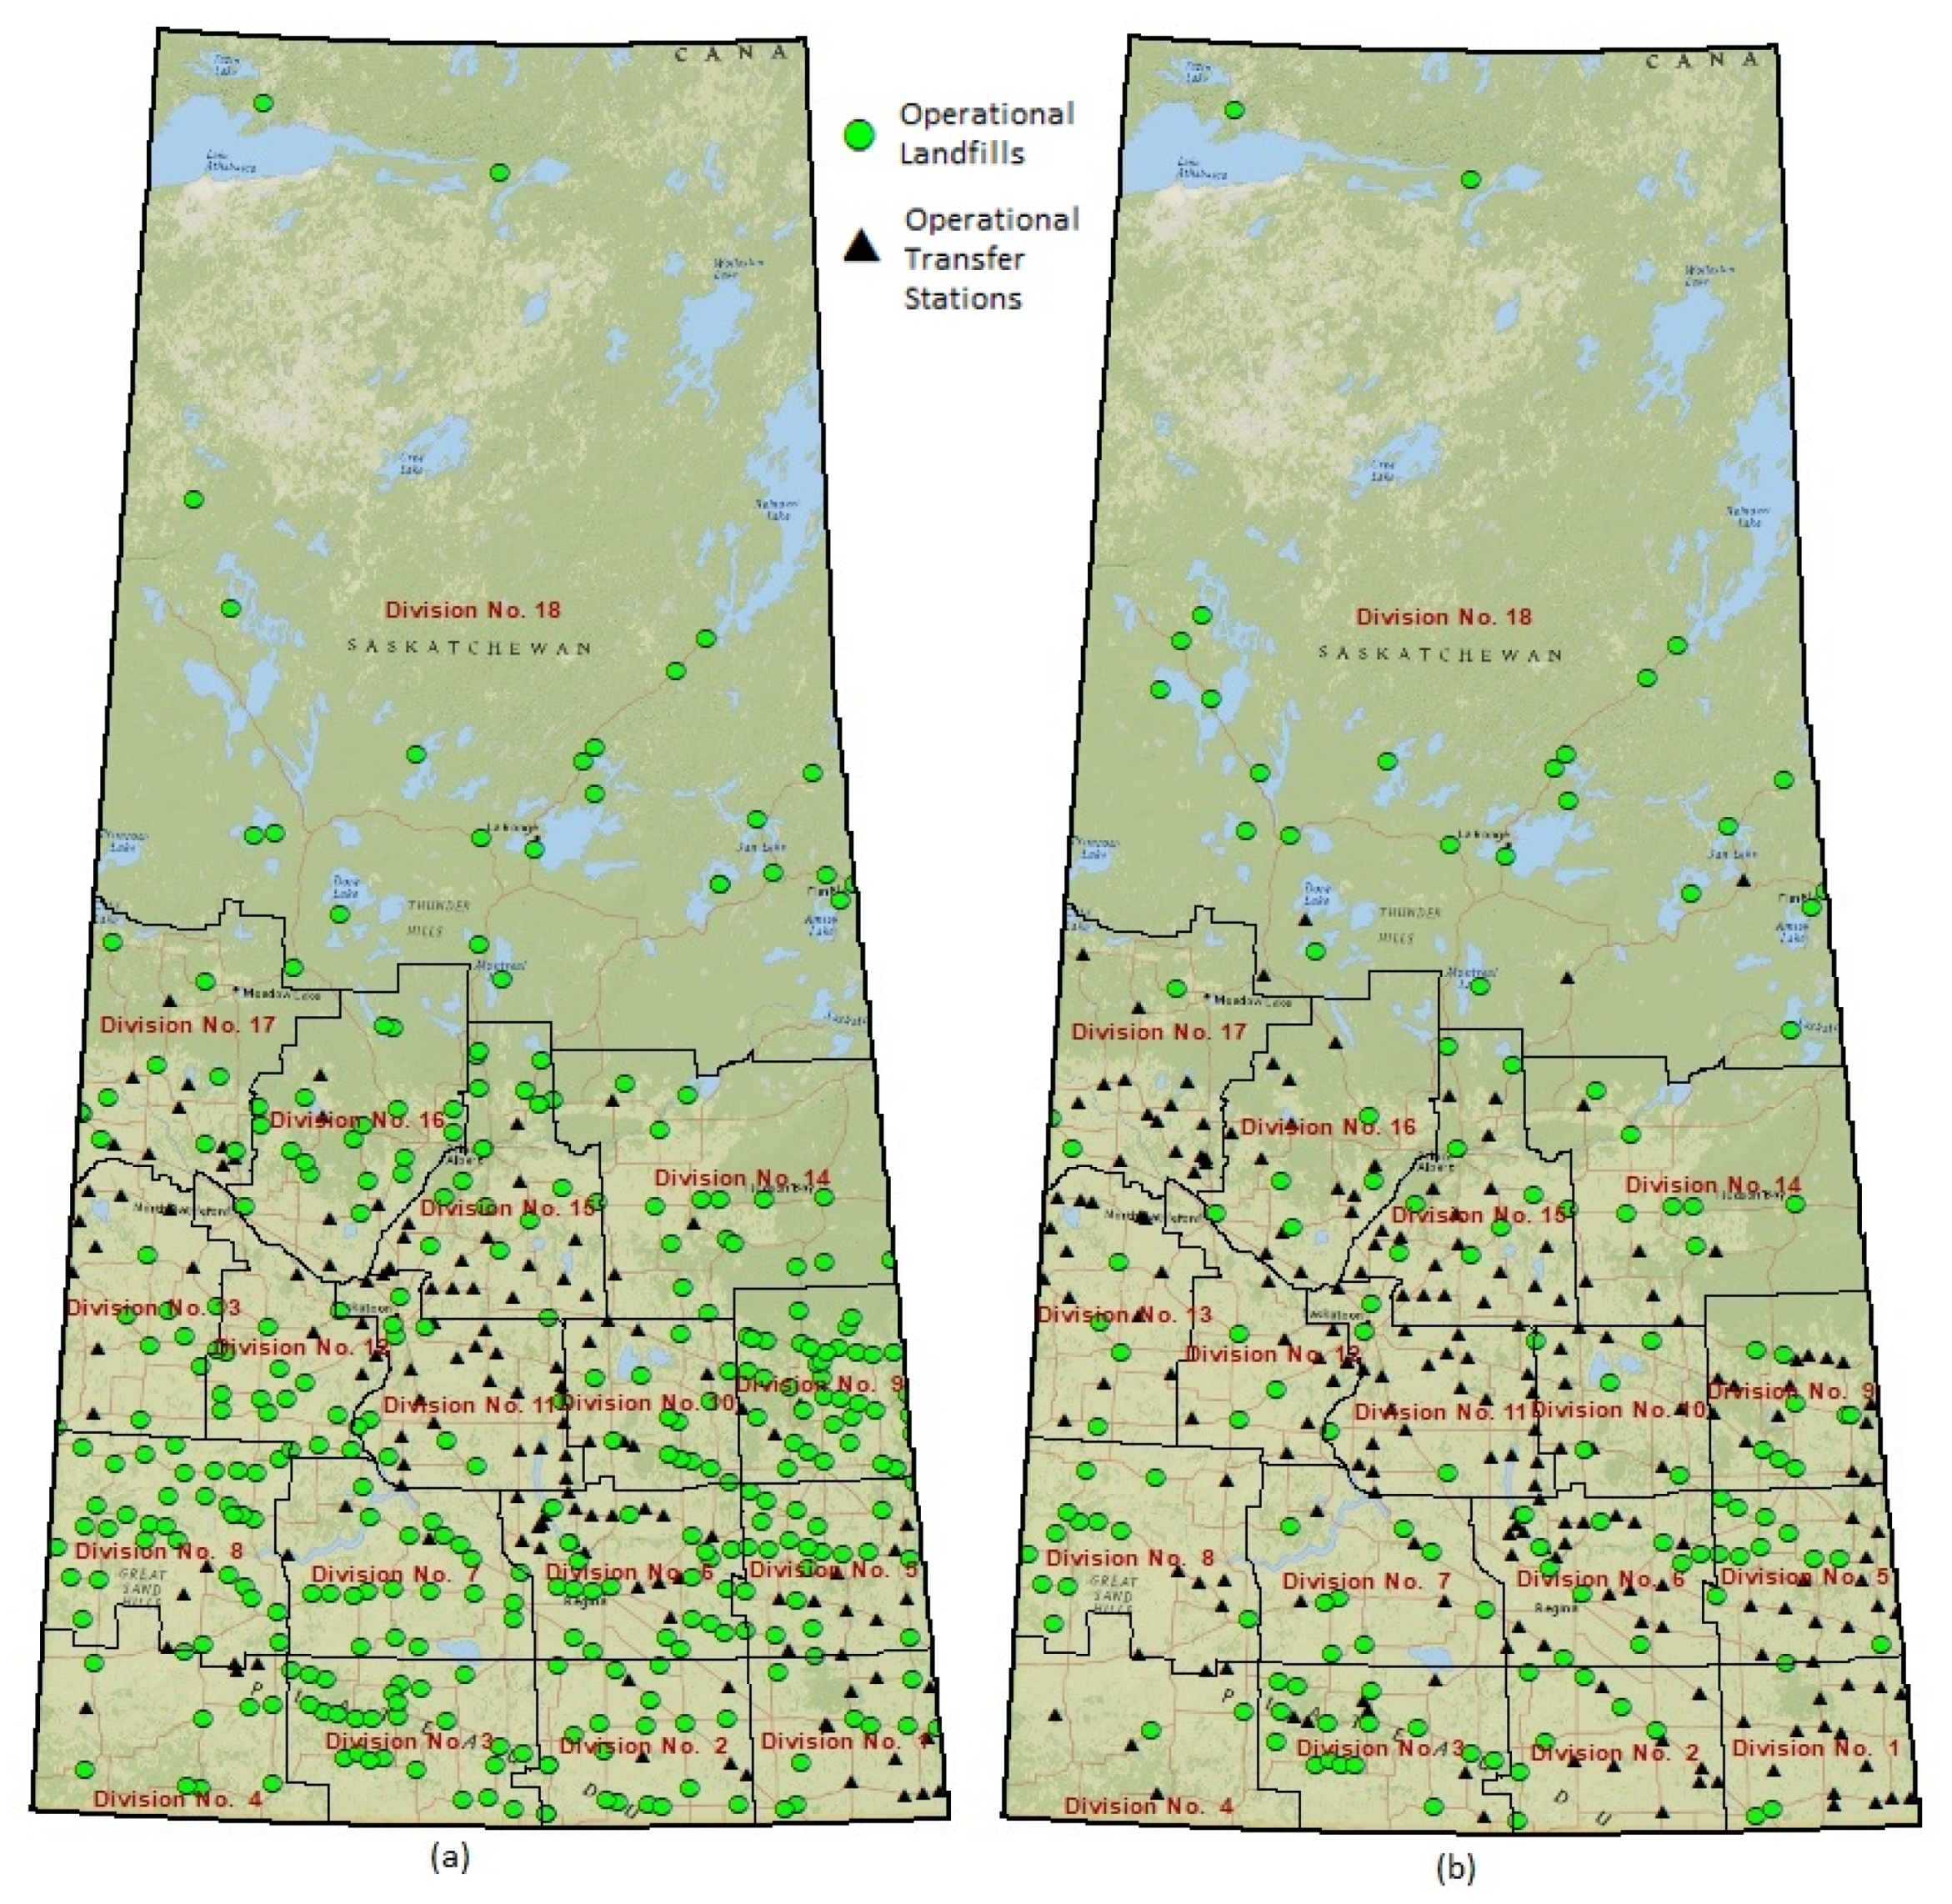
3.1. Geographical Spread and Numbers of Landfills and Transfer Stations

The spatial distributions of landfills and transfer stations in Saskatchewan in 2017 and 2020 are shown in Figure 1. A comparison between Figure 1a,b indicates a significant temporal change in the geographical spread of waste facilities across the province. The green circles represent operational landfills, and the black triangles represent operational transfer stations. Generally, there are many more waste facilities in Southern Saskatchewan, where major urban centers are located. Despite representing about 45% of the total area of the province, division 18 at the North contains very few waste facilities, predominantly due to its rural nature. It is important to note that there was no transfer station in Division 18 in 2017, as shown in Figure 1a.
Compared to Figure 1a, Figure 1b has fewer green circles and more black triangles. Overall, Saskatchewan experienced a 54% reduction in the number of landfills between 2017 and 2020. On the contrary, the province saw a noticeable increase of around 55% in number of transfer stations. This finding suggests there was a major change of MSWM strategies in the province between 2017 and 2020.
The overall percentage changes in number of landfills and transfer stations are not consistent and vary considerably among the census divisions. For example, about 80%, 75%, and 68% of the landfills were shut down in divisions 9, 4, and 8, respectively. In comparison, divisions 7 and 10 witnessed no change (0%) in the number of waste facilities between 2017 and 2020. Interior divisions not sharing their boundaries with any other province/country appear to have experienced less of a change, in comparison to divisions sharing their interprovincial boundaries with either Manitoba or Alberta. For example, division 9, located adjacent to the Saskatchewan-Manitoba border and with the highest number of landfills in 2017, witnessed 80% of its landfills being shut down by 2020. A corresponding increase in number of transfer stations is also observed for the same division. The result suggests a managerial trend of replacing operational landfills with transfer stations. This observation is consistent with the Saskatchewan waste management strategy of development of meta-scale landfills and regionalization of waste management systems [45,46].

3.2. Indicators

3.2.1. Census Division Land Area

The division land areas were plotted with the number of operational landfills and transfer stations, as shown in Figure 2. Division land areas were plotted ascending from left to right on the horizontal axis, ranging from 12,220 km2 (Division 10) to 269,997 km2 (Division 18). It appears that the number of the waste facilities in a division is not well correlated with the land area in either 2017 and 2020.
Division 18 clearly stands out when comparing to the land areas of the remaining divisions. For comparison purposes, division 18 is larger than 42 out of 50 U.S. states, and only 33% of the countries in the world are larger than division 18 [47,48]. As shown in Figure 2, division 18 is about 10 times larger than other divisions. Division 18 is scarcely populated with only few small population centers located around the south-east corner of the division, and mainly comprised of rural areas. As such, division 18 is removed in some regression analysis to avoid possible skewing of the data set. The finding supports the use of different analytical approach in Northern and Southern Saskatchewan, as further discussed in the following sections.
A comparison between Figure 2a,b shows that number of operational landfills have consistently decreased in all divisions between 2017 and 2020. On the other hand, the number of transfer stations increased for all divisions except for divisions 7 and 10. Two peaks of the landfill curve (solid blue curve, Figure 2a) are observed in divisions 8 and 9, representing considerably higher landfills than all other divisions. This is probably due to the lack of stringent regulations and the inter-provincial waste transport between urban centers. Both of the divisions are located adjacent to the interprovincial borders. Three major peaks are observed in the transfer station curve (broken orange curve, Figure 2a) in 2017. Divisions 11, 6, and 15 were the top three divisions with highest number of transfer stations in 2017, and this finding remains unchanged in 2020 (Figure 2b). As discussed in Section 3.1, there was an observable trend of replacing landfills with transfer station in Saskatchewan during the three-year study period.
Simple linear regression was conducted to better illustrate the potential relationships between the parameters. Figure 3 shows the relationship between operational landfills and transfer stations against census division land area. No obvious relationship is observed. In all cases, the linear regression equations have negligible slopes (<0.0003) and R2 values (<0.06). For a well designed MSWM system, one would generally expect more waste facilities in a larger division, though other factors such as population density should likely be considered.
The signs of the slopes are however different in Figure 3a,b. A higher number of landfills and a lower number of transfer stations are associated with larger division land area. The results suggest that the strategic operation of landfills and transfer stations in 2017 and 2020 were suboptimal. The similarities of the regression line slopes between 2017 and 2020 in Figure 3a,b suggests that the strategical phasing out of the operational landfills in 2020 was not designed in accordance with the division land area.

3.2.2. Rural Municipalities Annual Budget

Figure 4 shows the regression analyses between the number of waste facilities and annual budget in 2017 and 2020. Division 18, the largest division, was assigned a budget of CAD 18.2 million in 2017 and increased slightly to CAD 18.4 million in 2020. These budget allocations were about three to five times higher than other divisions. The managerial strategy and financial resources in Northern Saskatchewan were found quite different than the remaining divisions.
A positive relationship is observed for landfills (Figure 4a), and for transfer stations (Figure 4b). When considering division 18 (not shown in the Figure 4), a significant positive slope with higher R2 value was observed for landfills and a negative slope and lower R2 values was observed for transfer stations. The results suggest division 18 can significantly skew the dataset, and its MSWM system is different from other divisions in the province.
More scattering of data points is observed in 2017, with a R2 of 0.0471 (Figure 4a). It appears that the relationship between the number of landfills and annual budgets was more coherent in 2020, with a slight increase in R2 (0.0724). The low R2 values of the regression lines (<0.1) suggest that the relationships are not linear. The slope of the regression line in 2020 was about two times higher than in 2017, suggesting a fairer landfill operation funding mechanism.
As shown in Figure 4b, the funding mechanism with respect to transfer stations was again more coherent in 2020, with a slight increase in R2 from 0.1412 to 0.2034. Figure 4b suggests a higher annual budget corresponds well to the number of operational transfer stations in both 2017 and 2020. This finding suggests that a higher portion of budgets were spent on the establishments of new transfer stations in 2020.

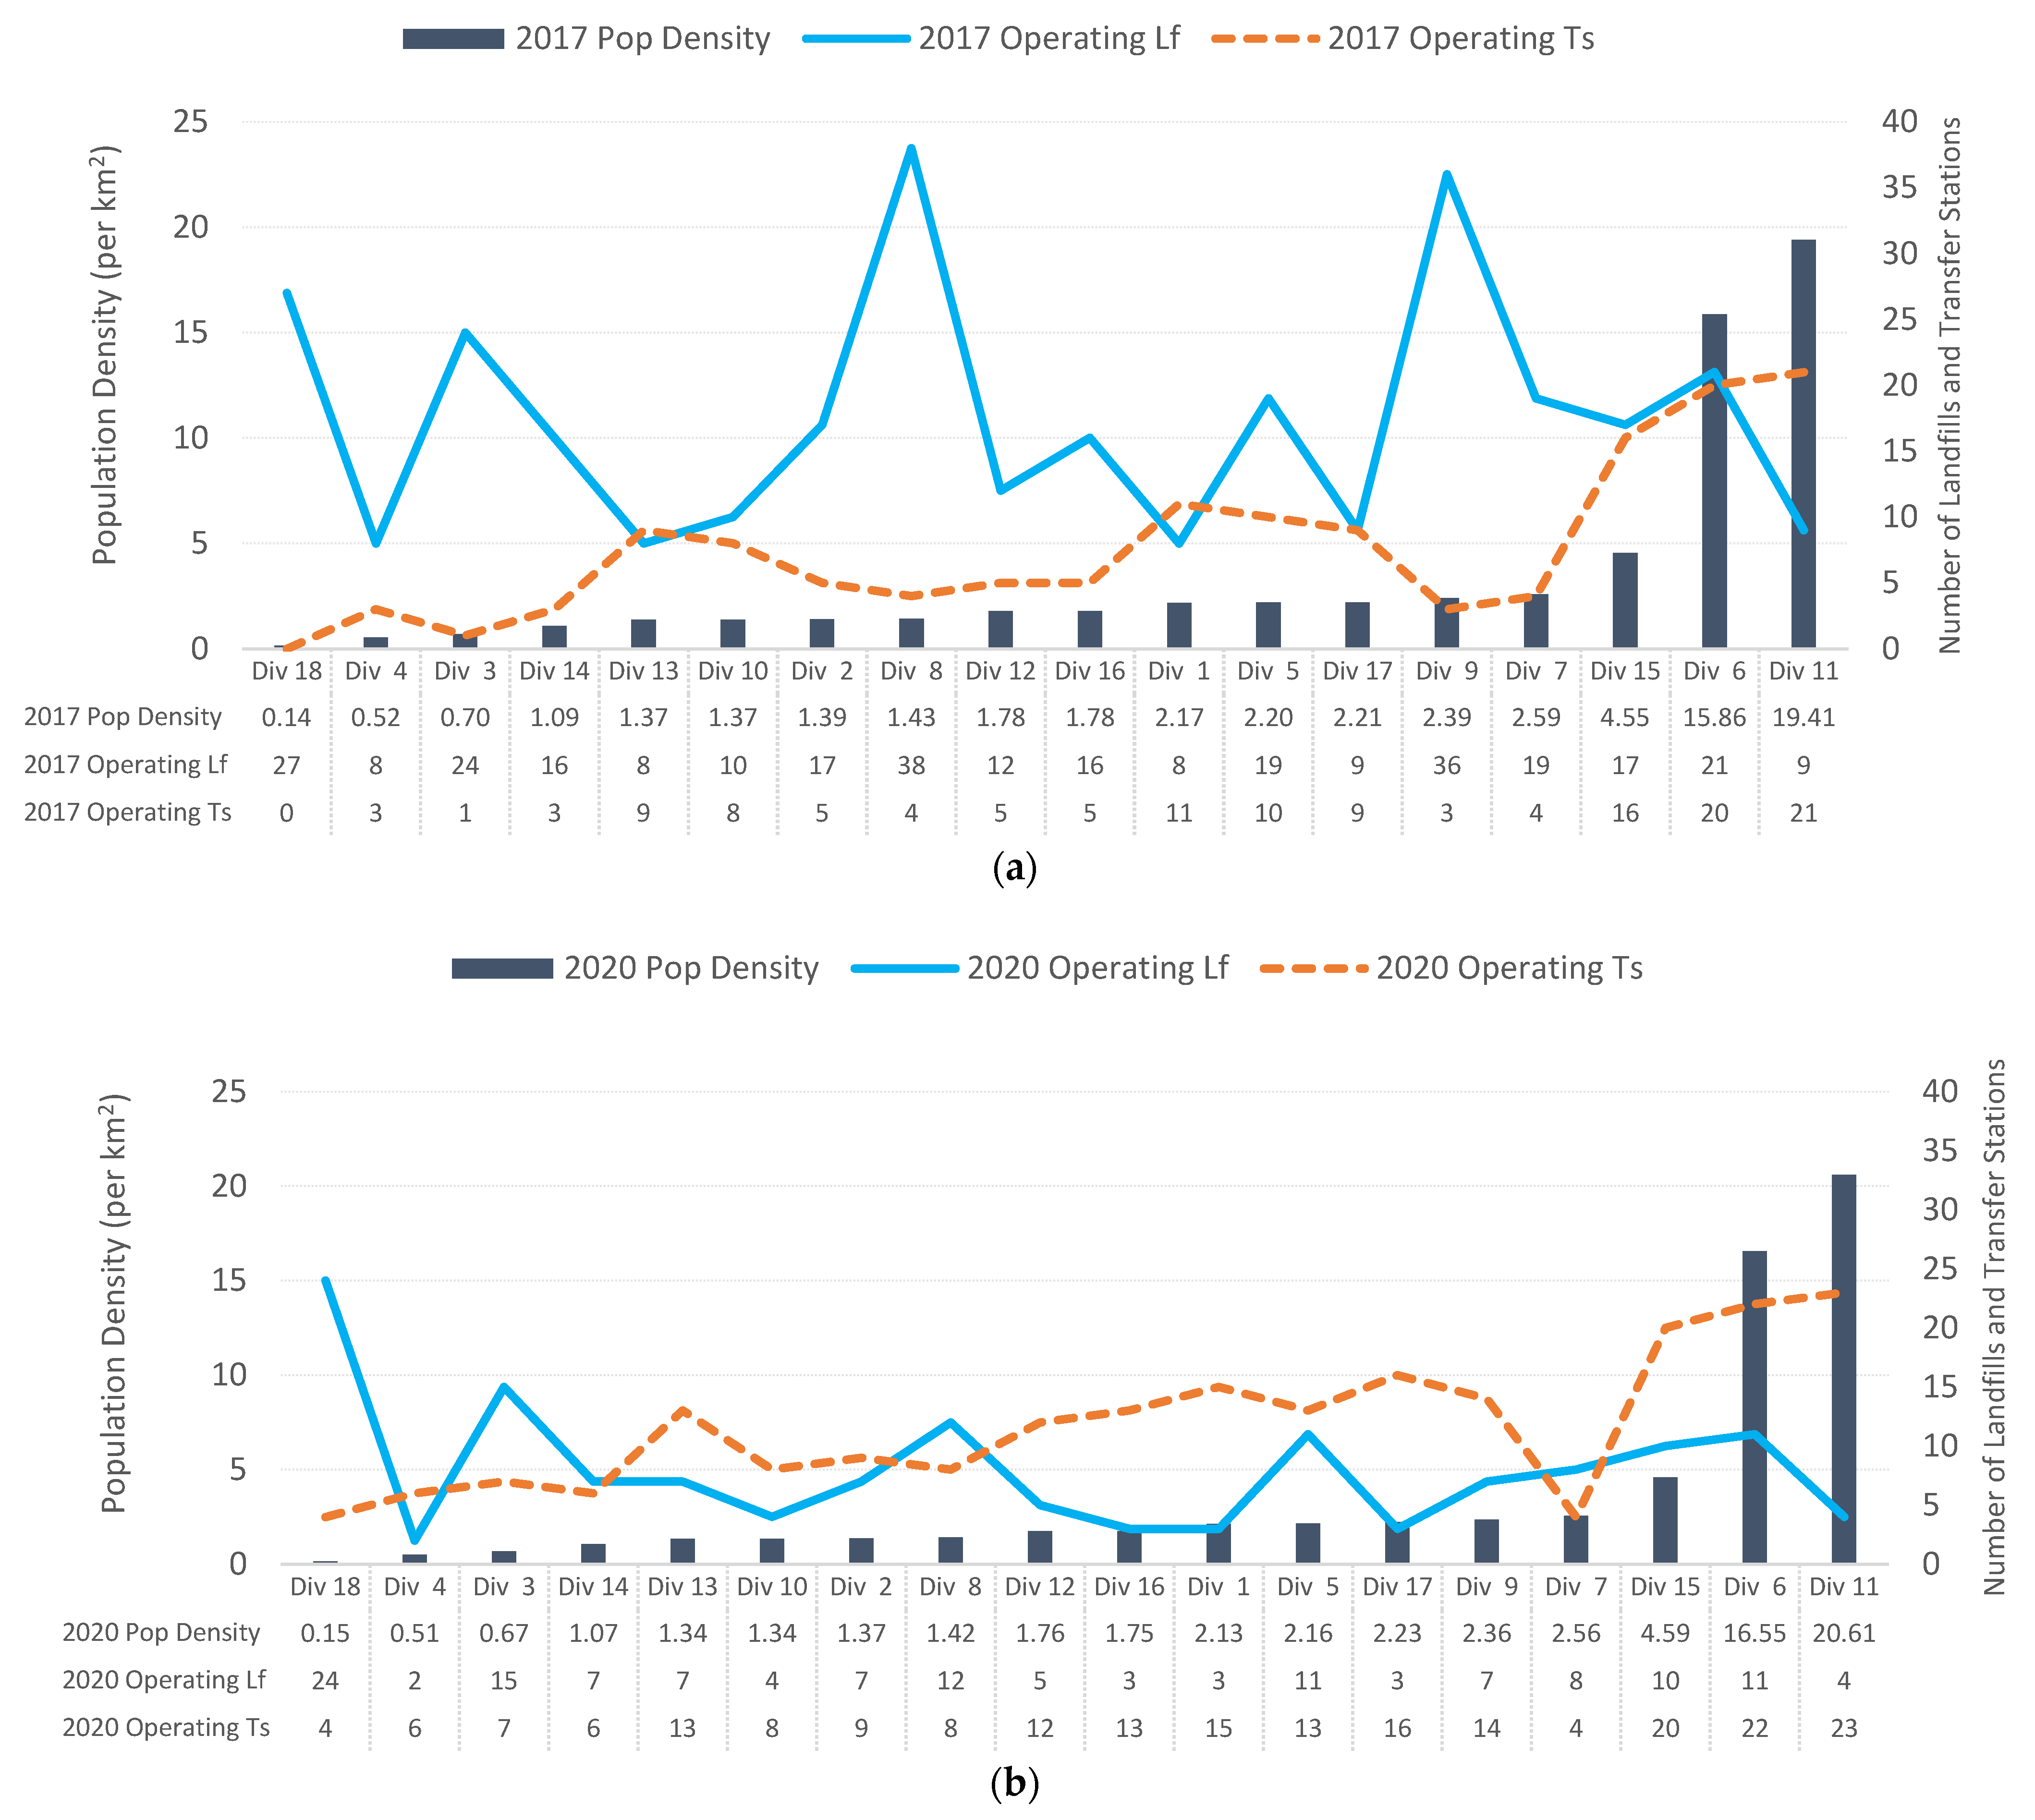
3.2.3. Census Division Population Density

Figure 5 shows the number of landfills and transfer stations with respect to population density of the divisions. The population densities are arranged in ascending order from left to right. No obvious trend is observed between the number of landfills and population density (blue solid curve, Figure 5a). For example, division 18, the division with the lowest population density (0.14 person/km2), had 27 operational landfills in 2017. On the other hand, divisions 6 and 11 have the highest population densities (>15 person/km2) among the divisions, with moderate numbers of operational landfills (9–21 landfills, Figure 5a).
The landfill curve is more consistent and stable among the divisions in 2020 (blue solid curve, Figure 5b), indicating a more systematic approach in the use landfill technology in the province. Divisions 3, 8, and 9 experienced significant drops in operational landfills in 2020. Specifically, in division 9 (Figure 5b), 29 out of 36 operational landfills (80.6%) were shut down during a three-year period. Geographical location of the divisions appears important, as divisions sharing at least one of their boundaries with other provinces/country generally have a larger reduction in operating landfills. Many Saskatchewan landfills accept out-of-the-province waste, and the closure of landfills in these divisions may have negatively impacted the waste management services at neighbouring towns and cities. Divisions with the highest population densities (15, 6, and 11) also had highest number of transfer stations in both 2017 (Figure 5a) and in 2020 (Figure 5b). This suggests high population density divisions favor the use of transfer stations in MSWM. Unlike the landfill curves, the transfer stations curves (orange broken lines, Figure 5a,b) generally shifted upward in 2020, suggesting the promotion of transfer stations.
Figure 6 shows the regression analyses between the number of waste facilities and population density. Divisions 6 and 11 were excluded in the regression analysis due to their high population density values (Figure 5). The R2 values for 2017 regression curves are very low, and no apparent relationship is found between the number of landfills and the population density (Figure 6a). This finding is consistent with the trend reported in Figure 5. On the contrary, positive trends are clearly observed between the number of transfer stations and population density (Figure 6b). The slopes of the regression curves are positive (+3.1~+3.3), with moderate R2 values (0.55~0.59).
An effective and efficient MSWM system should correspond well to the population distributions. The results suggest that population density was not sufficiently considered in the closure of the landfills. A more systematic approach on strategical siting of landfills is recommended.

3.3. Landfill to Transfer Station Ratio (LTR)

The LTRs are plotted with respect to census division land area (Figure 7a) and population distribution (Figure 7b). As shown in Figure 7a, the green broken curve is always below, or equal to, the orange solid line. On average, there was a 72% decrease in LTR during the study period across the province. Division 18 is an exception, since it had no operational transfer stations in 2017, and thus LTR was undefined (Equation (1)) and arbitrarily set to zero in Figure 7a. The LTRs in 2017 are quite erratic, ranging from 0.43 (Division 11) to 24.00 (Division 3). The LTRs in 2020 are more consistent among divisions (0.17–6.00), suggesting a province-wide movement of replacing landfills with transfer stations. The reduction in LTRs is however poorly related to division land area.
In 2017, the average LTR was about 4.2 (Figure 7b), but divisions 3, 8, and 9 had much higher LTRs (24.0, 9.5, and 12.0, respectively). Division population density alone fails to explain these LTR peaks. Between 2017 and 2020, the LTR of most divisions were reduced by half, whereas the LTRs in division 3, 8, and 9 were reduced by around 10 times. The unusual reduction of LTR may be due to the added managerial control of the waste originated outside of the province. The LTRs were much more consistent across the province in 2020 (broken green line, Figure 7b).
A closer look at Figure 7b reveals that population densities among the divisions were mostly constant during the three-year study period, with the exception of divisions 6 and 11. Urbanization in these two divisions were observed. LTRs in these two divisions were relatively constant during the study period. The finding suggests that the closure of landfills was more targeted to low-populated rural areas.

3.4. Limitations and Recommendations

A single indicator such as LTR can only approximate a jurisdiction’s multidimensional waste management system profile. The proposed LTR should be used in conjunction with other indices and indicators to fully capture the essences of a waste management system. The temporal changes in LTR are likely related to the changes in population and other socio-economic factors such as industrial type, family incomes, etc., and further studies are recommended. In this study, federal census division boundaries were selected. It should be noted that the findings derived from the proposed LTR are sensitive to the selection of the boundaries. Moreover, only active waste facilities were considered in this study. Closed or inactive waste facilities may impact the overall long-term design and operation of MSWM system, and should be consider in a future study.
The use of the proposed LTR is original, and the ratio can be implemented in other jurisdictions with high proportion of rural areas. Due to the rural nature of division 18, special managerial measures are recommended.

4. Conclusions

The paper examines the temporal and spatial changes of landfills and transfer stations in Saskatchewan. Unlike other waste studies focusing on specific urban centers, this study explicitly examines MSWM systems in both rural and urban regions.
Between 2017 and 2020, the number of landfills decreased by 54% and transfer stations increased by 55% in Saskatchewan. Interior divisions seemed to experience less changes, in comparison to divisions adjacent to interprovincial borders. Division 18, representing the rural Northern Saskatchewan, has a lower population density and larger annual budget than other divisions. Inclusion of division 18 in data analysis may skew the data set, and a different analytical approach is recommended. No obvious relationship was found between operational landfills or transfer stations against division land area, or population density. A similar conclusion was reached for number of operational landfills with respect to division annual budget. The results suggest that the current MSWM system in Saskatchewan is suboptimal and could be further strengthened. On the other hand, the number of transfer stations appears sensitive to division annual budget and population density.
In general, divisions with more operational landfills in 2017 witnessed larger drop in operational landfills in 2020. An average of 72% reduction in LTR was observed between 2017 and 2020. The results of this study provide insights into the design and operation of MSWM in Saskatchewan. The proposed analytical framework also helps policy makers to better monitor and implement MSWM strategies in their regions of governance.

Author Contributions

Conceptualization, A.G. and K.T.W.N.; Methodology, K.T.W.N.; Formal Analysis, A.G. and K.T.W.N.; Investigation, A.G. and K.T.W.N.; Writing—Original Draft Preparation, A.G.; Writing—Review & Editing, K.T.W.N.; Supervision, K.T.W.N.; Funding Acquisition, K.T.W.N. All authors have read and agreed to the published version of the manuscript.

Funding

The research reported in this paper was supported by a grant from the Natural Sciences and Engineering Research Council of Canada (RGPIN-2019-06154) to the corresponding author, using computing equipment funded by FEROF at the University of Regina.

Institutional Review Board Statement

Not applicable.

Informed Consent Statement

Not applicable.

Data Availability Statement

Publicly available datasets were analyzed in this study. This data can be found here: https://geohub.saskatchewan.ca/datasets/5b2ee29d2a304caca29f6aa36060ae1a_0/data?geometry=-146.524%2C49.433%2C-62.896%2C58.442 (accessed on 1 April 2021).

Acknowledgments

The authors are grateful for the funding support. The views expressed herein are those of the writers and not necessarily those of our research and funding partners.

Conflicts of Interest

The authors declare no conflict of interest. The funders had no role in the design of the study; in the collection, analyses, or interpretation of data; in the writing of the manuscript; or in the decision to publish the results.

References

  1. Solid Waste Management for Northern and Remote Communities. Available online: https://www.canada.ca/en/environment-climate-change/services/managing-reducing-waste/municipal-solid/environment/northern-remote-communities.html (accessed on 14 April 2021).
  2. Human Activity and the Environment: Section 3: Solid Waste. Available online: https://www150.statcan.gc.ca/n1/pub/16-201-x/2012000/part-partie3-eng.htm (accessed on 24 April 2021).
  3. Bruce, N.; Asha, A.Z.; Ng, K.T.W. Analysis of solid waste management systems in Alberta and British Columbia using provincial comparison. Can. J. Civ. Eng. 2015, 43, 351–360. [Google Scholar] [CrossRef]
  4. Largest Waste Producing Countries Worldwide per Capita 2019. Available online: https://www.statista.com/statistics/1168066/largest-waste-producing-countries-worldwide-per-capita/ (accessed on 29 May 2021).
  5. Wang, Y.; Ng, K.T.W.; Asha, A.Z. Non-hazardous waste generation characteristics and recycling practices in Saskatchewan and Manitoba, Canada. J. Mater. Cycles Waste Manag. 2015, 18, 715–724. [Google Scholar] [CrossRef]
  6. Richter, A.; Ng, K.T.W.; Fallah, B. Bibliometric and text mining approaches to evaluate landfill design standards. Scientometrics 2019, 118, 1027–1049. [Google Scholar] [CrossRef]
  7. De, K.K. Regulatory Framework for Hazardous Waste Management in Canada. Can. U.S. Law J. 2002, 28, 115. [Google Scholar]
  8. Mrayyan, B.; Hamdi, M.R. Management approaches to integrated solid waste in industrialized zones in Jordan: A case of Zarqa City. Waste Manag. 2006, 26, 195–205. [Google Scholar] [CrossRef]
  9. Hannan, M.A.; Abdulla Al Mamun, M.; Hussain, A.; Basri, H.; Begum, R.A. A review on technologies and their usage in solid waste monitoring and management systems: Issues and challenges. Waste Manag. 2015, 43, 509–523. [Google Scholar] [CrossRef] [PubMed]
  10. Vitorino de Souza Melaré, A.; Montenegro González, S.; Faceli, K.; Casadei, V. Technologies and decision support systems to aid solid-waste management: A systematic review. Waste Manag. 2017, 59, 567–584. [Google Scholar] [CrossRef]
  11. Cervantes, D.E.T.; Martínez, A.T.; Hernández, M.C.; de Cortázar, A.L.G. Using indicators as a tool to evaluate municipal solid waste management: A critical review. Waste Manag. 2018, 80, 51–63. [Google Scholar] [CrossRef]
  12. Bolingbroke, D.; Ng, K.T.W.; Vu, H.L.; Richter, A. Quantification of solid waste management system efficiency using input-output indices. J. Mater. Cycles Waste Manag. 2021, 23, 1015–1025. [Google Scholar] [CrossRef]
  13. Pan, C.; Bolingbroke, D.; Ng, K.T.W.; Richter, A.; Vu, H.L. The Use of Waste Diversion Indices on the Analysis of Canadian Waste Management Models. J. Mater. Cycles Waste Manag. 2019, 21, 478–487. [Google Scholar] [CrossRef]
  14. Municipal Solid Waste and the Environment-Canada.ca. Available online: https://www.canada.ca/en/environment-climate-change/services/managing-reducing-waste/municipal-solid/environment.html (accessed on 24 April 2021).
  15. Statistics Canada. Boundary and Shapefile for Canadian Jurisdictions. Available online: https://www12.statcan.gc.ca/census-recensement/2011/geo/bound-limit/bound-limit-2011-eng.cfm (accessed on 1 April 2021).
  16. Government of Saskatchewan. Solid Waste Management Strategy-Publications Saskatchewan. Available online: https://publications.saskatchewan.ca/#/products/103931 (accessed on 14 April 2021).
  17. Karimi, N.; Richter, A.; Ng, K.T.W. Siting and ranking municipal landfill sites in regional scale using nighttime satellite imagery. J. Environ. Manag. 2020, 256, 109942. [Google Scholar] [CrossRef]
  18. University of Michigan. Municipal Solid Waste. Center for Sustainable Systems–University of Michigan. Available online: http://css.umich.edu/factsheets/municipal-solidwaste-factsheet (accessed on 14 April 2021).
  19. Chowdhury, A.; Vu, H.L.; Ng, K.T.W.; Richter, A.; Bruce, N. An investigation on Ontario’s non-hazardous municipal solid waste diversion using trend analysis. Can. J. Civil. Eng. 2017, 44, 861–870. [Google Scholar] [CrossRef]
  20. Richter, A.; Bruce, N.; Ng, K.T.; Chowdhury, A.; Vu, H.L. Comparison between Canadian and Nova Scotia waste management and diversion models-a Canadian case study. Sust. Cities Soc. 2017, 30, 139–149. [Google Scholar] [CrossRef]
  21. Zhu, J.; Huang, G. Contract-out planning of solid waste management system under uncertainty: Case study on Toronto, Ontario, Canada. J. Clean. Prod. 2017, 168, 1370–1380. [Google Scholar] [CrossRef]
  22. Richter, A.; Ng, K.T.W.; Pan, C. Effects of percent operating expenditure on Canadian non-hazardous waste diversion. Sust. Cities Soc. 2018, 38, 420–428. [Google Scholar] [CrossRef]
  23. Waste Transfer Stations: A Manual for Decision-Making. Available online: https://webcache.googleusercontent.com/search?q=cache:TJThYDpK0koJ:https://www.epa.gov/sites/production/files/2016-03/documents/r02002.pdf+&cd=1&hl=en&ct=clnk&gl=ca&client=firefox-b-d (accessed on 29 May 2021).
  24. Waste Transfer Stations Go Green. Available online: https://wasteadvantagemag.com/waste-transfer-stations-go-green/ (accessed on 29 May 2021).
  25. Sumathi, V.R.; Natesan, U.; Sarkar, C. GIS-based approach for optimized siting of municipal solid waste landfill. Waste Manag. 2008, 28, 2146–2160. [Google Scholar] [CrossRef] [PubMed]
  26. Manzo, C.; Mei, A.; Fontinovo, G.; Allegrini, A.; Bassani, C. Integrated remote sensing for multi-temporal analysis of anthropic activities in the south-east of Mt. Vesuvius National Park. J. Afr. Earth Sci. 2016, 122, 63–78. [Google Scholar] [CrossRef]
  27. Mahmood, K.; Batool, A.; Faiza, F.; Chaudhry, M.N.; Ul-Haq, Z.; Rana, A.D.; Tariq, S. Bio-thermal effects of open dumps on surroundings detected by remote sensing–influence of geographical conditions. Ecol. Ind. 2017, 82, 131–142. [Google Scholar] [CrossRef]
  28. Gizachew, K.; Suryabhagavan, K.V.; Mekuria, A.; Hameed, S. GIS-based solid waste landfill site selection in Addis Ababa, Ethiopia. Int. J. Ecol. Environ. Sci. 2012, 38, 59–72. [Google Scholar]
  29. Simões, P.; Marques, R.C. On the economic performance of the waste sector. A literature review. J. Environ. Manag. 2012, 106, 40–47. [Google Scholar] [CrossRef] [PubMed]
  30. Saja, A.M.A.; Zimar, A.M.Z.; Junaideen, S.M. Municipal Solid Waste Management Practices and Challenges in the Southeastern Coastal Cities of Sri Lanka. Sustainability 2021, 13, 4556. [Google Scholar] [CrossRef]
  31. Spigolon, L.M.; Giannotti, M.; Larocca, A.P.; Russo, M.A.T.; da C. Souza, N. Landfill siting based on optimisation, multiple decision analysis, and geographic information system analysis. Waste Manag. Res. 2018, 36, 606–615. [Google Scholar] [CrossRef]
  32. Land and Freshwater Area, by Province and Territory. Statistics Canada. Available online: https://web.archive.org/web/20110524063547/http://www40.statcan.gc.ca/l01/cst01/phys01-eng.htm (accessed on 21 April 2021).
  33. Rural Area (RA). Available online: https://www150.statcan.gc.ca/n1/pub/92-195-x/2011001/geo/ra-rr/ra-rr-eng.htm (accessed on 3 April 2021).
  34. Ng, K.T.W.; Lo, I.M.C. Fines Migration from Soil Daily Covers in Hong Kong Landfills. Waste Manag. 2010, 30, 2047–2057. [Google Scholar] [CrossRef]
  35. Pan, C.; Ng, K.T.W.; Richter, A. An Integrated Multivariate Statistical Approach for the Evaluation of Spatial Variations in Groundwater Quality near an Unlined Landfill. Environ. Sci. Pollut. Res. 2019, 26, 5724–5737. [Google Scholar] [CrossRef] [PubMed]
  36. Fallah, B.; Richter, A.; Ng, K.T.W.; Salama, A. Effects of groundwater metal contaminant spatial distribution on overlaying kriged maps. Environ. Sci. Pollut. Res. 2019, 26, 22945–22957. [Google Scholar] [CrossRef] [PubMed]
  37. Esri. ArcGIS Desktop: Release 10.7.1 Redlands; Environmental Systems Research Institute: Redlands, CA, USA, 2020. [Google Scholar]
  38. The Canadian Encyclopedia. Available online: https://www.thecanadianencyclopedia.ca/en/article/saskatchewan (accessed on 21 April 2021).
  39. Statistics Canada. Available online: https://www12.statcan.gc.ca/census-recensement/2016/dp-pd/hlt-fst/pd-pl/Table.cfm?Lang=Eng&T=302&SR=1&S=86&O=A&RPP=9999&PR=12 (accessed on 3 April 2021).
  40. Saskatchewan Solid Waste Management. Available online: https://geohub.saskatchewan.ca/datasets/5b2ee29d2a304caca29f6aa36060ae1a_0/data?geometry=-146.524%2C49.433%2C-62.896%2C58.442 (accessed on 15 January 2021).
  41. Municipal Revenue Sharing. Available online: https://www.saskatchewan.ca/government/municipal-administration/funding-finances-and-asset-management/funding/municipal-revenue-sharing (accessed on 7 April 2021).
  42. Rural Municipalities of Saskatchewan. Available online: https://sites.rootsweb.com/~cansk/kids/RuralMunicipality/Rural%20Municipalities%20of%20Saskatchewan.html (accessed on 17 April 2021).
  43. Canada: Saskatchewan. Census Divisions and Municipal Units. Available online: https://www.citypopulation.de/en/canada/saskatchewan/admin/ (accessed on 3 April 2021).
  44. Regression Definition. Available online: https://www.investopedia.com/terms/r/regression.asp (accessed on 3 April 2021).
  45. Richter, A.; Ng, K.T.W.; Karimi, N.; Li, R.Y.M. An iterative tessellation-based analytical approach to the design and planning of waste management regions. Comp. Environ. Urban Syst. 2021, 88, 101652. [Google Scholar] [CrossRef]
  46. Richter, A.; Ng, K.T.W.; Karimi, N.; Li, R.Y.M. The role of compactness distribution on the development of regionalized waste management systems. J. Clean Prod. 2021, 296, 126594. [Google Scholar] [CrossRef]
  47. Size of US Sates by Area. Available online: https://www.nationsonline.org/oneworld/US-states-by-area.htm (accessed on 23 April 2021).
  48. Countries Compared. Available online: https://www.nationmaster.com/country-info/stats/Geography/Land-area/Sq.-km (accessed on 23 April 2021).
Figure 1. Map of Saskatchewan showing operational landfills and transfer stations in (a) 2017 and (b) 2020.
Sustainability 13 06887 g001
Figure 2. The relationship between operational landfills and transfer stations to division land area in (a) 2017, and (b) 2020.
Sustainability 13 06887 g002
Figure 3. Regression analysis for (a) operation landfills and (b) transfer stations with respect to division land area (Note: Division 18, with a land area of 270,000 km2, is excluded).
Sustainability 13 06887 g003
Figure 4. Regression analysis between the number of waste facilities and annual budget in 2017 and 2020: (a) all operation landfills, (b) all transfer stations. * Division 18 is excluded.
Sustainability 13 06887 g004
Figure 5. The relationship between operational landfills and transfer stations to population density of the division in (a) 2017, (b) 2020.
Sustainability 13 06887 g005
Figure 6. Regression analysis for (a) operation landfills; (b) transfer stations against population density in 2017 and 2020. Data from divisions 6 and 11 are excluded.
Sustainability 13 06887 g006aSustainability 13 06887 g006b
Figure 7. Landfill to transfer station ratio in 2017 and 2020 with respect to (a) population distribution, (b) land area.
Sustainability 13 06887 g007aSustainability 13 06887 g007b
Table 1. Study area.
TitleInformationMap
Total area651,040 km2 Sustainability 13 06887 i001
Total land area591,670 km2
Approximate population in 20161,098,400
Number of census divisions18
Capital cityRegina
Most populated citySaskatoon
Publisher’s Note: MDPI stays neutral with regard to jurisdictional claims in published maps and institutional affiliations.

