
How Does China’s Economic Policy Uncertainty Affect the Sustainability of Its Net Grain Imports?


Abstract
:1. Introduction
2. Literature Review
3. Data and Methods
3.1. Economic Sustainability
3.1.1. Measurement of Import Potential Ratio
3.1.2. Measurement of Trade Cost
3.2. Environmental Sustainability
3.2.1. Measurement of Virtual Land
3.2.2. Measurement of Virtual Water
- Water Evaporation of Grain ()
- 2.
- Green Water Footprint of Grain Production ()
- 3.
- Blue Water Footprint of Grain Production ()
- 4.
- Total Water Footprint of Grain Production ()
3.2.3. Measurement of Carbon Emissions
3.3. TVP-SV-VAR Model
3.4. Data Description
4. Results and Analysis
4.1. Sustainability of China’s Net Grain Imports
4.1.1. Economic Sustainability of China’s Net Grain Imports
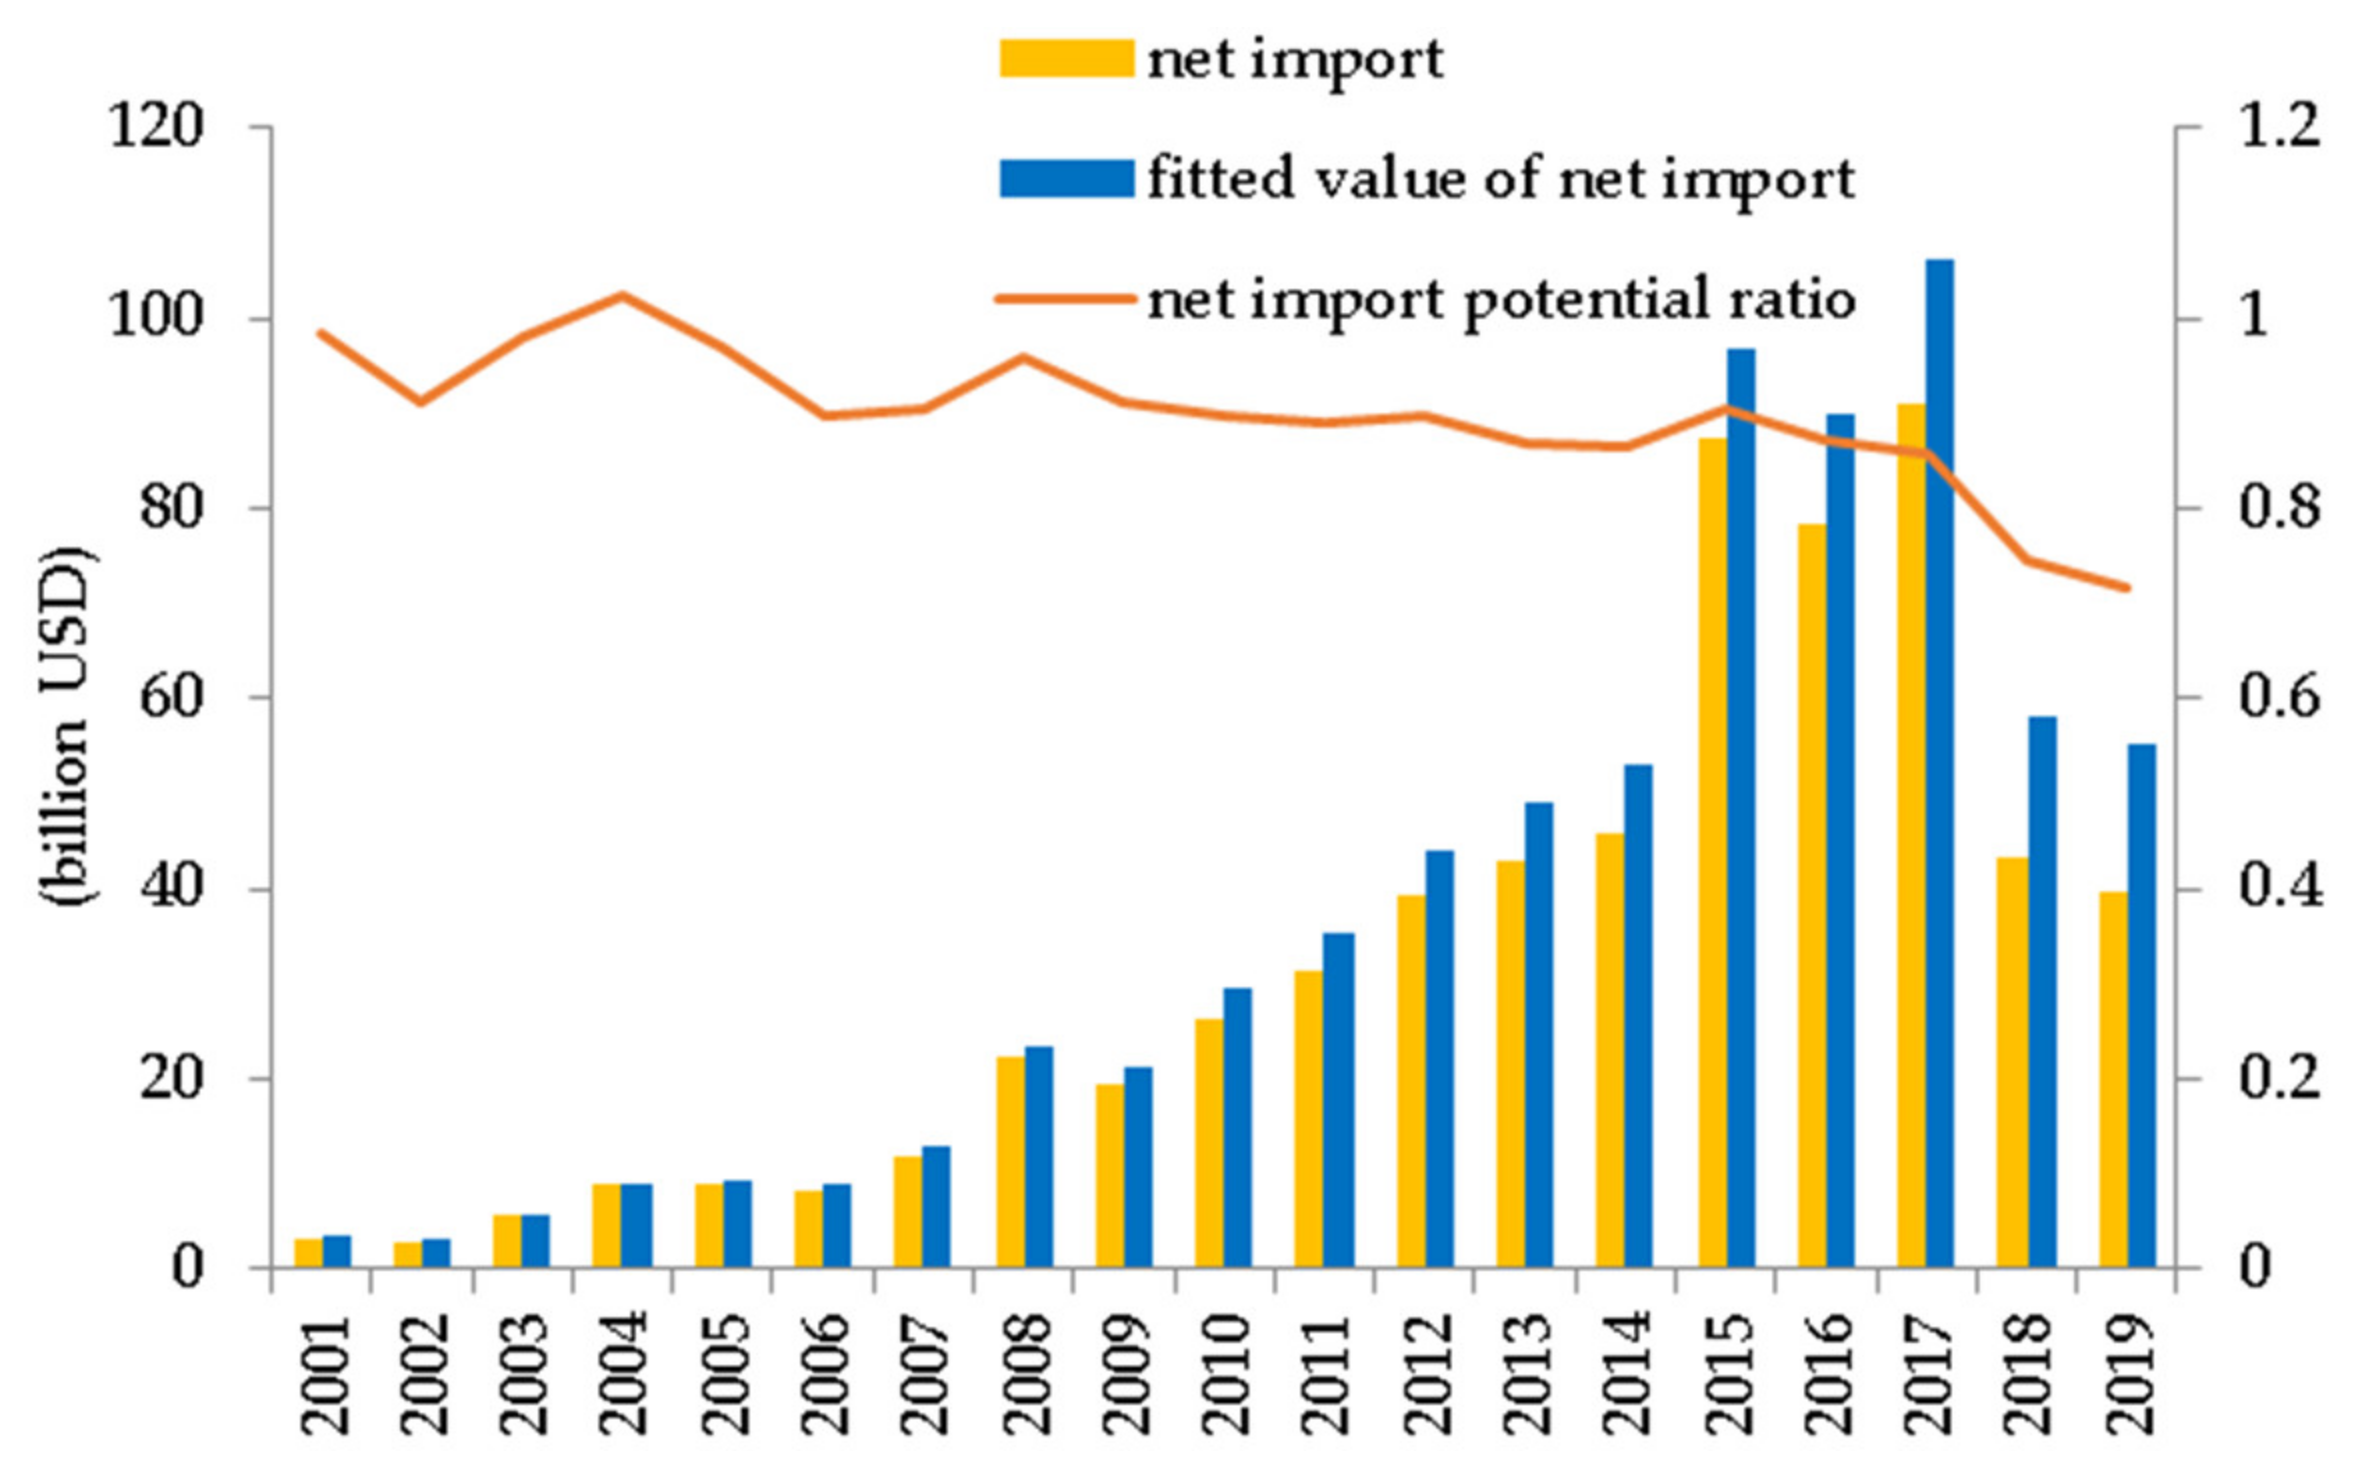
- Net Grain Import Potential Ratio
- 2.
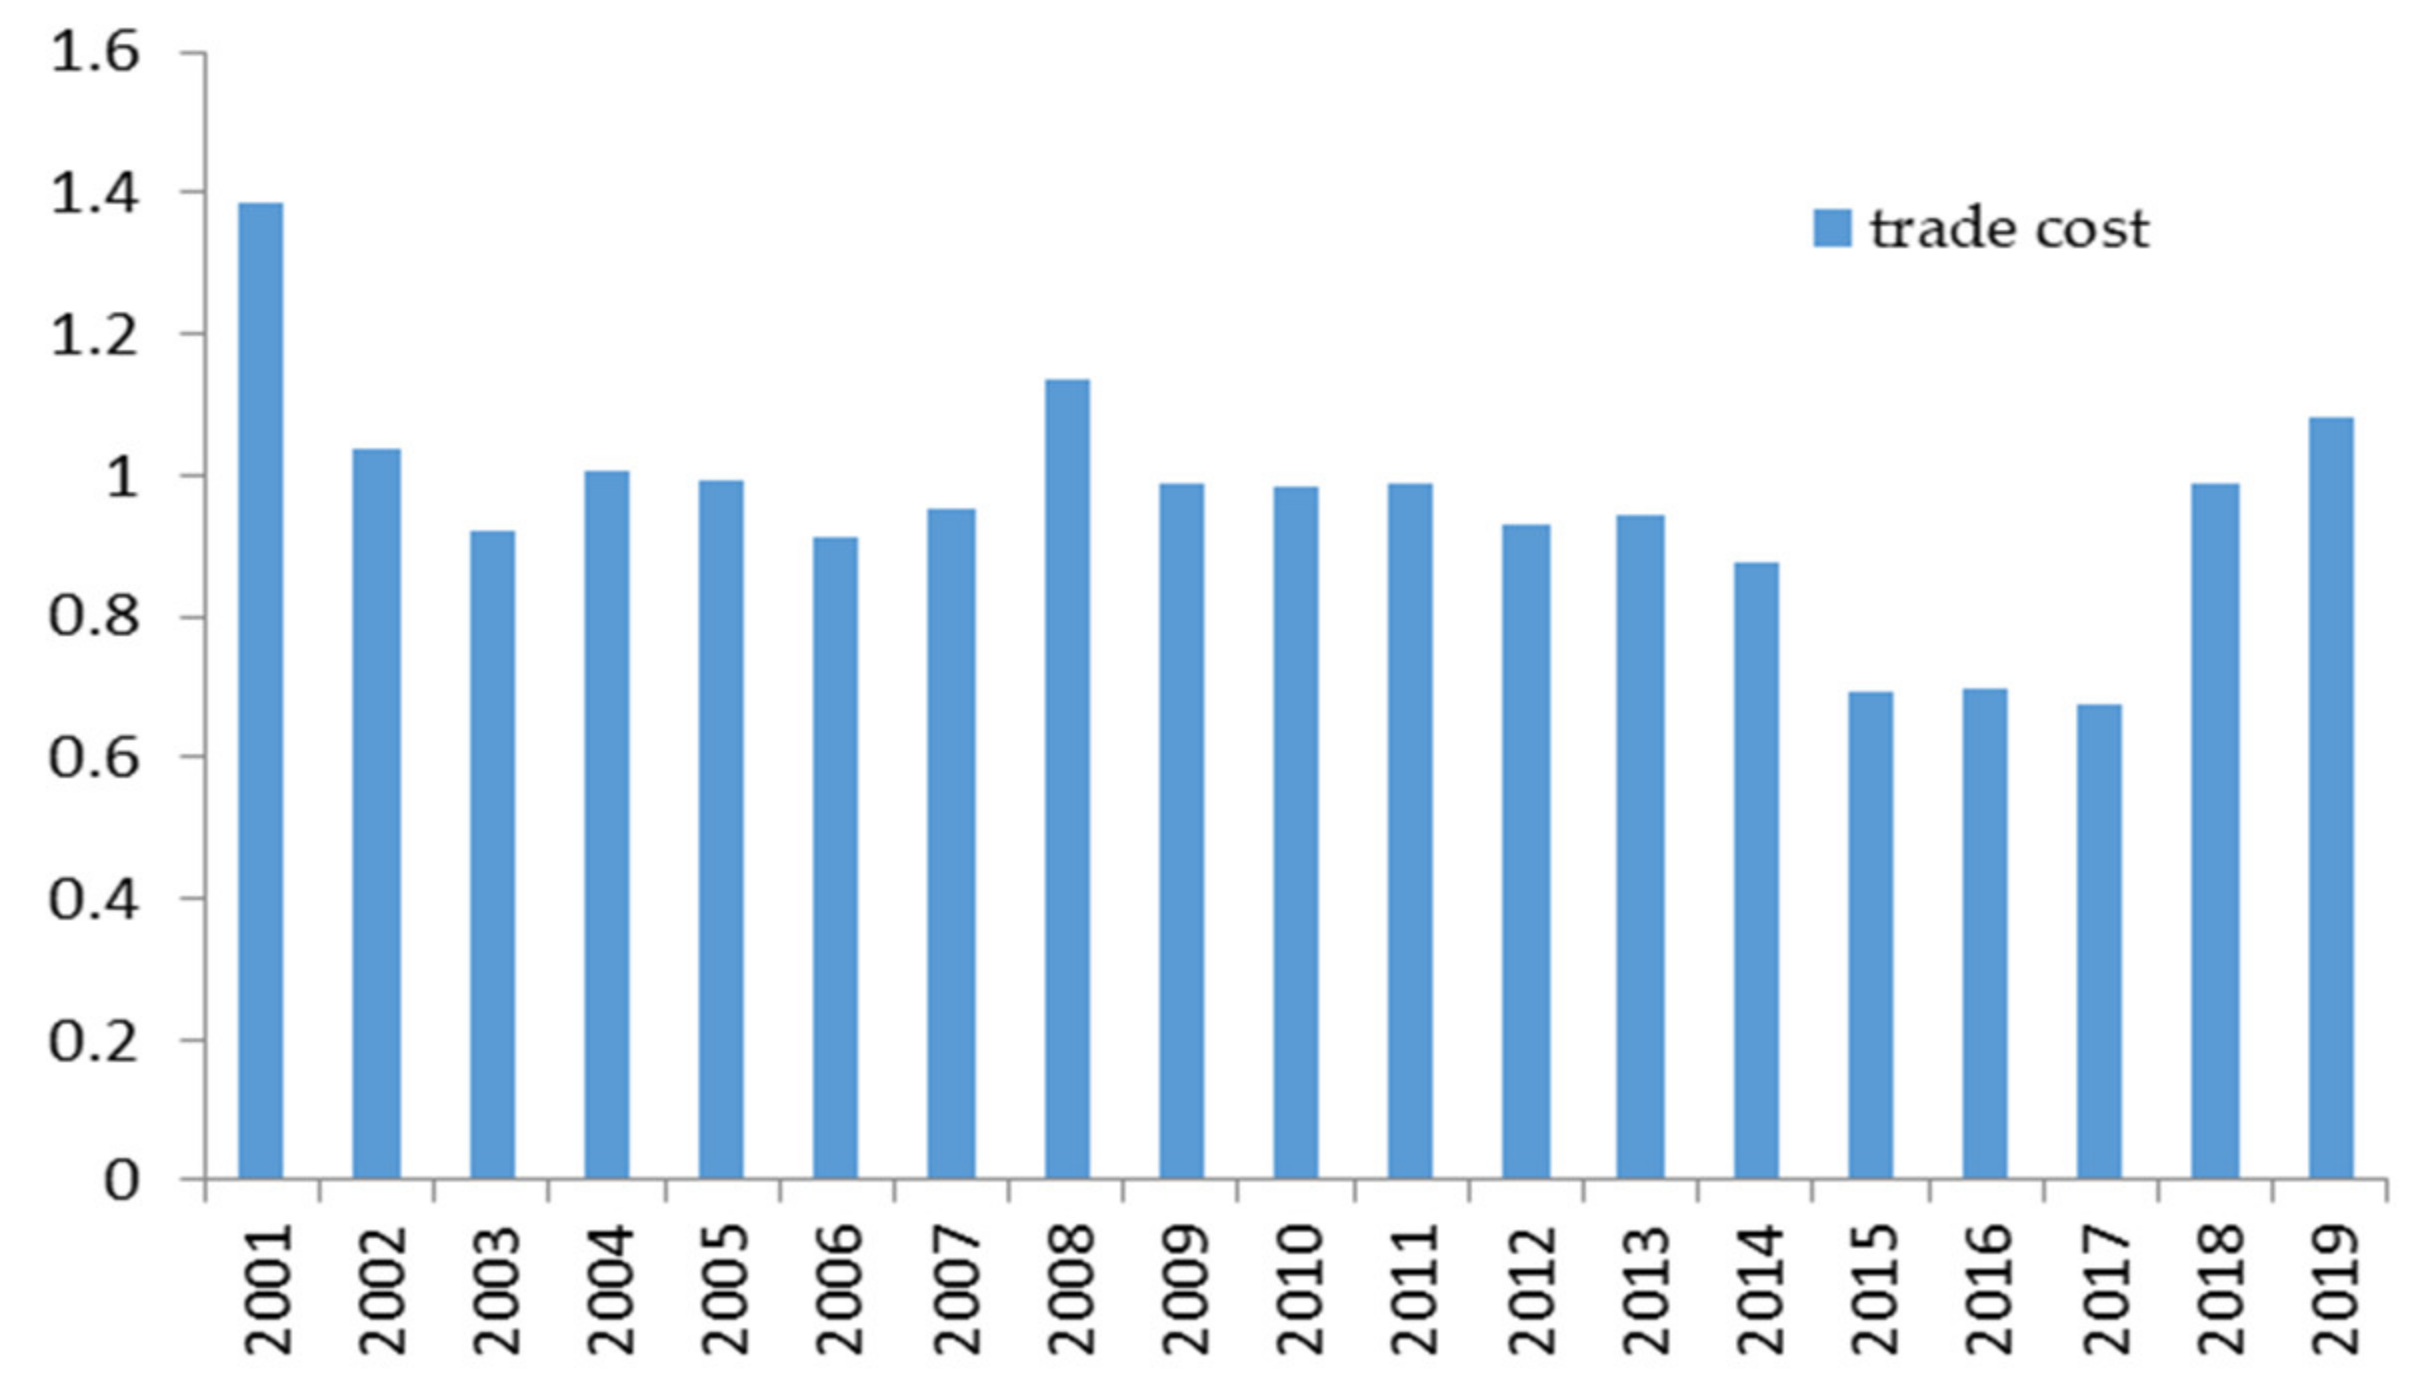
- Grain Trade Cost
4.1.2. Environmental Sustainability of China’s Net Grain Imports
4.2. Impact of China’s EPU on the Sustainability of Its Net Grain Imports
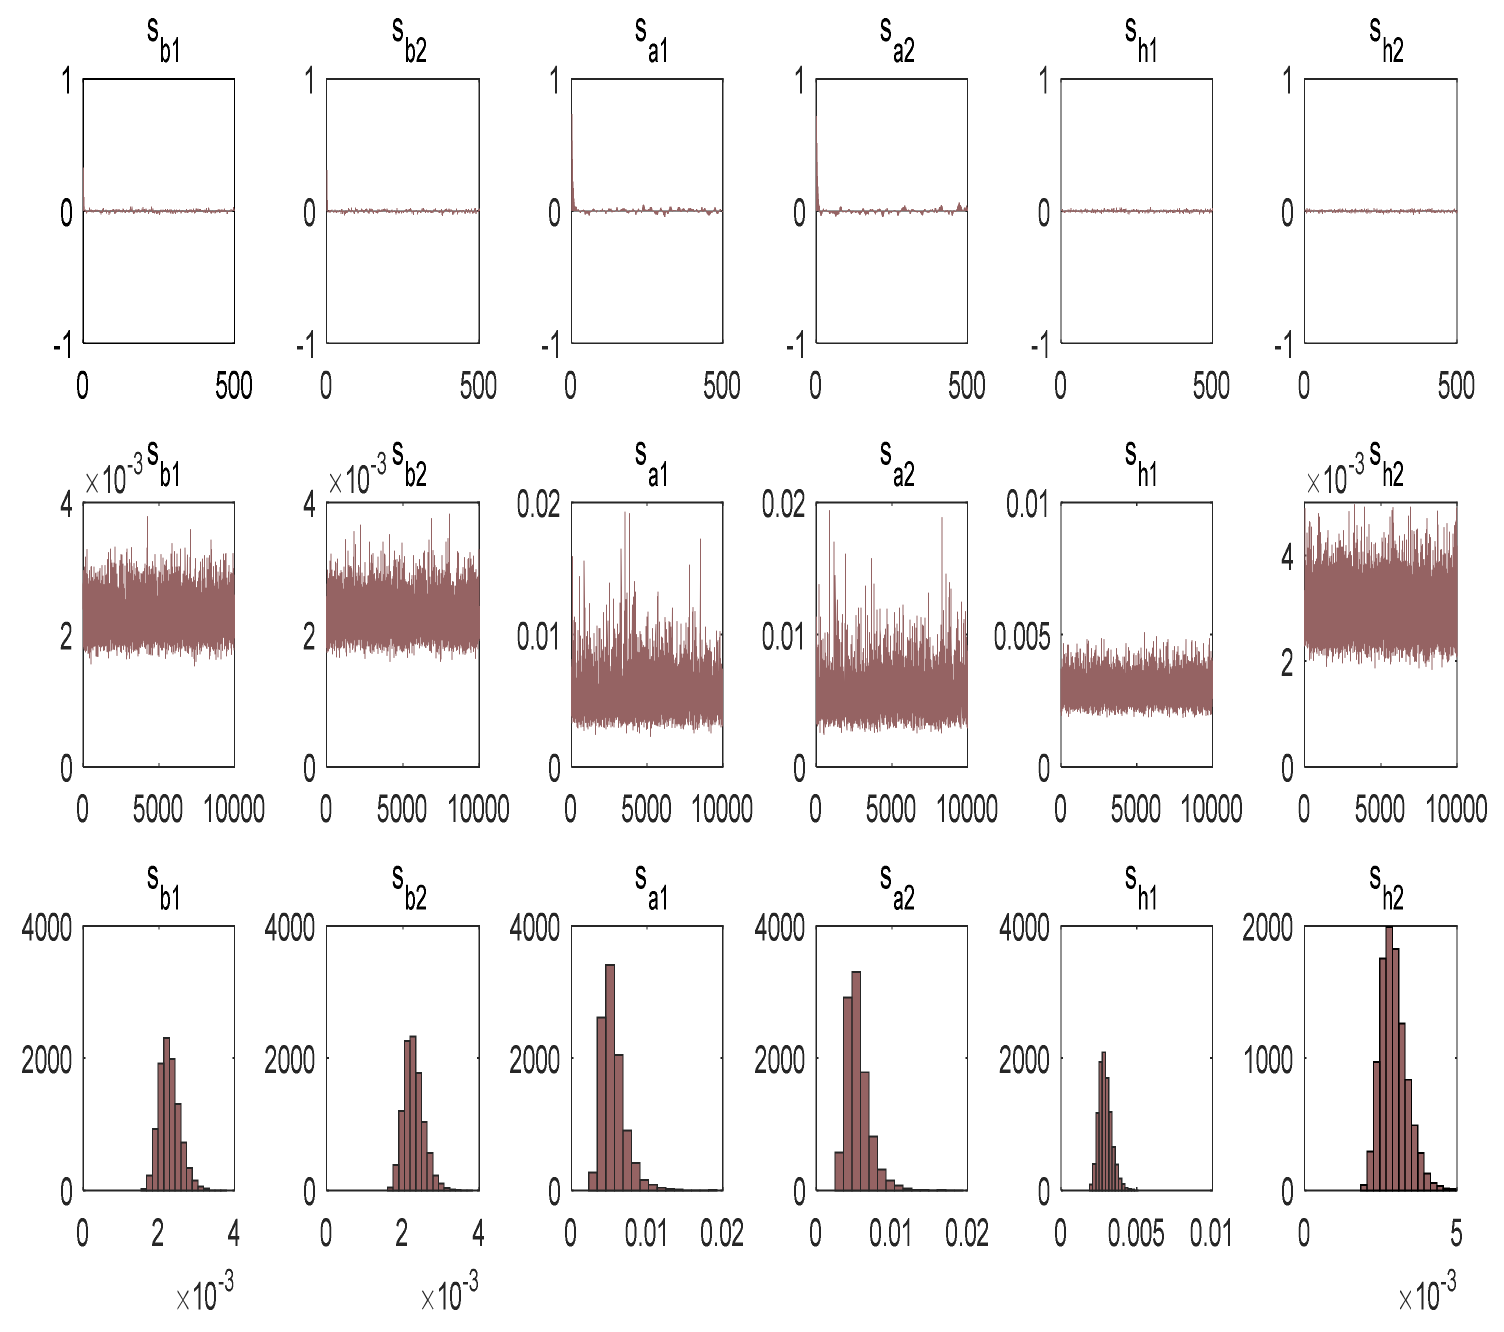
4.2.1. TVP-SV-VAR Model Test
4.2.2. Impulse Response Results
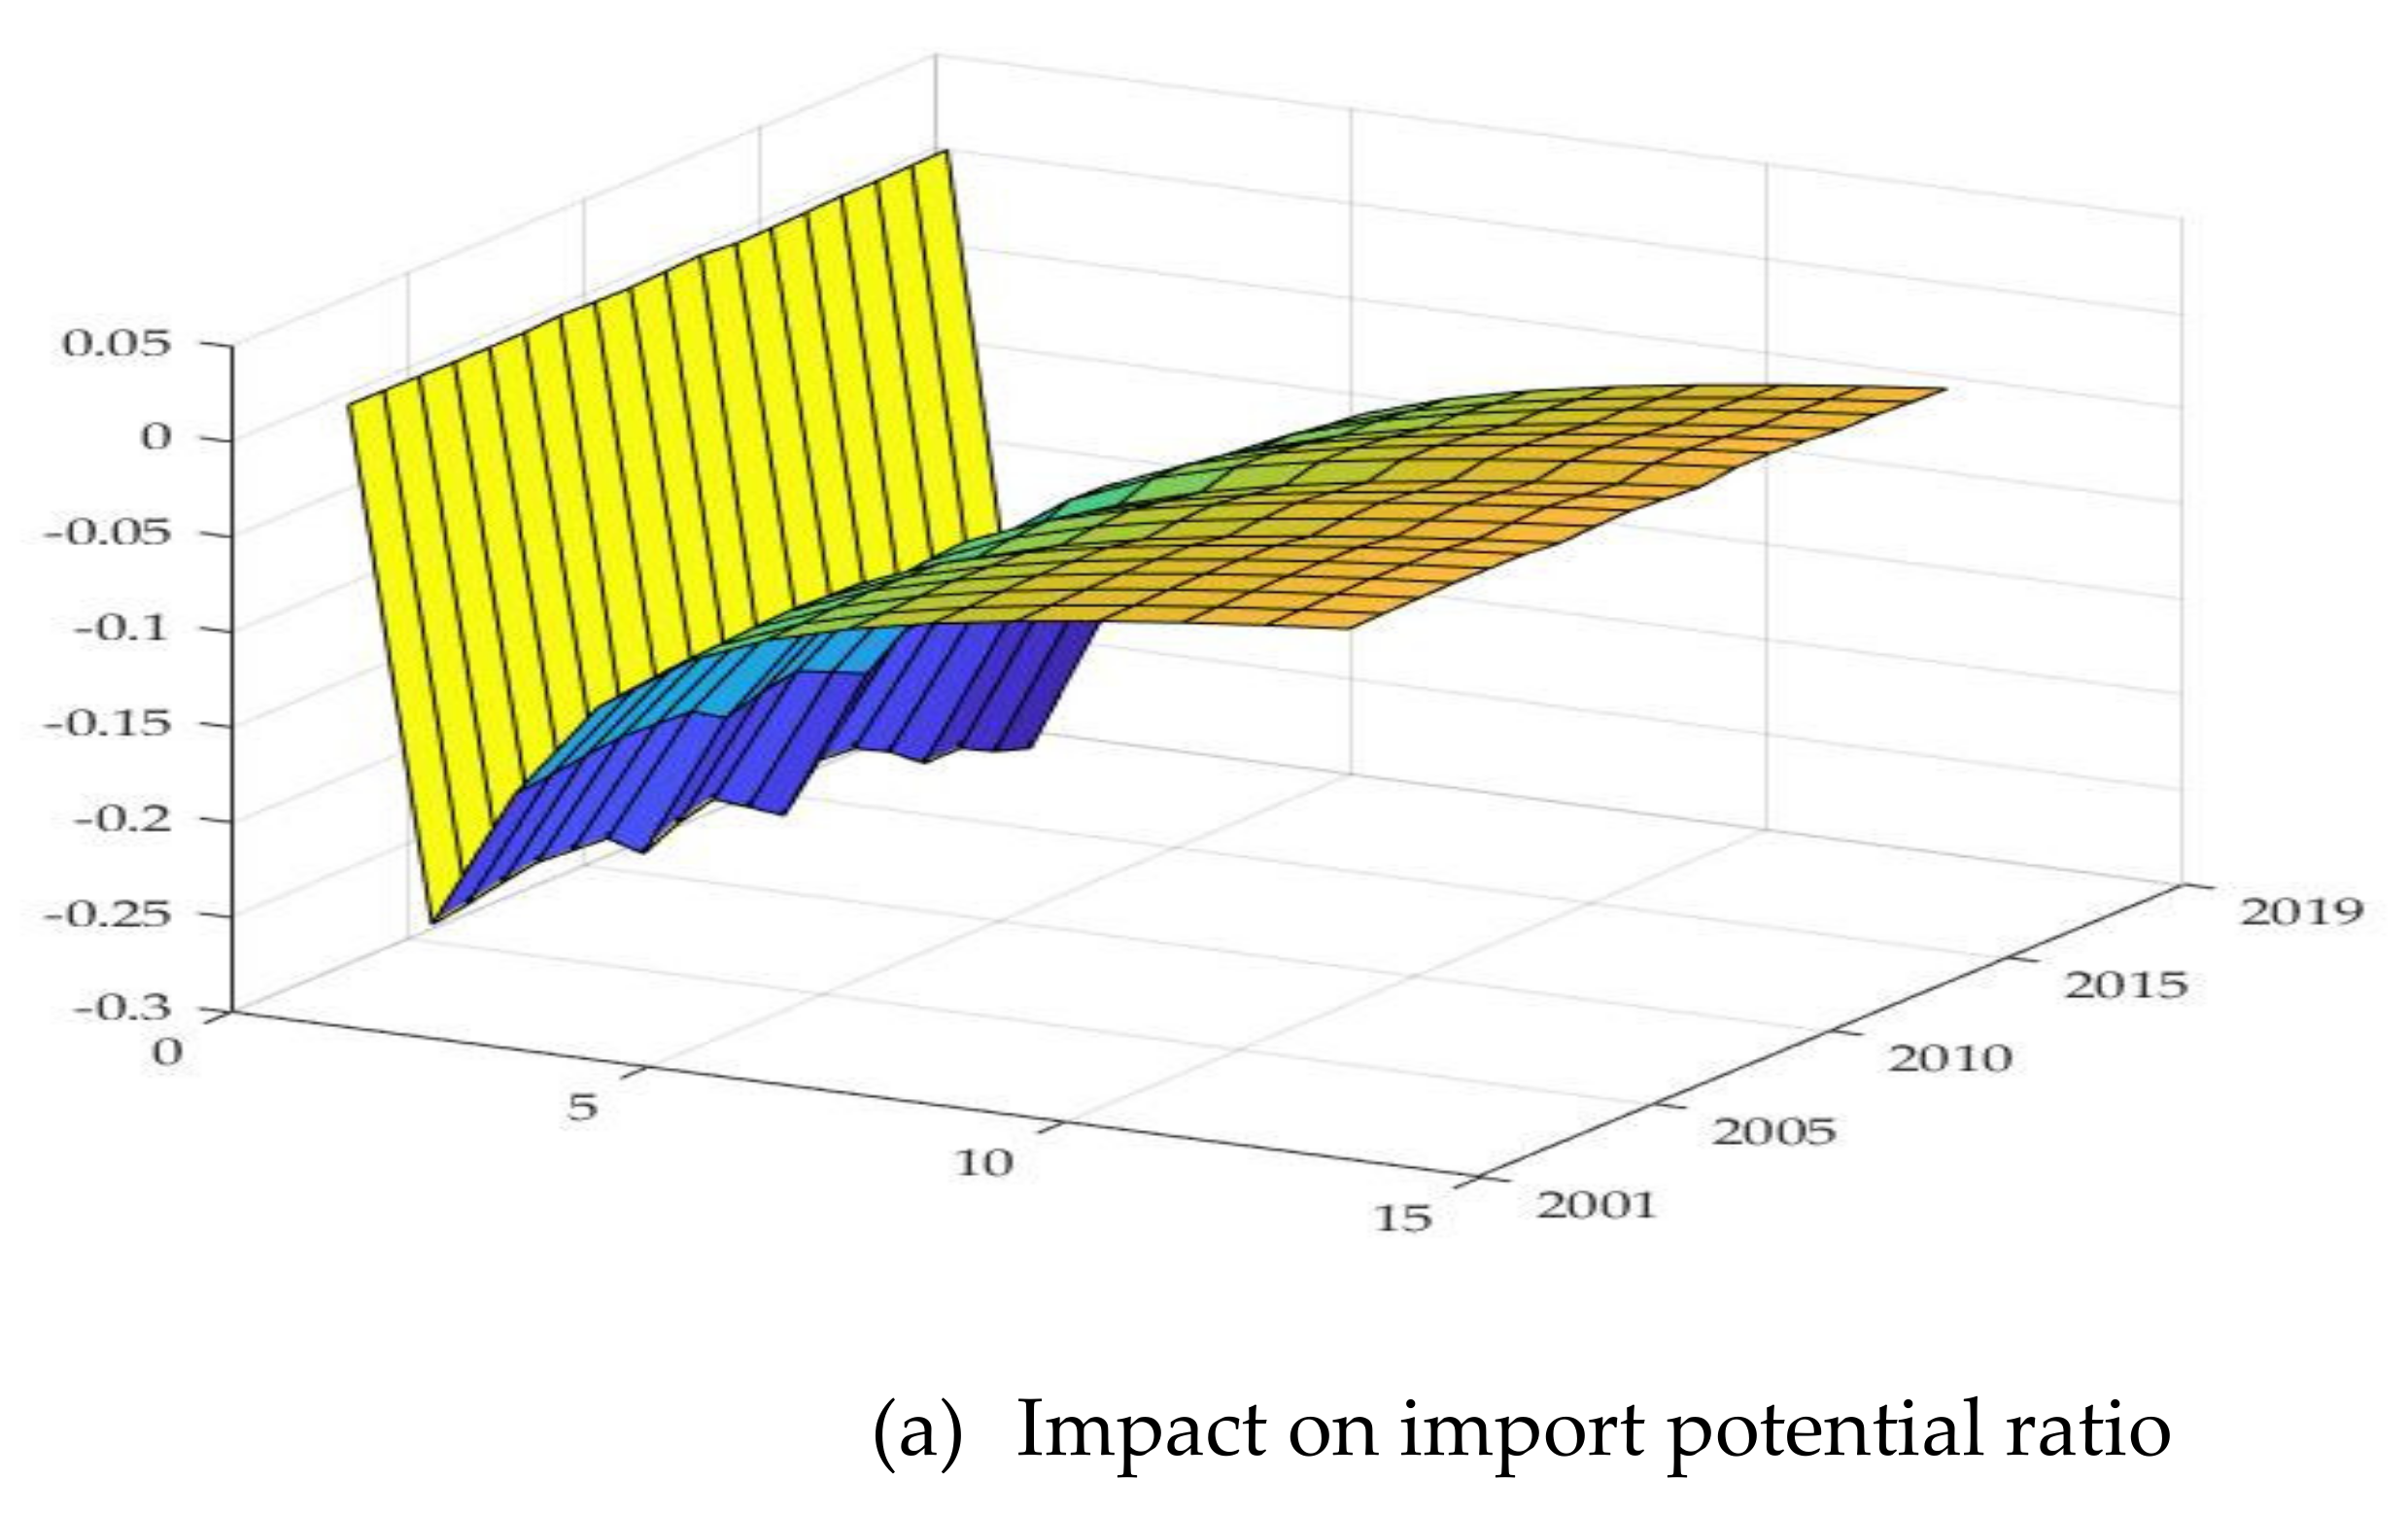
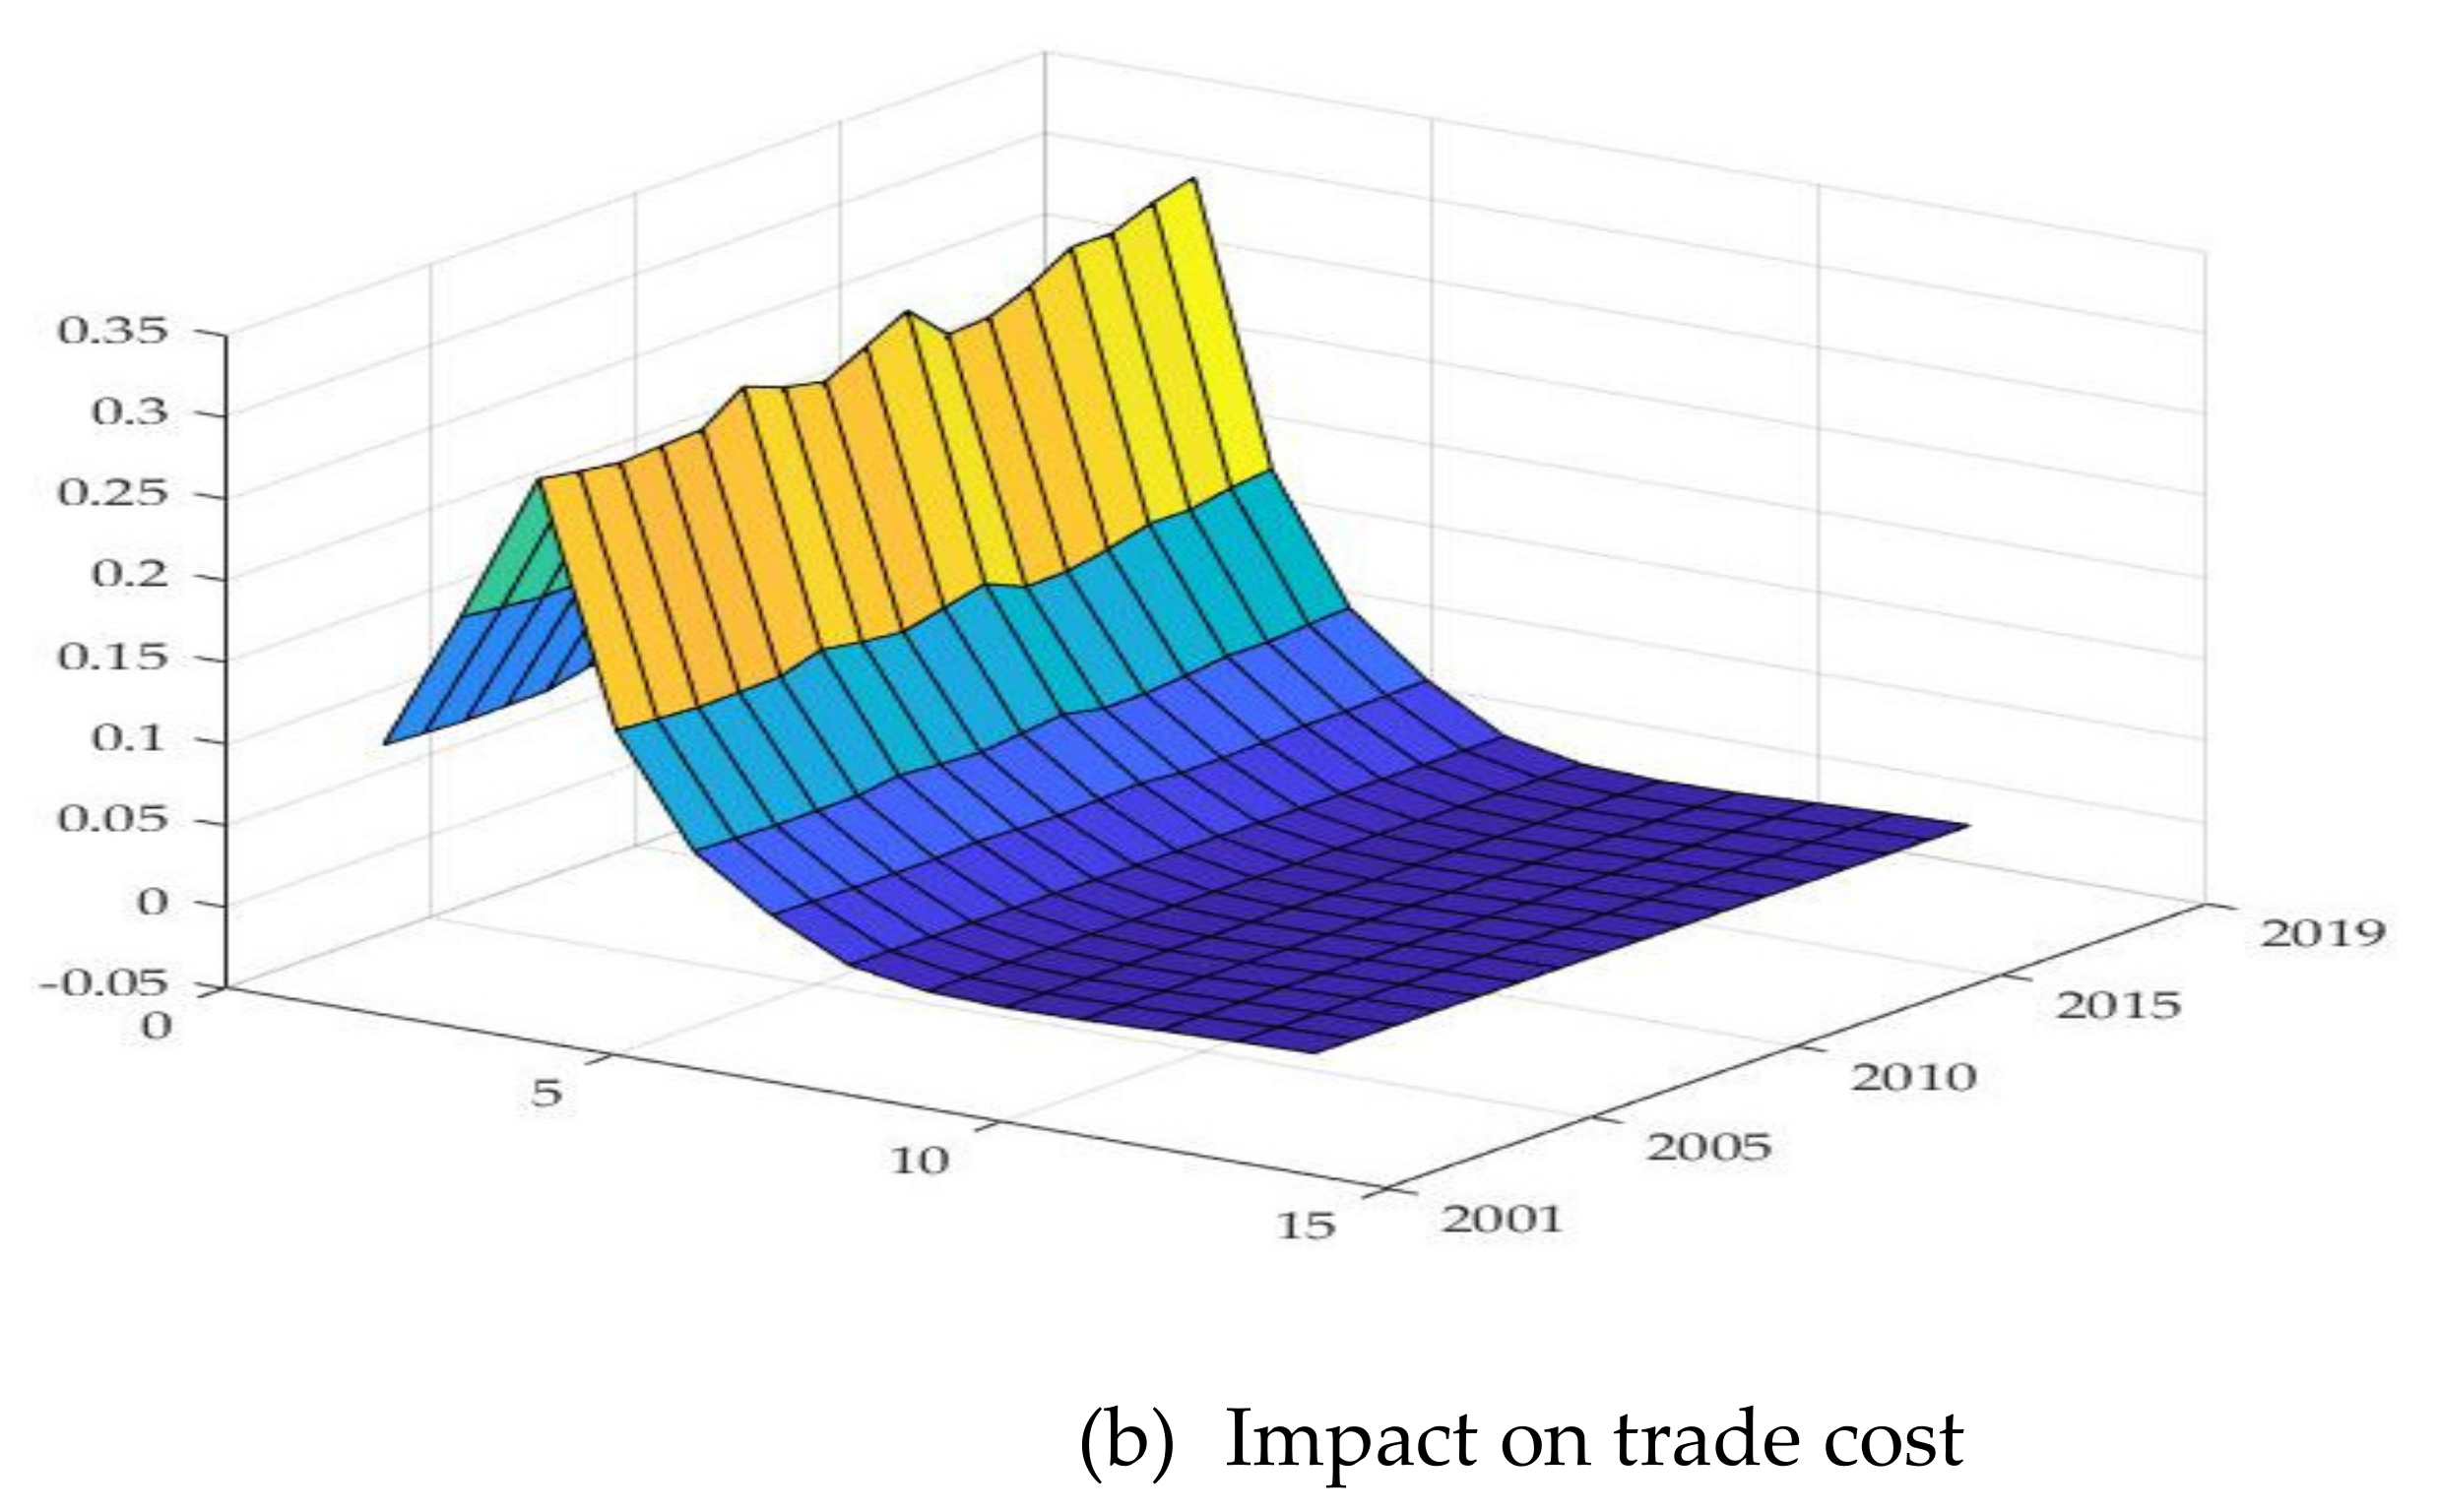
- Impact of China’s EPU on the Economic Sustainability of Its Net Grain Imports
- 2.
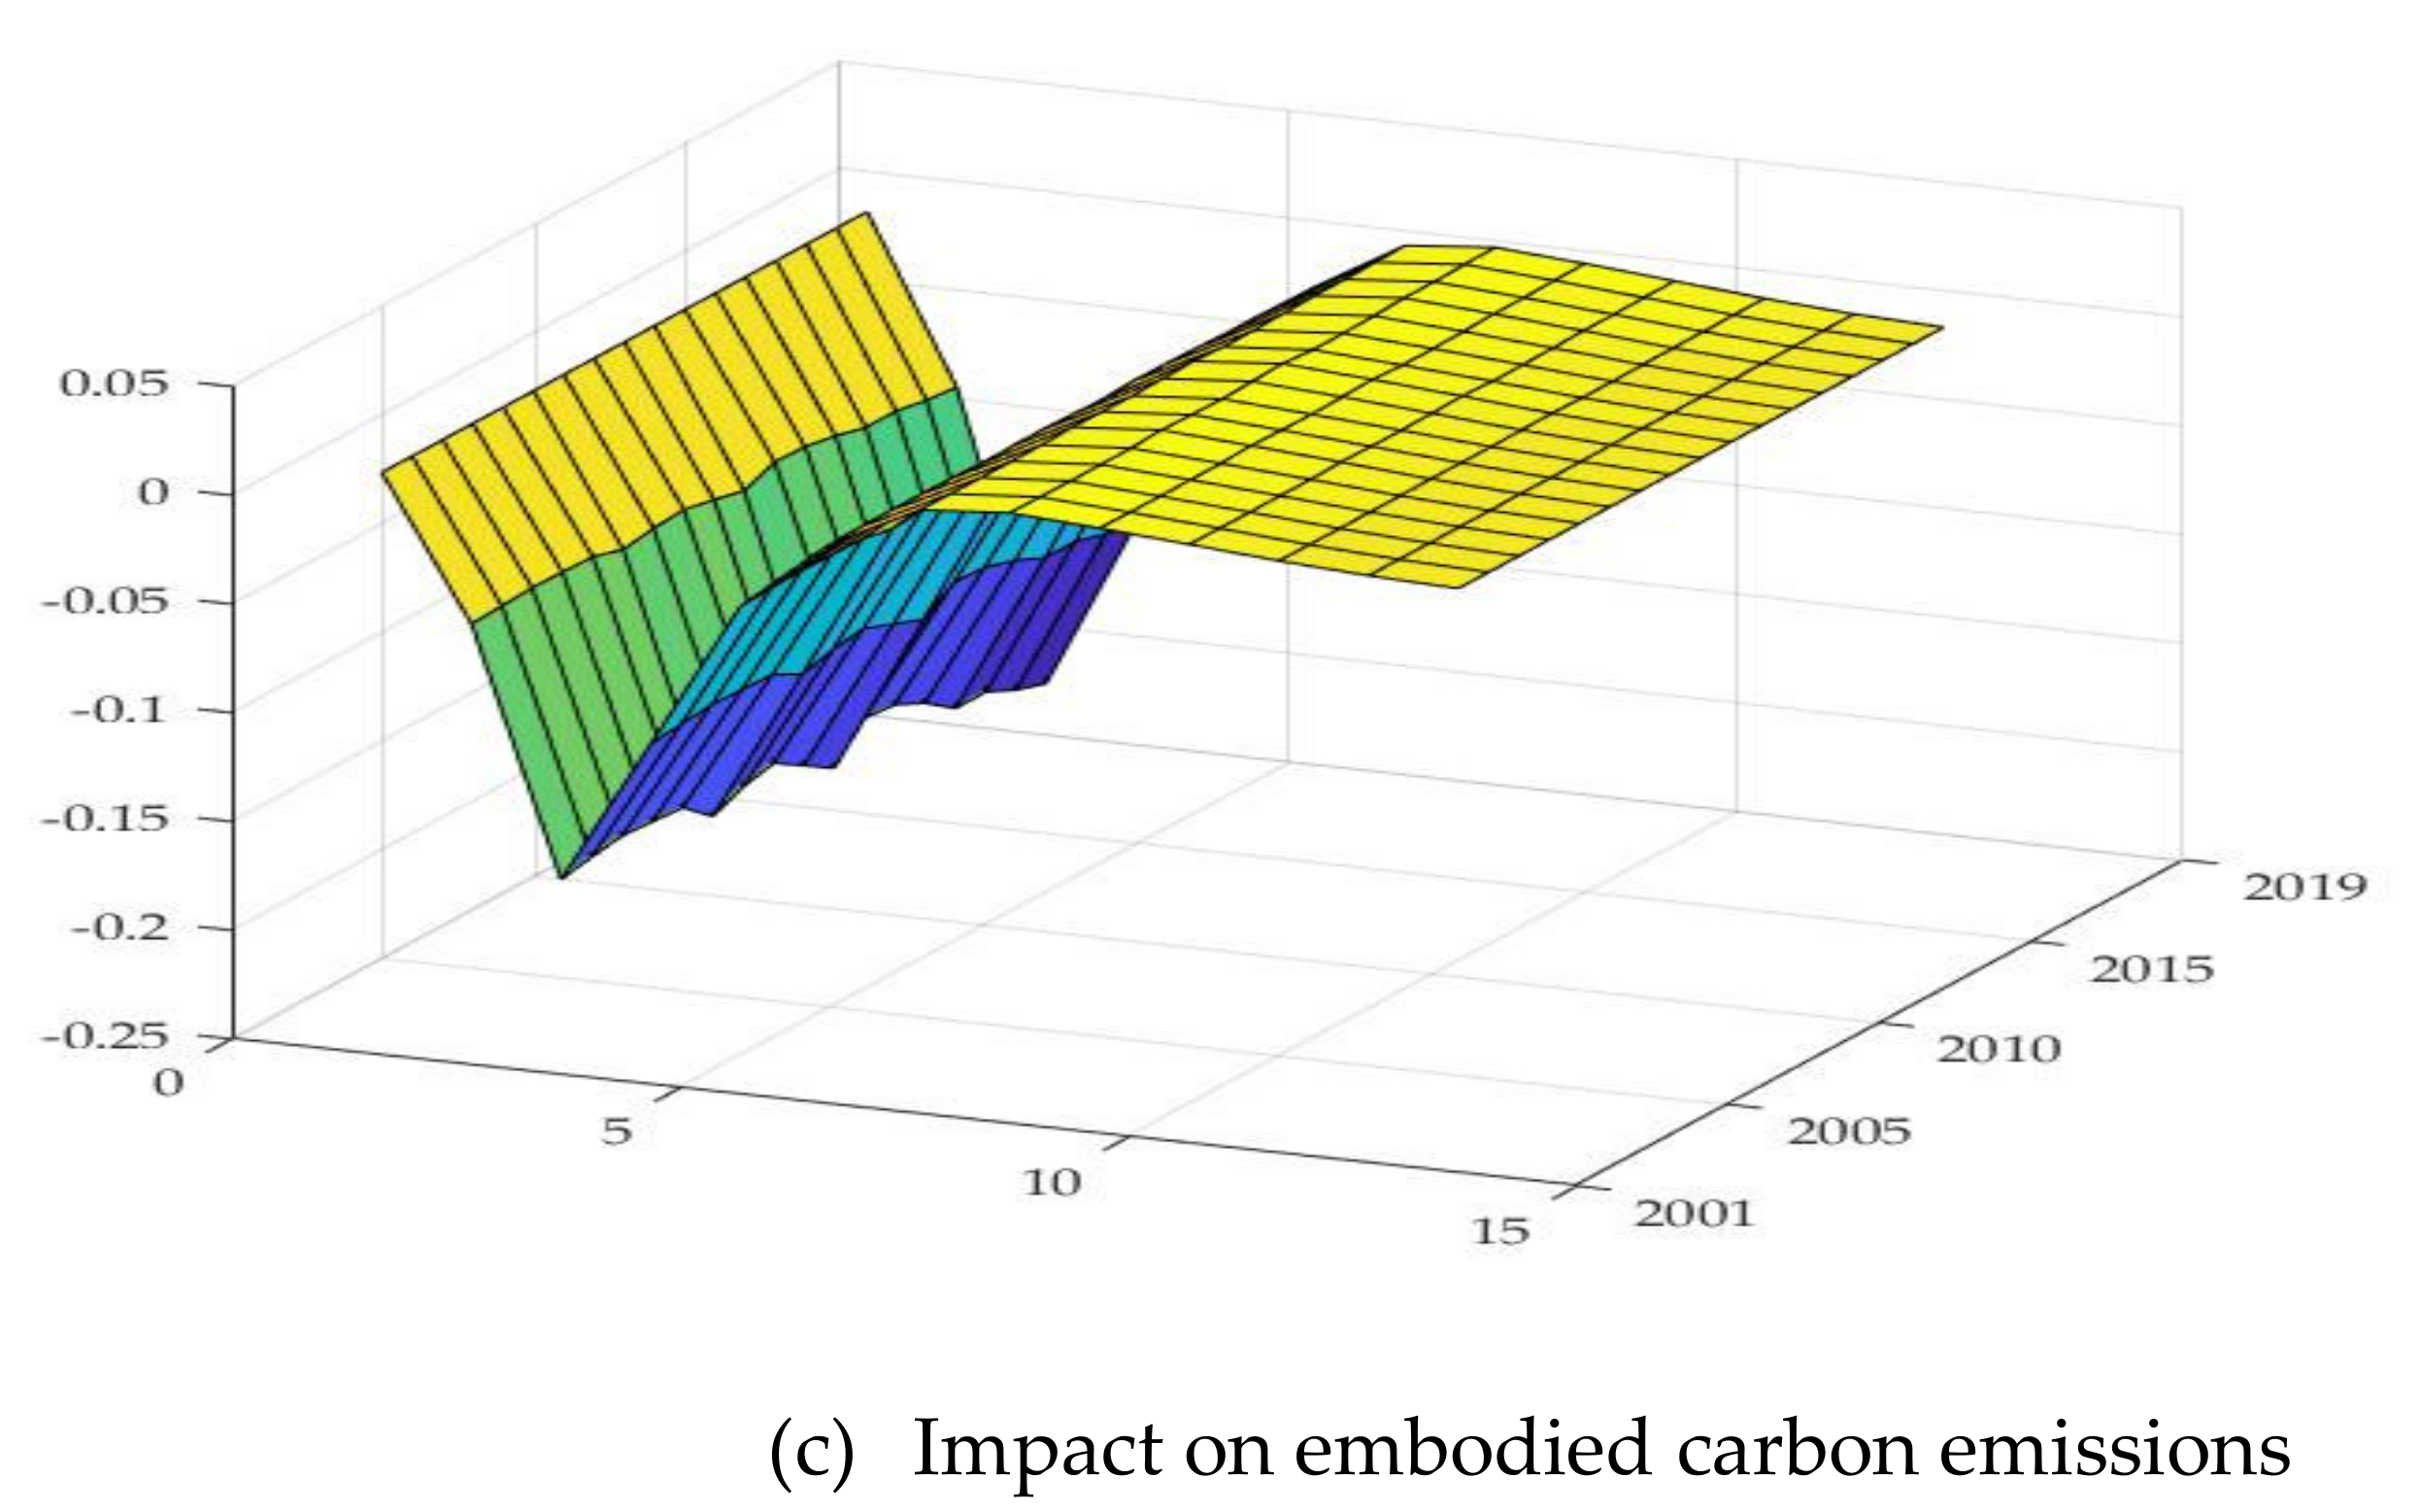
- Impact of China’s EPU on the Environmental Sustainability of Its Net Grain Imports
- 3.
- Impact of China’s EPU on Overall Sustainability of Its Net Grain Imports
5. Conclusions and Implications
5.1. Conclusions
5.2. Implications
Author Contributions
Funding
Conflicts of Interest
References
- Huang, J.; Wei, W.; Cui, Q.; Xie, W. The prospects for China’s food security and imports: Will China starve the world via imports? J. Integr. Agric. 2017, 16, 2933–2944. [Google Scholar] [CrossRef]
- Jiang, S.; Wang, J.; Zhao, Y.; Shang, Y.; Gao, X.; Li, H.; Wang, Q.; Zhu, Y. Sustainability of water resources for agriculture considering grain production, trade and consumption in China from 2004 to 2013. J. Clean. Prod. 2017, 149, 1210–1218. [Google Scholar] [CrossRef] [Green Version]
- He, G.; Zhao, Y.; Wang, L.; Jiang, S.; Zhu, Y. China’s food security challenge: Effects of food habit changes on requirements for arable land and water. J. Clean. Prod. 2019, 229, 739–750. [Google Scholar] [CrossRef]
- Yang, H.; Wang, L.; Zehnder, A.J.B. Water scarcity and food trade in the Southern and Eastern Mediterranean countries. Food Policy 2007, 32, 585–605. [Google Scholar] [CrossRef]
- Wang, J.; Li, Y.; Huang, J.; Yan, T.; Sun, T. Growing water scarcity, food security and government responses in China. Glob. Food Secur. 2017, 14, 9–17. [Google Scholar] [CrossRef]
- Piao, S.; Ciais, P.; Huang, Y.; Shen, Z.; Peng, Z.; Li, J.; Zhou, L.; Liu, H.; Ma, Y.; Ding, Y.; et al. The impacts of climate change on water resources and agriculture in China. Nature 2010, 467, 43–51. [Google Scholar] [CrossRef] [PubMed]
- Dalin, C.; Hanasaki, N.; Qiu, H.; Mauzerall, D.L.; Rodriguez, I.I. Water resources transfers through Chinese interprovincial and foreign food trade. Proc. Natl. Acad. Sci. USA 2014, 111, 9774–9779. [Google Scholar] [CrossRef] [Green Version]
- Grossman, G.M.; Krueger, A.B. Environmental Impacts of a North American Free Trade Agreement; NBER Working Paper No. W3914; National Bureau of Economic Research: Cambridge, MA, USA, 1991. [Google Scholar]
- International Chamber of Commerce (ICC). Global Trade: Securing Future Growth. International Chamber of Commerce, 2018. Available online: https://iccwbo.org/publication/global-survey-2018-securing-future-growth/ (accessed on 17 June 2021).
- Armstrong, S. Measuring Trade and Trade Potential: A Survey; Asia Pacific Economic Paper No. 368; Australian National University (ANU): Canberra, Australia, 2007. [Google Scholar]
- Egger, P. An Econometric view on the estimation of Gravity Models and the calculation of trade potentials. World Econ. 2002, 25, 297–312. [Google Scholar] [CrossRef] [Green Version]
- Renjini, V.R.; Kar, A.; Jha, G.K.; Kumar, P.; Burman, R.R.; Praveen, K.V. Agricultural trade potential between India and ASEAN: An application of gravity model. Agric. Econ. Res. Rev. 2017, 30, 105–113. [Google Scholar] [CrossRef] [Green Version]
- Jagdambe, S.; Kannan, E. Effects of ASEAN-India Free Trade Agreement on agricultural trade: The gravity model approach. World Dev. Perspect. 2020, 19, 100212. [Google Scholar] [CrossRef]
- Butter, F.A.G.D.; Mosch, R.H.J. Trade, Trust and Transaction Costs; Tinbergen Institute Discussion Paper No. 03-082/3; Department of Economics, Vrije Universiteit Amsterdam, and Tinbergen Institute: Amsterdam, The Netherlands, 2003. [Google Scholar]
- Anderson, J.E.; van Wincoop, E. Gravity with gravitas: A solution to the border puzzle. Am. Econ. Rev. 2003, 93, 170–192. [Google Scholar] [CrossRef] [Green Version]
- Jacks, D.S.; Meissner, C.M.; Novy, D. Trade costs, 1870–2000. Am. Econ. Rev. Pap. Proc. 2008, 98, 529–534. [Google Scholar] [CrossRef] [Green Version]
- Tuninetti, M.; Luca, R.; Laio, F. Charting out the future agricultural trade and its impact on water resources. Sci. Total Environ. 2020, 714, 136626. [Google Scholar] [CrossRef] [PubMed]
- Zhang, Y.; Zhang, J.; Tang, G.; Chen, M.; Wang, L. Virtual water flows in the international trade of agricultural products of China. Sci. Total Environ. 2016, 557–558, 1–11. [Google Scholar] [CrossRef] [PubMed]
- Zhang, Y.; Zhang, J.; Wang, C.; Cao, J.; Liu, Z.; Wang, L. China and Trans-Pacific Partnership Agreement countries: Estimation of the virtual water trade of agricultural products. J. Clean. Prod. 2017, 140, 1493–1503. [Google Scholar] [CrossRef]
- Lamastra, L.; Miglietta, P.P.; Toma, P.; De Leo, F.; Massari, S. Virtual water trade of agri-food products: Evidence from Italian-Chinese relations. Sci. Total Environ. 2017, 599–600, 474–482. [Google Scholar] [CrossRef] [PubMed]
- Qiang, W.; Niu, S.; Liu, A.; Kastner, T.; Bie, Q.; Wang, X.; Cheng, S. Trends in global virtual land trade in relation to agricultural products. Land Use Policy 2020, 92, 104439. [Google Scholar] [CrossRef]
- Qiang, W.; Liu, A.; Cheng, S.; Kastner, T.; Xie, G. Agricultural trade and virtual land use: The case of China’s crop trade. Land Use Policy 2013, 33, 141–150. [Google Scholar] [CrossRef]
- Taherzadeh, O.; Caro, D. Drivers of water and land use embodied in international soybean trade. J. Clean. Prod. 2019, 223, 83–93. [Google Scholar] [CrossRef]
- Grosso, S.J.D.; Mosier, A.R.; Parton, W.J.; Ojima, D.S. DAYCENT model analysis of past and contemporary soil N2O and net greenhouse gas flux for major crops in the USA. Soil Tillage Res. 2005, 83, 9–24. [Google Scholar]
- Niu, B.; Peng, S.; Li, C.; Liang, Q.; Li, X.; Wang, Z. Nexus of embodied land use and greenhouse gas emissions in global agricultural trade: A quasi-input–output analysis. J. Clean. Prod. 2020, 267, 122067. [Google Scholar] [CrossRef]
- Escobar, N.; Tizado, E.J.; zuErmgassen, E.K.H.J.; Löfgren, P.; Börner, J.; Godar, J. Spatially-explicit footprints of agricultural commodities: Mapping carbon emissions embodied in Brazil’s soy exports. Glob. Environ. Chang. 2020, 62, 102067. [Google Scholar] [CrossRef]
- Gulen, H.; Ion, M. Policy uncertainty and corporate investment. Rev. Finan. Stud. 2016, 29, 523–564. [Google Scholar] [CrossRef]
- Baker, S.; Bloom, N.; Davis, S. Measuring economic policy uncertainty. Quart. J. Econ. 2016, 131, 1593–1636. [Google Scholar] [CrossRef]
- Fontaine, I.; Didier, L.; Razafindravaosolonirina, J. Foreign policy uncertainty shocks and US macroeconomic activity: Evidence from China. Econ. Lett. 2017, 155, 121–125. [Google Scholar] [CrossRef]
- Meinen, P.; Roehe, O. On measuring uncertainty and its impact on investment: Cross-country evidence from the euro area. Eur. Econ. Rev. 2017, 92, 161–179. [Google Scholar] [CrossRef]
- Su, R.; Du, J.; Shahzad, F.; Long, X. Unveiling the Effect of Mean and Volatility Spillover between the United States Economic Policy Uncertainty and WTI Crude Oil Price. Sustainability 2020, 12, 6662. [Google Scholar] [CrossRef]
- Song, Y.; Hao, F.; Hao, X.; Gozgor, G. Economic Policy Uncertainty, Outward Foreign Direct Investments, and Green Total Factor Productivity: Evidence from Firm-Level Data in China. Sustainability 2021, 13, 2339. [Google Scholar] [CrossRef]
- Novy, D.; Taylor, A.M. Trade and Uncertainty; NBER Working Paper No. 1266; National Bureau of Economic Research: London, UK, 2014. [Google Scholar]
- Handley, K. Exporting under trade policy uncertainty: Theory and evidence. J. Int. Econ. 2014, 1, 50–66. [Google Scholar] [CrossRef] [Green Version]
- Limao, N.; Maggi, G. Uncertainty and trade agreements. Am. Econ. J. Microecon. 2015, 4, 1–20. [Google Scholar] [CrossRef] [Green Version]
- Greenland, A.; Ion, M.; Lopresti, J. Exports, Investment and Policy Uncertainty. Can. J. Econ. 2019, 52, 1248–1288. [Google Scholar] [CrossRef]
- Udmale, P.; Pal, I.; Szabo, S.; Pramanik, M.; Large, A. Global food security in the context of COVID-19: A scenario-based exploratory analysis. Prog. Disaster Sci. 2020, 7, 100120. [Google Scholar] [CrossRef]
- Balwinder, S.; Shirsath, P.B.; Jat, M.L.; McDonald, A.J.; Srivastava, A.K.; Craufurd, P.; Rana, D.S.; Singh, A.K.; Chaudhari, S.K.; Sharma, P.C.; et al. Agricultural labor, COVID-19, and potential implications for food security and air quality in the breadbasket of India. Agric. Syst. 2020, 185, 102954. [Google Scholar] [CrossRef]
- Zhou, J.-H.; Han, F.; Li, K.; Wang, Y. Vegetable production under COVID-19 pandemic in China: An analysis based on the data of 526 households. J. Integr. Agric. 2020, 19, 2854–2865. [Google Scholar] [CrossRef]
- Wang, H.H.; Hao, N. Panic buying? Food hoarding during the pandemic period with city lockdown. J. Integr. Agric. 2020, 19, 2916–2925. [Google Scholar] [CrossRef]
- Yao, H.; Zuo, X.; Zuo, D.; Lin, H.; Huang, X.; Zang, C. Study on soybean potential productivity and food security in China under the influence of COVID-19 outbreak. Geogr. Sustain. 2020, 1, 163–171. [Google Scholar] [CrossRef]
- Huang, J.; Yang, J.; Rozelle, S. China’s agriculture: Drivers of change and implications for China and the rest of world. Agric. Econ. 2010, 41, 47–55. [Google Scholar] [CrossRef]
- Li, D.; Zeng, J. The challenges facing the food security of China under the New Normal economic situation. Issues Agric. Econ. 2015, 5, 42–47; 110. (In Chinese) [Google Scholar]
- Mao, X.; Kong, X. Reshaping the future of food security in China. J. Nanjing Agric. Univ. (Soc. Sci. Ed.) 2019, 19, 142–150; 168. (In Chinese) [Google Scholar]
- Novy, D. Gravity redux: Measuring international trade costs with panel data. Econ. Inq. 2013, 51, 101–121. [Google Scholar] [CrossRef] [Green Version]
- Tinbergen, J. Shaping the World Economy: Suggestions for an International Economic Policy; The Twentieth Century Fund: New York, NY, USA, 1962. [Google Scholar]
- Baek, J. Does the exchange rate matter to bilateral trade between Korea and Japan? Evidence from commodity trade data. Econ. Modeling 2013, 30, 856–862. [Google Scholar] [CrossRef]
- Daniloska, N. International trade with food and agricultural products: Aspect of Nontariff Barriers. Econ. Dev. 2015, 1–2, 163–174. [Google Scholar]
- West, T.O.; Marland, G. A synthesis of carbon sequestration, carbon emissions, and net carbon flux in agriculture: Comparing tillage practices in the United States. Agric. Ecosyst. Environ. 2002, 91, 217–232. [Google Scholar] [CrossRef]
- Dubey, A.; Lal, R. Carbon footprint and sustainability of agricultural production system in Punjab, India and Ohio, USA. J. Crop Improv. 2009, 23, 332–350. [Google Scholar] [CrossRef]
- Nakajima, J. Time-varying parameter var model with stochastic volatility: An overview of methodology and empirical applications. IMES Discuss. Paper Ser. 2011, 29, 107–142. [Google Scholar]
- Wei, S. Intra-National Versus International Trade: How Stubborn are Nations in Global Integration; NBER Working Paper No. 5531; National Bureau of Economic Research: Cambridge, MA, USA, 1996. [Google Scholar]
- Huang, Y.; Luk, P. Measuring economic policy uncertainty in China. China Econ. Rev. 2020, 59, 101367. [Google Scholar] [CrossRef]
- Sun, Z.; Li, X. Puzzle of China’s Grain Trade Deficit: Variety, price and quantity. J. Int. Trade. 2018, 9, 9–24. (In Chinese) [Google Scholar]
- Carballo, J.; Handley, K.; Limo, N. Economic and Policy Uncertainty: Export Dynamics and the Value of Agreements; NBER Working Paper No. 24368; National Bureau of Economic Research: Cambridge, MA, USA, 2018. [Google Scholar]
- He, R.; Zhu, D.; Chen, X.; Cao, Y.; Chen, Y.; Wang, X. How the trade barrier changes environmental costs of agricultural production: An implication derived from China’s demand for soybean caused by the US-China trade war. J. Clean. Prod. 2019, 227, 578–588. [Google Scholar] [CrossRef]


| Embodied Carbon Emissions Source | Emissions Coefficient | Reference Source |
|---|---|---|
| Fertilizer | 0.8956 kg/kg | American Oak Ridge National Laboratory |
| Pesticide | 4.9341 kg/kg | American Oak Ridge National Laboratory |
| Agricultural film | 5.1800 kg/kg | Institute of Agricultural Resources and Ecological Environment, Nanjing Agricultural University |
| Agricultural diesel | 0.5927 kg/kg | IPCC (2006) |
| Agricultural irrigation | 25.000 kg/hm2 | Dubey (2009) |
| Agriculture planting | 3.1260 kg/hm2 | College of Biology and Technology, China Agricultural University |
| Variable | Constance | ||||||||
|---|---|---|---|---|---|---|---|---|---|
| Coefficient | 4.630 *** | −5.849 * | 2.565 ** | −2.699 ** | 1.927 | 0.224 * | 0.099 | −0.049 ** | 12.072 * |
| Z-Statistic | 4.99 | −1.59 | 2.087 | −2.25 | 1.51 | 1.78 | 1.10 | −2.192 | −1.91 |
| Variable | Test Type (C,T,L) | ADF- Statistic | 1% Critical- Value | 5% Critical- Value | p-Value | Result |
|---|---|---|---|---|---|---|
| EPU | (C,T,1) | −2.4264 | −4.6162 | −3.7104 | 0.3547 | non-stable |
| △EPU | (0,0,0) | −4.1046 | −2.7080 | −1.9628 | 0.0004 | stable |
| IPR | (0,0,0) | −1.4098 | −2.6997 | −1.9614 | 0.1424 | non-stable |
| △IPR | (0,0,0) | −4.0542 | −2.7080 | −1.9628 | 0.0004 | stable |
| TCO | (0,0,0) | −2.6213 | −2.6997 | −1.9614 | 0.0120 | stable |
| TVIL | (0,0,0) | −0.9493 | −2.6997 | −1.9614 | 0.2925 | non-stable |
| △TVIL | (0,0,0) | −4.6456 | −2.7080 | −1.9628 | 0.0001 | stable |
| IWF | (C,T,0) | −4.0333 | −4.6678 | −3.7332 | 0.0300 | stable |
| INCA | (C,T,0) | −3.9037 | −4.6678 | −3.7332 | 0.0375 | stable |
| Numbers | Characteristic-Value | Trace-Statistics | 5% Critical-Value | p-Value |
|---|---|---|---|---|
| None | 0.831520 | 57.82437 | 35.01090 | 0.0000 |
| At most 1 | 0.749623 | 27.54844 | 18.39771 | 0.0020 |
| At most 2 | 0.209988 | 4.007032 | 3.841466 | 0.0453 |
| Parameter | Posterior-m | P-Standard Error | 95%L | 95%U | Con. D-Value | Influence-F |
|---|---|---|---|---|---|---|
| 0.0023 | 0.0003 | 0.0018 | 0.0029 | 0.182 | 2.03 | |
| 0.0023 | 0.0003 | 0.0018 | 0.0029 | 0.447 | 1.35 | |
| 0.0055 | 0.0016 | 0.0034 | 0.0096 | 0.140 | 6.92 | |
| 0.0055 | 0.0016 | 0.0033 | 0.0094 | 0.492 | 3.65 | |
| 0.0029 | 0.0004 | 0.0022 | 0.0039 | 0.992 | 1.17 | |
| 0.0029 | 0.0004 | 0.0022 | 0.0039 | 0.540 | 1.13 |
| Sustainability | Indicators | Impact of EPU | Overall Evaluation |
|---|---|---|---|
| Economic sustainability | Import potential ratio | Negative | EPU has negative impact on both economic and environmental sustainability of China’s net grain imports, and thus a negative impact on the overall sustainability of China’s net grain imports. |
| Trade cost | Positive | ||
| Environmental sustainability | Virtual land | Negative | |
| Virtual water | Negative | ||
| Embodied carbon emissions | Negative |
Publisher’s Note: MDPI stays neutral with regard to jurisdictional claims in published maps and institutional affiliations. |
© 2021 by the authors. Licensee MDPI, Basel, Switzerland. This article is an open access article distributed under the terms and conditions of the Creative Commons Attribution (CC BY) license (https://creativecommons.org/licenses/by/4.0/).
Share and Cite
Li, Y.; Li, J. How Does China’s Economic Policy Uncertainty Affect the Sustainability of Its Net Grain Imports? Sustainability 2021, 13, 6899. https://doi.org/10.3390/su13126899
Li Y, Li J. How Does China’s Economic Policy Uncertainty Affect the Sustainability of Its Net Grain Imports? Sustainability. 2021; 13(12):6899. https://doi.org/10.3390/su13126899
Chicago/Turabian StyleLi, Yuee, and Jingdong Li. 2021. "How Does China’s Economic Policy Uncertainty Affect the Sustainability of Its Net Grain Imports?" Sustainability 13, no. 12: 6899. https://doi.org/10.3390/su13126899