Article

Monitoring the Impact of COVID-19 Lockdown on the Production of Nitrogen Dioxide (NO2) Pollutants Using Satellite Imagery: A Case Study of South Asia

by
Farhad Hassan
1,
Muhammad Umar Chaudhry
1,*,
Muhammad Yasir
2,
Muhammad Nabeel Asghar
3 and
Samuel Asumadu Sarkodie
4,*
1
AiHawks, Multan 60000, Pakistan
2
Department of Computer Science, Faisalabad Campus, University of Engineering and Technology Lahore, Faisalabad 38000, Pakistan
3
Department of Computer Science, Bahauddin Zakariya University, Multan 60000, Pakistan
4
Nord University Business School (HHN), Post Box 1490, 8049 Bodø, Norway
*
Authors to whom correspondence should be addressed.
Sustainability 2021, 13(13), 7184; https://doi.org/10.3390/su13137184
Submission received: 8 April 2021 / Revised: 18 June 2021 / Accepted: 23 June 2021 / Published: 26 June 2021
(This article belongs to the Collection Impact of COVID-19 on the Environment, Energy and Economics)

Abstract

:
Among the numerous anthropogenic pollutants, nitrogen dioxide (NO2) is one of the leading contaminants mainly released by burning fossil fuels in industrial and transport sectors. This study evaluates the impact of COVID-19 lockdown on the growing trend of NO2 emissions in South Asia. Satellite imagery data of Sentinel-5 Precursor with Tropomi instrument was employed in this study. The analysis was performed using time series data from February–May 2019 and February–May 2020. The time frame from February–May 2020 was further divided into two sub-time-frames, i.e., from 1 February–20 March (pre-lockdown) and from 21 March–May 2020 (lockdown). Results show the concentration of NO2 pollutants over the region declined by 6.41% from February–May 2019 to February–May 2020. Interestingly, an increasing trend of NO2 concentration by 6.58% occurred during the pre-lockdown phase in 2020 (1 February–20 March) compared to 2019 (February–May). However, the concentration of NO2 pollutants reduced considerably by 21.10% during the lockdown phase (21 March–10 May) compared to the pre-lockdown phase in 2020. Furthermore, the country-specific detailed analysis demonstrates the significant impact of COVID-19-attributed lockdown on NO2 concentration in South Asia.

1. Introduction

Environmental effects are one of the major factors affecting human health [1]. Monitoring air quality is vital for ecosystems and public health. However, air pollutants such as nitrogen dioxide (NO2), ozone (O3), carbon monoxide (CO), and sulfur dioxide (SO2) are contaminating the air at unprecedented rates, thus compromising public health [2]. Environmental pollution has given rise to numerous acute and terminal diseases including lung aging, asthma, emphysema, bronchitis, and cancer [3,4]. A significant number of deaths are caused by air pollution each year and the situation is becoming worse daily. Around 7 million annual deaths reported by health authorities are due to the superfluous presence of NO2 and other pollutants in the atmosphere [5]. The World Health Organization (WHO) warned that health risks might escalate because of atmospheric NO2 and called for protection of humanity against this threat [6]. However, the emissions of NO2 declined significantly during COVID-19 lockdown period—when restrictions caused small enterprises, factories, and transport to shut down—thereby improving air quality.
COVID-19 cases were first reported in Wuhan, China, in November 2019, causing WHO to declare it as a global pandemic in 2020—due to rapid growth and spread in cases across countries. In March 2020, the number of confirmed cases was 209,839 with a corresponding death rate of ~2% [7]. From the initial analysis, it was revealed that the risk factor of COVID-19 was higher in elderly people [4]. COVID-19 patients experience dry cough and fever, wooliness, and breathing disorders [8]. To contain the unprecedented spread of COVID-19, pertinent authorities around the globe agreed to impose a strict lockdown in compliance with WHO recommendations [9]. The imposition of lockdown and social distancing measures prevent the spread of COVID-19 through small droplets from the nose or mouth of an infected person. The rate of transmission of coronavirus was significantly reduced during the lockdown period [10]. Another positive outcome of the lockdown was the improvement of air quality due to the shutdown of industries and transport systems that were producing NO2 and other hazardous pollutants [11].
Globally, due to a global lockdown, spaceborne NO2 column observations were reduced by approximately 9.19% and 9.57% in March and April 2020, respectively, as compared to the same months from 2015 to 2019. A decline in NO2, SO2, PM2.5, and PM10 concentrations was observed in different regions of Europe, China, India, and the US. An increase in O3 concentrations occurred during the same period [12]. Statistical analysis of the air quality data of Abu Dhabi during the first 10 months of 2020 revealed a significant decrease during lockdown in the concentration of the gaseous pollutants analyzed (NO2, SO2, CO, and C6H6). However, a different trend was shown by particulate matter (PM10 and PM2.5) averaged concentrations due to a larger influence from natural events (dust and sand storms) and other anthropogenic sources [13]. A combination of satellite and ground-based daily data analysis of nitrogen dioxide (NO2) and fine particulate matter (PM2.5) emissions for May from 2015 until 2020 was performed to monitor the air quality changes in Brazilian cities of São Paulo (SP) and Rio de Janeiro (RJ). Significant decreases of 42% and 49.6% were found for SP and RJ, respectively, during the year 2020 compared to the 2015–2019 average. Ground-based data showed 13.3% and 18.8% decrease in NO2 levels for SP and RJ, respectively, in 2020 compared to 2019 [14]. Mobile monitoring for urban air pollution in the road network of Nanjing, China, for a year (October 2019–September 2020) revealed that compared to the pre-COVID period, CO and NO2 concentrations during the COVID-lockdown period were decreased by 44.9% and 47.1%, respectively. Moreover, the contribution of traffic-related emissions to them both decreased by more than 50% [15]. The average daily O3 concentrations escalated by 14% in Rome, 24% in Nice, 2.4% in Valencia, and 27% in Turin [16]. This rise in O3 concentrations happened primarily by the record decrease in NOx emissions that resulted in reduced NO titration of O3. In Salé city of Morocco, a decrease in the concentration of pollutants was examined, which showed a difference of 49%, 96%, and 75% in concentrations of SO2, NO2, and PM10, respectively, before and during the lockdown period [17]. During the COVID-19 control period, the air quality index and concentrations of six air pollutants (SO2, NO2, PM2.5, PM10, O3, and CO) were assessed in northern China [18]. On the whole, air quality improved due to restricted transport and secondary-industry pollution. The asymmetric effect of temperature on COVID-19 in the ten most-affected provinces in China from 22 January 2020 to 31 March 2020 was examined [19]. The relationship between temperature and COVID-19 was found positive for Anhui, Hunan, and Hubei, whereas negative effect was found in Shandong and Zhejiang provinces. However, mixed trends were observed in the remaining five provinces (Heilongjiang, Jiangsu, Henan, Jiangxi, and Guangdong). An investigation of the effects of regional climate, precipitation, evaporation, and temperature on local transmission of SARS-CoV-2 coronavirus was examined in 31 states and Mexico’s capital from 29 February to 31 March 2020 [20]. The association of confirmed positive cases (LCPC) of COVID-19 with both weather and climatic characteristics was statistically analyzed. The local transmission ratio (LTR) was estimated as the ratio between the regional LCPC and the number of effective days of contagion in each state from the regional onset. The results presented a negative association of temperature and climate with LTR and LCPC. In addition, a positive association was reported between precipitation and both LTR and LCPC.
This study investigates the proliferating trend of NO2 and analyzes its reduction due to COVID-19 lockdown in South Asia. As a contribution to existing literature, this study covers a wide geographical area rather than exploring a metropolitan area or a specific state, as done by other recent studies. It is envisaged that this study would help in identifying the association between COVID-19 lockdown and air quality improvement due to reduction of NO2 proliferation.
The rest of the paper is organized as follows. The topography of the region of study is discussed in Section 2. Section 3 presents the methodological details. The results and discussion are presented in Section 4, and concluding remarks are given in Section 5.

2. Region of Study

We adopt Southern Asia as the region for our case study, shown in Figure 1. The area is topographically governed by the Indian Plate, primarily defined in the north by the Himalayas and Karakoram, and in the south by the Indian Ocean. In the north of Hindu Kush rises the Amu Darya, which forms part of the northwest frontier. South Asia is bounded on land (in the clockwise direction) by Western Asia, Central Asia, East Asia, and Southeast Asia. South Asia is home to the world’s largest population, including Muslims, Sikhs, Hindus, Jains, and Zoroastrians. South Asia contains 24.89% of the entire world’s population. Based on the latest estimates from the United Nations, South Asia’s current population is 1,939,699,711 as of Sunday, 21 June 2020, which is 24.89% of the world’s entire population [21]. Much of the region consists of a peninsula in south-central Asia forming a diamond shape by the Arakanese in the east, the Hindu Kush in the west, and the Himalayas on the north, extending south to the Indian Ocean with the Arabian Sea on the southwest and southeast [22]. The region of study is based on eight countries: Pakistan, Bangladesh, India, Afghanistan, Sri Lanka, Maldives, Bhutan, and Nepal. The details of the countries are presented in Table 1.

3. Methodology

To monitor the impact of COVID-19 lockdown on the increasing trend of NO2 pollutants, the adopted methodology is shown in Figure 2. For this study, key data were extracted from the Sentinel-5 Precursor satellite data using the Google Earth Engine (GEE) platform [24,25]. For the extraction of NO2 pollutants, we utilized the TROPOMI instruction, which is a sun back-scatter instrument in the line of SCIAMACHY and OMI with four spectrometer bands and a spectral resolution of 0.25–0.5 nm. The satellite was launched on 13 October 2017 to monitor air pollution, while the NO2 pollutants data were first released on 10 July 2018. Using satellite imagery, digital image processing operation was performed, and data were obtained using pixel values that statistically measure the daily maximum availability of NO2 according to the filtration of date range and geographic area. The date range filtration was done for both 2019 and 2020 under the month’s array of February to May. To measure the increasing trend of NO2 pollutants, the time period from 2019 to 2020 (pre-lockdown period) was considered. Following this, the change in the proliferation of NO2 pollutants was monitored during the COVID-19 lockdown period (from March to May 2020). Furthermore, to determine the positive impact of reduced NO2 proliferation on air quality during COVID-19 lockdown, country-specific filtration was done to perform the same analysis for Pakistan, Bangladesh, India, Afghanistan, Sri Lanka, Maldives, Bhutan, and Nepal.

4. Results and Discussion

This section outlines the results produced by performing a daily-based maximum statistical analysis utilizing the Sentinel-5 Precursor satellite during the two different time series, which were used to measure increasing trend of NO2 and impact of COVID-19 lockdown on the reduction of NO2 pollutants. Moreover, a detailed country-specific analysis of the South Asian region is provided.

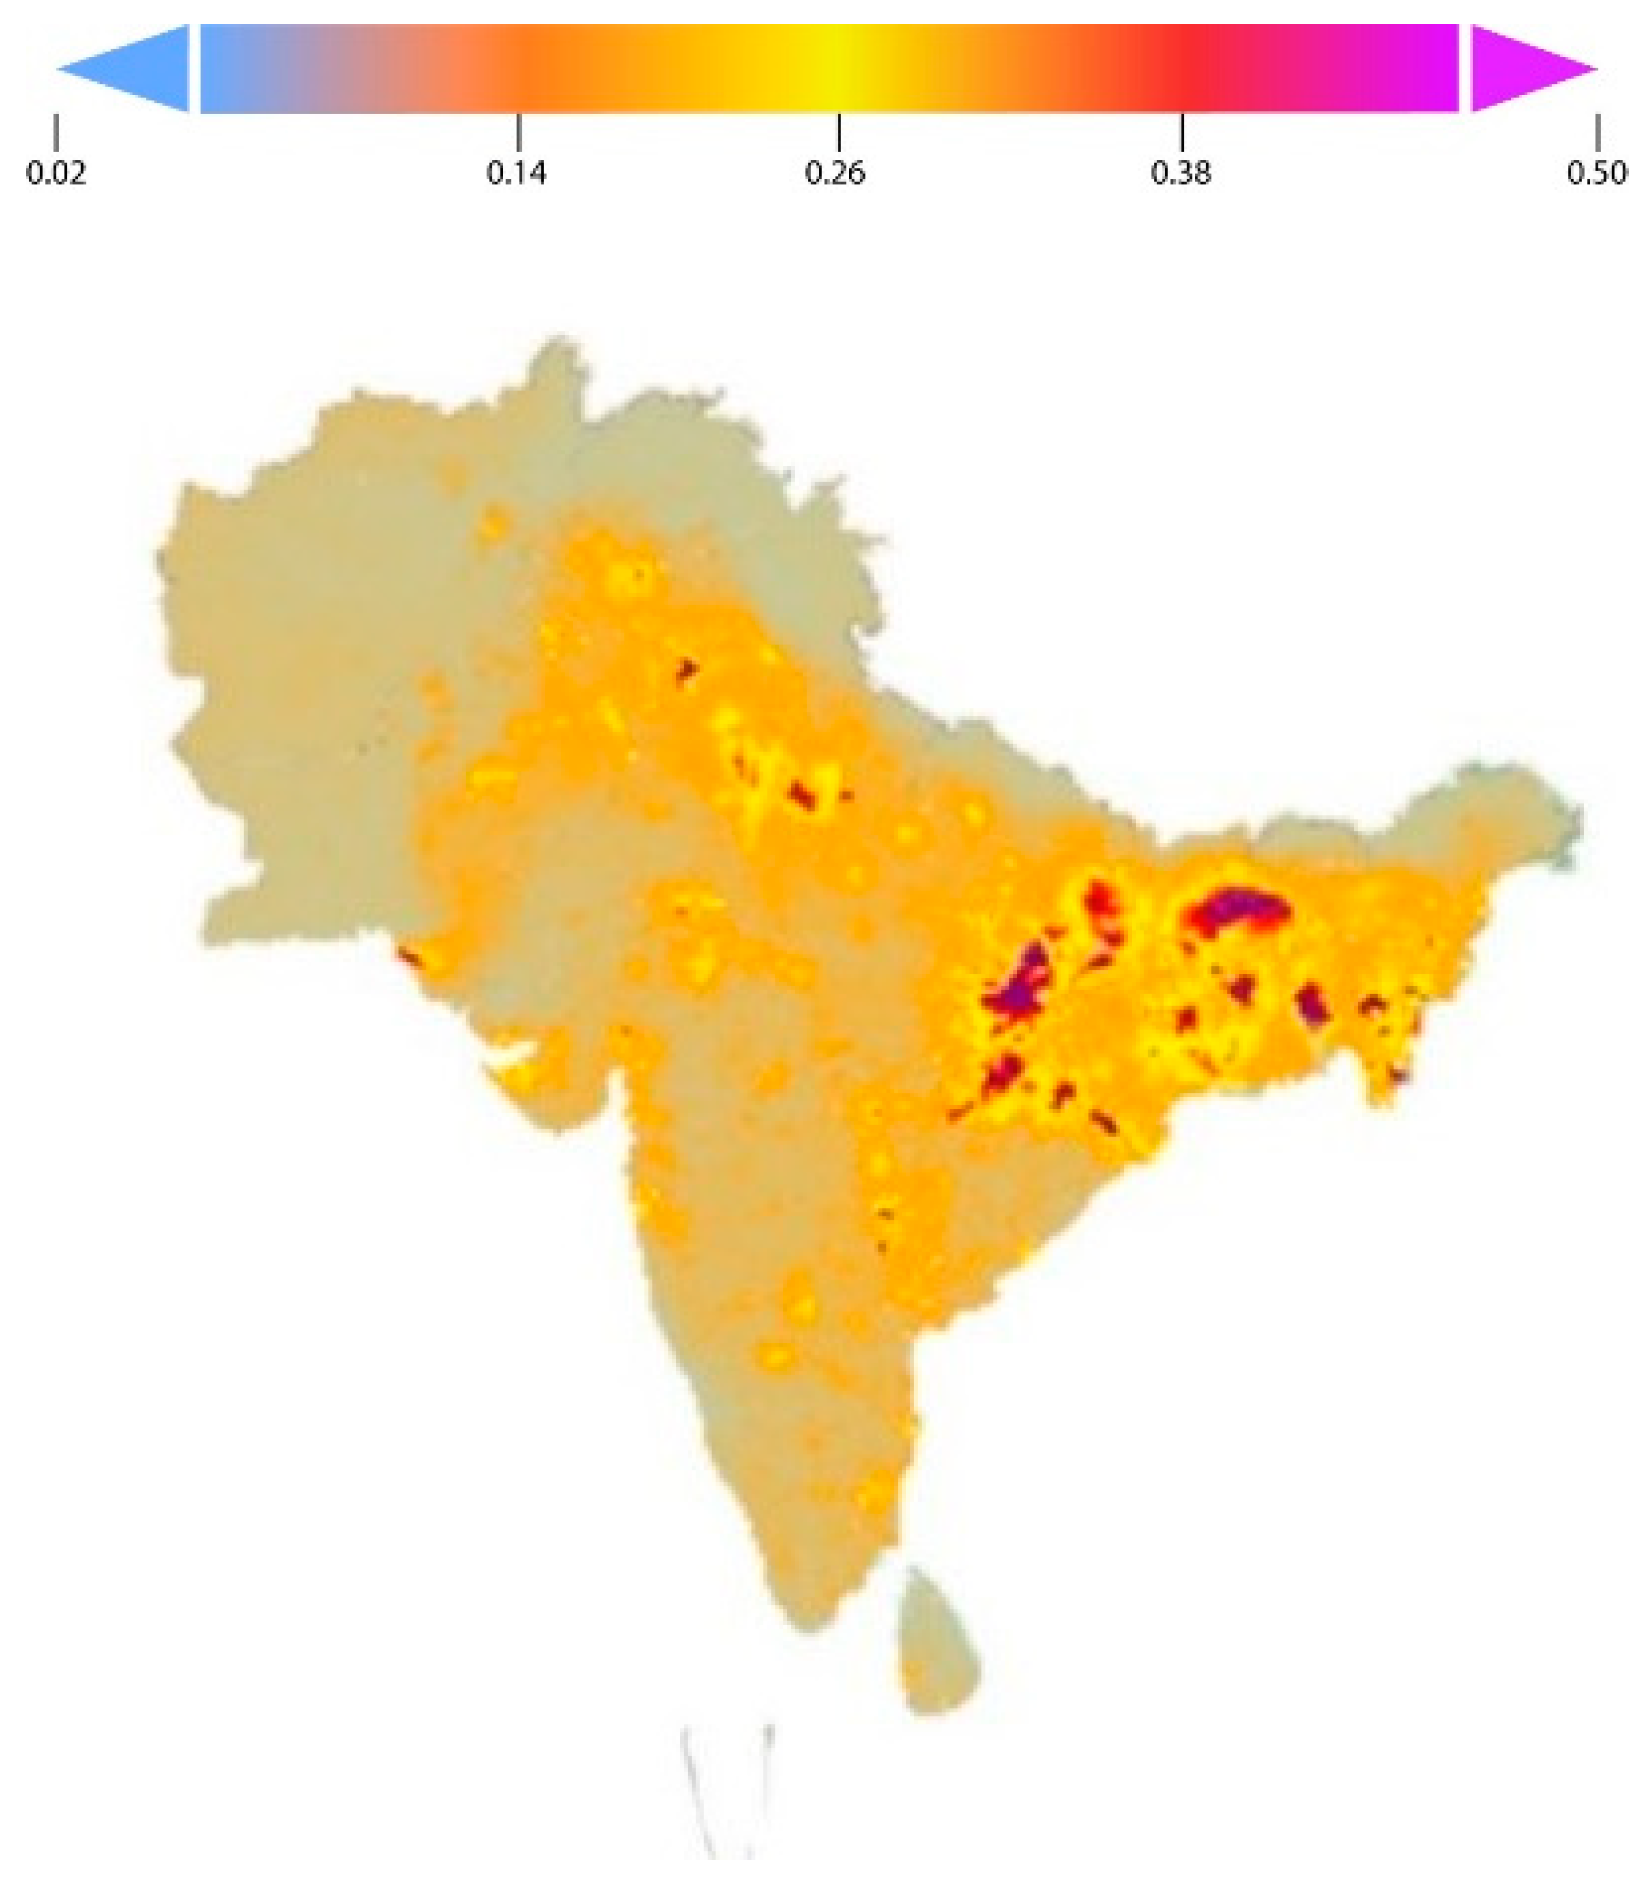
4.1. Nitrogen Dioxide (NO2) Concentration in South Asia

Figure 3 shows the level of concentration of NO2 pollutants from February to May 2019, and Figure 4 shows the level of intensity of NO2 pollutants from February to May 2020. Both images have a range of color palettes, viz., light blue–orange–yellow–red–purple that indicates the lowest to the highest level of NO2 pollutants. Changes in the reduction of NO2 pollutants over time are shown in Figure 5. The additional black color indicates no change or modification in the area over the time range.
The results show a substantial change of abatement in NO2 pollutants for the region of study. Figure 6 elaborates the daily maximum values that indicate the presence of NO2 pollutants in the air for both time series. Blue shows the values ranging from February to May 2020, whereas green indicates the values ranging from February to May 2019. In South Asia, most countries imposed smart and full lockdown in the last ten days of March 2020. Before the lockdown period in 2020, the level of NO2 pollutants was higher compared to 2019, revealing that NO2 pollutants increased over time. However, after the imposition of lockdown, the level of concentration of NO2 reduced. In May 2020, different governments relaxed the restrictions due to Islamic festival (Eid al-Fitr), Hindu festival (SavitriPooja), and Buddha festival (Vesak Full Moon Poya), but the concentration level of NO2 pollutants were still observed in reduced amount or approximately equal to both pre-lockdown periods, i.e., February to the middle of March 2020 and February to May 2019.

4.2. Country-Specific Detailed Analysis

The country-specific comprehensive analysis is primarily done to assess the contribution of each country towards improving air quality by restricting the generation of NO2 during the smart and full lockdown. Results of the daily maximum values of NO2 pollutants over the full-lockdown/smart-lockdown periods are compared with the results of the pre-lockdown period across countries.

4.2.1. Country-Specific NO2 Pollutants from February to May 2019

The country-specific comparison deals with the level of concentration of NO2 pollutants between February–May 2019. Figure 7 shows NO2 concentration across eight administrative countries: Pakistan, India, Afghanistan, Sri Lanka, Maldives, Bhutan, Bangladesh, and Nepal. The resultant image utilizes the color palette, viz., light blue–orange–yellow–red–purple that describes the lowest to highest level of NO2 pollutants.

4.2.2. Country-Specific NO2 Pollutants from February to May 2020

The country-specific analysis deals with the level of concentration of NO2 pollutants in the air during February–May 2020 period. Figure 8 shows the information on Pakistan, India, Afghanistan, Sri Lanka, Maldives, Bhutan, Bangladesh, and Nepal. The resultant image utilizes the color palette, viz., light blue–orange–yellow–red–purple that describes the lowest to highest availability level of nitrogen dioxide pollutants for each country.

4.2.3. Year-Specific Change of NO2 Pollutants

The year-specific fluctuation analysis deals with the level of concentration of NO2 pollutants reduced during multitemporal range from February–May 2019 to February–May 2020. Figure 9 shows changes in NO2 concentration in South Asian countries. The resultant image utilizes the color palette, viz., orange–yellow–red–purple that describes the lowest to highest availability level of NO2 pollutants; black indicates no change in reduction occurred.
Results show a considerable reduction in NO2 pollutants in the air of Pakistan. Figure 10 depicts NO2 pollutants with daily maximum values from February–May 2020 represented by a solid blue line and February–May 2019 shown by a solid green line. In Pakistan, the lockdown commenced on 21 March 2020 [26]. Before the lockdown, from 1 February–20 March 2020, the level of NO2 concentration was at its peak compared to February–May 2019. This indicates an increase in nitrogen dioxide pollutants over time. Following the imposition of lockdown, however, the level of concentration of NO2 declined. It is evident in the values for the last March and April results. At the start of May, the government decided to relax restrictions due to Eid al-Fitr, but the observed level was still lesser or approximately equal to the pre-lockdown period from February–May 2020 and February–May 2019.
The findings demonstrate significant reduction of NO2 pollutants under the administrative boundaries of India from February–May 2019 to February–May 2020. Figure 11 shows the presence of NO2 pollutants from February–May 2019 with daily maximum values illustrated by a solid green line. The time frame from February–May 2020 daily maximum values are depicted with a solid blue line. In India, the lockdown started on 22 March and lasted until 30 June 2020. During this period [27], however, the government of India alleviated specific conditions and containment zone restrictions. Before the lockdown period (February 1 through 21 March 2020) in India, the level of NO2 concentration was slightly higher compared to the results of February–May 2019, indicating an increasing trend over time. During the lockdown period (i.e., the last of March and April), however, the level of NO2 concentration declined. At the start of May 2020, the administration of the Indian government relaxed COVID-19 restrictions due to Islamic and Hindu festivals, although the level of NO2 concentration was still lower or equivalent to the pre-lockdown period from 1 February–21 March 2020, and the results from February–May 2019.
The results show minor changes in NO2 reduction in Afghanistan from February–May 2019 to February–May 2020. The NO2 pollutants with daily maximum values are presented in Figure 12. The green solid line shows data from February–May 2019, and solid blue line illustrating the results from February–May 2020. In Afghanistan, the government applied smart lockdown from 22 March through 22 May 2020 [28], but this smart lockdown was restricted to a few cities and provinces. Before the 2020 smart lockdown in Afghanistan, the level of NO2 concentration was mostly higher as compared to the results from February–May 2019. Over time, the level of NO2 pollutants escalated, however, with the impact of smart lockdown, the level of NO2 concentration reduced as shown in late March and April results. The administrative authorities in Afghanistan lifted the smart lockdown due to Eid al-Fitr, but the level of NO2 concentration was slightly lower or very close to the pre-lockdown period from 1 February–21 March 2020, and from February–May 2019.
Figure 13 shows NO2 pollutants with daily maximum values of both periods in Sri Lanka. The solid green line represents the values from February–May 2019, while the solid blue line specifies values from February–May 2020. The Sri Lankan government declared lockdown from 22 March until 11 May 2020 [29], but in late April, the lockdown was barred in few areas with conditional relaxation. Before the lockdown period (1 February–21 March 2020) in Sri Lanka, the level of NO2 concentration was mostly higher as compared to the results from February–May 2019. During the lockdown, however, the level of NO2 concentration declined.
Figure 14 shows NO2 pollutants with daily maximum values of both periods in Maldives. The solid blue line represents February–May 2020 values whereas the solid green line shows the values from February–May 2019. The results show a minimal reduction in air pollutants containing NO2 from February–May 2019 to February–May 2020. The government of Maldives imposed smart lockdown from 15 April until 28 May 2020 [26], but was restricted to only a few cities and provinces. Before the lockdown period (1 February–14 April 2020), the level of NO2 concentration was approximately equal to the results from February–May 2019, indicating insignificant change over time. During the smart lockdown period, however, the level of NO2 concentration declined slightly, as shown in the April and May results.
The results shown in Figure 15 indicate changes in the reduction of NO2 pollutants under the administrative boundaries of Bhutan. The solid blue line represents the NO2 concentration with daily maximum values from February–May 2020, while the solid green line represents daily maximum statistically based values from February–May 2019. In Bhutan, smart lockdown was imposed from 23 March to 21 April 2020 [30]. Before the lockdown period (1 February–22 March 2020), the level of NO2 pollutants was lower than the results obtained from February–May 2019. Yet, in early March 2020, the level of NO2 pollutants was higher. Amid the smart lockdown, the level of NO2 concentration declined.
Figure 16 shows a considerable reduction in NO2 pollutants in Bangladesh from February–May 2019 to February–May 2020. The solid green line represents the level of NO2 pollutants with daily maximum values from February–May 2019, while the solid blue represents the times series from February–May 2020. The Bangladesh government enforced a complete lockdown from 26 March to 4 April 2020, which was prolonged until 30 May 2020 [31]. The government of Bangladesh, however, lifted the lockdown due to Eid al-Fitr. Before the lockdown period (February 1–24 March 2020), the level of NO2 pollutants were elevated as compared to February–May 2019, but with the impact of the lockdown, the trend of NO2 pollutants reduced.
Figure 17 depicts a very small reduction in NO2 pollutants in Nepal. NO2 pollutants with daily maximum values from February–May 2019 are specified by the solid green line, while the solid blue line specifies February–May 2020. The Nepalese government enforced lockdown from 24 March to 12 April 2020 [32]. Before the lockdown period (February 1–23 March 2020), the level of NO2 concentration was mostly higher than February–May 2019 results, depicting an increase in NO2 over time. However, during the lockdown period, the level of NO2 concentration declined.
Table 2 summarizes the country-specific trend analysis during the specified time periods. Observing the overall reduction from February–May 2019 to February–May 2020 indicates that Afghanistan ranked high in reducing NO2 concentration levels, by 15.09%. Pakistan follows with a 13.80% reduction in NO2 pollutants during the entire period. India, Sri Lanka, Maldives, Bhutan, Bangladesh, and Nepal achieved 2.80%, 6.20%, 7.62%, 4.79%, 4.80%, and 2.95% reduction in NO2 concentration levels, respectively. While comparing the situation before and after lockdown in 2020, interesting facts are revealed. For example, all countries before the lockdown period observed increasing trends in NO2 concentration—specifically, Bangladesh (22.80%), Sri Lanka (17.34%), and Afghanistan (10.90%). However, the imposition of full and smart lockdown dramatically reversed the scenario, and significant reduction in NO2 pollutants was observed, depicting the commencement of atmospheric healing process by improving air quality. Bangladesh had the highest positive impact of lockdown, revealing a 47.94% reduction in NO2 concentration. Sri Lanka, Pakistan, and Afghanistan also achieved high reduction rates, 38.88%, 31.43%, and 27.78%, respectively, during lockdown period. The results indicate the positive impact of lockdown on global environment and air quality, thereby reflecting the influence of daily life human activities on the environment. The main sources of NO2 production are the burning of fossil fuels in industrial and transport sectors. The implementation of lockdown ceased or considerably lessened the industrial and commercial activities, and very sparse vehicles could be seen on roads [33], thereby reducing the concentration of NO2 in the atmosphere. However, it is unclear whether improvements in air quality have long-term effects. This could be an extraordinary incident for authorities and administrative bodies and can aid in suggesting and devising smart lockdown policies to maintain a clean and healthy environment.
In this study, we monitored the impact of COVID-19 lockdown on the production of NO2 in South Asia. This study is the first of its kind to cover such a large geographical area to analyze pollutant concentration in the atmosphere during COVID-19 lockdown. Most of the recent relevant studies analyze the atmosphere, monitoring various pollutants, of different cities or small geographical regions, as summarized in Table 3. We believe that such studies are useful and significant, but for local regions. However, COVID-19 is a global pandemic, hence, a unified study across the globe is essential to monitor the impact of COVID-19 on environmental quality. Based on the findings, unanimous decisions or precautions could be implemented to save the global atmosphere. Having this intuition in mind, we designed this study to cover South Asia consisting of eight countries: Pakistan, India, Bangladesh, Sri Lanka, Nepal, Afghanistan, Maldives, and Bhutan. The results indicate increasing NO2 concentrations in 2020 before the lockdown because of increasing traffic, industrial, and domestic activities. However, a significant reduction in NO2 concentration levels was observed during the lockdown period in all sampled countries. We suggest South Asian countries could work together and devise common solutions to save the environment of the entire region.

5. Conclusions

This study assessed the levels of nitrogen dioxide (NO2) in South Asia for two separate time frames, February–May 2019 and February–May 2020. The analysis is based on collective and individual assessment of eight countries present in the region: Pakistan, India, Afghanistan, Sri Lanka, Maldives, Bhutan, Bangladesh, and Bhutan. Results showed the concentration of NO2 pollutants over the region reduced by 6.41% from February–May 2019 to February–May 2020. Interestingly, before the lockdown during 2020, i.e., pre-March 2020, the concentration of NO2 pollutants was 6.58% higher as compared to the results of 2019. Moreover, this study identified 21.10% reduction in the concentration of NO2 pollutants before the lockdown period (1 February–20 Mar 2020) compared to the lockdown period (21 March–10 May 2020). Thus, the results vividly demonstrate the perceptible impact of lockdown during COVID-19 on NO2 concentrations across South Asian countries.
Results become further explicit by the discrete assessment of South Asian countries. By the study of individual countries, it was found that NO2 levels flared initially in 2020, i.e., pre-lockdown phase. However, NO2 concentration recorded significant declined levels in late March 2020, i.e., lockdown phase. This shows that decreased human activities in industrial and transport sectors had direct impact on NO2 concentrations and their flare-up. Thus, to maintain this remarkable reduction in NO2 levels in the South Asian region, it is recommended that the South Asian member countries work on a collective institutional framework to take effective initiatives.

Author Contributions

Conceptualization, F.H., M.U.C., and S.A.S.; methodology, F.H., M.Y., and S.A.S.; software, F.H. and M.N.A.; formal analysis, F.H., M.Y., and M.N.A.; writing—original draft preparation, F.H., M.Y., and M.U.C.; writing—review and editing, M.N.A. and S.A.S.; supervision, S.A.S.; project administration, M.U.C. All authors have read and agreed to the published version of the manuscript.

Funding

This research received no external funding.

Data Availability Statement

Data were extracted from the Sentinel-5 Precursor satellite data using the Google Earth Engine (GEE) platform [24,25].

Conflicts of Interest

The authors declare no conflict of interest.

References

  1. Wong, C.-M.; Vichit-Vadakan, N.; Kan, H.; Qian, Z. Public Health and Air Pollution in Asia (PAPA): A multicity study of short-term effects of air pollution on mortality. Environ. Health Perspect. 2008. [Google Scholar] [CrossRef] [Green Version]
  2. Chen, T.M.; Gokhale, J.; Shofer, S.; Kuschner, W.G. Outdoor air pollution: Nitrogen dioxide, sulfur dioxide, and carbon monoxide health effects. Am. J. Med. Sci. 2007. [Google Scholar] [CrossRef]
  3. Hamra, G.B.; Laden, F.; Cohen, A.J.; Raaschou-Nielsen, O.; Brauer, M.; Loomis, D. Lung cancer and exposure to nitrogen dioxide and traffic: A systematic review and meta-analysis. Environ. Health Perspecti. 2015. [Google Scholar] [CrossRef] [PubMed]
  4. Sweileh, W.M.; Al-Jabi, S.W.; Zyoud, S.H.; Sawalha, A.F. Outdoor air pollution and respiratory health: A bibliometric analysis of publications in peer-reviewed journals (1900–2017). Multidiscip. Respir. Med. 2018. [Google Scholar] [CrossRef] [Green Version]
  5. Khoder, M.I. Atmospheric conversion of sulfur dioxide to particulate sulfate and nitrogen dioxide to particulate nitrate and gaseous nitric acid in an urban area. Chemosphere 2002. [Google Scholar] [CrossRef]
  6. Kim, S.Y.; Sheppard, L.; Kim, H. Health effects of long-term air pollution: Influence of exposure prediction methods. Epidemiology 2009. [Google Scholar] [CrossRef] [PubMed]
  7. Rodriguez-Morales, A.J.; Cardona-Ospina, J.A.; Gutiérrez-Ocampo, E.; Villamizar-Peña, R.; Holguin-Rivera, Y.; Antezana, J.P.E.; Alvarado-Arnez, L.E.; Bonilla-Aldana, D.K.; Franco-Paredes, C.; Henao-Martinez, A.F.; et al. Clinical, laboratory and imaging features of COVID-19: A systematic review and meta-analysis. Travel Med. Infect. Dis. 2020. [Google Scholar] [CrossRef]
  8. Jiang, X.; Luo, M.; Zou, Z.; Wang, X.; Chen, C.; Qiu, J. Asymptomatic SARS-CoV-2 infected case with viral detection positive in stool but negative in nasopharyngeal samples lasts for 42 days. J. Med Virol. 2020. [Google Scholar] [CrossRef]
  9. Ogen, Y. Assessing nitrogen dioxide (NO2) levels as a contributing factor to coronavirus (COVID-19) fatality. Sci. Total Environ. 2020. [Google Scholar] [CrossRef]
  10. Ji, T.; Chen, H.-L.; Xu, J.; Wu, L.-N.; Li, J.-J.; Chen, K.; Qin, G. Lockdown contained the spread of 2019 novel coronavirus disease in Huangshi City, China: Early epidemiological findings. Clin. Infect. Dis. 2020. [Google Scholar] [CrossRef]
  11. Wang, Q.; Su, M. A preliminary assessment of the impact of COVID-19 on environment—A case study of China. Sci. Total Environ. 2020. [Google Scholar] [CrossRef] [PubMed]
  12. Bray, C.D.; Nahas, A.; Battye, W.H.; Aneja, V.P. Impact of lockdown during the COVID-19 outbreak on multi-scale air quality. Atmos. Environ. 2021. [Google Scholar] [CrossRef]
  13. Teixidó, O.; Tobías, A.; Massagué, J.; Mohamed, R.; Ekaabi, R.; Hamed, H.I.; Perry, R.; Querol, X.; Al Hosani, S. The influence of COVID-19 preventive measures on the air quality in Abu Dhabi (United Arab Emirates). Air Qual. Atmos. Heal. 2021. [Google Scholar] [CrossRef] [PubMed]
  14. Brandao, R.; Foroutan, H. Air quality in Southeast Brazil during COVID-19 lockdown: A combined satellite and ground-based data analysis. Atmosphere 2021, 12, 583. [Google Scholar] [CrossRef]
  15. Wang, S.; Ma, Y.; Wang, Z.; Wang, L.; Chi, X.; Ding, A.; Yao, M.; Li, Y.; Li, Q.; Wu, M.; et al. Mobile monitoring of urban air quality at high spatial resolution by low-cost sensors: Impacts of COVID-19 pandemic lockdown. Atmos. Chem. Phys. 2021. [Google Scholar] [CrossRef]
  16. Sicard, P.; De Marco, A.; Agathokleous, E.; Feng, Z.; Xu, X.; Paoletti, E.; Rodriguez, J.J.D.; Calatayud, V. Amplified ozone pollution in cities during the COVID-19 lockdown. Sci. Total Environ. 2020. [Google Scholar] [CrossRef]
  17. Otmani, A.; Benchrif, A.; Tahri, M.; Bounakhla, M.; Chakir, E.M.; El Bouch, M.; Krombi, M. Impact of Covid-19 lockdown on PM10, SO2 and NO2 concentrations in Salé City (Morocco). Sci. Total Environ. 2020. [Google Scholar] [CrossRef]
  18. Li, Z.; Meng, J.; Zhou, L.; Zhou, R.; Fu, M.; Wang, Y.; Yi, Y.; Song, A.; Guo, Q.; Hou, Z.; et al. Impact of the COVID-19 event on the characteristics of atmospheric single particle in the northern China. Aerosol Air Qual. Res. 2020. [Google Scholar] [CrossRef]
  19. Shahzad, F.; Shahzad, U.; Fareed, Z.; Iqbal, N.; Hashmi, S.H.; Ahmad, F. Asymmetric nexus between temperature and COVID-19 in the top ten affected provinces of China: A current application of quantile-on-quantile approach. Sci. Total Environ. 2020. [Google Scholar] [CrossRef]
  20. Méndez-Arriaga, F. The temperature and regional climate effects on communitarian COVID-19 contagion in Mexico throughout phase 1. Sci. Total Environ. 2020. [Google Scholar] [CrossRef]
  21. South Asia’s Population by United Nations. Available online: https://www.worldometers.info/world-population/southern-asia-population/ (accessed on 21 January 2020).
  22. Tripathi, D.; Chaturvedi, S. South Asia: Boundaries, Borders and Beyond. J. Borderl. Stud. 2020. [Google Scholar] [CrossRef] [Green Version]
  23. Map of South Asia. Available online: https://wikitravel.org/shared/File:Map_of_South_Asia.png (accessed on 6 January 2021).
  24. Sentinel-5P. Available online: https://sentinel.esa.int/web/sentinel/missions/sentinel-5p (accessed on 28 May 2021).
  25. Google Earth Engine (GEE) Data Catalog. Available online: https://developers.google.com/earth-engine/datasets/catalog/sentinel-5p (accessed on 28 May 2021).
  26. Farooq, F.; Khan, J.; Khan, M.U.G. Effect of Lockdown on the spread of COVID-19 in Pakistan. arXiv 2020, arXiv:2005.09422. [Google Scholar]
  27. Hebbar, P.B.; Sudha, A.; Dsouza, V.; Chilgod, L.; Amin, A. Healthcare delivery in India amid the Covid-19 pandemic: Challenges and opportunities. Indian J. Med. Ethics 2020. [Google Scholar] [CrossRef] [PubMed]
  28. Arafat, S.M.Y.; Tripathy, S.; Kar, S.K.; Kabir, R. Climate and clean air responses to COVID-19: A comment. Int. J. Public Health 2020. [Google Scholar] [CrossRef] [PubMed]
  29. Mahasinghe, C.; Erandi, K.K.W.H.; Perera, S.S.N. An Optimal Lockdown Relaxation Strategy for Minimizing the Economic Effects of COVID-19 Outbreak. Int. J. Math. Math. Sci. 2021. [Google Scholar] [CrossRef]
  30. Piryani, S.; Shakya, D.R.; Huq, M. COVID-19 And Lockdown: Be Logical in Relaxing It. J. Lumbini Med. Coll. 2020, 8, 1. [Google Scholar] [CrossRef]
  31. Bhuiyan, K.M.I.; Sakib, N.; Pakpour, A.H.; Griffiths, M.D.; Mamun, M.A. COVID-19-Related Suicides in Bangladesh Due to Lockdown and Economic Factors: Case Study Evidence from Media Reports. Int. J. Ment. Health Addict. 2020. [Google Scholar] [CrossRef]
  32. Mahato, P.; Tamang, P.; Simkhada, P.; Shahi, P.; Van Teijlingen, E.; Aryal, N.; Regmi, P. Effects of COVID-19 during lockdown in Nepal. Eur. J. Med. Sci. 2020. [Google Scholar] [CrossRef]
  33. Arora, S.; Bhaukhandi, K.D.; Mishra, P.K. Coronavirus lockdown helped the environment to bounce back. Sci. Total Environ. 2020. [Google Scholar] [CrossRef]
  34. Hashim, B.M.; Al-Naseri, S.K.; Al-Maliki, A.; Al-Ansari, N. Impact of COVID-19 lockdown on NO2, O3, PM2.5 and PM10 concentrations and assessing air quality changes in Baghdad, Iraq. Sci. Total Environ. 2021. [Google Scholar] [CrossRef] [PubMed]
  35. Fu, F.; Purvis-Roberts, K.L.; Williams, B. Impact of the covid-19 pandemic lockdown on air pollution in 20 major cities around the world. Atmosphere 2020, 11, 1189. [Google Scholar] [CrossRef]
Figure 1. Region of study [23].
Sustainability 13 07184 g001
Figure 2. Methodology to monitor the impact of lockdown on the increasing trend of NO2.
Sustainability 13 07184 g002
Figure 3. Nitrogen dioxide (NO2) concentration in South Asia, February to May 2019.
Sustainability 13 07184 g003
Figure 4. Nitrogen dioxide (NO2) concentration in South Asia, February to May 2020.
Sustainability 13 07184 g004
Figure 5. Change of nitrogen dioxide (NO2) in South Asia.
Sustainability 13 07184 g005
Figure 6. Nitrogen dioxide (NO2) concentration in South Asia.
Sustainability 13 07184 g006
Figure 7. Concentration level of nitrogen dioxide in South Asian countries from February to May 2019.
Sustainability 13 07184 g007
Figure 8. Concentration level of NO2 in South Asian countries from February to May 2020.
Sustainability 13 07184 g008
Figure 9. Change in NO2 concentration across South Asian countries.
Sustainability 13 07184 g009
Figure 10. Nitrogen dioxide (NO2) concentration in Pakistan.
Sustainability 13 07184 g010
Figure 11. Nitrogen dioxide (NO2) concentration in India.
Sustainability 13 07184 g011
Figure 12. Nitrogen dioxide (NO2) concentration in Afghanistan.
Sustainability 13 07184 g012
Figure 13. Nitrogen dioxide (NO2) concentration in Sri Lanka.
Sustainability 13 07184 g013
Figure 14. Nitrogen dioxide (NO2) concentration in Maldives.
Sustainability 13 07184 g014
Figure 15. Nitrogen dioxide (NO2) concentration in Bhutan.
Sustainability 13 07184 g015
Figure 16. Nitrogen dioxide (NO2) concentration in Bangladesh.
Sustainability 13 07184 g016
Figure 17. Nitrogen dioxide (NO2) concentration in Nepal.
Sustainability 13 07184 g017
Table 1. Details of sampled countries including the capital, population, and date of first reported COVID-19 case.
CountryCapitalPopulationFirst COVID-19 Case Reported
PakistanIslamabad224,723,43426 February 2020
IndianNew Delhi1,393,409,03827 January 2020
BangladeshDhaka166,163,8968 March 2020
AfghanistanKabul37,466,41424 February 2020
NepalKatmandu29,602,25623 January 2020
BhutanThimpu779,2186 March 2020
Sri LankaColombo21,493,58110 March 2020
MaldivesMale543,6177 March 2020
Table 2. Country-specific trend analysis from February to May 2019 to February to May 2020.
CountryOverall Reduction from Feb–May 2019 to Feb–May 2020 %Increasing Trend before Lockdown %Change Due to the Imposition of Full and Smart Lockdown %
Pakistan13.805.8131.43
India2.801.809.22
Afghanistan15.0910.9027.78
Sri Lanka6.2017.3438.88
Maldives7.624.322.4
Bhutan4.793.403.36
Bangladesh4.8022.8047.94
Nepal2.952.694.75
Table 3. Comparison with existing literature.
ReferencePollutants MonitoredRegion of Study
P. Sicard et al. [16]O3Southern Europe Rome, Nice, Valencia, and Turin
A. Otmani et al. [17]SO2, NO2, and PM10Morocco
Z. Li et al. [18]SO2, NO2, PM2.5, PM10, O3, and CONorthern China
B. M. Hashim et al. [34]NO2, O3, PM2.5, and PM10Baghdad, Iraq
F. Fu et al. [35]SO2, NO2, and COTwenty major cities: Wuhan, Beijing, Seoul, Tokyo, Delhi, Tehran, Istanbul, Moscow, Berlin, Rome, Paris, London, Madrid, New York, Los Angeles, Mexico City, Lima, Sao Paulo, Johannesburg, and Sydney
This StudyNO2South Asia
Publisher’s Note: MDPI stays neutral with regard to jurisdictional claims in published maps and institutional affiliations.

