Abstract
The condition of railway infrastructure, such as rails, ballasts and sleepers, should always be monitored and analyzed to ensure ride safety and quality for both passengers and freight. It is hard to assess the condition of railway infrastructure due to the existence of various components. The existing condition assessment models are mostly limited to only assess track geometry conditions and structural condition of the railway infrastructure. Therefore, the present research develops a defect-based structural and geometrical condition model of railway infrastructure. The defects of each component are identified and examined through literature and experts in the field. Two main inputs are used to develop the model: (1) the relative weight of importance for components, defects and their categories and (2) defects severities. To obtain the relative weights, the analytic network process (ANP) technique is adopted. Fuzzy logic is used to unify all the different defect criteria and to interpret the linguistic condition assessment grading scale to a numerical score. Hence, the technique for order preference by similarity to ideal Solution (TOPSIS) is used to integrate both weights and severities to determine the railway infrastructure condition. The developed model gives a detailed condition of the railway infrastructure by representing a three-level condition state, for defect categories, components and an overall railway infrastructure. The developed model is implemented to five case studies from Ontario, Canada. The developed model is validated by comparing its results with the real case studies results, which shows similar results, indicating the robustness of the developed model. This model helps in minimizing the inaccuracy of railway condition assessment through the application of severity, uncertainty mitigation and robust aggregation
1. Introduction
A solid infrastructure contributes to the improvement of economy and the development of a civilization. As part of city infrastructure, railways play a pivotal role in the transportation of both passenger and goods. In addition, railways are one of the most economical modes of transportations due to their energy efficiency. Railway infrastructure is a collection of different components from different types of materials such as rails, sleepers (ties), ballast, insulated rail joints and rail connections such as tie plates and anchors. Similar to any other infrastructure, railway infrastructure suffers from extensive deterioration due to continuous loading, high train speeds, frequent weather changes, improper maintenance, lack of inspection and uncertain condition judgments. These factors are liable to defects, which can gradually propagate and cause major failures in the railway system—leading to safety concerns, delays and economic losses. According to the United States Federal Railroad Administration Office of Safety Analysis, track defects are the second major cause of accidents on railways in the US. The first major cause of railway accidents is attributed to human error (FRA 2005). The poor management decisions about rail accidents, caused by the lack of rail inspection, are significant and are not reported by FRA, but only by the National Transportation Safety Board (NTSB). Fontul et al. [1] stated that the railway infrastructure, mainly the ballasted tracks, require systematic maintenance and a proper planning for track interventions. Furthermore, the railway lines have more traffic and loads circulating on them. Hence, the increased traffic speeds on the railway require restrictive safety measures during inspection and maintenance. Therefore, railway infrastructure should be always monitored and maintained to avoid major problems [2]. Railway infrastructure maintenance is costly given that it is equipment-oriented. In addition, the continuous demand for higher speed trains and heavier axle loads and tonnage makes it even more challenging to keep the tracks in good condition—calling for building new practices [3].
Previous research works have been reviewed to have a better understanding of the asset management of railway infrastructure. They included research works about condition assessment, maintenance planning, etc. The following research works summarize the research done on condition assessment from structural point of view. Sadeghi and Askarinejad [2] developed a quality index to assess the structural condition of the track based on visual inspection. The tracks were divided into four components, i.e., rails, ballasts, sleepers and fasteners. The weighted deduction density model was adopted to develop the quality index for each component of the track. Thus, four indices were developed, i.e., the rail quality index (RQI), the ballast quality index (BQI), the sleeper quality index (SQI), the fastener quality index (FQI), and the overall condition in terms of track quality index (TQI). In the developed weighted deduction density model, the degree of deterioration was determined as a function of the density (amount) of distress, its type and its severity level. After allocating these deduction values, the quality indices were computed based on them. Appendix A illustrates the three severity levels (low, moderate and high) and their description used in the indices, where low represents a good track condition with minimum defects, moderate represents defects that may or may not cause any operation restrictions or delays and high represents defects that cause operating restrictions on the track, preventing train operation and causing safety concerns. To organize the maintenance actions, the track line is divided into management sections, which are further divided into segments to aid in the evaluation of structural conditions by the visual inspection of selected segments [4]. The report developed by the US Army for railway infrastructure condition assessment is a development of condition indices for low volume railroad tracks. Appendix B illustrates the scale used in all the indices where the scale ranges from 0 to 100 and is divided into seven condition categories from excellent (85–100%) to failed level (0–10%). The excellent level is for the presence of very few defects, when the track function is not impaired and no immediate work action is required, but routine or preventive maintenance could be scheduled for accomplishment. The failed level shows extreme deterioration in the entire track, when track is no longer functional and major repair, complete restoration or total reconstruction is required. Several indices were developed to describe the condition of each component in the railways infrastructure. The Weighted Deduct-Density Model was utilized to develop the following indices: the Rail and Joints Condition Index (RJCI), the Tie Condition Index (TCI), the Ballast and Subgrade Condition Index (BSCI) and the aggregated condition index of the components indices. The Track Structure Condition Index (TSCI) was developed using regression technique [5].
Here, the condition assessment is discussed from a geometrical point of view. Madejski and Grabczyk [6] developed the five-parameter defectiveness (W5), a parameter to assess the geometrical condition of the track. The parameter is a result of aggregation of the five parameters, each representing one of the five geometrical defects, i.e., twist, horizontal deviation, gauge, vertical alignment and the cross-level variation defectives. Each parameter is a ratio of the sum of the length when the acceptable limits for the defects are exceeded over the total length of the section. The data used for the evaluation were gathered by the geometry track measurements done by the manual equipment, microprocessor-based portable instruments and geometry recording cars [6]. Indian Railway defined the assessment of track geometrical condition by the Track Geometry Index (TGI) using the standard deviation of the geometrical defects occurring [7]. Polish Railways highlighted the frequency of track inspection using the geometry cars. It stated that the inspection should take place at the minimum twice a year, where the frequency changes with the degree of curvature. For example, curves with a radius less than 350 m should be inspected minimum three times a year. In addition, Polish Railways developed a synthetic track quality coefficient (J) to assess the geometry condition. The standard deviation is firstly used as a basic measurement for the deferent geometry defects and the J-coefficient is a result of the average value of the standard deviations of the defects [6].
The Swedish National Railway developed a quality index to define the geometry condition of the track. The standard deviation of the left and right profiles of the track and the geometry defects were used to assess these components. The condition was defined by dividing the standard deviation of the existing condition over the allowable value of the standard deviation based on track categories [8]. Sadeghi and Askarinejad [9] developed a methodology to correlate between the tracks structural conditions and the data obtained from the automated inspections, such as the track recording car used to inspect the track geometry condition. The neural network was employed to explore relationships between the geometry data and the track structural defects to develop a model that predicts track structural conditions by using the geometry recording cars without the need for visual inspection to be conducted to save both time and economic losses [9]. Ferreira and Murray [10] highlighted the main causes of railway infrastructure deterioration, i.e., dynamic loads, train speed, axle loads and environmental factors. Their work also discusses maintenance decision support systems and maintenance optimization techniques for railway infrastructure.
Wang et al. [11] presented a structural health monitoring approach that exploited the use of active diffuse ultrasonic waves for monitoring the condition of railway turnout. A damage index was proposed based on the level of de-correlation between pair of diffuse ultrasonic waves signals and reads. The induced changes in the diffuse ultrasonic waves from the train passage were used to evaluate the defects’ growth. The captured readings were sent to an online diagnosis system for analyzing the health condition status of in-service railway tracks. Ni and Zhang [12] introduced a Bayesian learning-based model for the online assessment of railway wheel conditions. The measured dynamic strain responses were studied to a normalized cumulative density function that modeled the patterns of healthy railway wheels. Sparse Bayesian learning was then implemented to quantitatively analyze wheel conditions and uncertainties generated from noises and random wheel interactions.
Krummenacher et al. [13] presented a machine learning-based model for the automated detection of wheel defects based on the vertical force measurements captured by an installed sensor system. In the developed model, the time series of the vertical forces under the wheel were analyzed using support vector machines and artificial neural networks to determine if the wheels are defective or not. It was found that the developed model could achieve prediction accuracies above 80% for the wheels with flat spots and non-roundness. Yuan et al. [14] developed a deep convolutional neural network model for the detection of rail surface defects. The developed model integrated MobileNetV2 and YOLOv3 networks to classify and locate the defect images. Results demonstrated that the developed model accomplished lower prediction error and more robust performance when compared against the YOLOv3 network.
Lu et al. [15] created a machine vision-based model for the automated damage detection in railway rail. The developed model integrated the saliency cues of damaged areas and U-Net network to obtain the segmentation map. Data augmentation was carried out to increase the size of the dataset, and it was projected that the developed model achieved an overall accuracy and recall rate of 99.76% and 97.82%, respectively. Yang et al. [16] introduced a deep convolutional neural network-based model for the detection of defects in rail joints. The developed deep learning-based model encompassed the use of ResNet and a fully convolutional neural network for time series classification. ResNet was able to provide slightly better prediction performance than the fully convolutional neural network models.
Other research works were reviewed. The following research work talks about another component of the railway infrastructure, the overhead catenary system, to have a wider vision of the condition assessment models developed for railway systems. Song et al. [17] developed a spatial coupling model to study dynamic performance of pantograph-catenary with vehicle-track excitation, to study the impact of the railway infrastructure condition on the catenary system. The model showed that the condition of the catenary system decreases with the degradation of the railway infrastructure. Gao et al. [18] mentioned the use of the C6 system for the monitoring and detection of the pantograph-catenary in highspeed railways. The C6 system can measure the dynamic and static geometry parameters and the current collection and detect the defective working states of the components and the operation condition of the pantograph-catenary. This is done through installing detection equipment to provide a full and live detection. The working hours and installation positions of the equipment are chosen based on detailed design. Meanwhile, a three-level hierarchy is built to transmit and analyze the big data from the local administrations to the China Railway Corp.
In the view of aforementioned studies, it can be found that most of the reported models focused on the assessment of individual components or certain types of defects and lacked a comprehensive assessment of railway components. For instance, several models targeted track geometry condition, which is a small part of the various defects and components of the railway infrastructure. This can lead to inefficient and inaccurate maintenance budget assignment models due to their inability to reflect the actual condition of railway component. It can be noticed also that most of the reviewed work did not take into consideration the different speed levels or classes of the railway tracks. Most of the previous studies lacked a maintenance prioritization model that supported project and network-level decisions within the allocated budget requirements. These models are essential for decision-makers to aid them in ranking multiple railway components across different projects for maintenance according to their performance condition. Another shortcoming that can be observed is overlooking the inherent uncertainties and unforeseen conditions encountered during the inspection process. Failure to address these uncertainties can lead to misleading and unreliable maintenance decision support systems [19,20].
In light of the foregoing, the main objective of this research is to create a comprehensive railway assessment model that tackles uncertainty in the other models. The sub-objectives can be summarized as follows:
- Identify the condition assessment criteria of various railway components.
- Analyze the factors that affect the railway infrastructure deterioration.
- Develop a defect-based condition assessment model for railway infrastructure.
- Build a condition grading scale for all the railway components.
- Establish an automated platform for the developed railway infrastructure condition assessment model.
2. Model Development
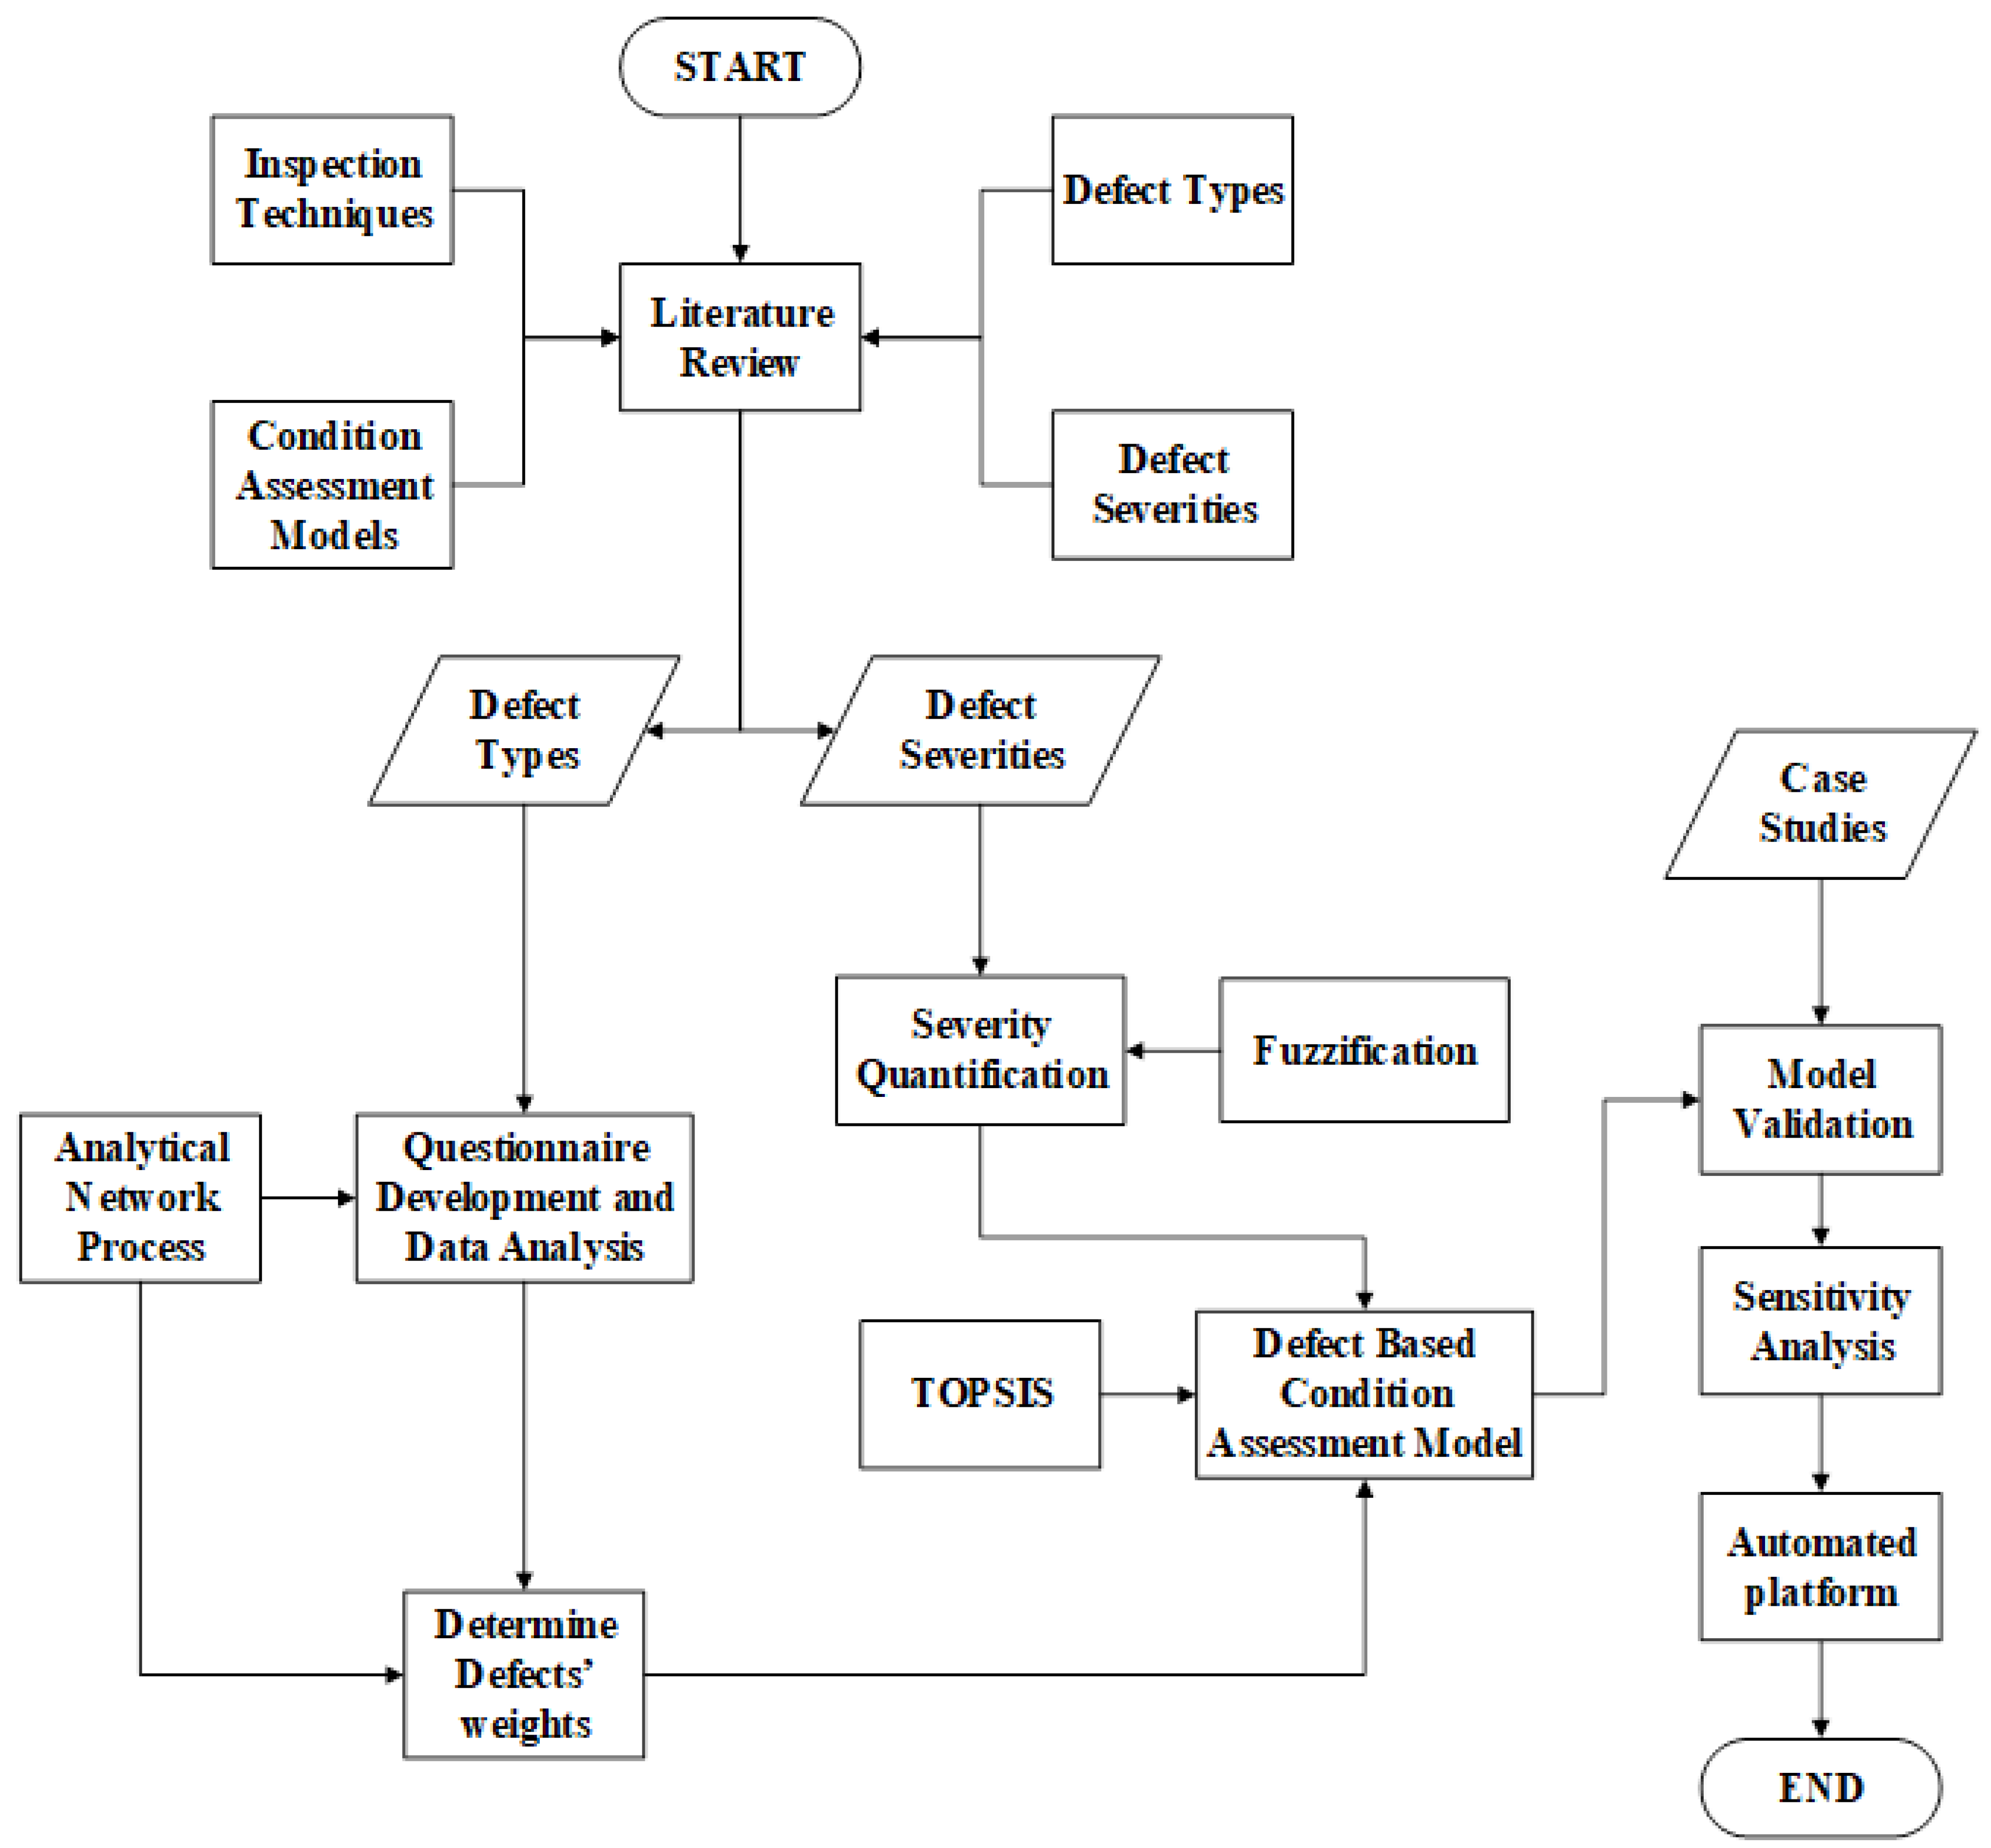
The methodology procedures of the developed model are depicted in Figure 1. The first procedure of the developed model encompasses reviewing previous condition assessment models and inspection models in addition to gathering experts’ opinions in order to understand the main defects that affect the performance condition of railways in terms of their type and extent of severities. The output comprises a hierarchy of the defects and their categories with respect to their respective railway components. It also involves the severity levels and the condition assessment grading scale of each of the railway’s defects. In the present research study, railway infrastructure is divided into five main components, which comprise the rails, sleepers (ties), ballasts, track geometry and insulated rail joints. The defects in each component are classified into certain categories, which are created based on the nature of the defects. An analytical network process is utilized to compute the relative importance weighting vector of railway components, defect categories and defects. These relative importance weights defects are obtained by delivering online and hard copy surveys to experts and professionals in this area. In this context, a three-level pairwise comparison is created to interpret the weights of railway components, defect categories and defects. In the first level, the experts are asked to determine how important railway component A is when compared against railway component B with respect to the overall condition of the railway infrastructure. In the second level, the expert is asked to determine how important defect category X is when compared against defect category Y with respect to defect category Z. For the third level, the expert is asked to specify the degree of importance of defect K when compared against defect L with respect to defect M.
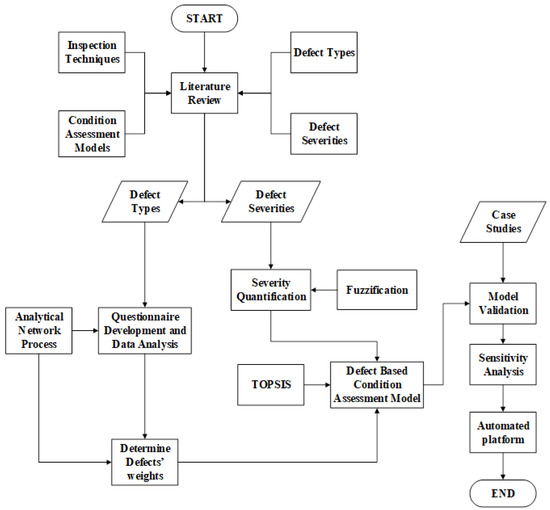
Figure 1.
Flowchart of the proposed research methodology.
In the second procedure, the developed model deploys fuzzy set theory to simulate the uncertainties and unforeseen events encountered by inspectors on site. In infrastructure asset management, a lot of multi-criteria decision-making techniques are used for optimal decisions. The common uses of the decision-making techniques are to combine technical information with experts’ opinions. These techniques combine the data and weights of several alternatives by aggregating the results of each to reach a single index that would reflect the condition of the asset [21]. Thus, both the weights and the severities of the developed model obtained from the previous procedures are aggregated using the TOPSIS algorithm resulting in the desired performance condition index. The developed model is finally implemented through an automated tool to facilitate its application by the users. The developed automated platform comprises a separate module for each designated speed level by the users.
In the third procedure, the developed model is validated through three-layer analysis. In the first layer, two case studies are analyzed in depth based on the weights of defects, their extent of severities and speed level of railway track. The second layer involves the application of the developed model to a group of railway components in five case studies to experiment with its use as a maintenance prioritization platform that supports both project and network level decisions. The third layer involves carrying out a sensitivity analysis to test the robustness of the developed model against the variations in the weights of railway components and to identify the most influential railway components. This is carried out through varying the weights of railway components and measuring their implications on the overall condition index of railway infrastructure.
2.1. Components, Defect Categories and Defects
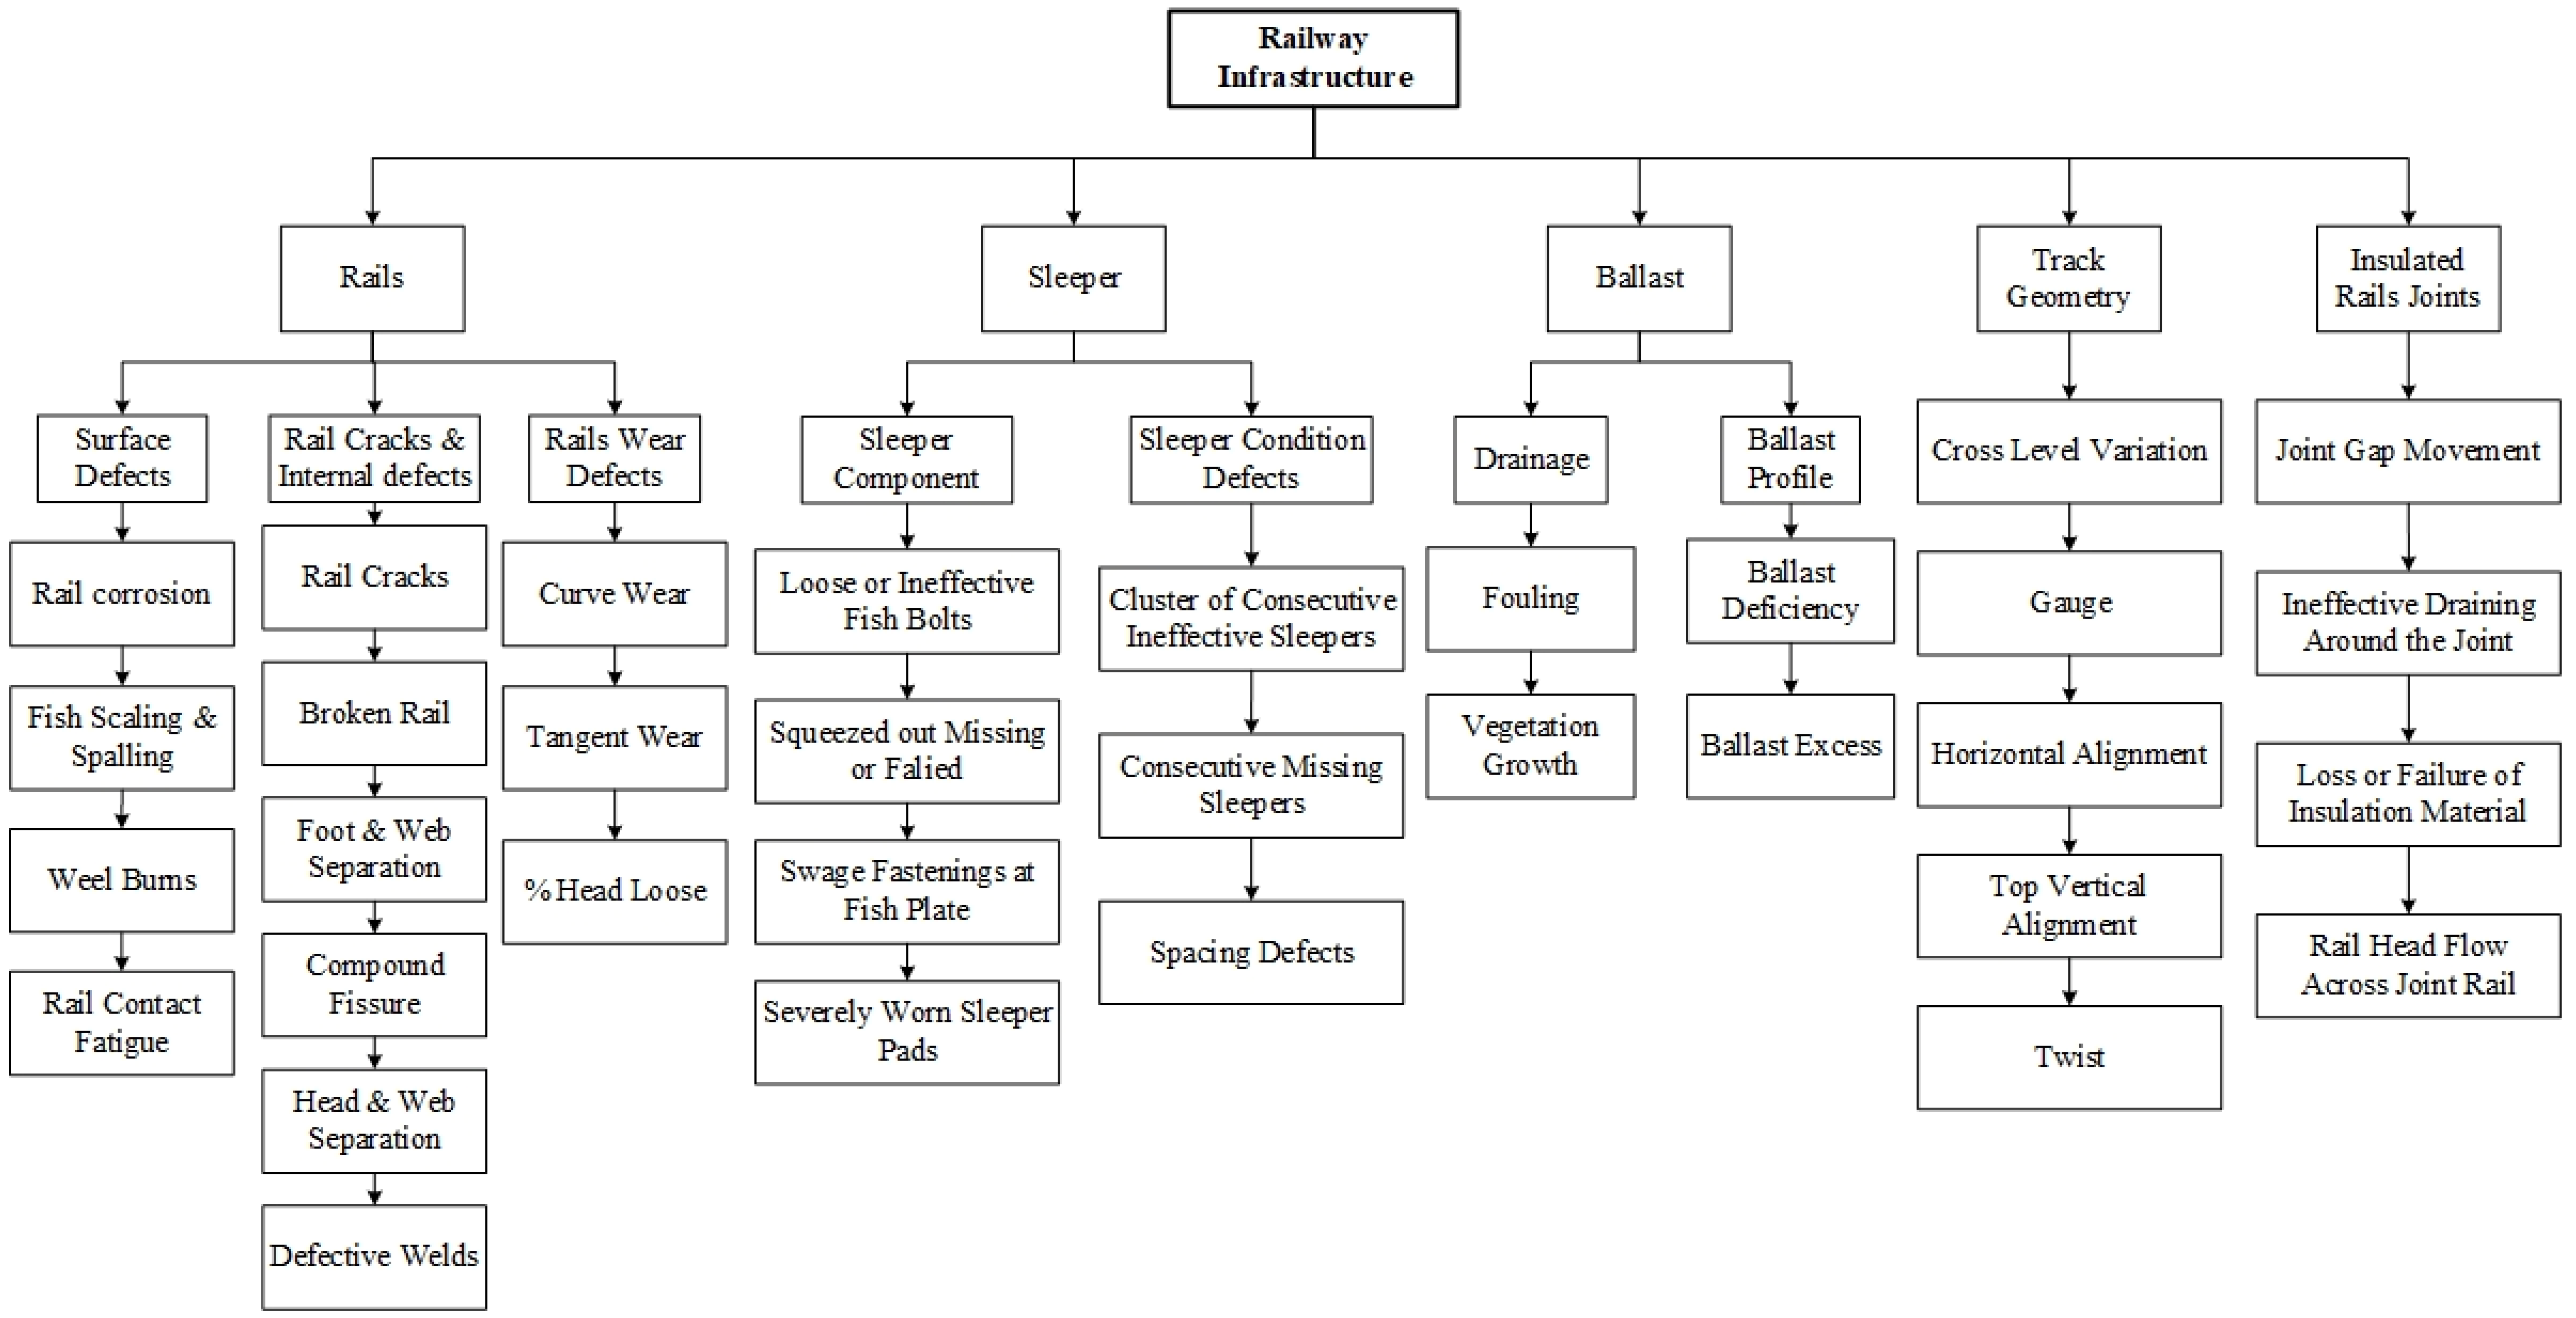
To discuss the railway infrastructure and provide a hierarchy to apply the models mentioned beforehand, the model is divided into five main components: rails, sleepers (ties), ballasts, track geometry and insulated rail joints—each with zero to three defect categories. The railway infrastructure defect hierarchy consists of the five main components: rails, sleepers, ballasts, track geometry and insulated rail joints, as well as their defect categories and the corresponding defects of each. Several manuals and research papers are reviewed, and professionals are consulted to define the main defects that occur in railway infrastructures [22,23,24,25,26,27,28]. A summary of 33 defects has been carefully selected to build the desired defect-based condition assessment model.
2.2. Defects’ Weights
This research adopts the analytic network process to compute the relative importance weights of the components, defect categories and defects as described in the following lines. The analytic network process technique was developed by Saaty in 1996 as a development of the analytic hierarchy process (AHP), also developed by Saaty in 1980 [29]. The AHP is a multi-decision making technique that uses a pairwise comparison matrix to result in ratio scales and therefore priorities based on the decision maker’s judgments [30,31] which provides a hierarchical representation of complicated decision-making problems. The Analytic Network Process is a generalization of AHP, accounting for interdependencies and interactions between criteria and sub-criteria in which a hierarchical structure is not a must.
In the analytical network process model, the goal is defined as the railway infrastructure in which its overall condition will be affected by the condition of defects and components. After defining all the defects and the hierarchy, pairwise comparisons are built in three directions in order to take the interdependencies between criteria into consideration. The simulated interdependencies are between the sub-criteria with each other, between the main criteria and each other and between the main criteria and the goal.
A questionnaire survey was developed to collect professionals’ opinions regarding the degree of importance for each component and its corresponding defects. Fourteen surveys were collected to be considered in this research. Each questionnaire survey was analyzed individually to obtain the desired weights. After extracting all the weights from the questionnaire surveys, an average value of the weights (W) is used in the aggregation process representing the weights of the components, defect categories and defects. Due to the large number of defects, “SUPER DECISIONS” software is employed to facilitate the implementation of analytical network process to compute the weights of attributes. In this regard, SUPER DECISIONS software is used to find the priority weighting vectors of railway components, defect categories and defects. The inputs of the SUPER DECISIONS software encompass the network of the defect-based model depicted in addition to the pairwise comparisons carried out with regards to railway components, defect categories and defects. Figure 2 shows the defects network built in “SUPER DECISIONS” software for the survey analysis. The hierarchy gathers the components, defect categories and defects. The entries of the pairwise comparison matrices are obtained from the questionnaires that the experts are required to fill. The responses of each expert are imported individually into the software and the associated weighting vectors are obtained. After extracting all the weights from the questionnaires, an average value of the weights is used in the aggregation process.
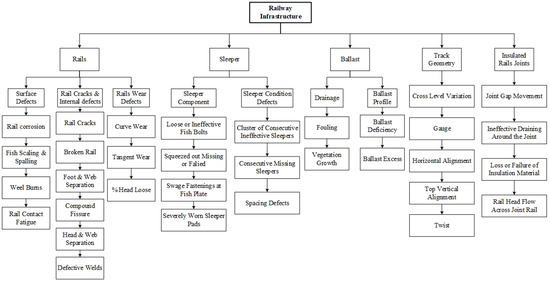
Figure 2.
Visual representation of the network of the defect-based model.
The core of the analytical network process is the supermatrix, which depicts the influence and relationships between the elements in the network on other elements. The analytical network process comprises progressive creation of three supermatrices as shown in the following steps [32,33]. In the first step, the unweighted supermatrix is formed based on computing the local priorities and Eigen vectors according to the entries of the pairwise comparison matrices. The second step encompasses multiplying the values of the entries of the weighted supermatrix by their respective clusters’ weights. The limit supermatrix is calculated by raising the weighted supermatrix to a higher power until it converges, i.e., all entries of the columns corresponding to any node have the same value. The limit supermatrix can be mathematically expressed using Equation (1):
where and stand for the limit and weighted supermatrices, respectively, and denotes the higher power which the weighted supermatrix is raised to.
The consistency of the pairwise comparison matrices obtained from the experts’ judgments need to be evaluated to ensure the reliability of the calculated importance weighting vectors of railway defects and components. The consistency property is checked through calculating the consistency index and then the consistency ratio to test the coherence of experts’ feedback. The consistency index and consistency ratio can be calculated using Equations (2) and (3), respectively (Saaty, 1990) [31]:
where and refer to the consistency index and consistency ratio of pairwise comparison matrix. stands for the maximum Eigenvalue of pairwise comparison matrix. indicates the size of the pairwise comparison matrix. indicates the random index, which is the consistency index for a randomly generated reciprocal matrix, whereas its value depends on the order of the judgment matrix. In this regard, if the consistency ratio is less than 10%, then the pairwise comparison matrix passes the consistency ratio, and therefore, the experts’ judgments are consistent, and the derived weights can be used in the condition assessment model. Otherwise, entries of the designated pairwise comparison matrix need to be revised. It is worth mentioning that the pairwise comparison judgments, which are considered in deriving the importance of weighting vectors, are the ones which achieved a consistency ratio less than 10%.
2.3. Defects’ Severities
Defect severity is the second main input in the model development. Defect severity is the degree of impact of a defect on a component or a system. Different sources have been reviewed to define defect severities, some sources have been found online and others have been recommended by experts. The main sources to define the severities and the condition assessment grading scales are TMC 203 track inspection [25], TMC 224 Rail Defects and testing manuals [26], which are developed by Railcorp in Australia. Table 1 shows the assessment scale that consists of six severity levels: from normal level, where the track is safe with no maintenance required, to emergency 1 (E1) as the most severe level with a maintenance plan required before the next train passage. The assessment scale recommends both the appropriate inspection and action times for each severity level.

Table 1.
Railway track defects’ severity levels (TMC 203).
The defect severities are divided into six levels of condition assessment scales based on the defect’s impact on the railway infrastructure. Different defects have different levels of impact, with some defects reaching emergency 1 severity level while other defects do not reach that level. The defect severities change with the speed in which the higher the speed of the track the more severe the defects are. The railway manuals define the six-speed levels with which the tracks operate. The severities are collected and organized for different defects and different speed levels.
2.4. Severities Quantification
After collecting all defect severities and defining all different measuring criteria for different defects, this research uses the fuzzy logic technique to represent all defect criteria and to translate the linguistic condition assessment grading scales into quantitative scores. Fuzzy set theory was developed by Zadeh [34] as a mathematical representation to deal with uncertainties that are not of statistical nature. The standard Fuzzy Synthetic Evaluation that comprises both the fuzzification and the defuzzification is adopted to uniform all the different defect criteria and to translate the linguistic grading scale into numerical values. The developed severities quantification model is described in the following steps:
- (1)
- Condition assessment grades (severity) are defined as fuzzy sets (subsets of the universe of discourse). The universe of discourse is the input space that encompasses all the possible values that each defect severity can take. In the developed model, the universe of discourse ranges from 0 to 10.
- (2)
- Defect severities are deduced from the Australian Manuals. Hence, the developed model utilizes six condition categories to be compatible with the Australian standards. The condition categories are normal priority 3, priority 2, priority 1, emergency 2 and emergency 1.
- (3)
- Severity quantification is done based on the analysis of the defect severities, whereas fuzzy numbers are used to represent each linguistic term of the defects’ severities. In this context, fuzzification is performed on the six levels of severity by defining them into overlapping bins within a 0–10 grading scale. Each triangular fuzzy number has to overlap with its neighboring fuzzy sets to reflect the concept of uncertainties associated with the inspection process of railway components. It is advised in the literature that an overlap that varies from 25% to 50% of the fuzzy set base can provide an appropriate measure of the impreciseness and vagueness, which is implemented in the present research study [35,36].
- (4)
- Triangular membership functions are used to depict the six severity levels across all defects. In this regard, triangular membership function is selected due to its simplicity, ease of calculation and it also able to simulate the uncertain environment of the used data [37,38].
- (5)
- Defuzzification is carried out to obtain a final score to be used in evaluating the defects, defect categories and railway components. The developed model uses graded mean integration approach to convert the fuzzy number to a crisp number [39,40].
Table 2 reports the grading scale and the final score of the six severity levels deduced from the defuzzification of the fuzzy membership functions graded mean integration approach. As shown in Table 2, the extents of severities of the defects are expressed in the form of triangular fuzzy membership functions. These functions are defined using lower, middle and upper values. For instance, the defining lower, middle and upper values of “P1” fuzzy membership functions are 5, 6.5 and 8.5, respectively. The obtained defuzzified score is 6.58. Similarly, the “P3” linguistic term is expressed in the form of a triangular fuzzy number, such that its lower, middle and upper values are 0, 3 and 5, respectively. The obtained severity values will be used alongside the computed weighting vectors are used collectively to compute the condition of defects, defect categories and railway components at all designated speed levels.

Table 2.
Boundaries of the different severity levels and their final scores.
2.5. Defect-Based Condition Assessment
The model is developed by the fuzzy synthetic evaluation technique that includes fuzzification, aggregation and defuzzification. After defining the two main input sets, which are the weights and defects severities, the TOPSIS approach is adopted to aggregate these two input sets to find the desired condition. The TOPSIS approach is applied to find the condition using the following steps:
- (1)
- The corresponding weights and severities for each defect are collected and organized.
- (2)
- The first level of the condition is the defect condition, created as a result of integration of the defect weight and its own severity. There will be 33 condition ratings related to the 33 defects.
- (3)
- The second step is repeated to determine each defect condition.
- (4)
- The second level of condition is the defect category condition. It is a result of aggregating all the defect condition ratings that are in the same category. In this level, the weight of each defect is aggregated with its severity.
- (5)
- The fourth step is repeated for all defect categories to find their corresponding condition.
- (6)
- The component condition is a result of aggregation of each component’s defect category condition. In this level, the weight of the defect category is blended by its condition from the previous step.
- (7)
- The final level of condition is the overall infrastructure condition. The infrastructure condition is a result of aggregation of the component condition. In this level, the weights of components are hybridized by their corresponding condition obtained beforehand.
The resulting condition would be used by project managers, engineers, decision makers and practitioners to help in the decision-making processes for maintenance and rehabilitation programs. When the condition is computed as a percentage using the TOPSIS-based model, it needs to be converted to a condition category. The boundaries of the rating system are recorded in Table 3. As can be seen, if the condition of the ballast is 3.2, then it lies in the “P1” condition category. In addition, it the condition of the rail is 5.6., therefore, its condition category is P2, as shown in Table 3.

Table 3.
Condition rating system of railway components.
The developed model deploys TOPSIS algorithm to evaluate the condition of different railway components and prioritization of intervention actions of railway components. TOPSIS is a widely used multi-criteria decision making algorithm that employs the concept of Euclidean distance to the positive ideal and negative solutions to determine the best alternative. In this regard, the best alternative is the one that has the closest Euclidean distance to the positive ideal solution and the farthest Euclidean distance to the negative ideal solution. The basic computational procedures of TOPSIS are described in the following lines [41,42].
The first step is the normalization of the performance scores in order to convert them in dimensionless one. The normalized decision matrix is obtained using Equation (4):
where and denote the normalized performance score and the performance score of the alternative with respect to design criteria.
The second step is the calculation of the weighted normalized decision matrix, which is generated by multiplying the normalized decision matrix by their respective weights. The weighted normalized decision matrix is defined using Equation (5):
where indicates the weighted normalized performance score of the alternative in terms of the criterion. is the weight of the criterion.
The third step is identifying the positive and negative ideal solutions of the multi-criteria decision making problem. The positive ideal solution () and negative ideal solution () are the most preferable and least preferable alternatives, respectively. For the cost design criterion, the decision maker seeks for the lowest value among the alternatives. With regards to the beneficial design criterion, the decision maker is looking for the highest performance score among the alternatives. The positive and negative ideal solutions can be identified using Equations (6) and (7), respectively:
Such that;
where and are the numbers of alternative and design attributes, respectively.
The fourth step is to compute the separation distance between the decision alternatives and ideal alternatives. The positive ideal separation and negative ideal separation can be defined using Equations (8) and (9), respectively:
where and indicate the Euclidean distance of the alternative to the positive and negative ideal solutions, respectively.
The fifth stage is the condition assessment of each railway component according to their relative closeness to the ideal solutions. The relative closeness coefficient of each alternative can be mathematically expressed as follows:
where stands for the relative closeness of the alternative.
2.6. Sensitivity Analysis
A sensitivity analysis is conducted to study the robustness of the developed model against the changes in the weight values of the different railway components. Furthermore, it enables us to determine the most influential railway components that affect the overall performance condition of railway. In this regard, the developed model tests the relationship between the weights of the components and the overall condition of the railway infrastructure. It also shows the degree to which any change in the inputs (weights) could affect the potential output (overall condition of railway). The sensitivity analysis is performed by varying the weights of railway components in five trials of 20% intervals one at a time, i.e., 20%, 40%, 60%, 80% and 100%. Then, the respective changes in the condition are measured and evaluated. This methodology is applied to the rails, ballasts, sleepers, geometry and insulated rail joints.
Assume the original weight of rails is denoted as “” and the change in the weight of the defect is denoted as “”. Thus, the modified weight of rails is equal to . The weights of other defects are computed using Equation (10) in order to ensure the summation of the weights of railway components is equal to one. Equation (11) is as follows:
where and refer to the modified and original weight of the main attribute, respectively. and denote the modified and original weight of other attributes, respectively.
The changes in the weights of railway components are evaluated based on the absolute deviation in the condition index (). The can be mathematically expressed using Equation (12):
where and represent the modified and original overall condition of the railway infrastructure. In this regard, is generated as a result of the change in the weight of the railway component at each scenario. and are calculated using the TOPSIS algorithm described in the previous section. It is worth mentioning that a highly sensitive railway component is the one that induces high which implies a significant variation in the original overall condition of railway infrastructure. In addition, it is worth noting a decision support system is considered as a robust platform if it is slightly sensitive against the explicit variations in the weights of railway components.
3. Data Collection
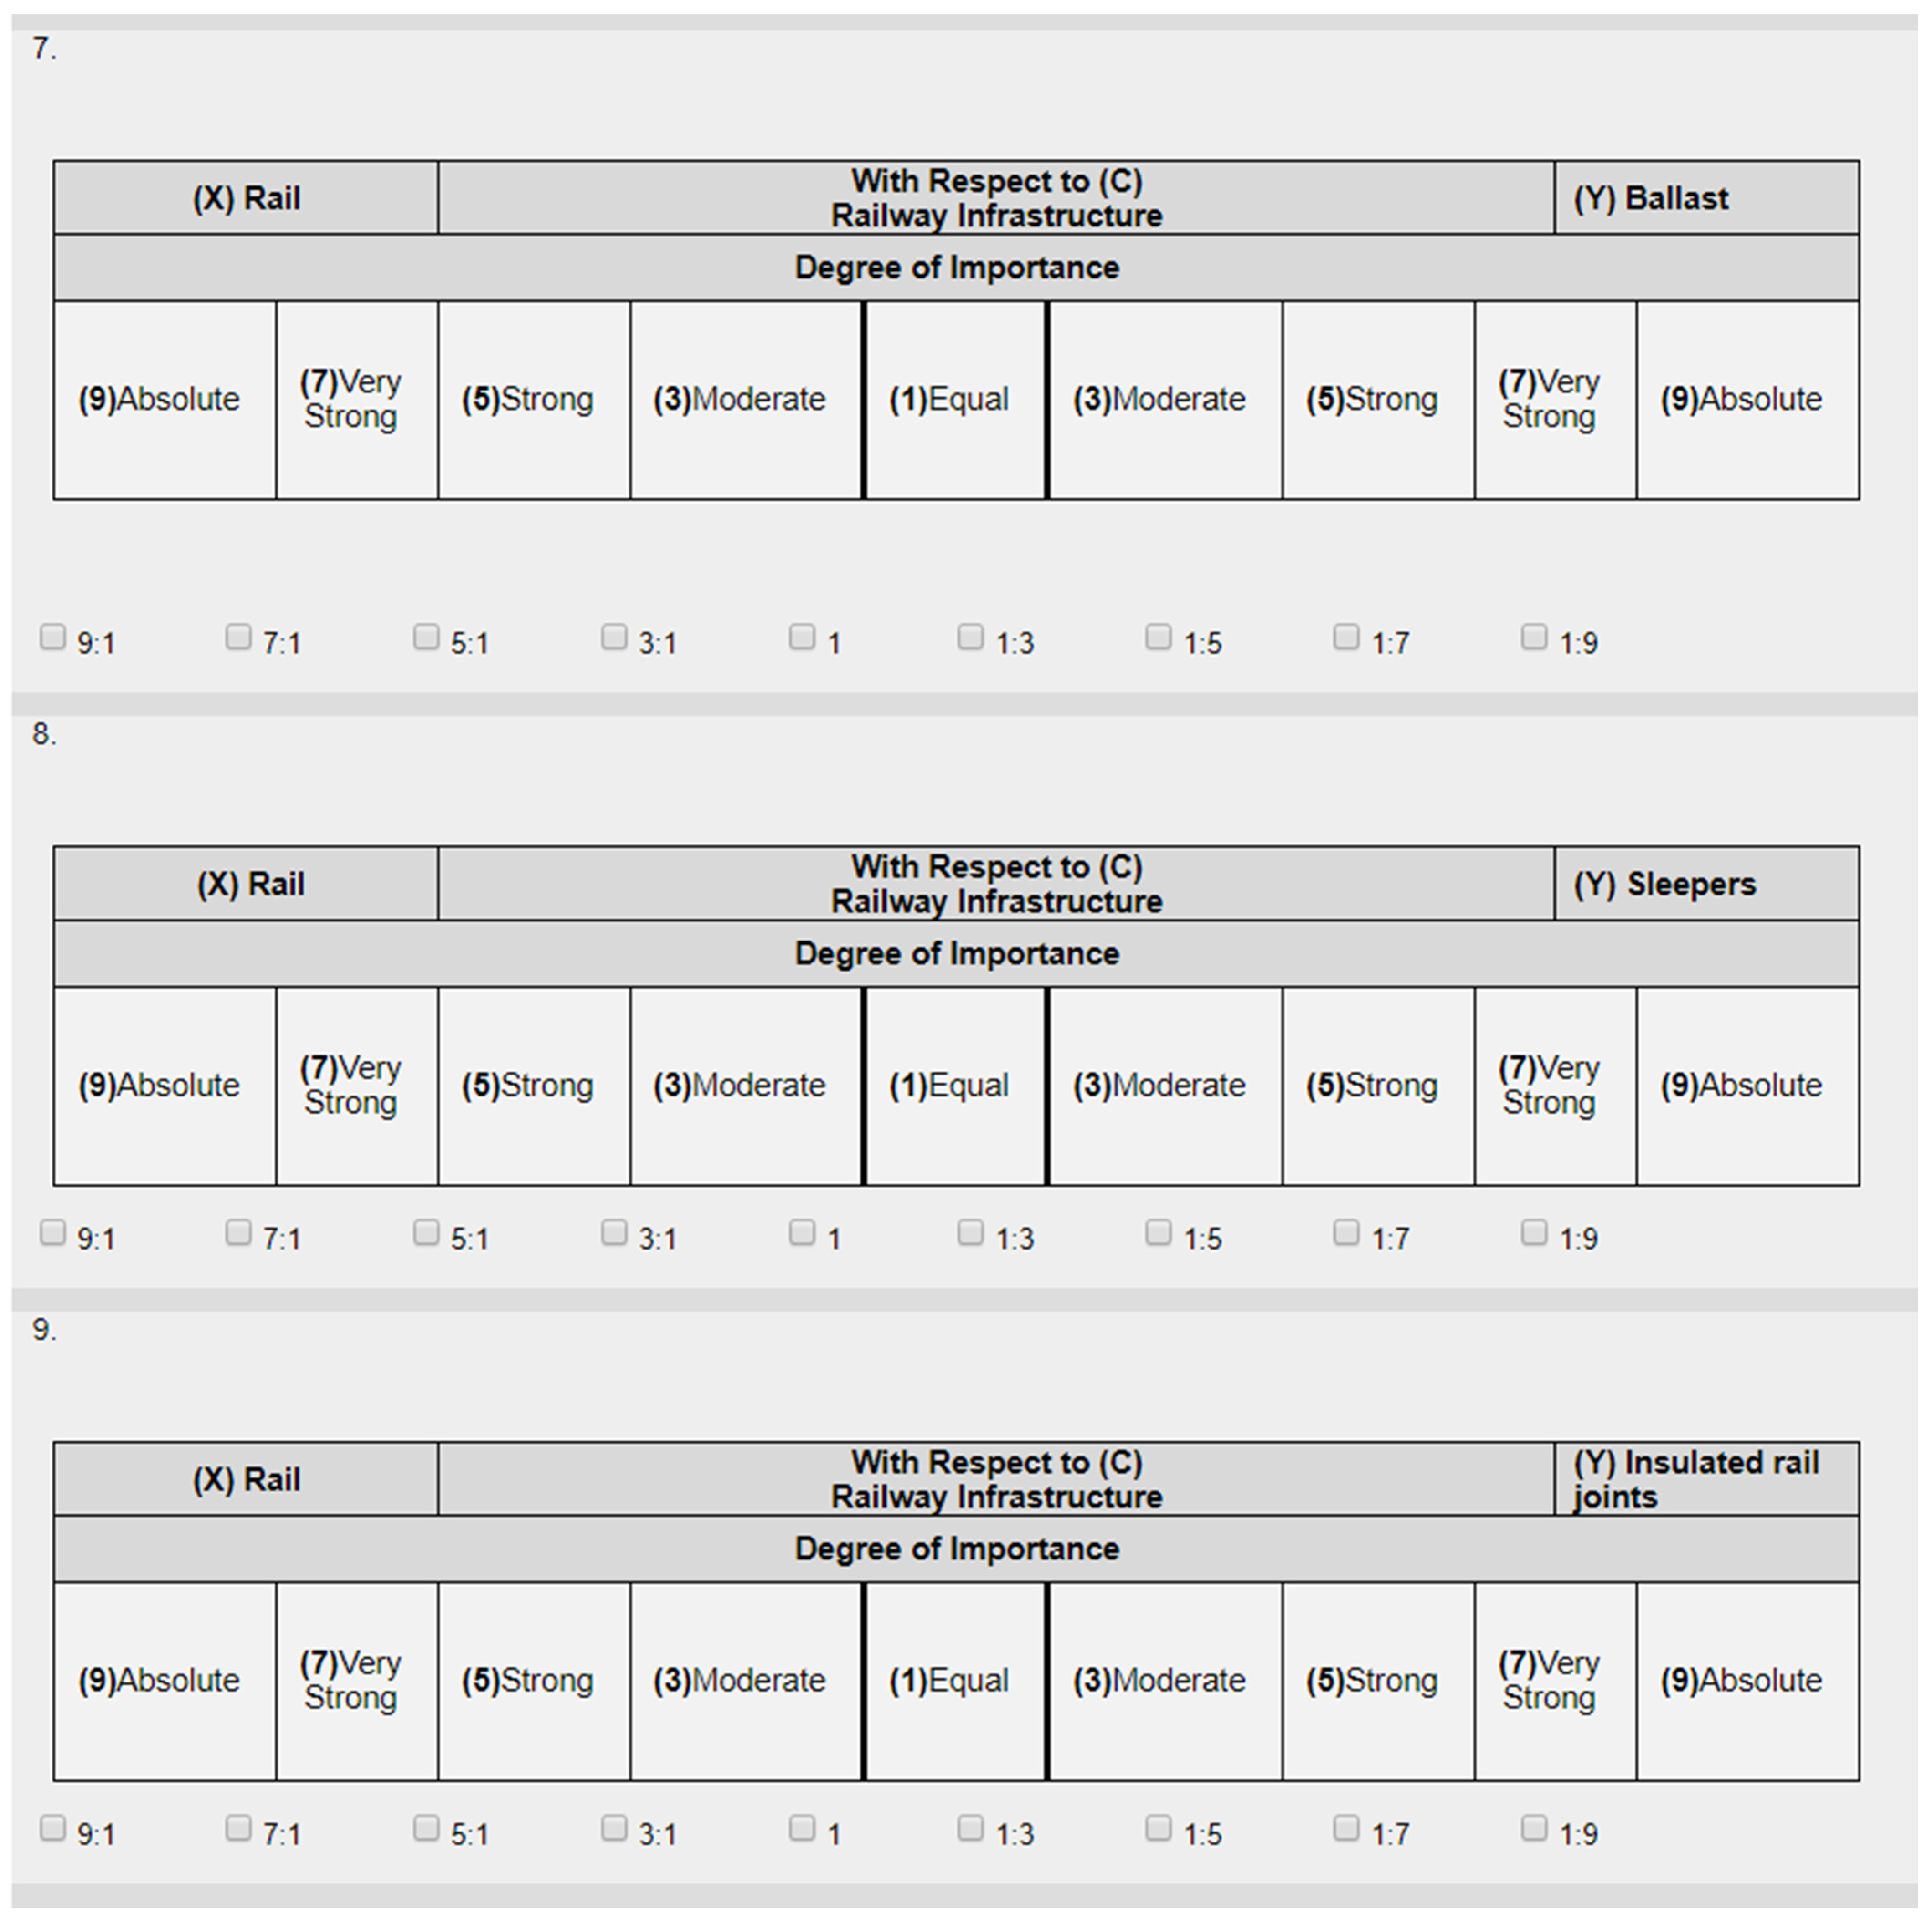
This research has adopted the analytic network process to find the components, defect categories and defects’ weights. This process has been specifically chosen to account for the interdependency among sub-criteria (defects), criteria (defect categories and defects) and within each category. A questionnaire has been developed and distributed both in hard copy and online. The online questionnaire has been developed based on http://www.surveyexpression.com (accessed on 21 January 2021)—the website that allows the user to build and distribute questionnaires. The site provides a detailed analysis of the filled questionnaires. Both surveys consist of six parts with a total of 66 questions. The general question is as follows: What is the relative importance of element (X) over an element (Y) with respect to element (C)? The first part in the survey is a general pairwise comparison of the components and defect categories with respect to the set goal. The second part is a pairwise comparison of the rails defect categories and defects. The third part is a pairwise comparison of the sleepers defect categories and defects. The fourth part is a pairwise comparison of the ballast defect categories and defects. The fifth part is a pairwise comparison of the track geometry defects. The final part is a pairwise comparison of the insulated rail joints defects. Figure 3 shows a sample of the online survey with part of the comparison between the railway components that the experts are asked to fill. For instance, the expert is asked to determine how important rails when they are compared against ballast with respect to the overall condition of the railway infrastructure. In addition, they are asked to identify the degree of importance of rails when compared against sleepers with respect to the overall condition of railway infrastructure. The experts are also asked to specify the degree of importance of rails when compared against insulated rail joints with respect to the overall condition of railway infrastructure. In this context, the experts are asked to express their preference based on a 9-point scale. If the expert selected a moderate preference of rails over ballast, this implies that rails are three times as important as ballast. In addition, if the expert specified strong preference of rails over insulated rail joints, thus, rails are five times as preferable as insulated rail joints.
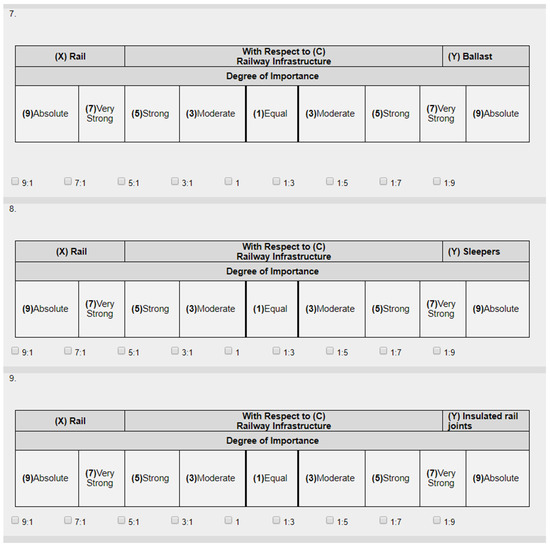
Figure 3.
Sample of the pairwise comparisons with respect to railway components.
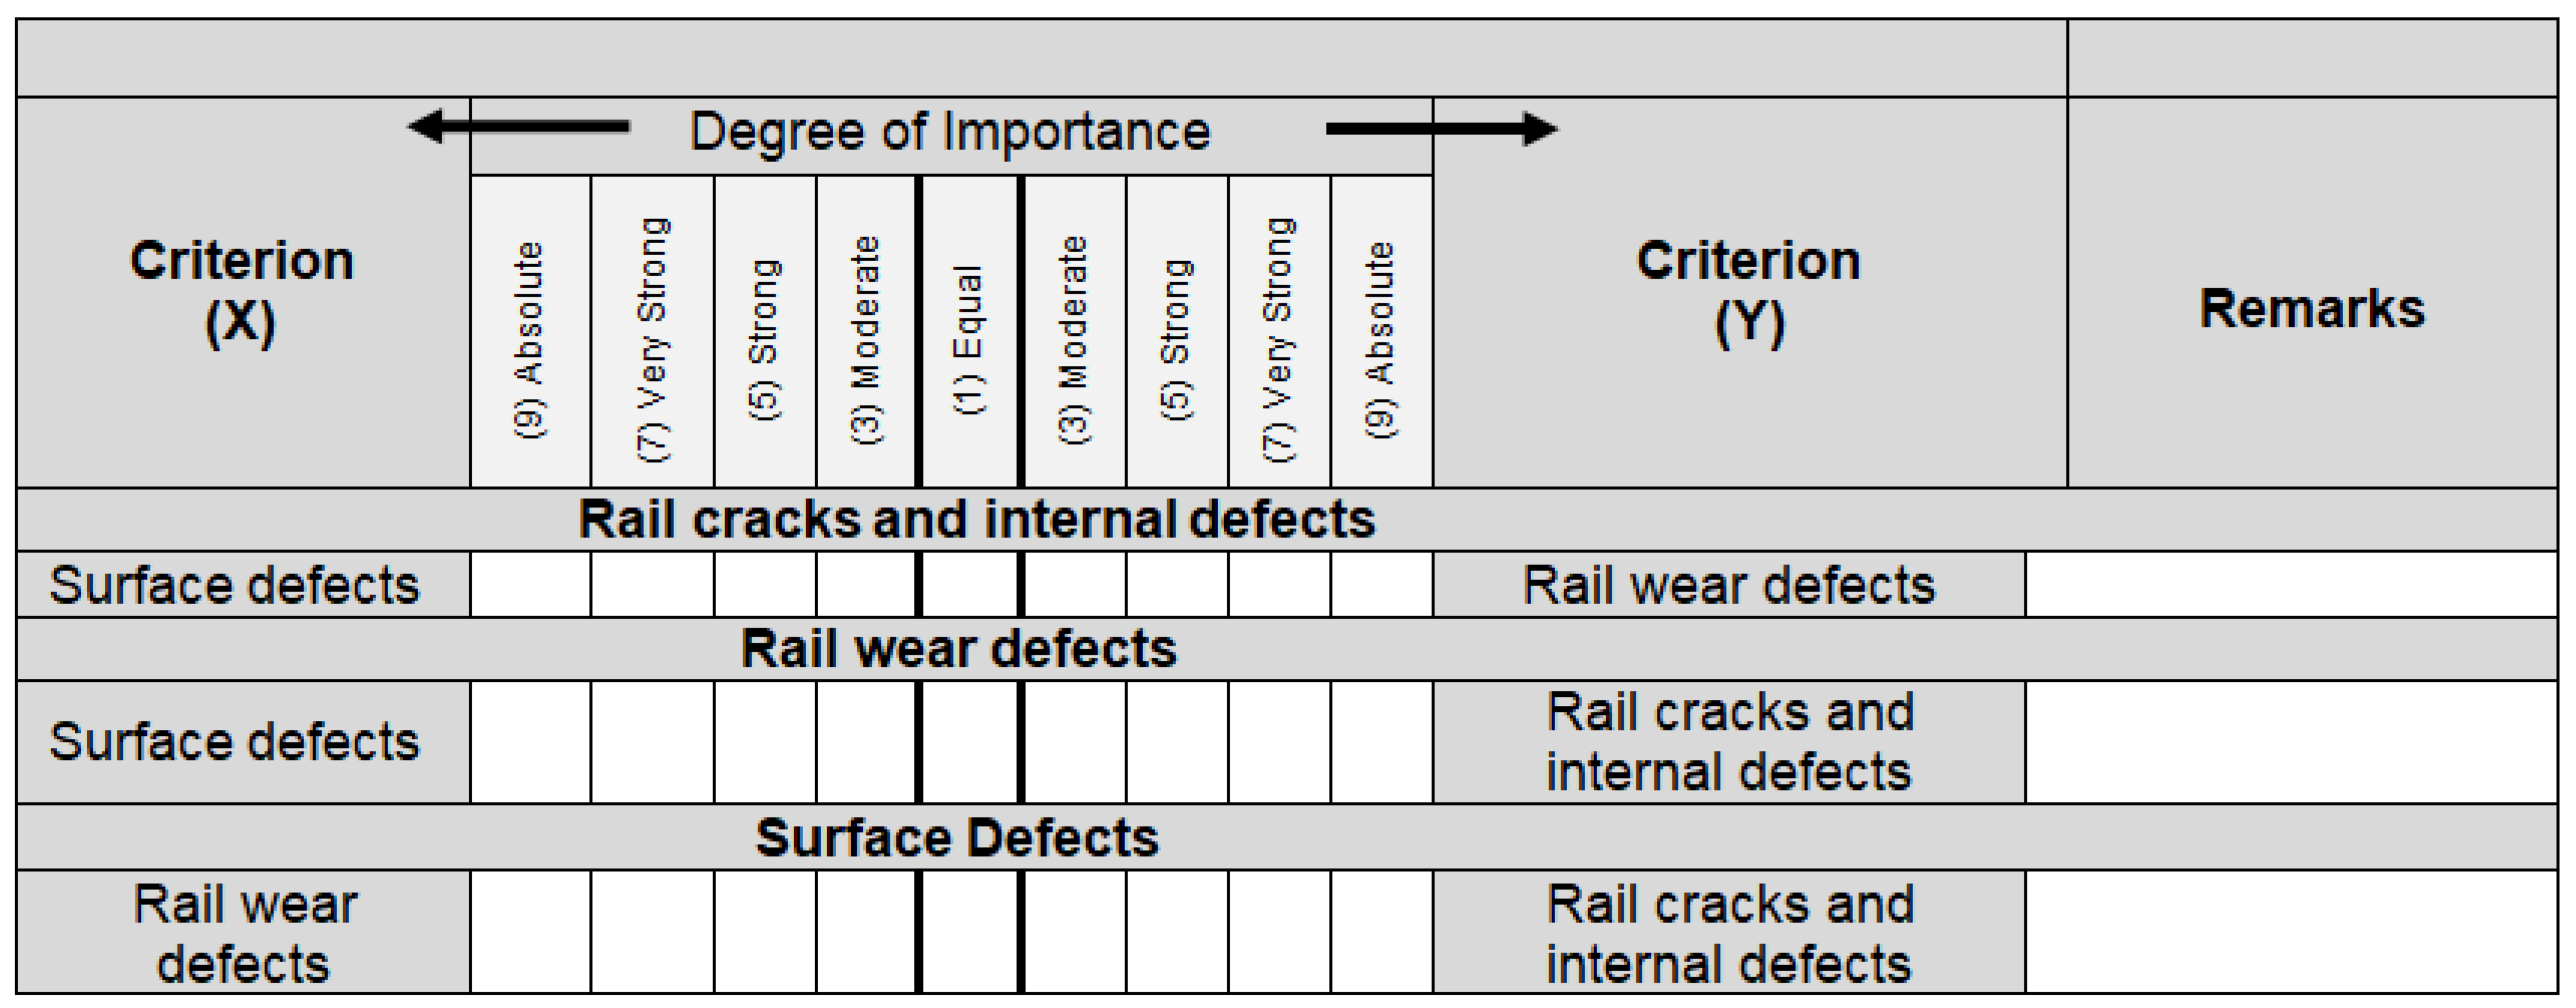
Figure 4 depicts the pairwise comparisons conducted with respect to the defect categories of rails. As mentioned earlier, the rail defects are divided into three clusters, namely surface defects, rail crack and internal defects and rail wear defects. For instance, in the online questionnaire, the expert is asked to identify how important surface defects are when compared against rail wear defects with respect to rail crack and internal defects. The expert is also required to degree to determine the degree of importance of surface defects when compared against rail cracks and internal defects with respect to rail wear defects. Moreover, the expert is asked to specify how important rail wear defects are when compared against rail crack and internal defects with respect to surface defects.
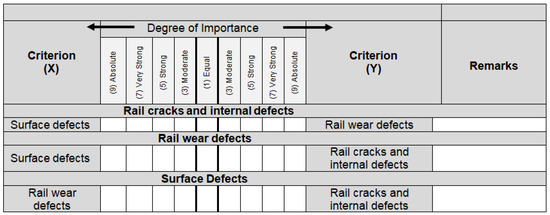
Figure 4.
Sample of the pairwise comparisons with respect to defects’ categories.
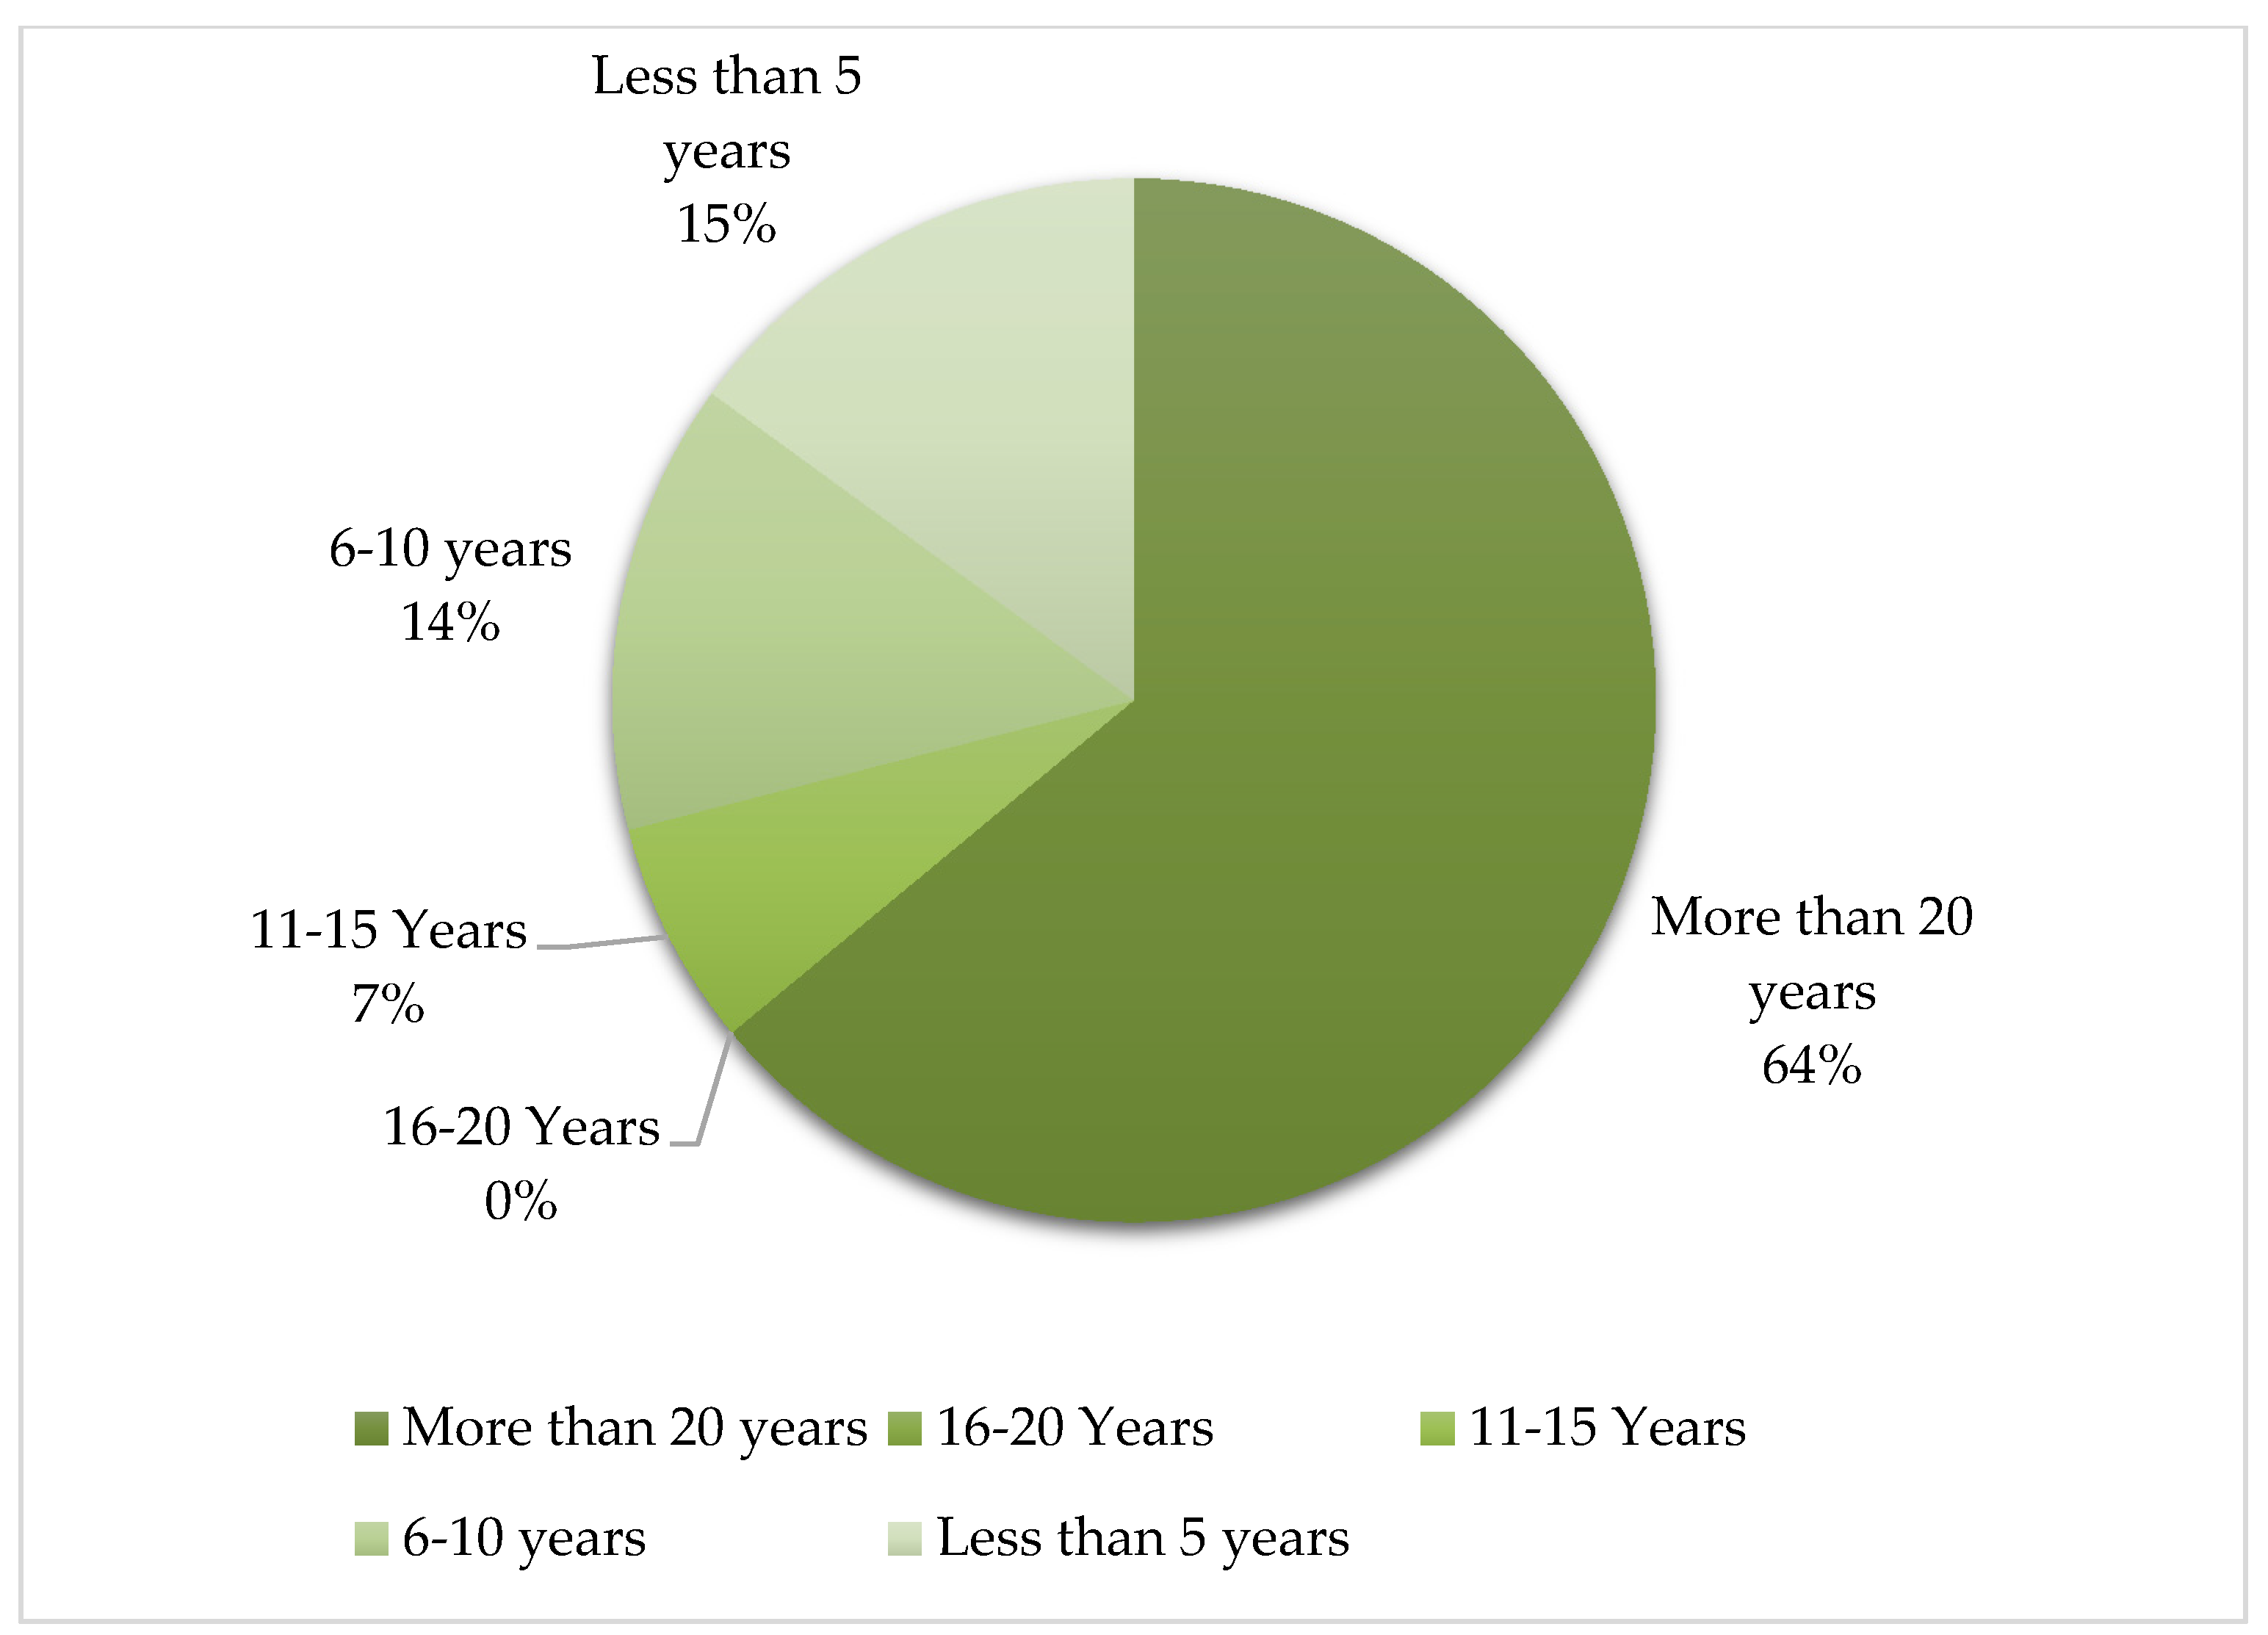
Table 4 shows the statistics based on the survey given to more than 50 experts, managers and engineers in railway engineering and construction in Canada. Fifteen questionnaires are collected, one is neglected due to giving the same answer for all the questions and the majority has been filled by engineers with varying years of experience in the field. Figure 5 shows the distribution of respondents’ number of years of experience, where 64% of the questionnaires are filled by engineers with more than 20 years of experience—providing more reliable results. Fourteen percent (14%) of the questionnaires are from respondents with 6–10 years, 7% with 11–16 years and 15% with less than 5 years of engineering experience.

Table 4.
Statistic of questionnaire survey.
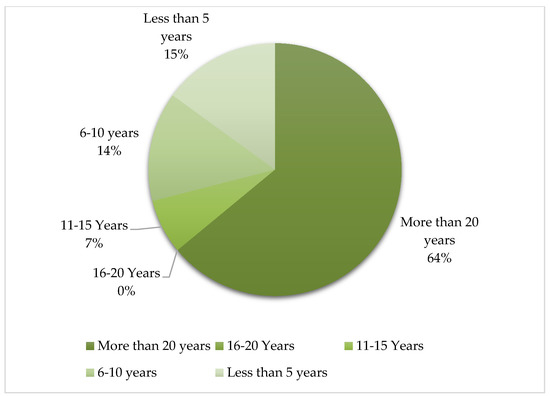
Figure 5.
Breakdown of years of experience of respondents.
To analyze the surveys, the responses are checked for the credibility of the questionnaires and for being used in the process of weight determination. The responses to 66 questions are reviewed and their corresponding statistics are provided. The questions are based on pairwise comparisons, as mentioned earlier and the comparisons are between two components or two defect categories or defects. They have two sides: Whether element X is more important than element Y or whether element Y is more important than element X. It is worthy to mention that 95% of the questions are one-sided. An average of 76% of the responses to the same question are one sided, meaning that the answers to the same question has the same point of view when it comes to which element is more important than the other. Table 5 illustrates an example for the questions as well as their response statistics. The example question compares the sleeper component (X) to the insulated rail joint component (Y) with respect to ballasts (C). The results show that 85.8% of the responses take the side of the sleepers, and the majority says that the ballast is more important than the insulated rail joints.

Table 5.
Sleepers to insulated rail joints comparison statistics.
4. Model Implementation
One of the main components in the model development is the implementation of the model to real case studies with real data of inspections and final decisions. This is done to check the model’s applicability and credibility. This is done in the five case studies from Ontario, Canada. Two of them are analyzed in detail.
4.1. Weight Interpretation
Three levels of weights based on the three levels hierarchy are found. The first level is component weights, the second is defect category weights and the third is defect weights. Before deriving the weights of the three level hierarchy, the consistency ratio approach is applied to each pairwise comparison matrix to ensure the coherence and reliability of the derived weighting vectors. In this regard, it is found that the consistency ratios across the different pairwise comparison matrices of the experts ranged from 1.2% to 5.4% which is less than 10%. Thus, the obtained pairwise comparisons can be used as inputs to compute the relative importance of weighting vectors of defects, defect categories and railway components. Table 6 summarizes all the three level weights. It reports the weights of railway components (Wk), weights of defect categories (Wj), local weights of defects (Wi) and global weights of defects (Wi-global). The component weight analysis shows that the sleepers have the highest weight (27%) followed by track geometry (26%), and then ballasts (18%), rails (16%) and insulated rail joints (13%) with the lowest weight among the components. The rail defect weights show that the rail internal defects have the highest weight (41%). The surface defects have the second highest weighting of 35% and the wear defects (24%) have the lowest weight. This result is reasonable as it matches the fact that internal defects are a major cause of accidents. Moreover, in the internal defects category, broken rails are given the highest weight (26%) and defective welds have the lowest weight (8%). These results are logical since the broken rails are considered as one of the worst types of defects as per the judgment and knowledge of the experts of railway industry. For surface defects, all defects have almost equal weights. With regards to the rail wear defects, curve wear has the highest relative importance weighting (53%). On the other hand, tangent wear attained the lowest importance (14%). This is also a reasonable result since the curve defects are more severe than the ones in the tangent areas.

Table 6.
Final weights of defects, defect categories and components.
Ballast weight extraction shows that the drainage defects outweigh the ballast profile defects with a weight of 55%, compared against a weight 45%, which is not of a great difference. In the drainage defects, the fouling defect of 62% has a higher weight than the vegetation growth, showing that the fine materials are more effective than the vegetation in terms of blocking the drainage feature of the ballast. The analysis shows that the ballast deficiency of 79% outweighs the ballast excess of 21% in the ballast profile defects. The sleeper condition defects are given a relatively higher weight, i.e., 63%, than the sleeper component defects, i.e., 37%. In the sleeper condition defects, the category of consecutive ineffective sleepers has the highest relative importance followed by consecutive missing sleepers and finally spacing. The importance weights of consecutive ineffective sleepers, consecutive missing sleepers and spacing are 52%, 34% and 13%, respectively. For the sleeper component defects, it can be inferred that severely worn sleeper pads had greater relative importance, showing that the pads are the most important part in the connection between the rails and the sleepers. On the other hand, swage fastenings at fish-plated joints are the least important type of defects. In this context, severely worn sleeper pads and swage fastenings at fish-plated joints obtained relative importance weightings of 45% and 14%, respectively.
With respect to the track geometry defects, twist defects yielded the highest weighting followed by gauge defects and then cross-level variation. On the other hand, top vertical alignment had the least relative importance. In this context, the weights of twist defects, gauge defects, horizontal alignment defects and vertical alignment defects are 32%, 27%, 16% and 11%, respectively. With regards to insulated rail joints, it is found that joint gap movement obtained the highest relative importance. It is also revealed that failure of insulation material and ineffective drainage around joints have nearly the same importance while railhead flow across joint rail has the least weight. In this context, the joint gap movement, ineffective drainage around joints, failure of insulation material and railhead flow across joint rail have relative importance weights of 45%, 21%, 20% and 14%, respectively.
The final global weights of the defects are obtained by multiplying their local weights by their respective defects’ categories weight by their corresponding component’s weight. For example, the final global weight of broken rail is equal to 0.16 × 0.41 × 0.26 which is equal to 1.71%. Moreover, the final global weight of severely worn sleeper pads can be computed through 0.27 × 0.37 × 0.45, which is equivalent to 4.5%. Based on the final global weights, and by modeling the importance of defects, defect categories and railway components, it can be deduced that clusters of consecutive ineffective sleepers have the final global weight followed by twist defects in track geometry, while defective welds in the rails are the least important defect. In this context, the final global weights of clusters of consecutive ineffective sleepers, twist defects and defective welds are 8.85%, 8.32% and 0.52%, respectively.
4.2. Condition Assessment
This section describes the implementation of the developed condition assessment model to two case studies in detail.
4.2.1. Case Study 1
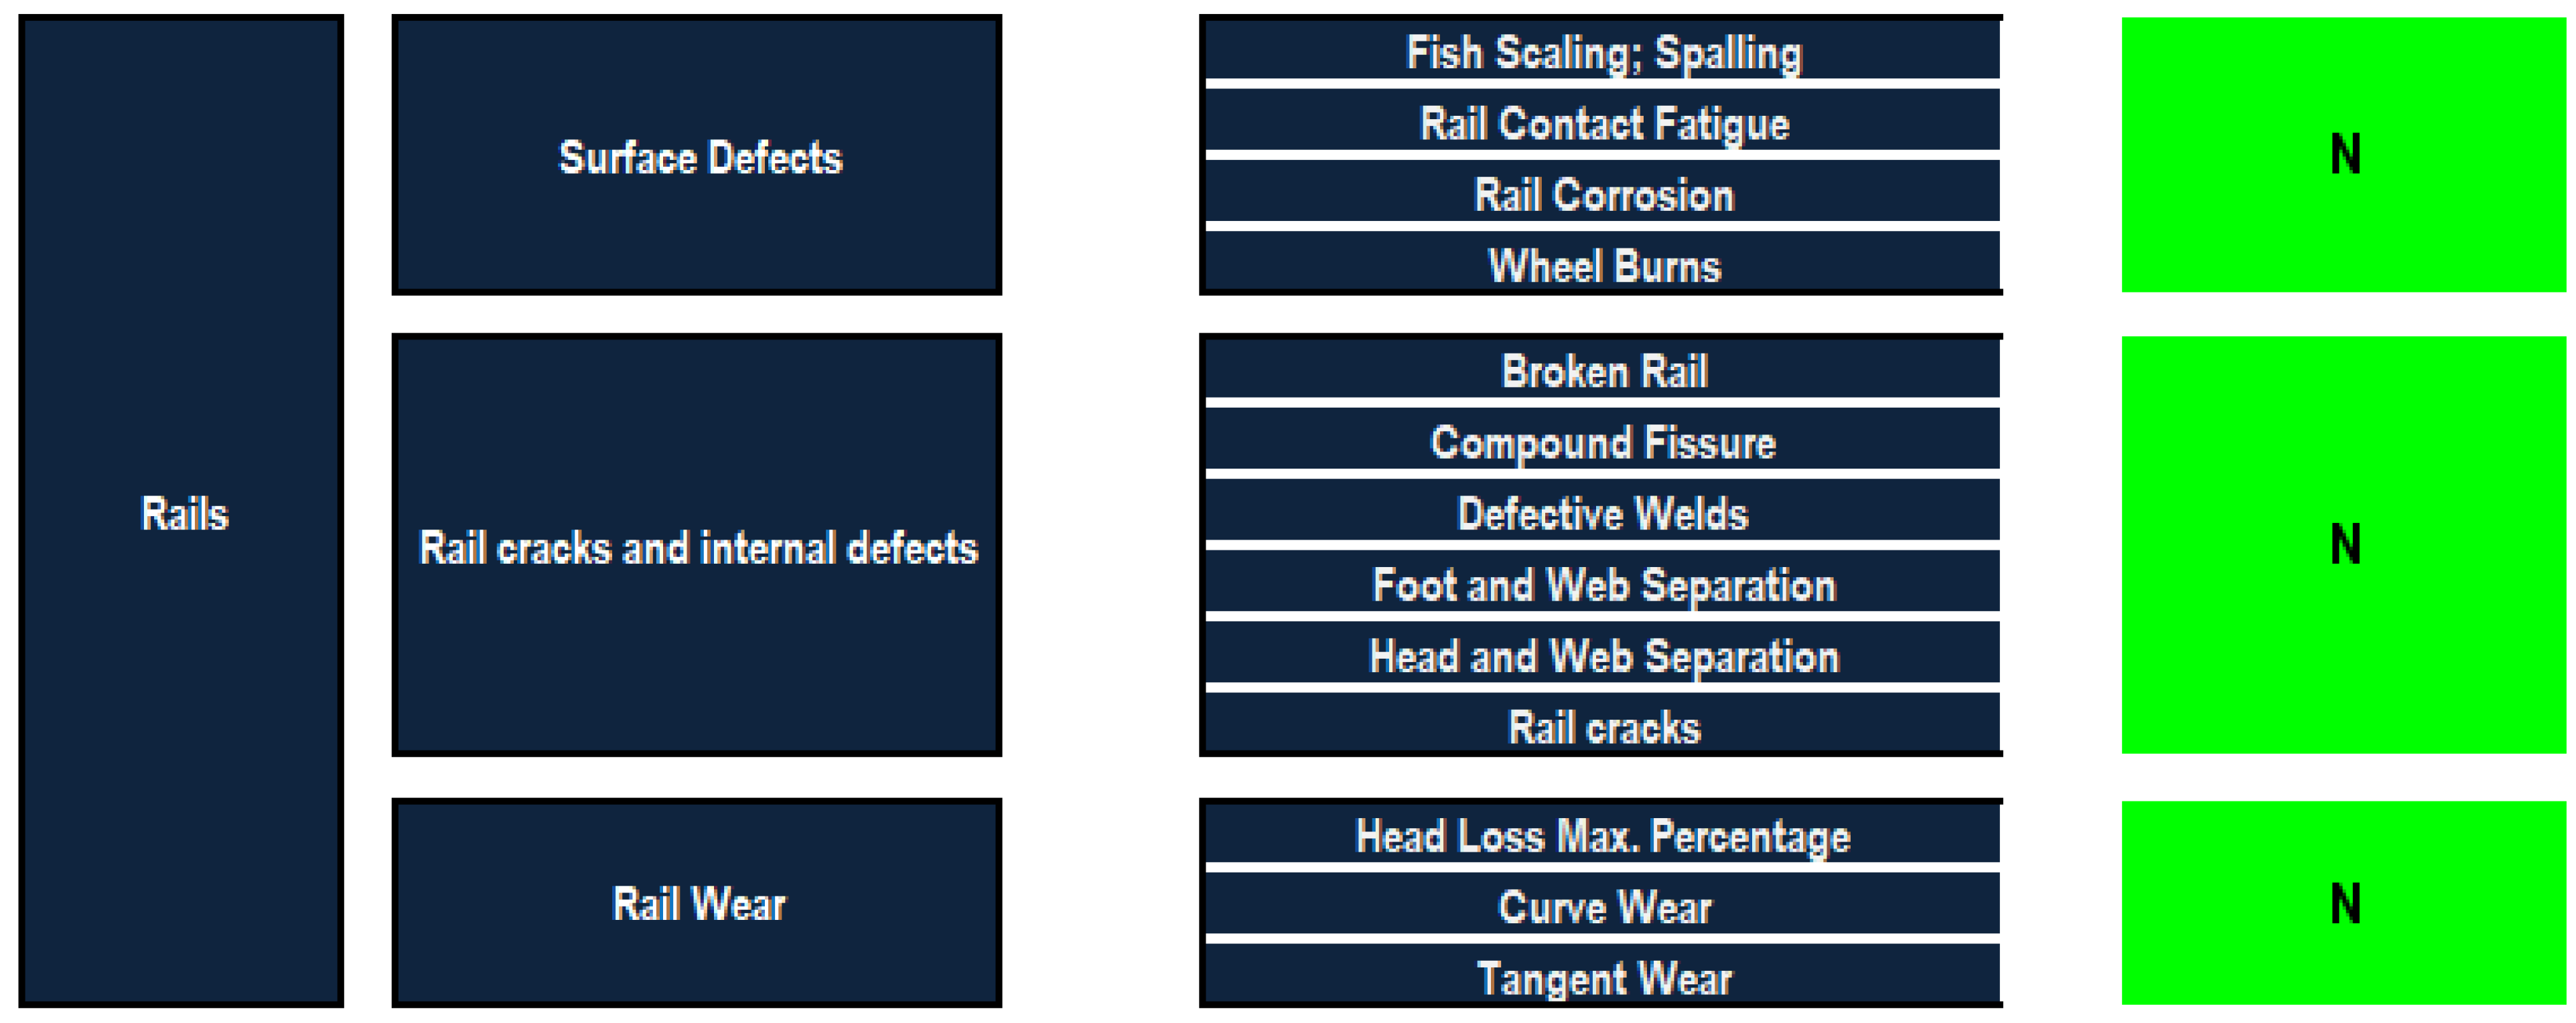
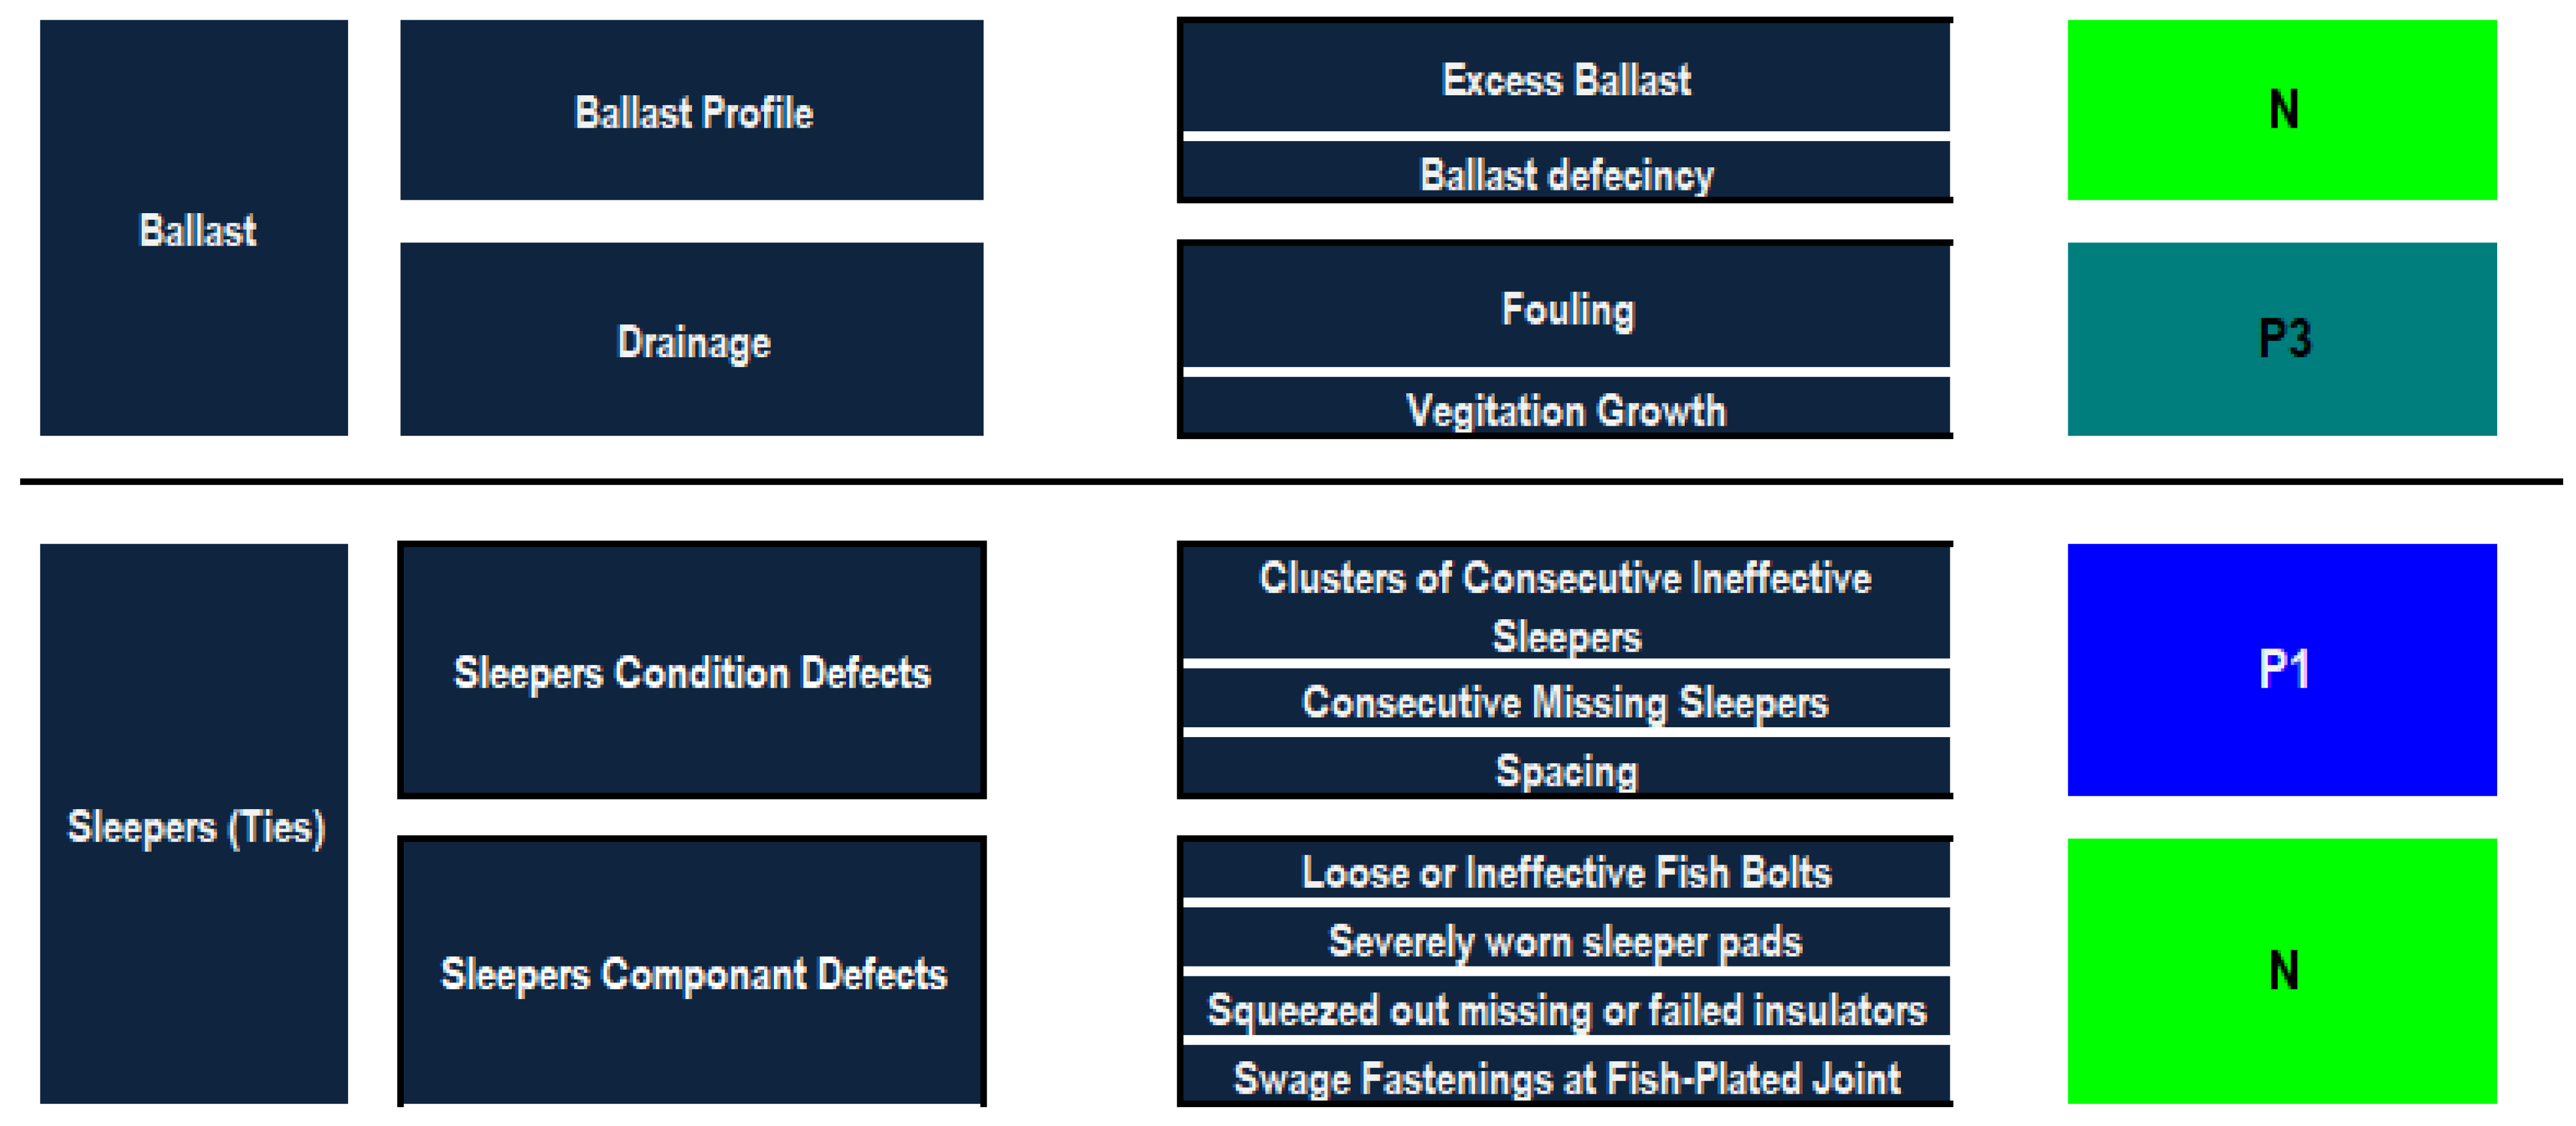
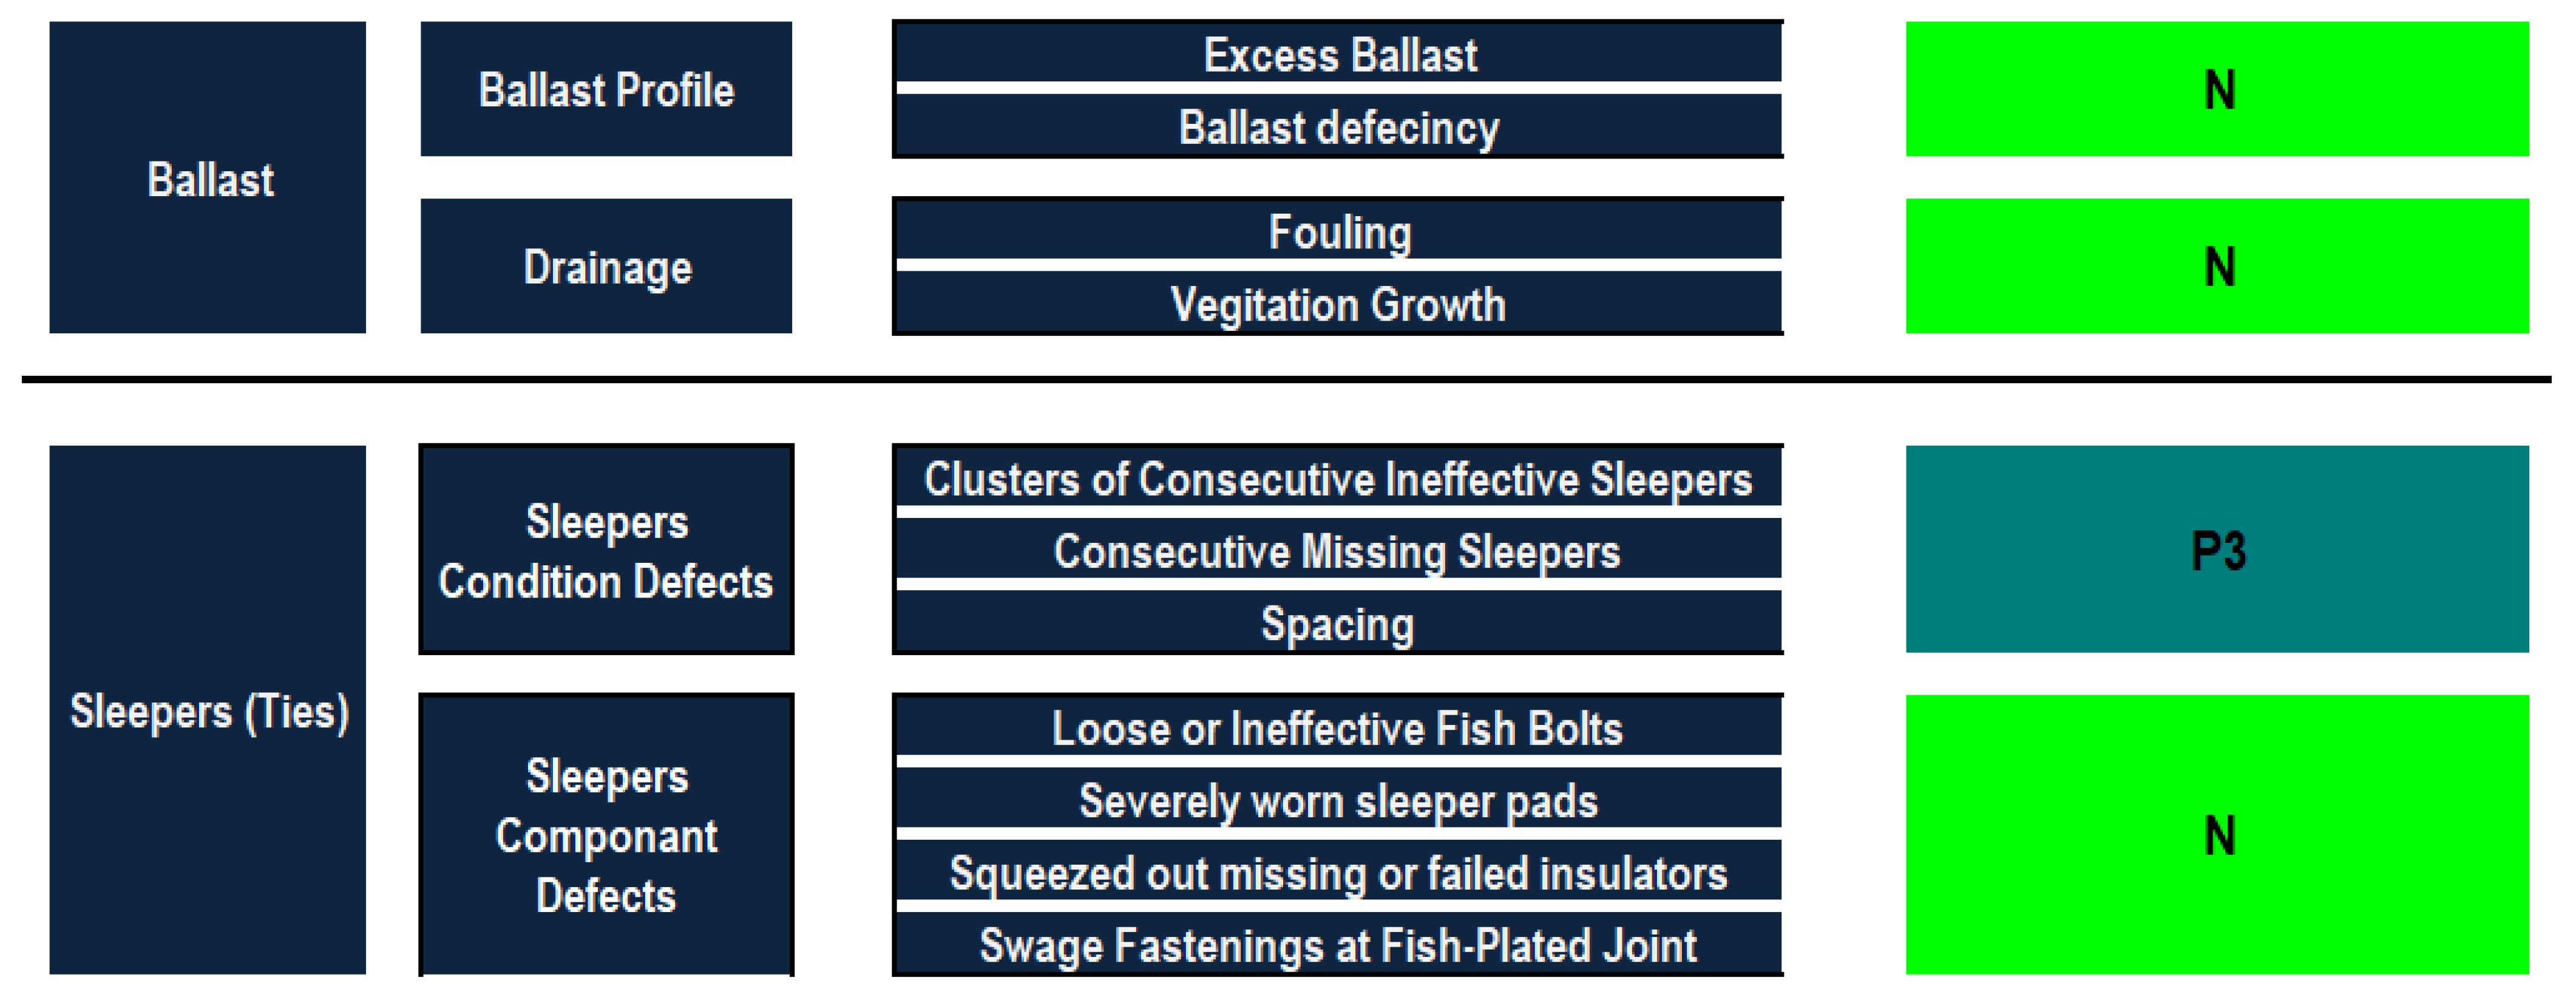
The first case is a 65 km track located in Ontario, Canada. It is a class 1 track with the operation speed of 20 km/h. The input data format is an Excel file summarizing the experts’ inspection sheets (visual inspection). These site inspection reports are used to extract the extent of severities to be used as an input to feed the developed defect-based condition assessment model. The tie rehabilitation programs are planned by the experts since the ties and ballasts are in bad condition. The data is fed into the developed model for each milepost and the conditions of the defect category, the component and the overall condition of the railway infrastructure are found. The detailed condition assessment models of rails, ballasts, sleepers, track geometry and insulated rail joints are described in Figure 5, Figure 6 and Figure 7. These figures provide a synthesis analysis for the condition of the different defects’ categories of railway components. As shown in Figure 6, rails did not experience deterioration such that the condition ratings of surface defects, rail cracks and internal defects, and rail wear are 10%, which correspond to the “Normal “condition category. With regards to ballasts (see Figure 7), drainage defects were in a more severe condition than the ballast profile defects. In this regard, the condition ratings of the drainage and ballast profile defects were 43.25% and 10%, respectively. This implies that drainage defects and the ballast profile defects lie in “Priority 3” and “Normal” condition categories.
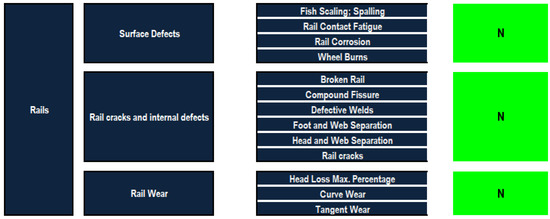
Figure 6.
Synthesized condition assessment of rails in case study 1.
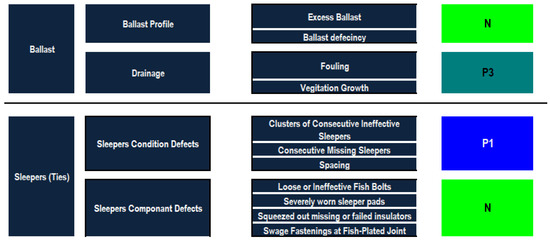
Figure 7.
Synthesized condition assessment of the ballast and sleepers in case study 1.
As shown in Figure 8, the sleepers’ condition defects were in a more deteriorated condition state than sleepers’ component defects. In this context, the performance condition ratings of the sleepers’ condition defects and the sleepers’ components defects were 69.61% and 10%, respectively. This indicated that sleepers’ condition defects and sleepers’ component defects lie in the condition categories of “Priority 1” and “Normal”, respectively. In Figure 8, it can be observed that track geometry and insulated rail joints did not experience degradation in their performance condition across the different defects, whereas their condition ratings were found to be 10%. Figure 9 depicts the obtained condition ratings for the main railway components where the overall condition is 28.47% that corresponds to Normal, indicating no need for a repair program. As the model gives a detailed condition describing the state of components and their defect categories, the analysis shows that both the ballast and the sleepers are in Priority 3 condition and require maintenance, as shown in Figure 6. In addition, it can be interpreted that the conditions of rail, geometry and insulated rail joints lie in the Normal category. Both the decision by the experts and the output of the model give the same results.

Figure 8.
Synthesized condition assessment of track geometry and insulated rail joints in case study 1.

Figure 9.
Condition assessment of railway components in case study 1.
4.2.2. Case Study 2
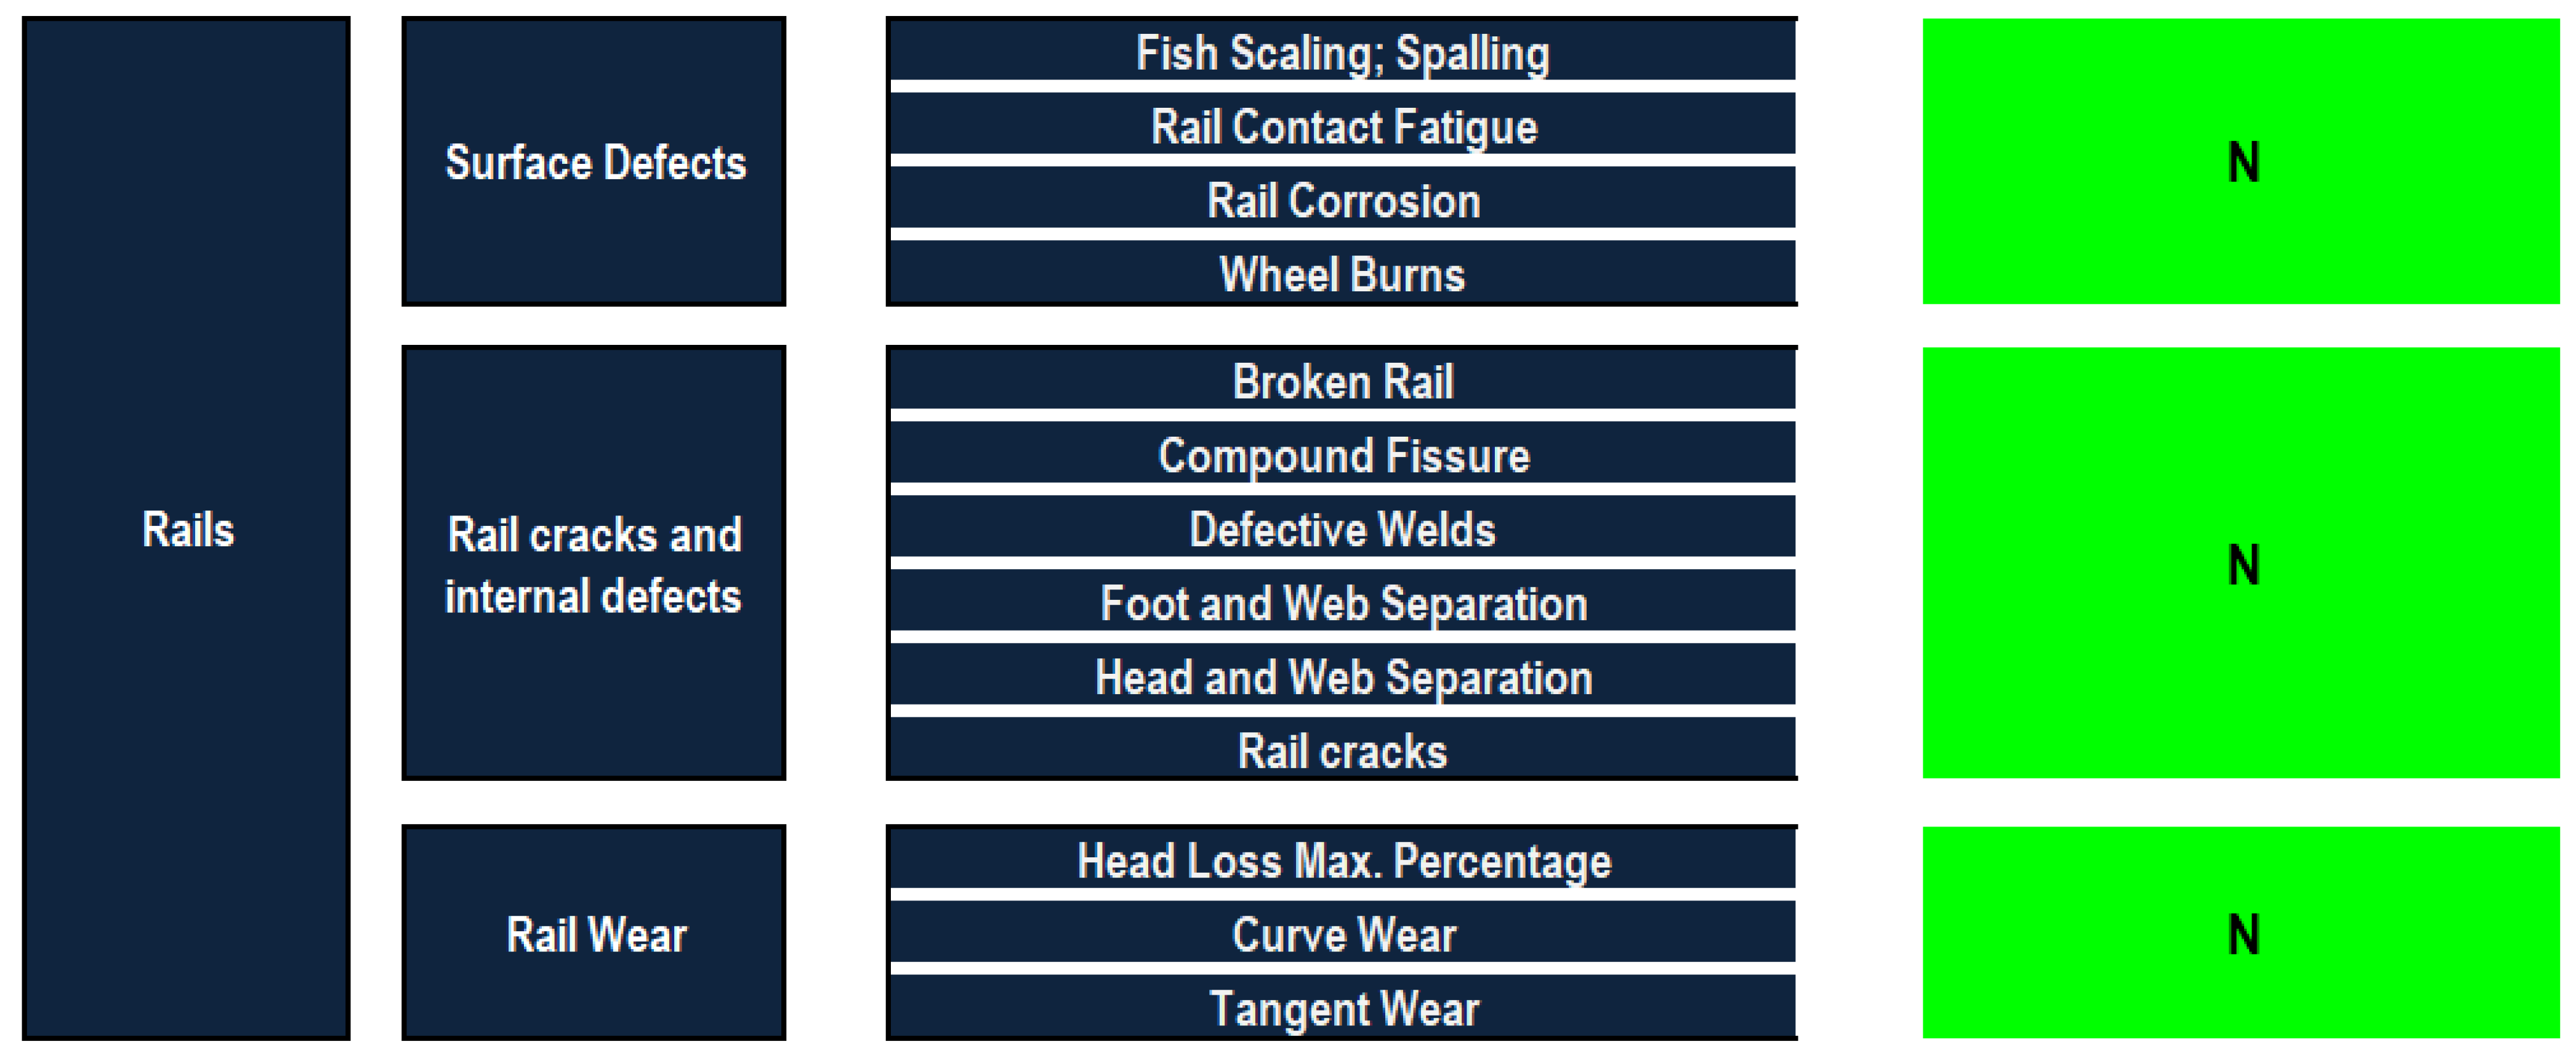
The case is a track of 25 km, located in Ontario, Canada, a class 5 track with an operation speed of 150 km/h, considered in the sixth speed category. The data format is the same as in the first case. The experts’ inspection sheets (visual inspection) are summarized. The decision provided by the experts states that no maintenance is needed because the track is in good condition. The data is imported into the developed model for each milepost and the conditions of the defect categories component and the overall condition are found. A thorough analysis of the condition status of the rails, ballasts, sleepers, track geometry and insulated rail joints can be found in Figure 10, Figure 11, Figure 12 and Figure 13. As shown in Figure 9, the conditions of the different defect categories lie in the “Normal” status, which signifies that the rails did not encounter significant deterioration. In this regard, the condition ratings of surface defects, rail cracks and internal defects and rail wear were 10%. In the ballast, the condition categories of ballast profile and drainage defects were found to be in the “Normal” state (see Figure 10).
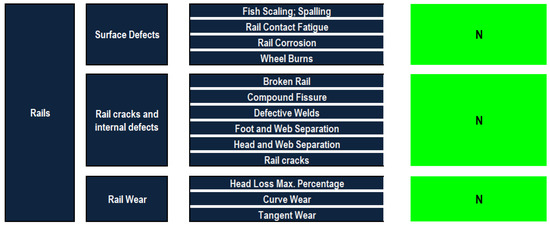
Figure 10.
Synthesized condition assessment of rails in case study 2.
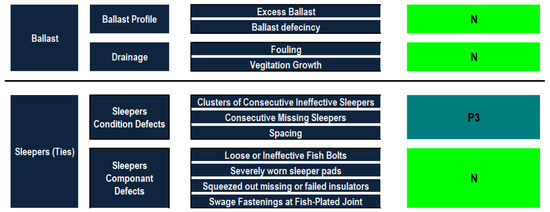
Figure 11.
Synthesized condition assessment of the ballast and sleepers in case study 2.

Figure 12.
Synthesized condition assessment of track geometry and insulated rail joints in case study 2.

Figure 13.
Condition assessment of railway components in case study 2.
As shown in Figure 11, sleepers condition defects were in a more deteriorated performance state than sleepers component defects. The condition ratings of the sleepers’ condition defects and the sleepers’ components defects were equal to 33.58% and 10%, respectively. This denoted that the sleepers’ condition defects and sleepers’ components defects lied in the condition categories of “Priority 3” and “Normal”, respectively. Figure 12 illustrated that track geometry and insulated rail joints were not subjected to any significant deterioration, whereas their condition ratings were calculated to be 10%. Figure 13 shows that the overall condition is 17.64%, which indicates the Normal category and thus no intervention actions need to be taken. The component conditions show that all the components are in a normal condition level. Both the decision and the condition give the same results.
4.2.3. Prioritization of Intervention Actions
One of the useful applications of the developed model is its use for prioritizing different railway components for maintenance based on the obtained condition indices. Table 7 presents the condition indices of railway components and the overall railway condition index for the five case studies. It is worth mentioning that more deteriorated railway components require urgent repair. The condition of ballasts (2) is the respective performance condition of the second case study and the condition of insulated rail joints (4) is the respective performance condition of the fourth case study. As shown in Table 7, the condition of the rail, ballast, geometry and insulated rail joints of the fifth case study are worse than others, thus they should be repaired first. Furthermore, it can be concluded that the condition of sleepers of the first case study is more deteriorated than other case studies thus it needs to be maintained early. It can be also observed that the rails, track geometry and insulated rail joints in the first, fourth and fifth case studies alongside ballasts in the second case study experience lower levels of deterioration. In this regard, the performance condition ratings of sleepers in the first, second, third, fourth and fifth case studies are 49.87%, 28.37%, 27.89%, 29.28% and 29.78%, respectively. It was also found that the condition ratings of ballasts in the first, second, third, fourth and fifth case studies are 31.07%, 10%, 34.51%, 35.57% and 49.16%, respectively. It can be also concluded that the overall condition of railway infrastructure may be misleading, and hence railway maintenance prioritization at both the project and network levels can serve as a better approach for sorting intervention actions.

Table 7.
Maintenance prioritization of railway components.
4.3. Sensitivity Analysis Results
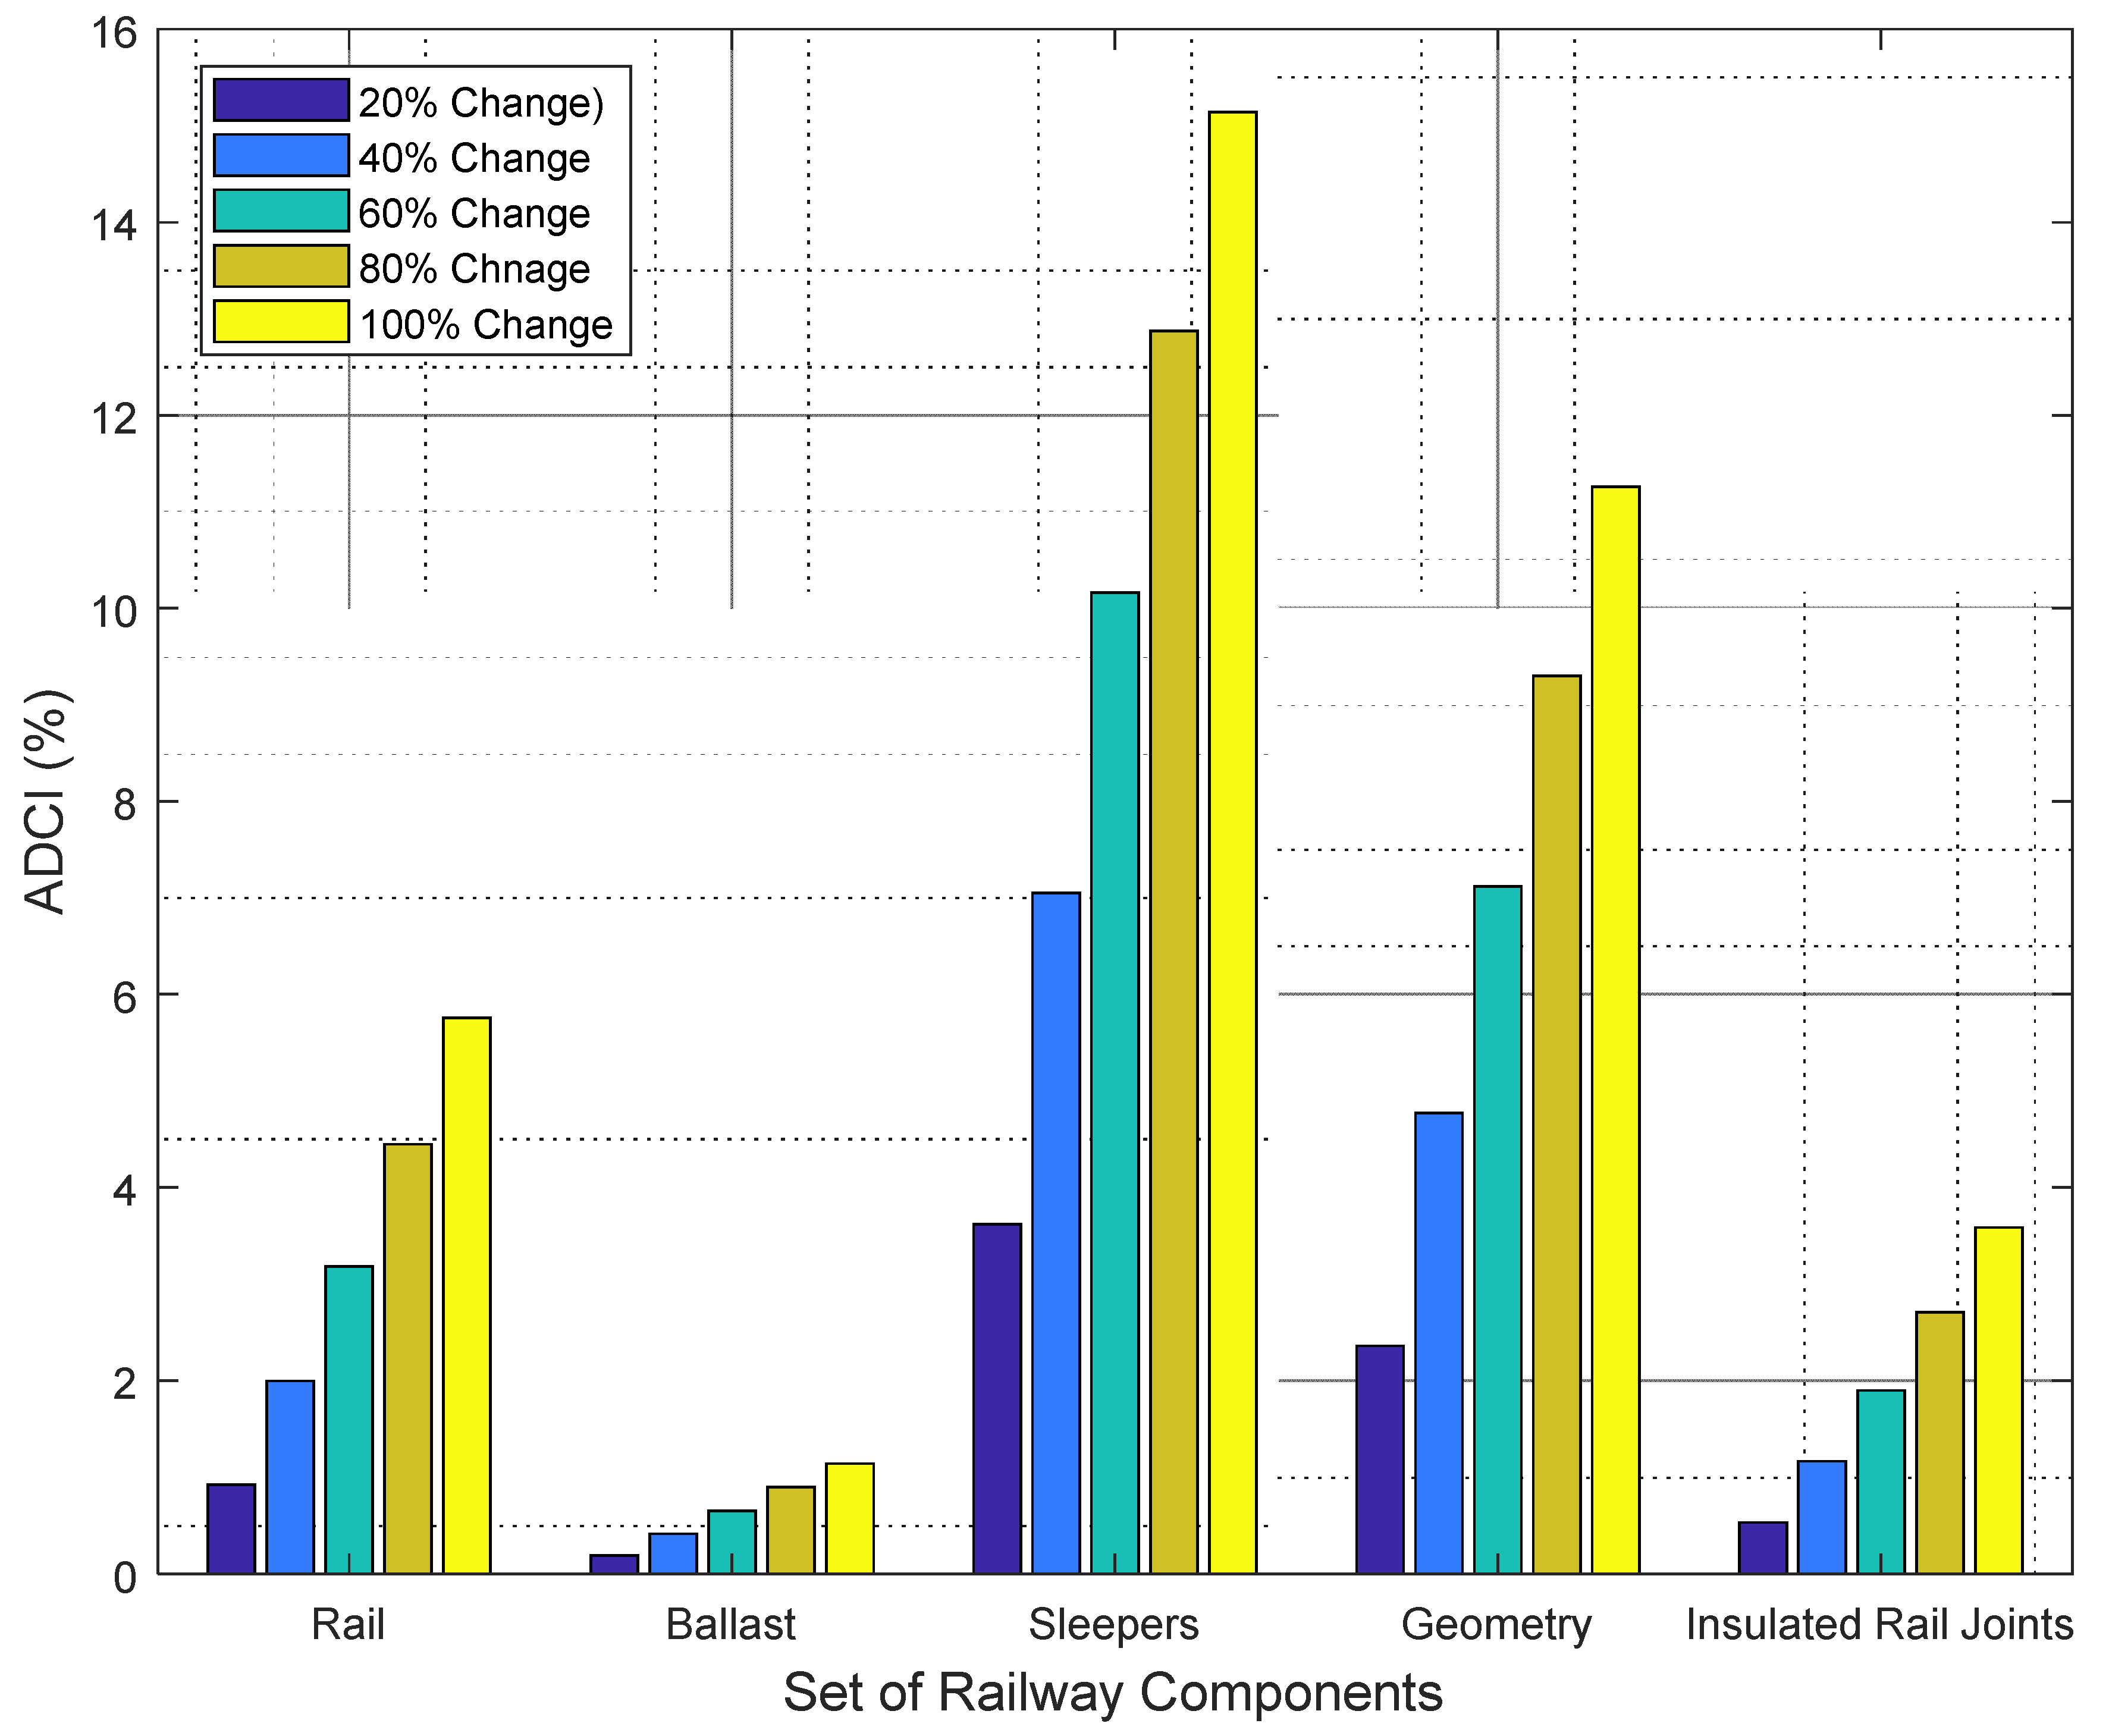
As described earlier, a sensitivity analysis is carried out to find the most significant railway components and study the robustness of the developed maintenance decision support system. The weights of defects are altered by 20%, 40%, 60%, 80% and 100%, such that the weights of the remainder of railway components and their implications are obtained using Equations (10) and (11), respectively. Figure 14 demonstrates the implications of the different weight scenarios on the overall condition of the railway infrastructure. The implications are measured in the form of absolute deviation in the condition index. For instance, a 60% change in the weight of the rails generates an of 3.18%. In addition, it can be observed that a change of 80% in the weight of the sleepers induces an of 12.87%. With regards to geometry, a 40% variation in its weight creates an of 4.77%.
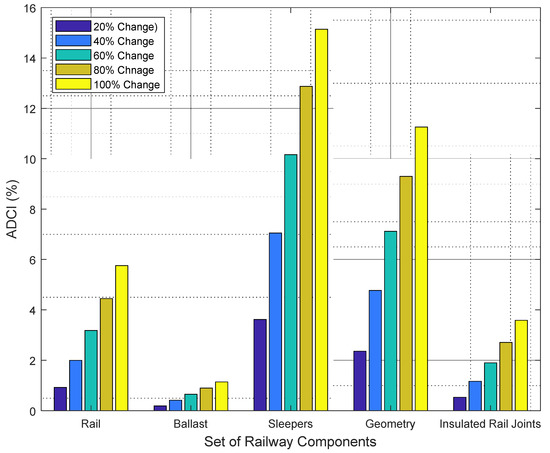
Figure 14.
Sensitivity analysis of case study 1.
Based on the five weight change scenarios in each railway component, results show that the average values of the ADCI of the rail, ballast, sleepers, geometry and insulated rail joints are 3.26%, 0.66%, 9.76%, 6.96% and 1.97%, respectively. This implies that the change in the weights of sleepers and geometry have the highest influence on the overall railway condition while the ballast has the least influence. It was also found that across the different scenarios of the rail, ballast, geometry and insulated rail joints, the overall condition of the railway remains in the Normal category. The overall condition of the railway enters the Priority 3 category in the different weight change scenarios of sleepers.
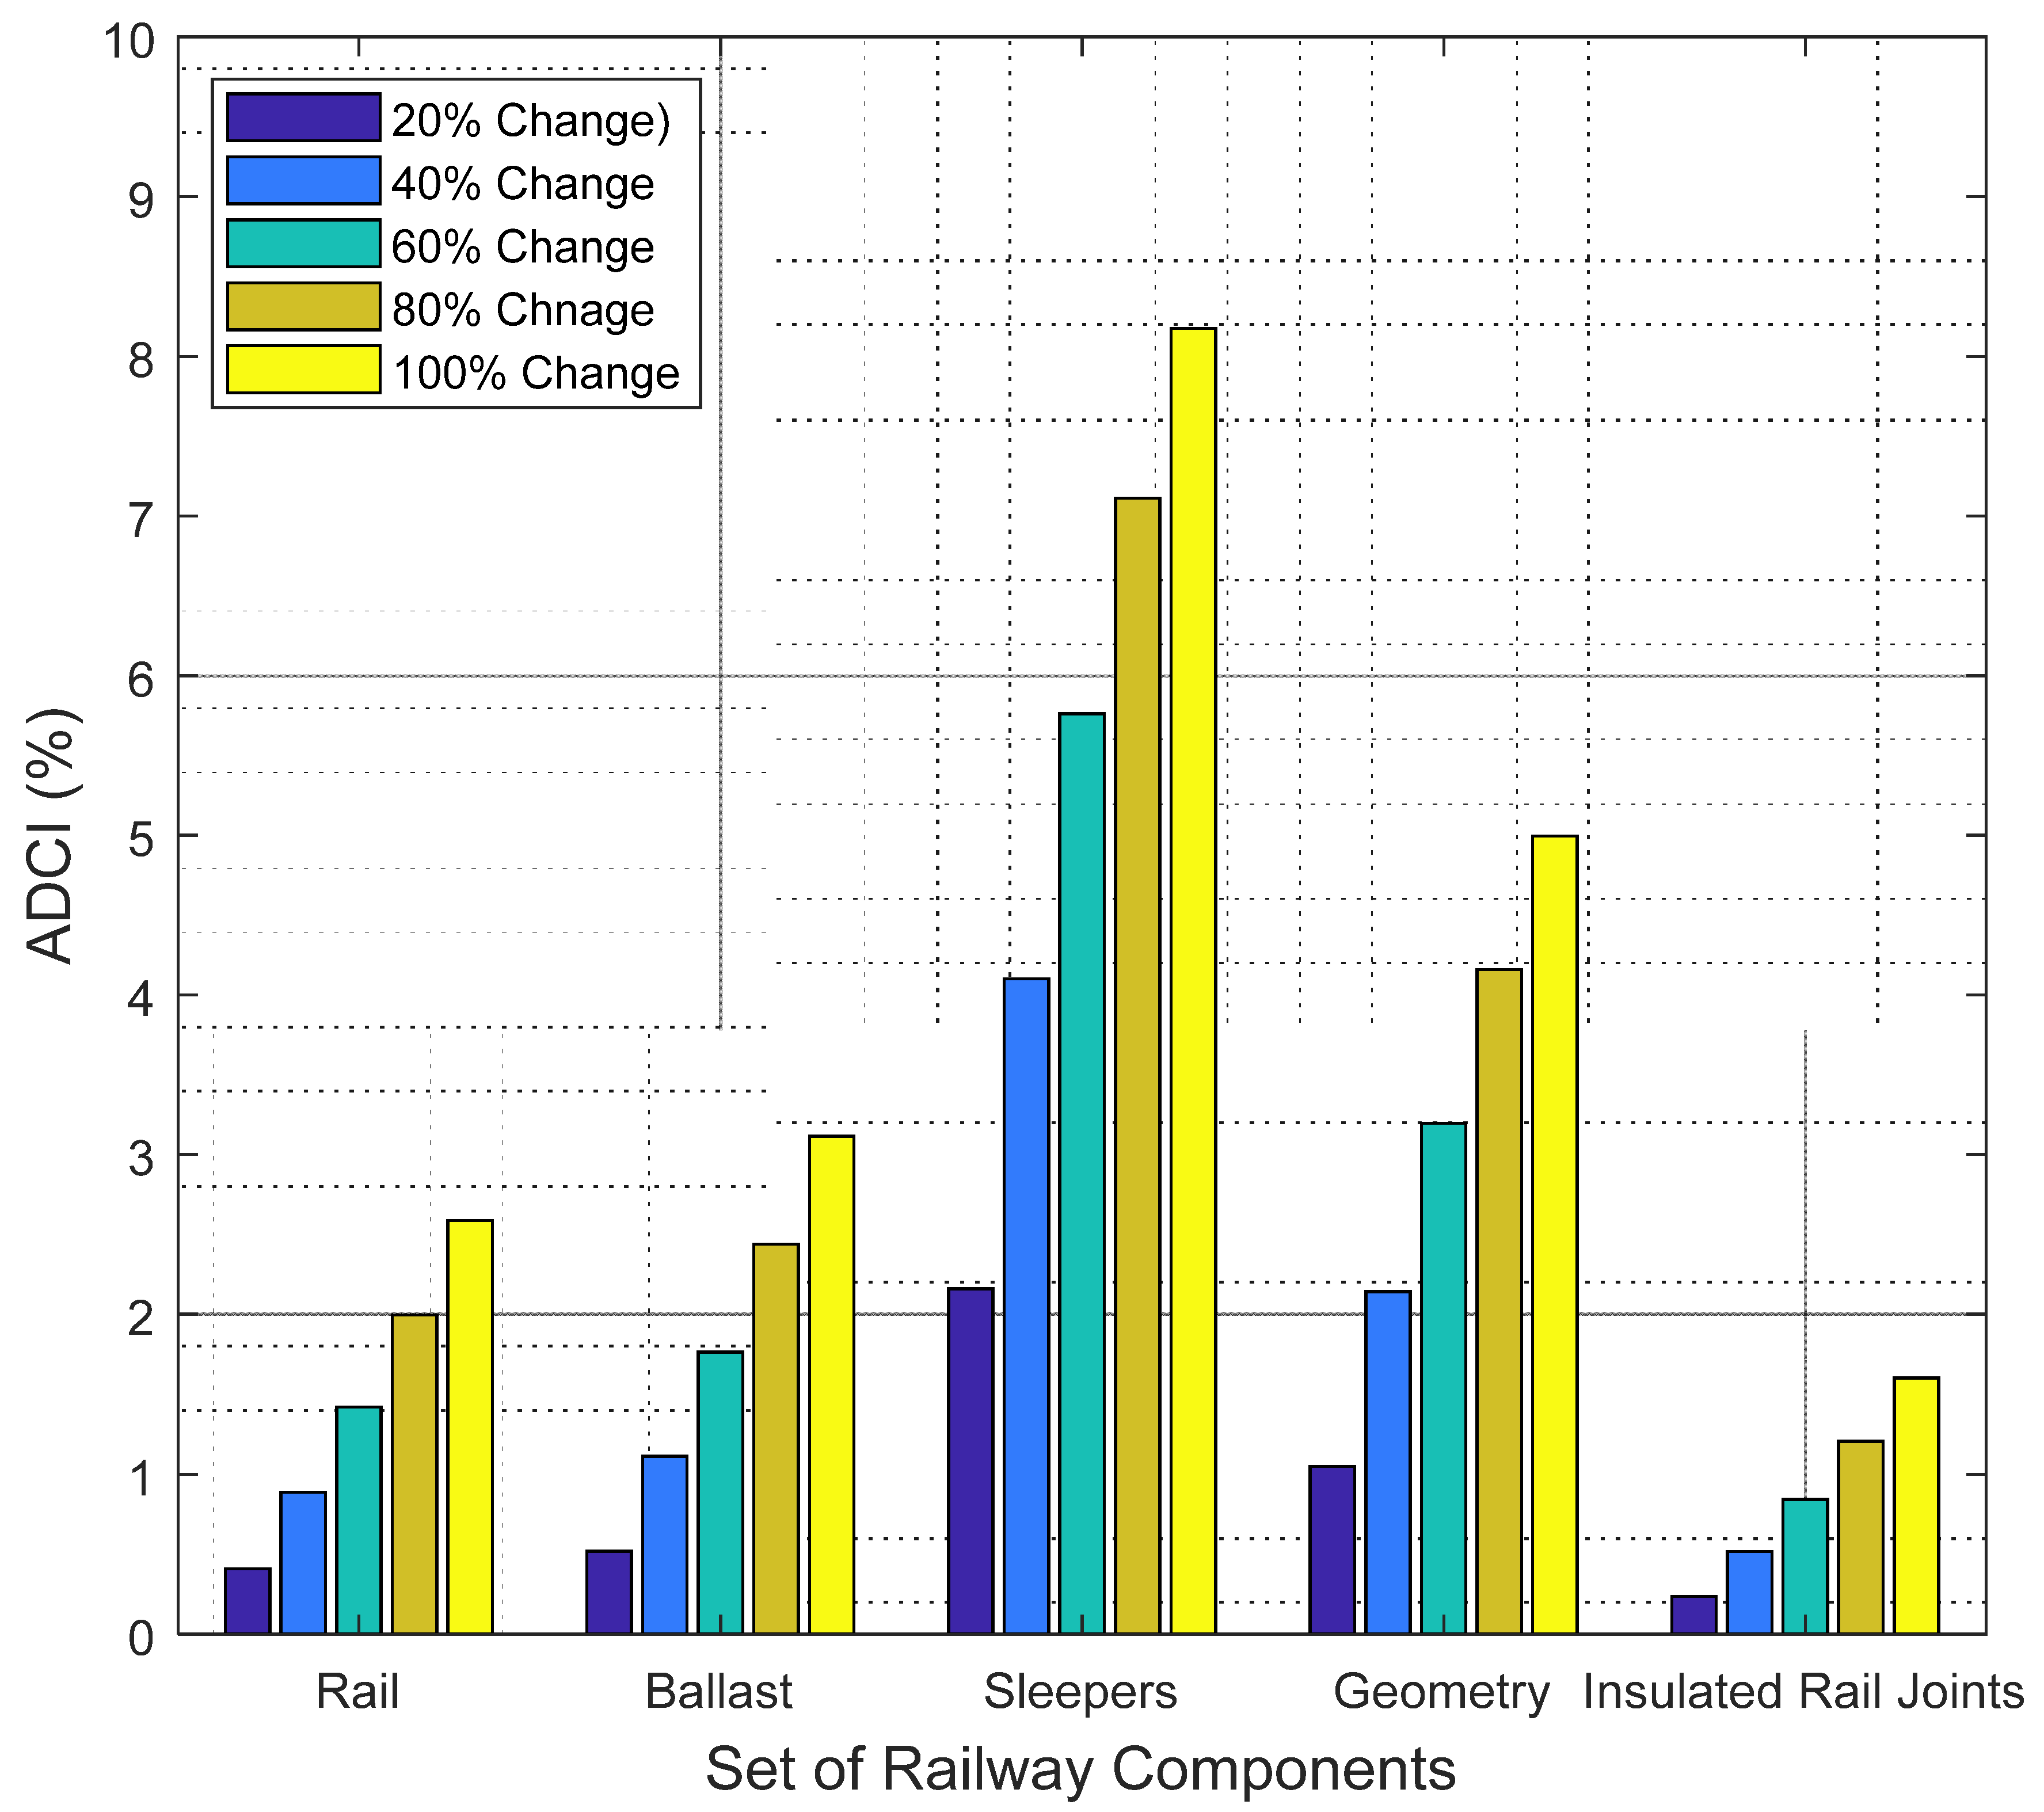
Figure 15 describes the results of the sensitivity analysis applied to the second case study. As depicted in Figure 15, a modification of 100% in the weights of sleepers generates an ADCI of 8.17%. It can be also noticed that 80% change in the importance of the weighting of geometry induces an ADCI of 4.16%. It can be also observed that 60% changes in the weights of the ballast and insulated rail joints produce ADCIs of 1.76% and 0.84%, respectively. As a result of the five weight change scenarios, the average values of the ADCI of the rail, ballast, sleepers, geometry and insulated rail joints are 1.46%, 1.77%, 5.46%, 3.11% and 0.88%, respectively. Hence, the change in the weights of sleepers has the highest effect on the overall condition followed by geometry. Ballast and rail have nearly the same influence on the overall condition while joints have a slight implication on the overall condition of railway infrastructure. It can be also concluded that the overall condition of the railway infrastructure remains in the normal category across the different weight changes of the rail, ballast, sleepers, geometry and insulated rail joints. In view of the above, it can be inferred that the developed model exhibits robust performance despite the explicit changes in the importance weights of different railway components.
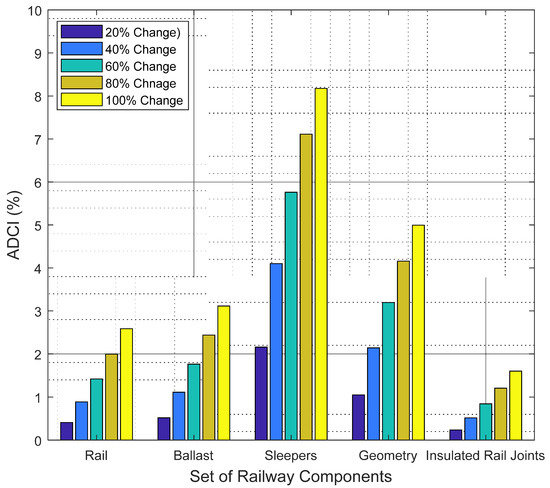
Figure 15.
Sensitivity analysis of case study 2.
In view of the above, the main contributions of the present research study lie in the following:
- Developing a fuzzy defect-based model that could reflect the actual performance condition of the different railway components.
- Establishing a condition assessment model that that covers six different speed levels of the railway system.
- Creating a maintenance prioritization model that integrates both project and network-level decisions.
- Designing an automated platform to facilitate the implementation of the developed condition assessment model by the users.
5. Conclusions
Railway infrastructure is vulnerable to severe deterioration agents such as frequent and extreme weather changes, continuous loading, high train speeds, lack of inspection and improper maintenance. Furthermore, available maintenance budgets are being trimmed. As such, this research develops a new model for railway infrastructure condition assessment, using fuzzy-based evaluation. To build this model, the infrastructure of the railway is divided into five main components: rails, sleepers (ties), ballasts, track geometry and insulated rail joints. Then, defects concerning each of the abovementioned components are categorized based on the nature of defects. Moreover, online and hard copy questionnaires are developed for experts’ opinions to define the relative importance weight of the components, defects categories and defects. Based on the fourteen collected surveys, an ANP model has been created using SuperDecisions software to find the weights. Furthermore, defect severities have been gathered through Australian manuals. Accordingly, fuzzy membership functions are developed to uniform the different defect measuring criteria and to define the linguistic severity levels with numerical values. The outputs of the fuzzy membership functions are used along with the ANP weights as input in the developed TOPSIS model to aggregate the severities and the weights and to find the condition for the defect categories, the components and the overall aggregated condition, which is translated to a condition category to be used by decision-makers for rehabilitation purposes. The developed model was validated through a group of case studies in Ontario, Canada.
Results showed that the overall condition of the railway of the first and second case studies were 28.74% and 17.64%, respectively. This implied a normal condition category and no intervention actions were needed. Furthermore, the developed condition assessment model was successfully applied for the sake of prioritizing intervention actions of railway components. The conducted the weights sensitivity analysis showed that sleepers and geometry had the highest influence on the overall condition while the weight of insulated rail joints exhibited the least influence. The sensitivity analysis also showed that the change of the component weights does not have a considerable influence on the overall condition for the case studies utilized in this research, which exemplifies the robustness of the developed condition assessment model. This model helps in minimizing the inaccuracy of railway condition assessment through the application of severity, uncertainty mitigation and robust aggregation. The developed model is able to incorporate a wide set of defects and components that covers all aspects of the railway infrastructure. It increases the safety of railway track by minimizing the human errors associated with assessing the track condition. It also benefits asset managers by providing detailed condition of railway components, defects and defect categories alongside the overall condition to be used or maintenance, rehabilitation and budget allocation purposes.
Author Contributions
L.E.-k. developed the methodology and concept. E.M.A. and aided in developing the methodology and concept. A.A.-S. analyzed the findings and the results of the models and aided in writing the article. T.Z. supervised this study. All authors have read and agreed to the published version of the manuscript.
Funding
This research received no external funding.
Institutional Review Board Statement
Not applicable.
Informed Consent Statement
Not applicable.
Data Availability Statement
The data presented in this study are available on request from the corresponding author.
Conflicts of Interest
The authors declare no conflict of interest.
Appendix A

Table A1.
Severity Levels Description [4].
Table A1.
Severity Levels Description [4].
| Severity Level | Description |
|---|---|
| Low | Distresses that do not affect train operation |
| Moderate | Distresses that may or may not cause an operating restriction on the track |
| High | Distresses that cause operating restrictions on the track and may prevent train operation |
Appendix B

Table A2.
Condition Assessment Scale [5].
Table A2.
Condition Assessment Scale [5].
| Category | Index | Condition Description |
|---|---|---|
| Excellent | 100–85 | Very few defects. Track function is not impaired. No immediate work action is required, but routine or preventive maintenance could be scheduled for completion. |
| Very Good | 70–85 | Minor deterioration. Track function is not impaired. No immediate work action is required. However, routine or preventive maintenance could be scheduled for completion. |
| Good | 55–70 | Moderate deterioration. Track function may be somewhat impaired. Routine maintenance or minor repair may be required. |
| Fair | 40–55 | Significant deterioration. Track function is impaired, but not seriously. Routine maintenance or minor repair is required. |
| Poor | 25–40 | Severe deterioration over a small percentage of the track. Less severe deterioration may be present in other portions of the track. Track function is seriously impaired. Major repair is required. |
| Very Poor | 10–25 | Critical deterioration has occurred over a large percentage or portion of the track. Less severe deterioration may be present in other portions of the track. Track is barely functional. Major repair or less than total reconstruction is required. |
| Failed | 0–10 | Extreme deterioration has occurred throughout nearly all or the entire track. Track is no longer functional. Major repair, complete restoration or total reconstruction is required. |
References
- Fontul, S.; Mínguez, R.; Solla, M.; Santos-Assunção, S. The use of geophysics for the condition assessment of rail-way infrastructure. NonDestr. Tech. Eval. Struct. Infrastruct. 2016, 11, 195–213. [Google Scholar]
- American Society of Civil Engineers. America’s Infrastructure Report Card. 2020. Available online: http://www.infrastructurereportcard.org/ (accessed on 10 May 2020).
- Herrmann, A. Raising the Grades—Sustainable Solutions to Infrastructure Challenges. In ICSI 2014: Creating Infrastructure for a Sustainable World; American Society of Civil Engineers (ASCE): Long Beach, CA, USA, 2014; pp. 79–88. [Google Scholar] [CrossRef]
- Sadeghi, J.M.; Askarinejad, H. Development of track condition assessment model based on visual inspection. Struct. Infrastruct. Eng. 2011, 7, 895–905. [Google Scholar] [CrossRef]
- Uzarski, D.R. Development of Condition Indexes for Low Volume Railroad Track; Technical Report No.FM-93/14; USACER (US Army Corps of Engineering): Washington, DC, USA, 1993. [Google Scholar]
- Madejski, J.; Grabczyk, J. Continuous geometry measurement for diagnostics of tracks and switches. In Interna-Tional Conference on Switches: Switch to Delft; Delft University of Technology: Delft, The Netherlands, 2002. [Google Scholar]
- Mundrey, J. Railway Track Engineering, 3rd ed.; McGraw-Hill Publishing: New Delhi, India, 2003. [Google Scholar]
- Anderson, M. Strategic Planning of Track Maintenance; Department of Infrastructure: Borlänge, Sweden, 2002. [Google Scholar]
- Sadeghi, J.; Askarinejad, H. Application of neural networks in evaluation of railway track quality condition. J. Mech. Sci. Technol. 2012, 26, 113–122. [Google Scholar] [CrossRef]
- Ferreira, L.; Murray, M.H. Modelling rail track deterioration and maintenance: Current practices and future needs. Transp. Rev. 1997, 17, 207–221. [Google Scholar] [CrossRef] [Green Version]
- Wang, K.; Cao, W.; Xu, L.; Yang, X.; Su, Z.; Zhang, X.; Chen, L. Diffuse ultrasonic wave-based structural health monitoring for railway turnouts. Ultrasonics 2020, 101, 106031. [Google Scholar] [CrossRef] [PubMed]
- Ni, Y.-Q.; Zhang, Q.-H. A Bayesian machine learning approach for online detection of railway wheel defects using track-side monitoring. Struct. Health Monit. 2020, 1–15. [Google Scholar] [CrossRef]
- Krummenacher, G.; Ong, C.S.; Koller, S.; Kobayashi, S.; Buhmann, J.M. Wheel Defect Detection with Machine Learning. IEEE Trans. Intell. Transp. Syst. 2017, 19, 1176–1187. [Google Scholar] [CrossRef]
- Yuan, H.; Chen, H.; Liu, S.; Lin, J.; Luo, X. A Deep Convolutional Neural Network for Detection of Rail Surface Defect. In Proceedings of the 2019 IEEE Vehicle Power and Propulsion Conference (VPPC), Hanoi, Vietnam, 14–17 October 2019; pp. 1–4. [Google Scholar]
- Lu, J.; Liang, B.; Lei, Q.; Li, X.; Liu, J.; Liu, J.; Xu, J.; Wang, W. SCueU-Net: Efficient Damage Detection Method for Railway Rail. IEEE Access 2020, 8, 125109–125120. [Google Scholar] [CrossRef]
- Yang, C.; Sun, Y.; Ladubec, C.; Liu, Y. Developing Machine Learning-Based Models for Railway Inspection. Appl. Sci. 2020, 11, 13. [Google Scholar] [CrossRef]
- Song, Y.; Wang, Z.; Liu, Z.; Wang, R. A spatial coupling model to study dynamic performance of pantograph-catenary with vehicle-track excitation. Mech. Syst. Signal Process. 2021, 151, 107336. [Google Scholar] [CrossRef]
- Gao, S.; Liu, Z.G.; Yu, L. Detection and monitoring system of the pantograph-catenary in high-speed railway (6C). In Proceedings of the 2017 7th International Conference on Power Electronics Systems and Applications—Smart Mobility, Power Transfer & Security (PESA), Hong Kong, China, 12–14 December 2017; pp. 1–7. [Google Scholar]
- Kim, H.; Ham, Y. Increasing Reliability of Participatory Sensing for Utility Pole Condition Assessment Using Fuzzy Inference. J. Constr. Eng. Manag. 2021, 147, 04020154. [Google Scholar] [CrossRef]
- Caradot, N.; Riechel, M.; Rouault, P.; Caradot, A.; Lengemann, N.; Eckert, E.; Ringe, A.; Clemens, F.; Cherqui, F. The influence of condition assessment uncertainties on sewer deterioration modelling. Struct. Infrastruct. Eng. 2020, 16, 287–296. [Google Scholar] [CrossRef]
- Kabir, G.; Sadiq, R.; Tesfamariam, S. A review of multi-criteria decision-making methods for infrastructure management. Struct. Infrastruct. Eng. 2014, 10, 1176–1210. [Google Scholar] [CrossRef]
- AREMA (American Railway Engineering and Maintenance-of-Way Association). American railway engineering and maintenance-of-way association. Man. Railw. Eng. 2013, 2, 55–57. [Google Scholar]
- RailCorp, T.M.C. 226: Rail Defects Handbook; RailCorp Engineering Manual: Sydney, Australia, 2012.
- Zakeri, J.-A.; Rezvani, F.H. Failures of railway concrete sleepers during service life. Int. J. Constr. Eng. Manag. 2012, 1, 1–5. [Google Scholar]
- Wilson, A. TMC 203 Track Inspection Version 5.3; RailCorp Engineering: Sydney, Australia, 2013. [Google Scholar]
- Wilson, A. TMC 224 Rail Defects and Testing Version 4.5; RailCorp Engineering: Sydney, Australia, 2011. [Google Scholar]
- Kumar, S. A Study of the Rail Degradation Process to Predict Rail Breaks; Luleå Tekniska Universitet, Division of Operation and Maintenance Engineering: Luleå, Sweden, 2006. [Google Scholar]
- Esveld, C. Modern Railway Track, 2nd ed.; MRT-productions Zaltbommel: Delft, The Netherlands, 2001. [Google Scholar]
- Jasiulewicz-Kaczmarek, M.; Stachowiak, A. Maintenance Process Strategic Analysis. IOP Conf. Ser. Mater. Sci. Eng. 2016, 145, 022025. [Google Scholar] [CrossRef] [Green Version]
- Büyükyazıcı, M.; Sucu, M. The analytic hierarchy and analytic network processes. Hacet. J. Math. Stat. 2003, 32, 65–73. [Google Scholar]
- Saaty, T.L. How to make a decision: The analytic hierarchy process. Int. Ser. Oper. Res. Manag. Sci. 1990, 48, 9–26. [Google Scholar] [CrossRef]
- Gheshlaghi, A.H. Using GIS to Develop a Model for Forest Fire Risk Mapping. J. Indian Soc. Remote Sens. 2019, 47, 1173–1185. [Google Scholar] [CrossRef]
- Așchilean, I.; Giurca, I. Choosing a Water Distribution Pipe Rehabilitation Solution Using the Analytical Network Process Method. Water 2018, 10, 484. [Google Scholar] [CrossRef] [Green Version]
- Budayan, C.; Dikmen, I.; Talat Birgonul, M.; Ghaziani, A.A. Computerized Method for Delay Risk Assessment Based on Fuzzy Set Theory using MS ProjectTM. KSCE J. Civ. Eng. 2018, 22, 2714–2725. [Google Scholar] [CrossRef]
- Issa, U.H.; Miky, Y.; Abdel-Malak, F.F. A Decision Support Model for Civil Engineering Projects based on Multi-Criteria and Various Data. J. Civ. Eng. Manag. 2019, 25, 100–113. [Google Scholar] [CrossRef]
- Leśniak, A.; Kubek, D.; Plebankiewicz, E.; Zima, K.; Belniak, S. Fuzzy AHP Application for Supporting Contractors’ Bidding Decision. Symmetry 2018, 10, 642. [Google Scholar] [CrossRef] [Green Version]
- Mohandes, S.R.; Sadeghi, H.; Mahdiyar, A.; Durdyev, S.; Banaitis, A.; Yahya, K.; Ismail, S. Assessing construction labours’ safety level: A fuzzy mcdm approach. J. Civ. Eng. Manag. 2020, 26, 175–188. [Google Scholar] [CrossRef] [Green Version]
- Zhao, X.; Hwang, B.-G.; Low, S.P. Developing Fuzzy Enterprise Risk Management Maturity Model for Construction Firms. J. Constr. Eng. Manag. 2013, 139, 1179–1189. [Google Scholar] [CrossRef]
- Viana, V.L.B.; Carvalho, M.T.M. Prioritization of risks related to BIM implementation in brazilian public agencies using fuzzy logic. J. Build. Eng. 2021, 36, 102104. [Google Scholar] [CrossRef]
- Zadeh, L.A. Fuzzy sets. In Fuzzy Sets, Fuzzy Logic, and Fuzzy Systems: Selected Papers by Lotfi A Zadeh; World Scientific: New York, NY, USA, 1996; pp. 394–432. [Google Scholar] [CrossRef]
- Yazdani, M.; Sobhani, B.; Zengir, V.S.; Gilandeh, A.G. Analysis, monitoring and simulation of dust hazard phenomenon in the northern Persian Gulf, Iran, Middle East. Arab. J. Geosci. 2020, 13, 1–13. [Google Scholar] [CrossRef]
- Jena, R.; Pradhan, B. Integrated ANN-cross-validation and AHP-TOPSIS model to improve earthquake risk assessment. Int. J. Disaster Risk Reduct. 2020, 50, 101723. [Google Scholar] [CrossRef]
Publisher’s Note: MDPI stays neutral with regard to jurisdictional claims in published maps and institutional affiliations. |
© 2021 by the authors. Licensee MDPI, Basel, Switzerland. This article is an open access article distributed under the terms and conditions of the Creative Commons Attribution (CC BY) license (https://creativecommons.org/licenses/by/4.0/).

