Article

Critical Leaf Water Content for Maize Photosynthesis under Drought Stress and Its Response to Rewatering

1
College of Applied Meteorology, Nanjing University of Information Science & Technology, Nanjing 210044, China
2
Gucheng Agro-Meteorological Field Scientific Experiment Base, Chinese Academy of Meteorological Sciences, Beijing 100081, China
3
Collaborative Innovation Center on Forecast Meteorological Disaster Warning and Assessment, Nanjing University of Information Science & Technology, Nanjing 210044, China
4
Joint Eco-Meteorological Laboratory of Chinese Academy of Meteorological Sciences and Zhengzhou University, Zhengzhou 450001, China
5
College of Resources and Environmental Sciences, China Agricultural University, Beijing 100193, China
*
Authors to whom correspondence should be addressed.
Sustainability 2021, 13(13), 7218; https://doi.org/10.3390/su13137218
Submission received: 8 June 2021 / Revised: 23 June 2021 / Accepted: 23 June 2021 / Published: 28 June 2021

Abstract

:
Crop photosynthesis is closely related to leaf water content (LWC), and clarifying the LWC conditions at critical points in crop photosynthesis has great theoretical and practical value for accurately monitoring drought and providing early drought warnings. This experiment was conducted to study the response of LWC to drought and rewatering and to determine the LWC at which maize photosynthesis reaches a maximum and minimum and thus changes from a state of stomatal limitation (SL) to non-stomatal limitation (NSL). The effects of rehydration were different after different levels of drought stress intensity at different growth stages, and the maize LWC recovered after rewatering following different drought stresses at the jointing stage; however, the maize LWC recovered more slowly after rewatering following 43 days and 36 days of drought stress at the tasselling and silking stages, respectively. The LWC when maize photosynthesis changed from SL to NSL was 75.4% ± 0.38%, implying that the maize became rehydrated under physiologically impaired conditions. The LWCs at which the maize Vcmax25 reached maximum values and zero differed between the drought and rewatering periods. After exposure to drought stress, the maize exhibited enhanced drought stress tolerance, an obviously reduced suitable water range, and significantly weakened photosynthetic capacity. These results provide profound insight into the turning points in maize photosynthesis and their responses to drought and rewatering. They may also help to improve crop water management, which will be useful in coping with the increased frequency of drought and extreme weather events expected under global climate change.

1. Introduction

Drought stress is considered to be one of the major environmental factors limiting crop productivity worldwide [1,2]. The occurrence of global drought disasters is gradually becoming the norm, and the frequency and intensity of extreme drought events show increasing trends under climate change. In addition, drought disasters are becoming stronger and more destructive, which further threatens the security of future food production [3,4,5]. China is one of the regions of the world that is most seriously affected by drought. Drought-disaster-affected areas and losses account for a large proportion of the total areal extent of and losses caused by all kinds of natural disasters. The area affected by drought disasters accounts for 56.2% of the global area affected by all meteorological disasters [6,7].
Maize is an important food crop worldwide, and the total yield of maize makes up the highest proportion of the total yield of all major food crops [8,9,10]. Northeast China is part of the renowned northeastern maize production belt, and the annual yield of maize from this area accounts for 33.8% of the total maize yield in China [11]. With global warming, the increase in extreme rainfall and the uneven distribution of precipitation have often led to frequent drought [12]; accordingly, drought has become the most important factor limiting maize production in the area. Photosynthesis is a vital process by which plants accumulate organic matter with light energy, and it is also the process in plants that is most sensitive to drought stress [13]. Water stress is considered to be the critical abiotic factor affecting plant photosynthesis [14], and can cause damage to plant photosynthetic organs, thereby inhibiting photosynthesis. In maize, drought can reduce stomatal conductance, limit photosynthesis, and ultimately lead to a reduction in yield [15,16]; the annual maize yield reduction caused by drought is approximately 25–30% [17].
In general, stomatal limitation (SL) is the main factor that causes decreased photosynthesis under mild and moderate drought stress. Under severe drought stress, crop photosynthetic organs are destroyed, and non-stomatal limitation (NSL) reduces the crop photosynthetic capacity. The change in crop photosynthesis from being affected by SL to NSL is an important turning point for a crop from mild and moderate drought stress to severe drought stress, and this transition is of great importance in drought disaster identification [18,19]. Carboxylation is an important process in plant photosynthesis, and plays a decisive role in determining the rate of photosynthesis. The maximum carboxylation rate normalized to 25 °C (Vcmax25) of plants is an important parameter for characterizing plant photosynthetic capacity [20]. Timely and reasonable rewatering can alleviate the adverse effects of drought on crops, restore their photosynthetic capacity, and ultimately improve the utilization efficiency of water resources [21]. In a study by Song et al., plant photosynthetic processes at both the vegetative and reproductive periods were severely reduced, particularly at the late development period and with longer drought stress duration, and the strength of recovery was proportional to the persistence of pre-drought episodes [10]. Besides, drought intensity, drought duration, and the growth stages during which drought occurs are the main factors determining whether the plant photosynthetic capacity will recover to its original level after rewatering under drought stress [22,23].
Accurately identifying the critical point of drought stress for crop photosynthesis is conducive to formulating reasonable irrigation and drought resistance measures. However, there are few indicators that are easy to obtain and monitor to guide scientific and reasonable crop water management to address the adverse effects of drought stress [24,25,26,27]. Leaves are the most important organ for plant photosynthesis, and they are the most sensitive plant organs to drought stress. The leaf water content (LWC) represents the actual growth and development state of a crop, and is the optimal indicator of the water retention capacity of the crop [28,29,30]. Changes in LWC can reflect the crop drought degree to a certain extent, and LWC is easy to observe. Therefore, the LWC is irreplaceable in crop drought identification and remote sensing drought monitoring [31,32]. In our previous study, the first fully expanded leaf was sensitive to water stress, and its water content was obtained when the status of maize photosynthesis changed from SL to NSL [30]. As the drought period continued further, SL was no longer the main factor reducing maize photosynthesis, and NSL damaged photosynthetic organs and decreased the photosynthetic capacity of maize. In this study, we focused on exploring the LWC at critical points for maize photosynthesis during periods of drought and its response to rewatering. The aims were to (1) explore the response of the maize Vcmax25 to periods of drought and rewatering; (2) determine the LWC at which maize photosynthesis changed from SL to NSL; and (3) determine the LWC when the maize Vcmax25 reached its maximum and reached zero. Our hypotheses are as follows: (1) the recovery degree of the maize Vcmax25 after rewatering is different following droughts of different durations that occur at different growth stages; (2) the same relationship exists between the Vcmax25 and the LWC during the drought and rewatering periods; and (3) the LWCs at which the Vcmax25 reach a maximum and zero during the drought and rewatering periods are different. We expect that this study will provide a better understanding of the relationship between critical points in maize photosynthesis and the LWC. We also believe that the findings may provide a reference for crop drought identification and classification, and for developing scientific and reasonable crop water management practices.

2. Materials and Methods

2.1. Climate and Soil Characteristics

The experiment was carried out at Jinzhou Ecology and Agricultural Meteorology Center (41°09’N, 121°12’E and an altitude of 27.4 m asl), Liaoning Province, China. The center is located within the renowned northeastern maize production belt. This region is located in northeastern Eurasia and has a warm-temperate semi-humid monsoon climate. The average annual mean air temperature over the past 30 years was 9.9 °C, with extreme maximum and minimum temperatures of 41.8 °C and −31.3 °C, respectively. The annual precipitation is 568 mm, approximately 60–70% of which occurs in summer. The annual frost-free period is 144–180 days. The soil at the experimental site is a typical brown soil with a pH value of 6.3. The bulk density, field capacity, and wilting coefficient are 1.62 g cm−3, 22.3%, and 6.5% at 0–100 cm, respectively. The soil organic carbon, total nitrogen, phosphorus, and potassium contents are 10.44 g kg−1, 0.69 g kg−1, 0.50 g kg−1, and 22.62 g kg−1, respectively. Maize is the staple food crop in this region.

2.2. Experimental Design

The maize cultivar used in this experiment was Danyu 405, which is commonly planted across Northeast China. The experimental plots were arranged randomly, with three replicates per treatment. Five treatments were established in this experiment: D1, control; D2, water withholding during the jointing to tasselling stages (27 days, 37–64 days after sowing (DAS)); D3, the jointing to anthesis stages (41 days, 37–78 DAS); D4, the tasselling to milking stages (41 days, 51–92 DAS); and D5, the silking to milking stages (34 days, 58–92 DAS). In this setup, each treatment received 261, 188, 138, 136, or 161 mm of irrigation, respectively, over the entire period of plant development. The irrigation regimes are shown in Table 1. Before the treatments began, the soil moisture was measured in each plot, and irrigation was applied to bring the soil moisture in each plot to the same level and to ensure normal maize growth. Suitable soil water conditions were maintained in the control plot throughout the growth period.

2.3. Field Management

A large, electrically powered waterproof shelter was used to keep natural precipitation from falling on the plants. Each plot was 15 m2 in area (5 m × 3 m), and the plots were surrounded by cement walls extending 0.1 m above the soil surface and 1.9 m below the soil surface in order to prevent water from flowing between the plots. Maize was sown on 23 May 2016, and harvested on 28 September 2016. The plant density was 5.3 plants m−2, which was consistent with local field management practices, and a total of 600 kg ha−1 of a conventional compound fertilizer containing 28%, 11%, and 12% of N, P2O5, and K2O, respectively, was applied before sowing. The agronomic management practices applied during the year of the experiment were consistent with local practices.

2.4. Sampling and Measurements

2.4.1. Leaf Gas Exchange

We measured the leaf gas exchange parameters in situ using a portable photosynthesis measurement system (Li-6400; LI-COR Inc., Lincoln, NE, USA) between 9:00 a.m. and 11:00 a.m. on clear days. Three replicates were measured in each plot at intervals of 7–10 days, and the measurements were added during the critical maize growth stages. The first fully expanded leaf on three healthy and uniform maize plants was selected to determine the leaf photosynthetic parameters. The measurements were taken at the middle upper part of the leaf, avoiding the central leaf vein. The photosynthetically active radiation (PAR) in the leaf chamber was set to 1500 μmol m−2 s−1, which is the light saturation point of maize. During the measurement periods, the temperature, relative humidity, and CO2 concentration inside the leaf chamber were consistent with those of the ambient air, and the flow rate was set to 500 μmol s−1. The SL value (Ls) was calculated with the following equation:
L s = 1 C i C a
where Ci is the intercellular CO2 concentration and Ca is the ambient CO2 concentration.

2.4.2. Leaf Water Content

The LWC was assessed on the same leaves used for the gas exchange measurements. The leaves were detached from the plants, weighed, placed into a paper bag, placed into an oven for deactivation at 105 °C for 1 h, dried to constant weight at 80 °C, and weighed to determine their dry weight. The LWC was calculated with the following equation:
Leaf   water   content   ( LWC ) = leaf   fresh   weight leaf   dry   weight leaf   fresh   weight × 100

2.4.3. Maximum Carboxylation Rate at 25 °C (Vcmax25)

Farquhar et al. [33] proposed a photosynthetic biochemical mechanism model for C3 plants, and Von Caemmerer [34] applied that model to C4 plants. In these models, the leaf photosynthetic rate (An, µmol m−2 s−1) is considered to be limited mainly by Rubisco enzyme activity, expressed as:
A n = V cmax   C C + k c ( 1 + O / k 0 )   ( 1 γ * O C ) R d
Massad et al. [35] applied the C4 plant photosynthesis model to maize and noted that at or near the light saturation point, the level of photosynthetic activity at the Rubisco enzyme activity limit was more sensitive to the temperature in C4 plants than in C3 plants, and that photosynthetic activity in C4 plants was more sensitive to Vcmax but less sensitive to the Michaelis–Menten constants for CO2 (Kc) and O2 (Ko). Therefore, the reduction in enzyme activity at high temperature was taken into consideration by applying the Arrhenius equation, and the temperature correction function for Vcmax was applied as follows:
f   ( T k ) = exp [ E a   ( T k 298 ) ( 298 RT k ) ] 1 + exp ( 298 Δ S H d 298 R ) 1 + exp ( T k Δ S H d T k R )
which can obtain:
A n   = [ C C + K c ( 1 + O K 0 )   ( 1 γ * O C ) 0.01 ] V cmax 25 exp [ E a ( T k 298 ) ( 298 RT k ) ] 1 + exp ( 298 Δ S H d 298 R ) 1 + exp ( T k Δ S H d T k R )
The values and meanings of the parameters in Equations (3)–(5) are shown in Table 2 [35,36]. The Li-6400 fluorescent leaf chamber was used to observe the physiological photosynthetic parameters of the leaves. The light intensity was set at 1500 µmol m−2 s−1, and the temperature, humidity, and CO2 concentration were all consistent with the ambient environmental conditions. Maize is a C4 plant. Under saturating light, temperature is an important environmental factor affecting leaf physiological parameters. The temperature value in the leaf chamber was adjusted to obtain the Vcmax25 according to Equation (5).

2.5. Statistical Analyses

SPSS v.21.0 statistical software (SPSS Inc., Chicago, IL, USA) was used to perform the statistical analysis. One-way ANOVA with Duncan’s multiple comparison test was used to test the significance of the differences in the LWC and Vcmax25 between treatments at the 0.05 significance level. Data fitting and figure generation were performed in Origin Pro 2016 (Origin Lab, IL, USA). The relationships between LWC and Vcmax25 were determined using polynomial regression analyses.

3. Results

3.1. Response of Maize Leaf Water Content to Drought and Rewatering

As shown in Figure 1, the maize LWC showed a decreasing trend as the growth period progressed. The LWC of D2 was lower than that of the control treatment (D1) during the water-withholding period. The drought period led to a decline in LWC in D2 to a minimum of 75.7%. Significant differences in LWC were not found between the D1 and D2 treatments (p < 0.05, Table 3). The LWCs of the D1 and D2 treatments after rewatering were 76.7% and 76.4%, respectively, and there was no significant difference in this value between the treatments. The LWC of D2 was slightly higher than that of D1 8 days after rewatering, indicating that the LWC of the D2 treatment recovered to its original level after a 27-day drought period in the jointing-tasselling stages. The response of LWC to drought and rewatering in the D3 treatment was similar to that in the D2 treatment. The LWC for the D3 treatment marked a decreasing trend, and reached its lowest level of 72.1% during the drought period, which was significantly lower than that in the D1 treatment (76.7%). After rewatering, the LWC values were 72.5% and 73.9% in the D1 and D3 treatments, respectively, and significant differences could not found between the D1 and D3 treatments (p < 0.05, Table 3), indicating that the LWC of the D3 treatment recovered after rewatering. The LWC in the D4 and D5 treatments always markedly decreased, even though it remained a low and stable level after rewatering, and the rewatering had no obvious effect on the LWC of D4 and D5 treatments.

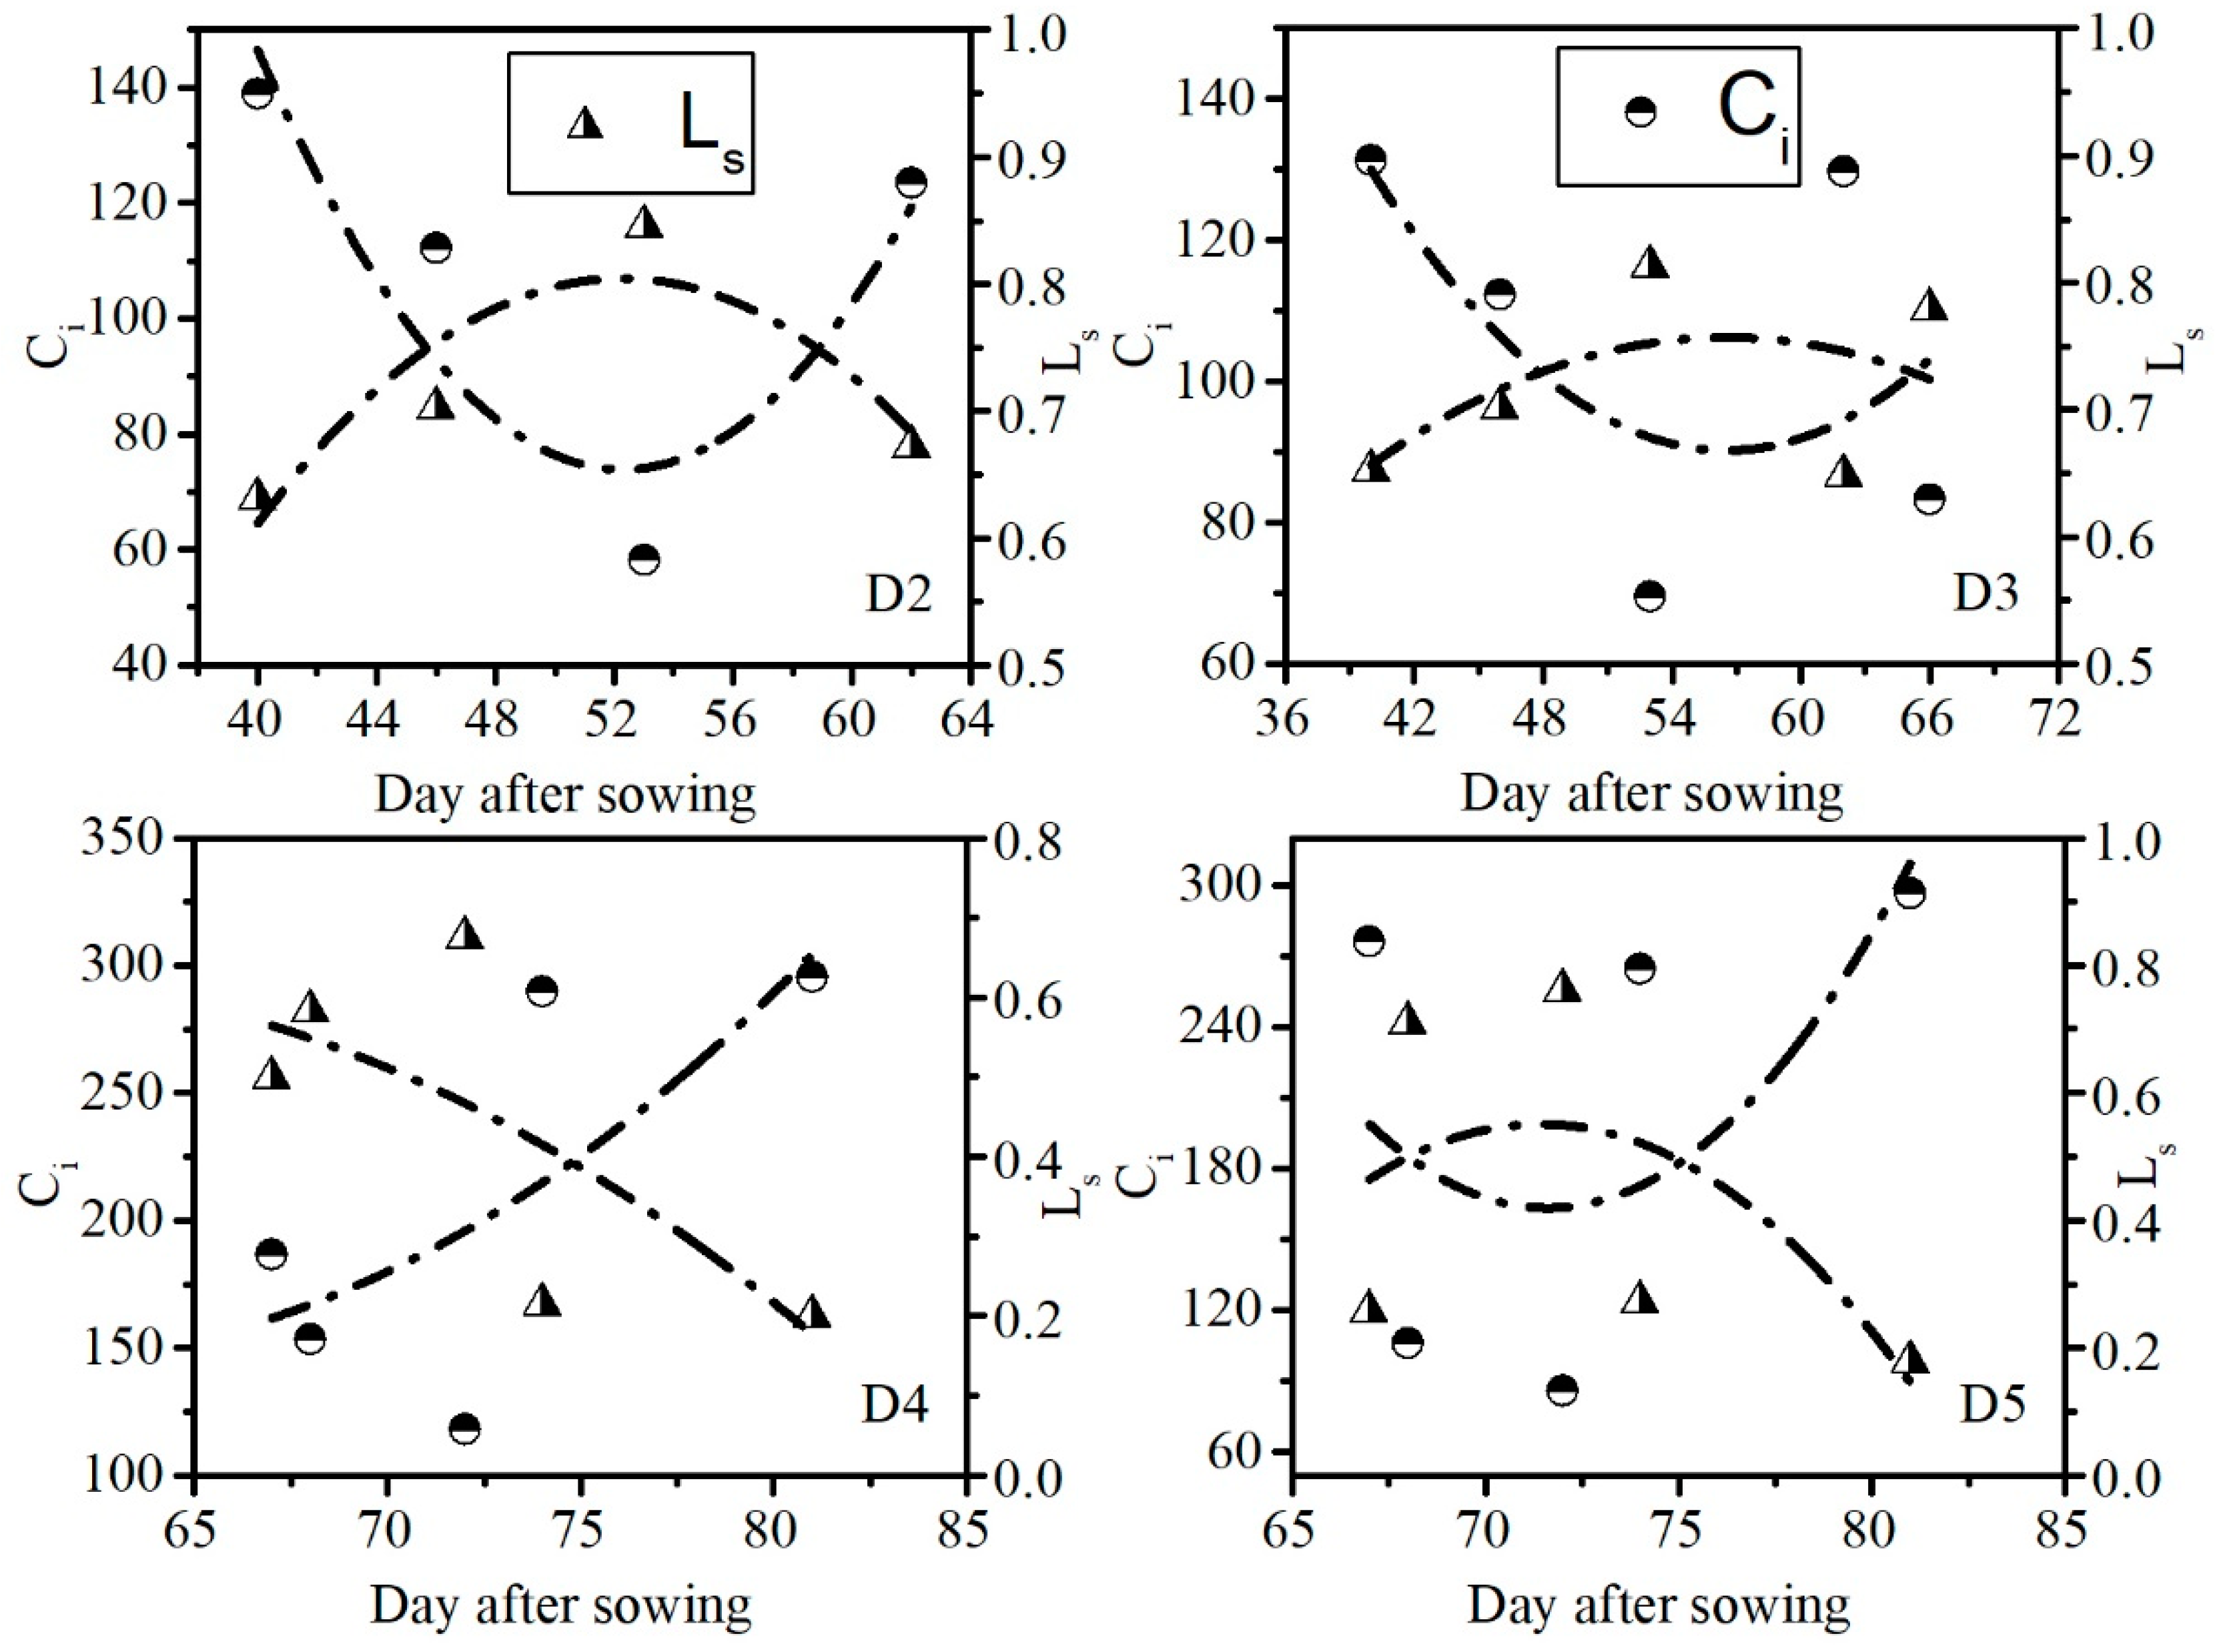
3.2. Leaf Water Content at Which Maize Photosynthesis Changed from Stomatal Limitation to Non-Stomatal Limitation

The change in photosynthesis from SL to NSL is a sign of the transformation of plants from environmental restriction to physiological and ecological damage. The changes in the intercellular CO2 concentration (Ci) and the Ls value are the key to determining whether crop photosynthesis is affected by SL or NSL [30]. The changes in the Ci occurred at 52, 57, 60, and 72 DAS in the D2, D3, D4, and D5 treatments, respectively, while changes in the Ls occurred at 51, 52, 60, and 72 DAS in the D2, D3, D4, and D5 treatments, respectively (Figure 2; Table 4). Moreover, the changes in LWC during the drought periods were analyzed (Figure 3). The DAS on which Ci and Ls changed were substituted into the formula for the changes in LWC with DAS (Figure 3; Table 4) in order to determine the LWC values when maize photosynthesis changed from being affected by SL to NSL. The LWC values when Ci changed were 75.8%, 75.2%, 75.1%, and 75.2% in the D2–D5 treatments, respectively, while the LWC values when Ls changed were 75.9%, 76.0%, 75.2%, and 75.2% in the D2–D5 treatments, respectively.

3.3. Response of Maize Vcmax25 to Drought and Rewatering

As drought continues, SL is replaced as the main factor limiting crop photosynthesis, and NSL leads to a reduction in photosynthetic capacity. Vcmax25 is the optimal parameter for characterizing plant photosynthetic capacity. As shown in Figure 4, the Vcmax25 of D1 increased during early maize development, reaching a maximum of 65.4 μmol m−2 s−1 at 46 DAS and then sharply decreasing until reaching a minimum of 24.9 μmol m−2 s−1 at 95 DAS.
In the D2 treatment, Vcmax25 continuously decreased during the drought period (Figure 4) to a minimum of 35.5 μmol m−2 s−1, which was lower than that in the D1 treatment (37.7 μmol m−2 s−1) before rewatering. Significant differences in the Vcmax25 before rewatering were not found between the D2 and D1 treatments (p < 0.05, Table 5). The Vcmax25 in the D2 treatment increased rapidly to 48.5 μmol m−2 s−1, which was slightly lower than that in the D1 treatment (48.7 μmol m−2 s−1) after rewatering. Significant differences in the Vcmax25 after rewatering were not found between the D2 and D1 treatments (p < 0.05, Table 5). Upon re-irrigating, the Vcmax25 for the D2 treatment (48.5 μmol m−2 s−1) almost reached to the level of control at the same stage, with a maximum of 48.7 μmol m−2 s−1 for the control plant. This indicated that a 27 day episodic drought from jointing to tasseling significantly inhibited photosynthetic capacity, while the capacity recovered when subsequent rewatering occurred. The changes in the Vcmax25 in the D3 treatment exhibited a similar change pattern to those in the D2 treatment (Figure 4). Vcmax25 for D3 treatment showed a decreasing trend, while it increased to the level of 46.6 μmol m−2 s−1 upon rewatering, which was lower than the D1 treatment of 48.7 μmol m−2 s−1, and significant differences were not found (p < 0.05, Table 5), indicating that episodic drought significantly inhibited photosynthetic capacity and that it recovered only partially following rewatering. The Vcmax25 in the D4 treatment continuously decreased during drought from the tasselling to milking stages and remained at a low and stable level after rewatering. The Vcmax25 in the D5 treatment continuously decreased to a minimum of 21.3 μmol m−2 s−1 and remained a low level after rewatering.
The adverse effects of drought can be alleviated by timely and reasonable rewatering. The LWC for the D2 treatment was 75.7% when rewatering, which was the LWC when maize photosynthesis changed from SL to NSL; a partial recovery of maize photosynthetic capacity was achieved after rewatering. The LWC values were 72.1%, 72.9%, and 73.6% in the D3, D4, and D5 treatments, respectively, which were lower than the LWC values when photosynthesis changed from SL to NSL. The drought periods in the D3, D4, and D5 treatments destroyed photosynthetic organs and significantly inhibited the photosynthetic capacity of maize, which did not recover to its original level after rewatering.

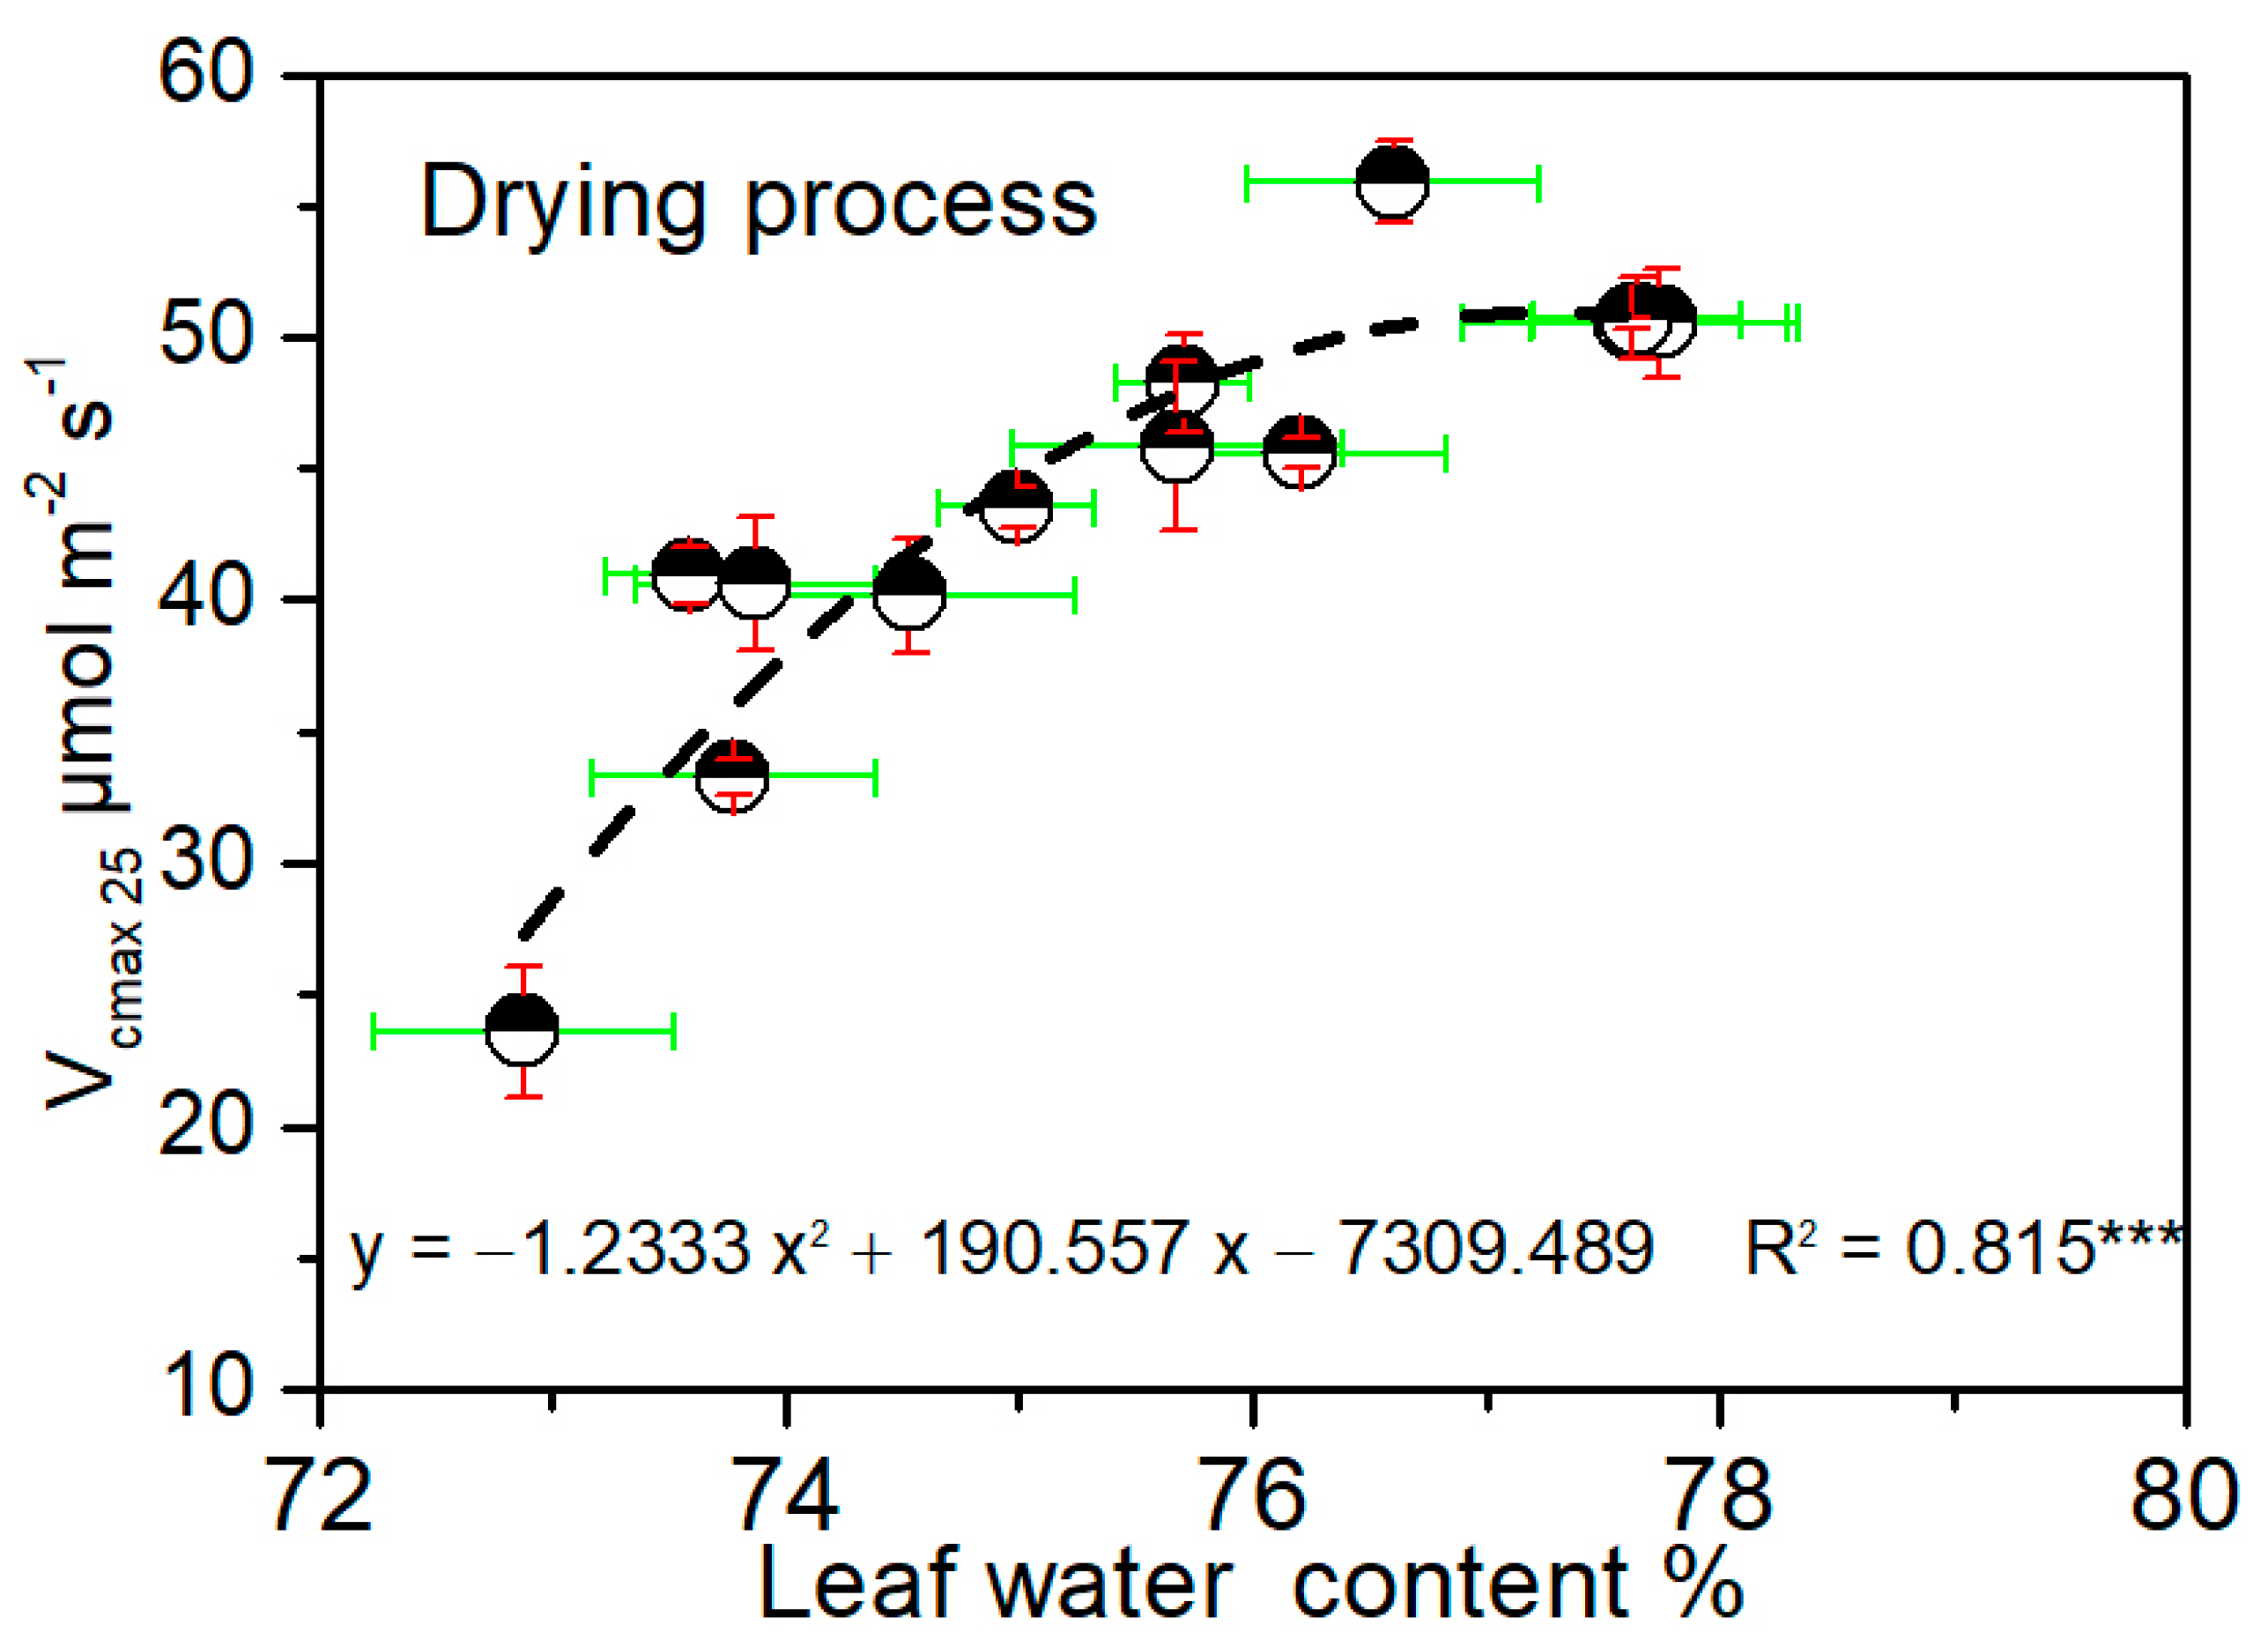
3.4. Critical Water Conditions for Maize Photosynthetic Capacity during Drought

The Vcmax25 levels decreased significantly under the drought periods imposed in this study. As drought stress continues, the Vcmax25 decreases to zero, resulting in the total loss of photosynthetic capacity in crops. The relationships between the LWC and Vcmax25 were analyzed during drying process (Figure 5). There was a parabolic relationship between LWC and Vcmax25. The Vcmax25 reached a maximum of 51.5 μmol m−2 s−1 when the LWC was 77.2%, which is the optimal LWC for maize photosynthesis. The Vcmax25 reached its lowest level (zero) when the LWC was 70.8% or 83.7%. The LWC of 70.8% indicated that the maize was experiencing extreme drought, and when the LWC fell below 70.8%, the maize lost its photosynthetic capacity.

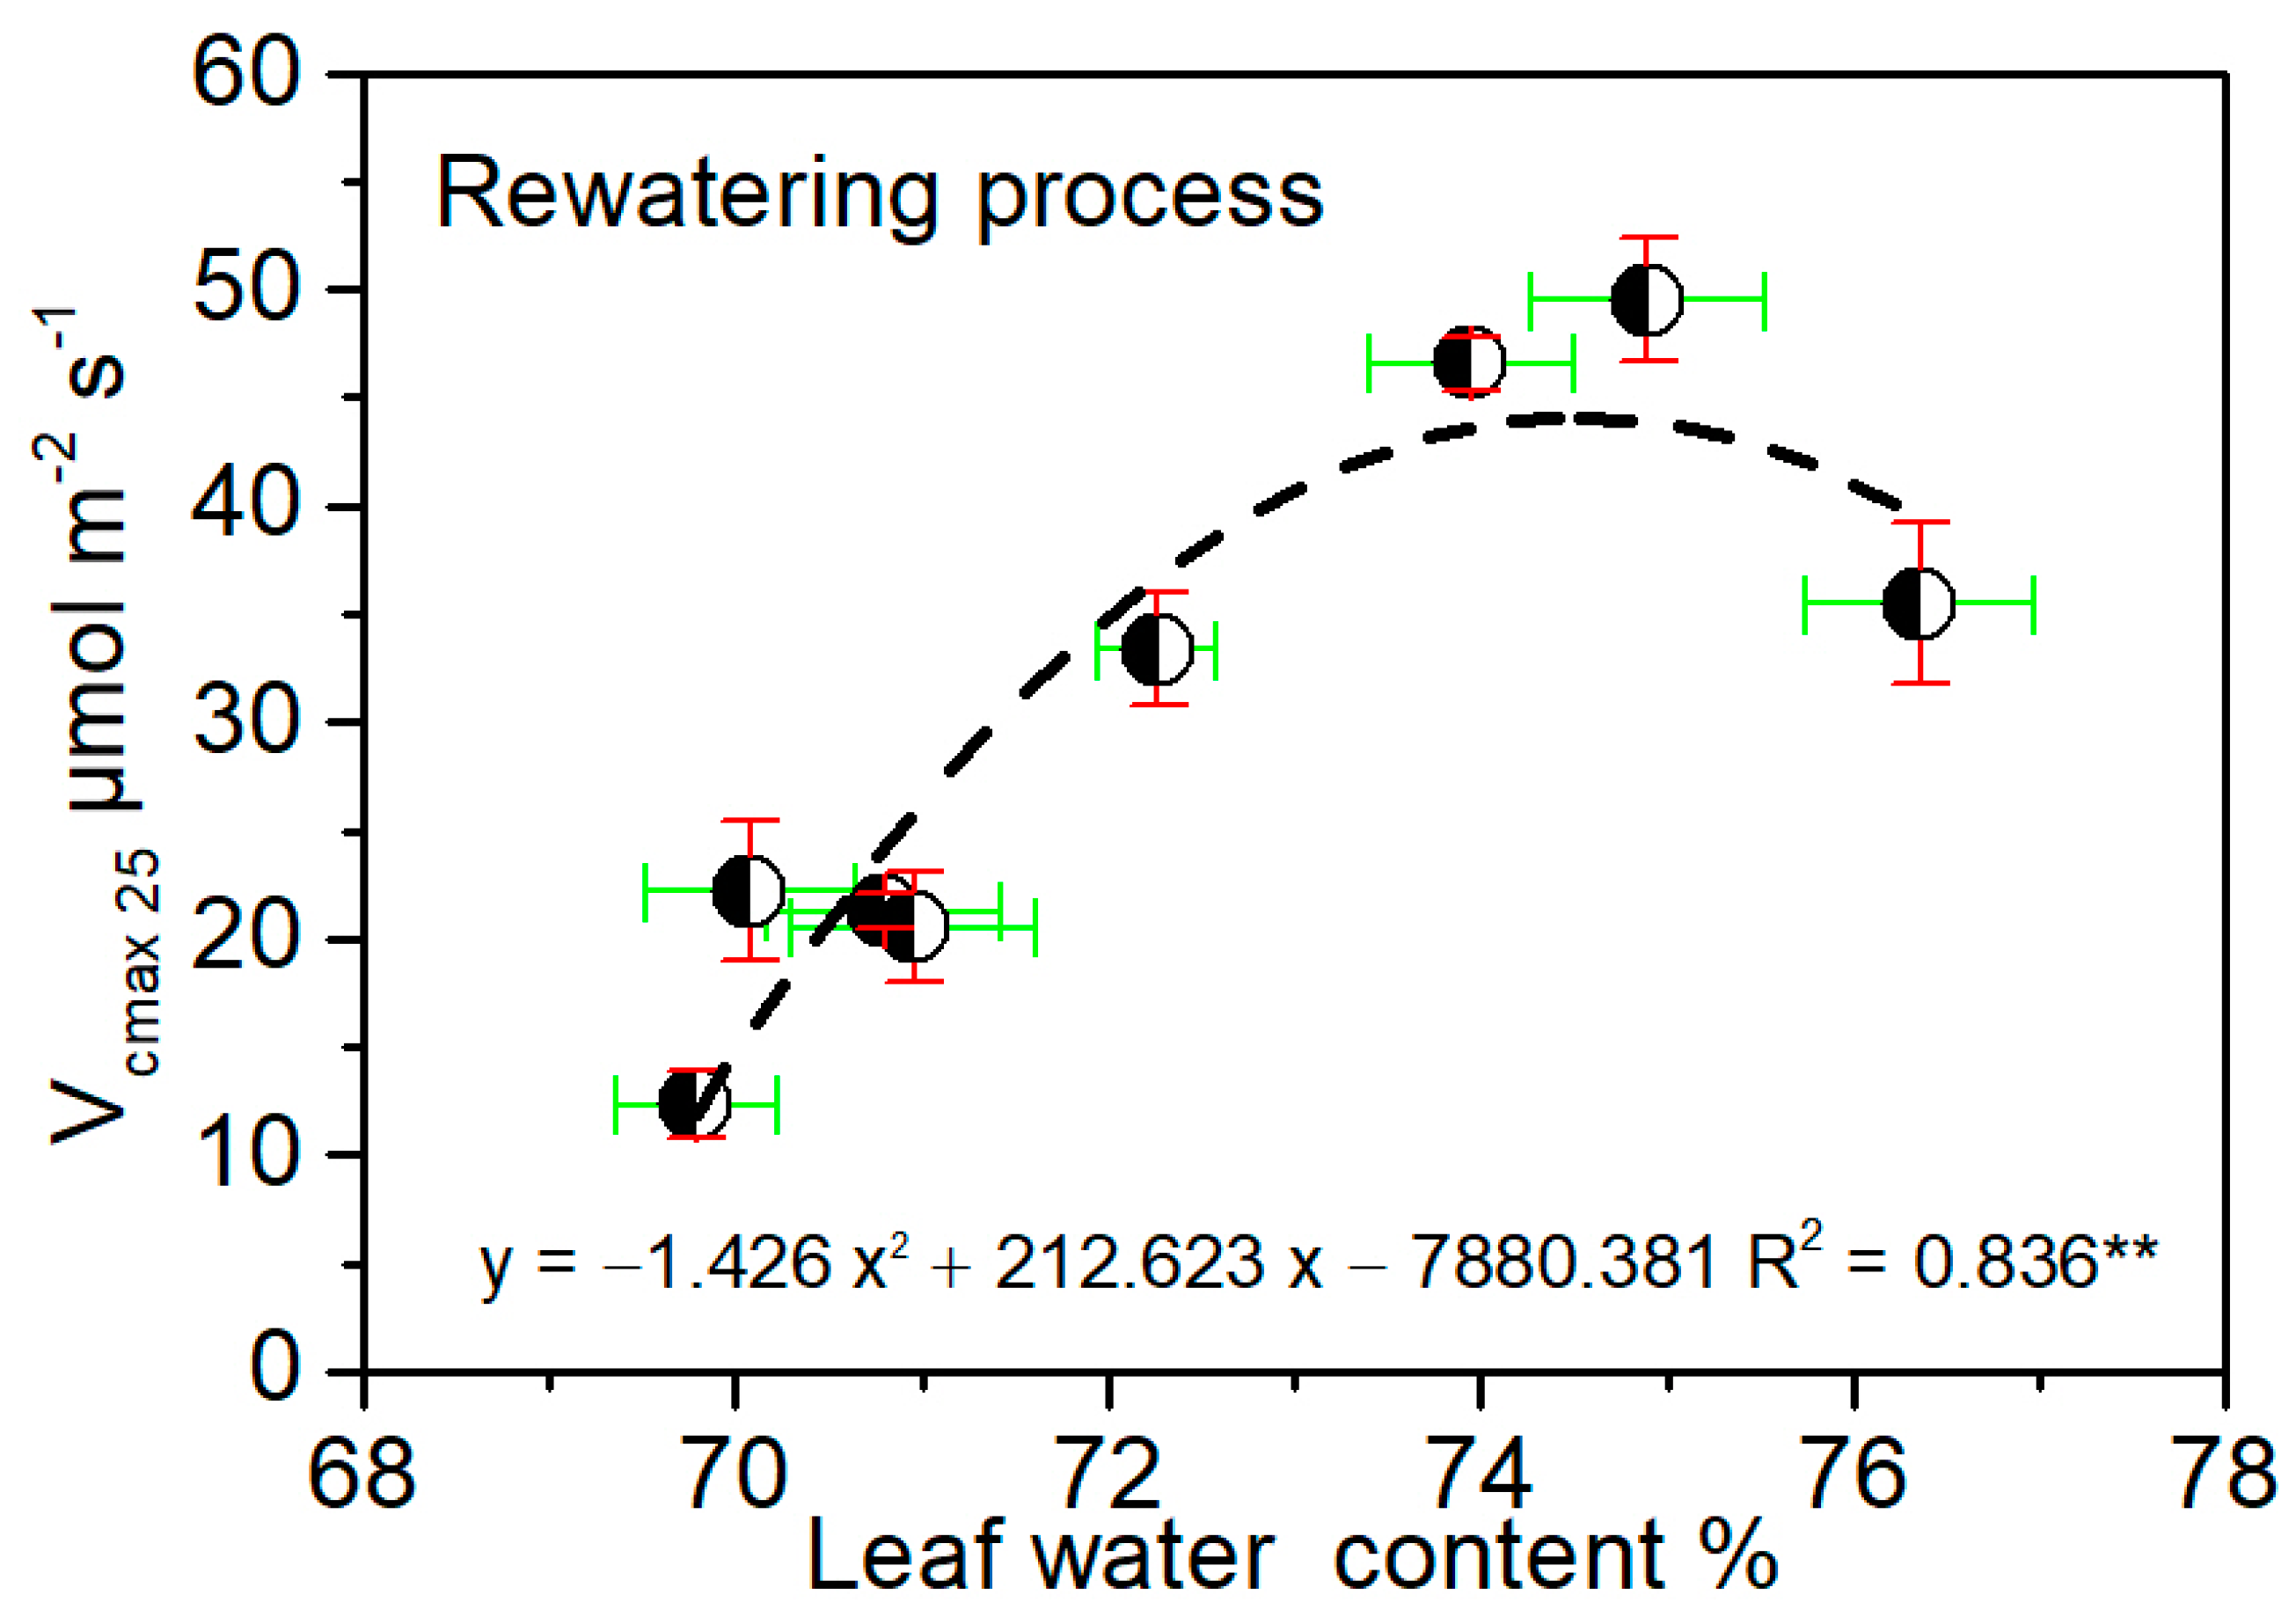
3.5. Critical Water Conditions for Maize Photosynthetic Capacity during Rewatering

Suitable rehydration measures can relieve the adverse effects of drought stress on crops and alleviate the yield losses caused by drought stress. LWC is an effective indicator of the degree of crop drought, and the relationships between the LWC and Vcmax25 were analyzed during rewatering process in this study (Figure 6). The change trend of the response of the Vcmax25 to LWC during rewatering exhibited a similar pattern to that during the drought periods. The Vcmax25 reached a maximum of 44.0 μmol m−2 s−1 when the LWC was 74.5%, which was the optimal LWC for maize photosynthesis during rewatering. When the LWC was 69.0% or 80.1%, the Vcmax25 decreased to zero. When the LWC was lower than 69.0%, drought had significantly inhibited the photosynthetic capacity of maize; only partial recovery could be achieved, and the photosynthetic capacity could not recover to its original level following rewatering. At this point, maize photosynthesis had begun to change from SL to NSL. Before rewatering, the plant photosynthetic organs had been damaged, and the plant photosynthetic capacity could not be fully recovered by rewatering; therefore, the maximum value of Vcmax25 during rewatering was lower than that during the drought period.

4. Discussion

Appropriate rewatering can compensate for the plant growth inhibition caused by drought, and has compensatory or even super compensatory effects on plant growth. The response of maize to drought stress and rewatering is short-term rapid growth after the stress is relieved, to partially compensate for the lost growth due to drought [37]. Luo et al. found that water deficit reduced the water potential of cotton leaves, but the water potential recovered quickly to a level that was equal to or higher than the control level after rewatering [38]. The present results indicated that drought for 27 days and 41 days during the jointing period impacted the maize LWC, but that the LWC recovered after rewatering. In contrast, drought for 43 days during the tasselling period and for 36 days during the silking period had severe effects on the LWC, which did not fully recover after rewatering. Nevertheless, compensatory plant growth after rewatering following drought stress is not guaranteed. As reported, the degree and rate of recovery through rehydration may be related to the duration and severity of the predrought [39]. After a short period of drought stress, rewatering restored the photosynthetic rate of wheat to the control level, but after long-term drought stress, it recovered to only 80% of the control level [40]. In this study, the maize photosynthetic capacity was almost restored by rewatering after 27 days of drought at the jointing stage, while it was only partially restored by rewatering after 41 days of drought. This result is consistent with our hypothesis that the “the recovery degree of the maize Vcmax25 after rewatering would be different following droughts of different durations that occurred at different growth stages”. The drought intensity has a strong impact on the recovery degree of crops after drought stress. Compared with severe (relative soil water content of 45–50%) drought stress, moderate (relative soil water content of 60–65%) drought stress led to a greater compensation effect for the physiological and ecological indicators of soybean after rewatering in [41]. In the current study, the LWC when maize photosynthesis changed from being affected by SL to NSL was the critical water condition required for the complete restoration of maize photosynthetic capacity.
Drought stress is the primary limiting factor for crop photosynthesis. In the early stage of drought, the drought conditions cause the crop leaf stomata to close, and the amount of CO2 entering the stomata decreases to below the amount required for photosynthesis. Ultimately, this leads to a decrease in crop photosynthesis. SL is the major factor limiting crop photosynthesis at this stage, and the photosynthetic capacity of the crop can be restored to its original level by timely rewatering [42]. The change in crop photosynthesis from SL to NSL is an important indicator of the transition from mild and moderate drought stress to severe drought stress. The LWC when maize photosynthesis changed from being affected by SL to NSL was shown to be between 75 ± 1.5% and 75 ± 1.3% in [30]; this is similar to the results of this study, in which the LWC was 75.4% when maize photosynthesis changed from being affected by SL to NSL.
As drought continues, it causes damage to plant photosynthetic organs, and NSL factors lead to a reduction in the plant photosynthetic capacity. The Vcmax25 is an important parameter that characterizes crop photosynthetic capacity. It determines the crop maximum net photosynthetic rate, mitochondrial respiration in light, photorespiration, and other important physiological processes, and plays a decisive role in crop photosynthesis [33,43]. Water is an important environmental factor that impacts the Vcmax25. In the dry season, the Vcmax25 decreases with decreasing soil moisture, and the soil moisture can explain 61–64% of the variation in Vcmax25 [44]. The results of this study indicate that the Vcmax25 decreased gradually as the drought period continued, and only partially recovered after rewatering. Vaz et al. [45] found that the maximum carboxylation rate of plant leaves exhibited an obvious threshold response to water stress and that a relative soil water content of 58–62% was the critical water condition for the maize gas exchange parameters [46]. A decrease in LWC from 75% to 70% was found to be an important turning point for the photosynthetic physiological activity of wheat leaves in [47]. Our results showed that the LWC was 77.2% when the maize Vcmax25 reached its highest point of 51.5 μmol m−2 s−1 and that the LWC values were 70.8% and 83.7% when the maize Vcmax25 decreased to zero. As previously reported, the crop Vcmax25 has a certain degree of adaptability and plasticity, and can adjust to adapt to the external environment when external environmental conditions change [45]. These adjustments led to the difference in the maximum Vcmax25 during the drought (51.5 μmol m−2 s−1) and rewatering (44.0 μmol m−2 s−1) processes in this study. The changes in Vcmax25 indicate that maize photosynthesis began to transition from SL to NSL during rewatering. Moreover, drought damaged the maize photosynthetic organs, which led to the reduction of the maize Vcmax25 in response to the adverse external conditions. As a result, the maximum Vcmax25 during the rewatering process was lower than that during the drought period. Appropriate water stress improves the ability of plants to adapt to drought, thus allowing them to better resist drought [38,48,49,50]; however, studies have also shown that plants that experience drought stress do not continue to improve their ability to resist drought when they encounter drought again [51,52,53]. The present study indicated that the LWC when the maize Vcmax25 reached zero during rewatering was lower than that during drought. This result suggests that drought stress improved the adaptability and resistance of maize to drought stress, but also caused a reduction in the suitable water range for maize and caused a reduction in the photosynthetic capacity of maize. The determination of a suitable rewatering time is of great significance for rehydration recovery after drought. This study verified that an LWC of less than 75.4% caused damage to the photosynthetic organs and reduced the photosynthetic capacity of maize; as a result, rehydration could not restore the maize photosynthetic capacity to its original level.
Under mild and moderate drought stress, reductions in crop photosynthesis are mainly caused by SL, and timely rehydration will lead to the recovery of photosynthesis to its original level. As drought progresses, its effects decrease the crop photosynthetic capacity, the reductions in crop photosynthesis are caused mainly by NSL, and rehydration will only partly recover the plant photosynthetic capacity [8,18,54]. LWC is the best indicator reflecting crop water conservation; changes in LWC effectively reflect crop drought degree, and LWC is easy to measure. Moreover, it is important in crop drought monitoring with remote sensing. The Vcmax25 reflects the crop photosynthetic capacity [55], and it has different thresholds (maximum, minimum, and optimal values) under different environmental conditions. Determining these Vcmax25 thresholds in response to LWC under drought and rewatering has great practical significance for improving crop productivity, and can also provide a technical basis for dealing with extreme weather and climate events and making relevant agronomic decisions. In this study, the LWC values at which maize photosynthesis changed from being affected by SL to NSL and at which the maize Vcmax25 reached its thresholds were determined under drought and rewatering conditions. The lowest LWC at which maize photosynthesis still occurred was also determined. These results provide a reference for the identification and the classification of crop drought stress and the formulation of scientific and reasonable crop water management measures. Future research should be expanded to the canopy scale to provide a theoretical basis for global drought identification, classification, and monitoring.

5. Conclusions

The present study indicates that the LWC recovered after rewatering following different intensities of drought stress at the jointing stage, but did not recover after rewatering following 43 days and 36 days of drought stress at the tasselling stage and silking stage, respectively. These results suggest that drought during the reproductive stages, particularly the late developmental stage, had severe effects on the LWC. Maize photosynthesis changed from being determined by SL to NSL when the LWC was 77.2%, which was the critical water condition required for the complete recovery of the photosynthetic capacity of maize. The values of LWC at which the maize Vcmax25 reached its maximum value and zero differed between the drought and rewatering periods. The drought periods improved the drought resistance ability of maize; however, its suitable LWC range was reduced, and its photosynthetic capacity was significantly weakened. The findings of this study provide new insight into a better understanding of crop drought stress as well as a basis for the scientific management of crop drought resistance and avoidance.

Author Contributions

Conceptualization, G.Z. and Q.H.; methodology, G.Z. and X.S.; software, Q.H. and X.S.; validation, X.S., data curation, X.S.; writing—original draft preparation, G.Z. and X.S.; writing—review and editing, G.Z. and X.S.; supervision, G.Z. and Q.H. All authors have read and agreed to the published version of the manuscript.

Funding

This research was funded by the National Key Research and Development Program of China (2016YFD0300106, 2018YFA0606103), the National Natural Science Foundation of China (31661143028, 41571175), and the China Special Fund for Meteorological Research in the Public Interest (No. GYHY201506019).

Institutional Review Board Statement

Not applicable.

Informed Consent Statement

Not applicable.

Data Availability Statement

Data are contained with the article.

Acknowledgments

We appreciate Ma Xueyan and Wang Qiuling for their help in the field experiments and data collection.

Conflicts of Interest

The authors declare no conflict of interest.

References

  1. Mishra, A.K.; Singh, V.P. A review of drought concepts. J. Hydrol. 2010, 391, 202–216. [Google Scholar] [CrossRef]
  2. Shao, D.; Chen, S.; Tan, X.; Gu, W. Drought characteristics over China during 1980-2015. Int. J. Climatol. 2018, 38, 3532–3545. [Google Scholar] [CrossRef]
  3. Zhang, Q.; Han, L.; Jia, J.; Song, L.; Wang, J. Management of drought risk under global warming. Theor. Appl. Climatol. 2016, 125, 187–196. [Google Scholar] [CrossRef]
  4. Stringer, L.C.; Dyer, J.C.; Reed, M.S.; Dougill, A.J.; Twyman, C.; Mkwambisi, D. Adaptations to climate change, drought and desertification: Local insights to enhance policy in southern Africa. Environ. Sci. Policy 2009, 12, 748–765. [Google Scholar] [CrossRef]
  5. Li, Y.; Ye, W.; Wang, M.; Yan, X. Climate change and drought: A risk assessment of crop-yield impacts. Clim. Res. 2009, 39, 31–46. [Google Scholar] [CrossRef]
  6. Qian, W.; Hu, Q.; Zhu, Y.; Lee, D.K. Centennial-scale dry-wet in East Asia. Clim. Dyn. 2003, 21, 77–89. [Google Scholar] [CrossRef]
  7. Han, L.; Zhang, Q.; Ma, P.; Jia, J.; Wang, J. The spatial distribution characteristics of a comprehensive drought risk index in southwestern China and underlying causes. Theor. Appl. Climatol. 2016, 124, 517–528. [Google Scholar] [CrossRef]
  8. Campos, H.; Cooper, A.; Habben, J.E.; Edmeades, G.O.; Schussler, J.R. Improving drought tolerance in maize: A view from industry. Field Crop. Res. 2004, 90, 19–34. [Google Scholar] [CrossRef]
  9. Jin, Y.; Zhou, D.; Jiang, S. Comparison of soil water content and corn yield in furrow and conventional ridge sown systems in a semiarid region of China. Agric. Water Manag. 2010, 97, 326–332. [Google Scholar] [CrossRef]
  10. Song, H.; Li, Y.; Zhou, L.; Xu, Z.; Zhou, G. Maize leaf functional responses to drought episode and rewatering. Agric. For. Meteorol. 2018, 249, 57–70. [Google Scholar] [CrossRef]
  11. Cheng, Z.; Meng, J.; Wang, Y. Improving spring maize yield estimation at field scale by assimilating timeseries HJ-1 CCD data into the WOFOST model using a new method with fast algorithms. Remote Sens. 2016, 8, 303. [Google Scholar] [CrossRef] [Green Version]
  12. Ghannoum, O. C4 photosynthesis and water stress. Ann. Bot. Lond. 2009, 103, 635–644. [Google Scholar] [CrossRef] [PubMed] [Green Version]
  13. Chaves, M.M.; Flexas, J.; Pinheiro, C. Photosynthesis under drought and salt stress: Regulation mechanisms from whole plant to cell. Ann. Bot. 2009, 103, 551–560. [Google Scholar] [CrossRef] [Green Version]
  14. Zhang, X.; Lei, L.; Lai, J.; Zhao, H.; Song, W. Effects of drought stress and water recovery on physiological responses and gene expression in maize seedlings. BMC Plant Biol. 2018, 18, 68. [Google Scholar] [CrossRef] [PubMed]
  15. Oukarroum, A.; Schansker, G.; Strasser, R.J. Drought stress effects on photosystem I content and photosystem II thermo tolerance analyzed using Chla fluorescence kinetics in barley varieties differing in their drought tolerance. Physiol. Plant. 2009, 137, 188–199. [Google Scholar] [CrossRef]
  16. Pinheiro, C.; Chaves, M.M. Photosynthesis and drought: Can we make metabolic connections from available data? J. Exp. Bot. 2011, 62, 869–882. [Google Scholar] [CrossRef] [Green Version]
  17. Gong, F.; Wu, X.; Zhang, H.; Chen, Y.; Wang, W. Making better maize plants for sustainable grain production in a changing climate. Front. Plant Sci. 2015, 6, 835. [Google Scholar] [CrossRef] [Green Version]
  18. Flexas, J.; Medrano, H. Drought-inhibition of Photosynthesis in C3 Plants: Stomatal and Non-stomatal Limitations Revisited. Ann. Bot. 2002, 89, 183–189. [Google Scholar] [CrossRef] [Green Version]
  19. Grassi, G.; Magnani, F. Stomatal, mesophyll conductance and biochemical limitations to photosynthesis as affected by drought and leaf ontogeny in ash and oak trees. Plant Cell Environ. 2005, 28, 834–849. [Google Scholar] [CrossRef]
  20. Croft, H.; Chen, J.; Luo, X.; Barlett, P.; Chen, B.; Staebler, R.M. Leaf chlorophyll content as a proxy for leaf photosynthetic capacity. Glob. Chang. Biol. 2017, 23, 3513–3524. [Google Scholar] [CrossRef] [PubMed]
  21. Xu, Z.; Zhou, G.; Shimizu, H. Plant responses to drought and rewatering. Plant Signal Behav. 2010, 5–6, 649–654. [Google Scholar] [CrossRef] [PubMed] [Green Version]
  22. Wang, X.; Shi, Y.; Guo, Z.; Zhang, Y.; Yu, Z. Water use and soil nitrate nitrogen changes under supplemental irrigation with nitrogen application rate in wheat field. Field Crop Res. 2015, 183, 117–125. [Google Scholar] [CrossRef]
  23. Abid, M.; Tian, Z.; Ata-Ul-Karim, S.T.; Wang, F.; Liu, Y.; Zahoor, R.; Jiang, D.; Dai, T. Adaptation to and recovery from drought stress at vegetative stages in wheat (Triticum aestivum) cultivars. Funct. Plant Biol. 2016, 43, 1159–1169. [Google Scholar] [CrossRef] [PubMed]
  24. Pinheiro, C.; Passarinho, J.; Ricardo, C.P. Effect of drought and rewatering on the metabolism of Lupinus albus organs. J. Plant Physiol. 2004, 161, 1203–1210. [Google Scholar] [CrossRef] [PubMed]
  25. Wang, L.; Zhang, T.; Ding, S. Effect of drought and rewatering on photosynthetic physioecological characteristics of soybean. Acta Ecol. Sin. 2006, 26, 2073–2078. [Google Scholar] [CrossRef]
  26. Galle, A.; Florez-Sarasa, I.; Thameur, A.; De Paepe, R.; Flexas, J.; Ribas-Carbo, M. Effects of drought stress and subsequent rewatering on photosynthetic and respiratory pathways in Nicotiana sylvestris wild type and the mitochondrial complex I-deficient CMSII mutant. J. Exp. Bot. 2010, 61, 765–775. [Google Scholar] [CrossRef] [Green Version]
  27. Li, Y.; Song, H.; Zhou, L.; Xu, Z.; Zhou, G. Vertical distributions of chlorophyll and nitrogen and their associations with photosynthesis under drought and rewatering regimes in a maize field. Agric. For. Meteorol. 2019, 272–273, 40–54. [Google Scholar] [CrossRef]
  28. Junttila, S.; Sugano, J.; Vastaranta, M.; Linnakoski, R.; Kaartinen, H.; Kukko, A.; Holopainen, M.; Hyyppa, H.; Hyyppa, J. Can leaf water content be estimated using multispectral terrestrial laser scanning? A case study with Norway spruce Seedlings. Front. Plant Sci. 2018, 9, 299. [Google Scholar] [CrossRef]
  29. El-Hendawy, S.; Al-Suhaibani, N.; Elsayed, S.; Hassan, W.; Dewir, Y.; Refay, Y.; Abdella, K. Potential of the existing and novel spectral reflectance indices for estimating the leaf water status and grain yield of spring wheat exposed to different irrigation rates. Agric. Water Manag. 2019, 217, 356–373. [Google Scholar] [CrossRef]
  30. Song, X.; Zhou, G.; He, Q.; Zhou, H. Stomatal limitations to photosynthesis and their critical Water conditions in different growth stages of maize under water stress. Agric. Water Manag. 2020, 241, 106330. [Google Scholar] [CrossRef]
  31. Ullah, S.; Skidmore, A.K.; Naeem, M.; Schlerf, M. An accurate retrieval of leaf water content from mid to thermal infrared spectra using continuous wavelet analysis. Sci. Total Environ. 2012, 437, 145–152. [Google Scholar] [CrossRef]
  32. Zhao, S.; Wang, Q.; Yao, Y.; Du, S.; Zhang, C.; Li, J.; Zhao, J. Estimating and Validating Wheat Leaf Water Content with Three MODIS Spectral Indexes: A Case Study in Ningxia Plain, China. J. Agric. Sci. Technol. 2016, 18, 387–398. [Google Scholar]
  33. Farquhar, G.D.; von Caemmerer, S.; Berry, J.A. A biochemical model of photosynthetic CO2 assimilation in leaves of C3 species. Planta 1980, 149, 78–90. [Google Scholar] [CrossRef] [Green Version]
  34. Von Caemmerer, S. Biochemical Models of Leaf Photosynthesis; CSIRO Publishing: Clayton, Australia, 2000. [Google Scholar]
  35. Massad, R.S.; Andrée, T.; Bethenod, O. The effect of temperature on C4-type leaf photosynthesis parameters. Plant Cell Environ. 2007, 30, 1191–1204. [Google Scholar] [CrossRef]
  36. Carmo-Silva, A.E.; Powers, S.J.; Keys, A.J.; Arrabaça, M.C.; Parry, M. Photorespiration in c4 grasses remains slow under drought conditions. Plant Cell Environ. 2010, 31, 925–940. [Google Scholar] [CrossRef]
  37. Acevedo, E.; Hsiao, T.C.; Henderson, D.W. Immediate and subsequent growth responses of Maize leaves to changes in water status. Plant Physiol. 1971, 48, 631–636. [Google Scholar] [CrossRef] [Green Version]
  38. Luo, Y.; Zhao, X.; Zhou, R.; Zuo, X.; Zhang, J.; Li, Y. Physiological acclimation of two psammophytes to repeated soil drought and rewatering. Acta Physiol. Plant 2011, 33, 79–91. [Google Scholar] [CrossRef]
  39. Xu, Z.; Zhou, G. Photosynthetic recovery of a perennial grass Leymus chinensis after different periods of soil drought. Plant Prod. Sci. 2007, 10, 277–285. [Google Scholar] [CrossRef]
  40. Asseng, S.; Ritchie, J.T.; Smucker, A.J.M.; Robertson, M.J. Root growth and water uptake during water deficit and recovering in wheat. Plant Soil 1998, 201, 265–273. [Google Scholar] [CrossRef]
  41. Dong, S.; Jiang, Y.; Dong, Y.; Wang, L.; Wang, W.; Ma, Z.; Yan, C.; Ma, C.; Liu, L. A study on soybean responses to drought stress and rehydration. Saudi J. Biol. Sci. 2019, 26, 2006–2017. [Google Scholar] [CrossRef] [PubMed]
  42. Flexas, J.; Barón, M.; Bota, J.; Ducruet, J.-M.; Gallé, A.; Galmés, J.; Jiménez, M.; Pou, A.; Ribas-Carbó, M.; Sajnani, C.; et al. Photosynthesis limitations during water stress acclimation and recovery in the drought-adapted Vitis hybrid Richter-110 (V. berlandierixV. rupestris). J. Exp. Bot. 2009, 60, 2361–2377. [Google Scholar] [CrossRef] [PubMed] [Green Version]
  43. Wullschleger, S.D. Biochemical limitations to carbon assimilation in C3 plants-A retrospective analysis of the A/Ci curves from 109 species. J. Exp. Bot. 1993, 44, 907–920. [Google Scholar] [CrossRef]
  44. Ju, W.; Wang, S.; Yu, G.; Zhou, Y.; Wang, H. Modeling the impact of drought on canopy carbon and water fluxes for a subtropical evergreen coniferous plantation in southern China through parameter optimization using an ensemble Kalman filter. Biogeosciences 2010, 7, 845–857. [Google Scholar] [CrossRef] [Green Version]
  45. Vaz, M.; Pereira, J.S.; Gazarini, L.C.; David, T.S.; David, J.S.; Rodrigues, A.; Maroco, J.; Chaves, M.M. Drought-induced photosynthetic inhibition and autumn recovery in two Mediterranean oak species (Quercus ilex and Quercus suber). Tree Physiol. 2010, 30, 946–956. [Google Scholar] [CrossRef] [Green Version]
  46. Ma, X.; He, Q.; Zhou, G. Sequence of Changes in Maize Responding to Soil Water Deficit and Related Critical Thresholds. Front. Plant Sci. 2018, 9, 511. [Google Scholar] [CrossRef] [PubMed]
  47. Wang, J.; Zhao, C.; Huang, W.; Guo, X.; Li, H. Effect of soil water content on the wheat leaf water content and the physiological function. J. Triticeae Crop. 2001, 21, 42–47, (In Chinese with English Abstract). [Google Scholar]
  48. Ruiz-Sánchez, M.C.; Domingo, R.; Torrecillas, A.; Pérez-Pastor, A. Water stress preconditioning to improve drought resistance in young apricot plants. Plant Sci. 2000, 156, 245–251. [Google Scholar] [CrossRef] [Green Version]
  49. Villar-Salvador, P.; Planelles, R.; Oliet, J.; Peñuelas-Rubira, J.L.; Jacobs, D.F.; González, M. Drought tolerance and transplanting performance of holm oak (Quercus ilex) seedlings after drought hardening in the nursery. Tree Physiol. 2004, 24, 1147–1155. [Google Scholar] [CrossRef] [Green Version]
  50. Ding, Y.; Fromm, M.; Avramova, Z. Multiple exposures to drought ‘train’ transcriptional responses in Arabidopsis. Nature 2012, 3, 740. [Google Scholar] [CrossRef]
  51. Lloret, F.; Siscart, D.; Dalmases, C. Canopy recovery after drought dieback in holm-oak Mediterranean forests of Catalonia (NE Spain). Glob. Chang. Biol. 2004, 10, 2092–2099. [Google Scholar] [CrossRef]
  52. Zavalloni, C.; Gielen, B.; Lemmens, C.M.H.M.; Boeck, H.D.; Blasi, S.; den Bergh, S.V.; Nijs, I.; Ceulemans, R. Does a warmer climate with frequent mild water shortages protect grassland communities against a prolonged drought? Plant Soil 2008, 308, 119–130. [Google Scholar] [CrossRef]
  53. Walter, J.; Nagy, L.; Hein, R.; Rascher, U.; Beierkuhnlein, C.; Willner, E.; Jentsch, A. Do plants remember drought? Hints towards a drought-memory in grasses. Environ. Exp. Bot. 2011, 71, 34–40. [Google Scholar] [CrossRef]
  54. Yordanov, I.; Velikova, V.; Tsonev, T. Plant Responses to drought, acclimation, and stress tolerance. Photosynthetica 2000, 38, 171–186. [Google Scholar] [CrossRef]
  55. Chou, S.; Chen, B.; Chen, J.; Wang, M.; Wang, S.; Croft, H.; Shi, Q. Estimation of leaf photosynthetic capacity from the photochemical reflectance index and leaf pigments. Ecol. Indic. 2020, 110, 105867. [Google Scholar] [CrossRef]
Figure 1. Response of leaf water content to drought and rewatering. Notes: data in the figure are the average of 3 single values obtained during the drying and rewatering process.
Sustainability 13 07218 g001
Figure 2. Changes of Ci and Ls during the drying process. Notes: Ci, intercellular CO2 concentration; Ls, stomatal limitation value.
Sustainability 13 07218 g002
Figure 3. Changes of leaf water content during the drying process. Note: * p < 0.01, ** p < 0.05.
Sustainability 13 07218 g003
Figure 4. Response of Vcmax25 to drought and rewatering. Notes: data present in figure are the average of 3 single values.
Sustainability 13 07218 g004
Figure 5. Relationship between leaf water content and Vcmax25 during the drying process. Notes: data presented in the figure are the average of 3 single values obtained during the drying process. Note: *** p < 0.001.
Sustainability 13 07218 g005
Figure 6. Relationship between leaf water content and Vcmax25 during the rewatering process. Notes: data presented in figure are the average of 3 single values obtained during the rewatering process. Note: ** p < 0.05.
Sustainability 13 07218 g006
Table 1. Irrigation schedule and amount during experiment (mm).
TreatmentDAS (Day after Sowing)Total
28172431384552596673808794
D18.70.8101010242424252525252524260.5
D28.70.810101024Drought2525252524187.5
D38.70.810101024Drought252524137.5
D48.70.8101010242424Drought24135.5
D58.70.810101024242425Drought24160.5
Table 2. Summary of C4 photosynthesis model parameters at 25 °C.
ParameterDescriptionValue
A n (µmol m−2 s−1)Net photosynthetic rateMeasured
R d (µmol m−2 s−1)Leaf mitochondrial respiration0.01 Vcmax
C (µbar)CO2 concentration in the bundle sheathCO2 concertation in reference room
O (mbar)Partial pressure of O2210
γ * (bar/bar)Half the reciprocal of Rubisco specificity0.000193
V cmax (µmol m−2 s−1)Maximum carboxylation rate/
K c (µbar)Michaelis–Menten constant of Rubisco for CO2650
K o (mbar)Michaelis–Menten constant of Rubisco for O2450
f   ( T k ) Temperature correction function/
T k (K)Leaf temperatureMeasured
E a (kJ mol−1)Activation energy58.52
R (JK−1 mol−1)Gas constant8.31
Δ S (JK−1 mol−1)Entropy term710
H d (KJ mol−1)Deactivation energy220
Notes: the detailed descriptions about the parameters in this table can be found in Massad et al. [35] and Carmo-Silva et al. [36].
Table 3. Effects of drought and rewatering on leaf water content (%).
TreatmentsDAS (Day after Sowing)
5367748095
D176.5a76.7a73.5ab72.5a71.4a
D275.7ab76.4a74.9a72.3a69.8a
D375.0b73.7b72.1b73.9a70.1a
D475.2b75.8a73.8ab72.9a71.0a
D575.2b76.2a74.5a73.6a70.8a
Notes: the means within a column followed by the same letters are not significantly different at 5% level (Duncan’s one-way ANOVA). Data present in table are the average of 3 single values.
Table 4. Regression equation between Ci and Ls and day after sowing (DAS) during the drying process.
TreatmentParameterRegression EquationR2
D2Ciy = 0.4817 x2 – 50.367 x + 1390.40.810
Lsy = −0.0013 x2 + 0.1338 x − 2.69140.811
D3Ciy = 0.145 x2 – 16.405 x + 554.140.294
Lsy = −0.0004 x2 + 0.0415 x − 0.41520.260
D4Ciy = 0.3721 x2 – 44.882 x + 1498.20.514
Lsy = −0.0009 x2 + 0.1071 x − 2.52260.523
D5Ciy = 1.6631 x2 – 238.25 x + 86960.344
Lsy = −0.0044 x2 + 0.6333 x − 22.0670.360
Notes: Ci, intercellular CO2 concentration; Ls, stomatal limitation value.
Table 5. Effects of drought and rewatering on Vcmax25 (μmol m−2 s−1).
TreatmentsDAS (Days after Sowing)
5367748095
D158.6a37.7bc48.7a48.4a24.9a
D245.8c35.5c48.5a33.3c12.3c
D343.6c40.8b32.1c46.6a22.2ab
D458.4a48.4a33.3c23.6d20.5b
D557.3a45.6a40.2b40.9b21.3ab
Notes: the means within a column followed by the same letters are not significantly different at the 5% level (Duncan’s one-way ANOVA). Data present in table are the average of 3 single values.
Publisher’s Note: MDPI stays neutral with regard to jurisdictional claims in published maps and institutional affiliations.

