Article

Multicriteria Definition of Small-Scale Biorefineries Based on a Statistical Classification

1
French National Institute for Agriculture, Food, and Environment—INRAE, 44300 Nantes, France
2
Laboratoire Innovation Matériau Bois Habitat Apprentissage (LIMBHA), Ecole Supérieure du Bois, 7 Rue Christian Pauc, 44306 Nantes, France
*
Authors to whom correspondence should be addressed.
Sustainability 2021, 13(13), 7310; https://doi.org/10.3390/su13137310
Submission received: 30 April 2021 / Revised: 11 June 2021 / Accepted: 25 June 2021 / Published: 30 June 2021

Abstract

:
Biorefineries have many possible designs and therefore, present varied benefits in regards to sustainable development. Evaluating these biorefineries is central for the domain, and, as small-scale biorefineries (SSB) are commonly opposed to the large ones, specifying the concept of scale of a biorefinery is essential as well. However, there is no consensual definition of the “scale”, and the meaning of the term changes with the context. This paper presents a methodology to specify the concept of scale by grouping various biorefineries processing lignocellulosic biomass according to factors related to feedstock, process, economy and mobility of the facility, without any predetermined pattern. Data from 15 operational biorefineries are analyzed using a multivariate analysis combined with a hierarchical clustering. The classification obtained categorizes biorefineries into four design classes: smallest, small, hybrid and large scale. Small-scale biorefineries are characterized by a small investment cost (less than 2 M€), a low processing capacity (less than 100 t/day) and a low process complexity, while the end-products’ added value is variable. The mobility of the plants is a sufficient, but not necessary, criterion to have a small-scale biorefinery. Finally, the designs of the investigated biorefineries can be explained by two main trade-offs: one between the mobility and the processing capacity-investment cost, and the other between the process complexity and the added value.

1. Introduction

The depletion of petrochemical resources and their impact on the increasing greenhouse gas emissions have led governments and civil societies to promote alternatives to non-renewables and the transition to the bioeconomy [1]. Under the umbrella of the Sustainable Development Goals (SDGs) [2] adopted by the United Nations General Assembly, the aim of the bioeconomy is to substitute the use of fossil resources by their renewable counterparts [3]. Being embedded in the bioeconomy, the concept of biorefinery is defined as “the sustainable processing of biomass into a spectrum of marketable products and energy” according to the IEA Biorefinery Task 42 [4]. With this definition, biorefinery refers to the biomass processing activity, the facility processing biomass and also the chain of facilities processing biomass from upstream to downstream [5].
Biorefinery systems (as opposed to biorefinery plants) can be seen as complex systems [6]. Firstly, there is a large set of possible conversion pathways to process diverse biomass feedstocks leading to a range of end-products and byproducts [7,8]. Secondly, biorefineries are part of a socioeconomic and environmental context that influences their overall performance in terms of sustainability, circular economy and bioeconomy [9,10]. Therefore, designing a biorefinery is a challenging topic for the domain, and even moreso when it incorporates sustainability criteria [6,9]. The first stages of the design activity involve strategic decisions about the class of biorefinery and the supply chain. This includes choices of scale (also called size), location, biomass feedstock and product portfolio [11,12]. Traditionally, the scale of a biorefinery is associated with the processing or production capacity, which is a source of ambiguity as low yield productions may require the processing of a large amount of raw material to get a small amount of end-products [13]. For other authors, the scale of a biorefinery not only reflects the flow of feedstock or the processing capacity, but it can involve considerations about location, technologies, the nature of the feedstock, and the type of product, which also depends on external factors, such as market conditions [6,11]. Finally, the scale of a biorefinery can also reflect a design type of a biorefinery. De Visser and Van Ree [14] suggest that one promising way to implement integrated biorefineries is to promote small biorefinery initiatives. In this sense, small-scale biorefineries (SSB) emerged as an alternative design to large-scale biorefineries. Many studies have brought up small-scale biorefining, discussing the opportunities and challenges this concept may embody [14,15,16,17]. Contrary to the traditional large-scale biorefineries, SSBs are expected to have lower initial investment and operational costs, shorter transportation distances, lower energy requirements and less capital-intensive technology [18]. They are intended to take advantage of available local resources, involve stakeholders and generate a product market that creates local dynamism and joint development [14]. However, biorefineries present diverse characteristics and the definition of the biorefinery scale in the literature is elusive and lacks objective criteria to discriminate between large and small-scale biorefineries [6,13].
In this work, we test the hypothesis that the scale of a biorefinery can be outlined from studying/analyzing existing biorefineries. Furthermore, we want to use the concept of scale to distinguish classes of biorefineries with similar characteristics. This kind of classification is particularly useful in prospective analysis to assess and compare the sustainability performance of various types of biorefineries in a specific context. It is also a way to address the complexity of these systems, to gain better understanding and to facilitate the dissemination of knowledge toward stakeholders and decision-makers.
Hence, our objective is to specify the concept of scale from data that describe various biorefineries. The paper introduces a way to identify distinct scale-based designs by grouping biorefineries according to factors related to feedstock, process, economy or the mobility of the facility without any predetermined pattern. A data analysis method combining multifactorial analysis and hierarchical clustering was applied to a set of biorefineries processing lignocellulosic biomass. Four classes of biorefineries of different scales were identified, which draws a multifactorial and holistic view of the scale of biorefinery.

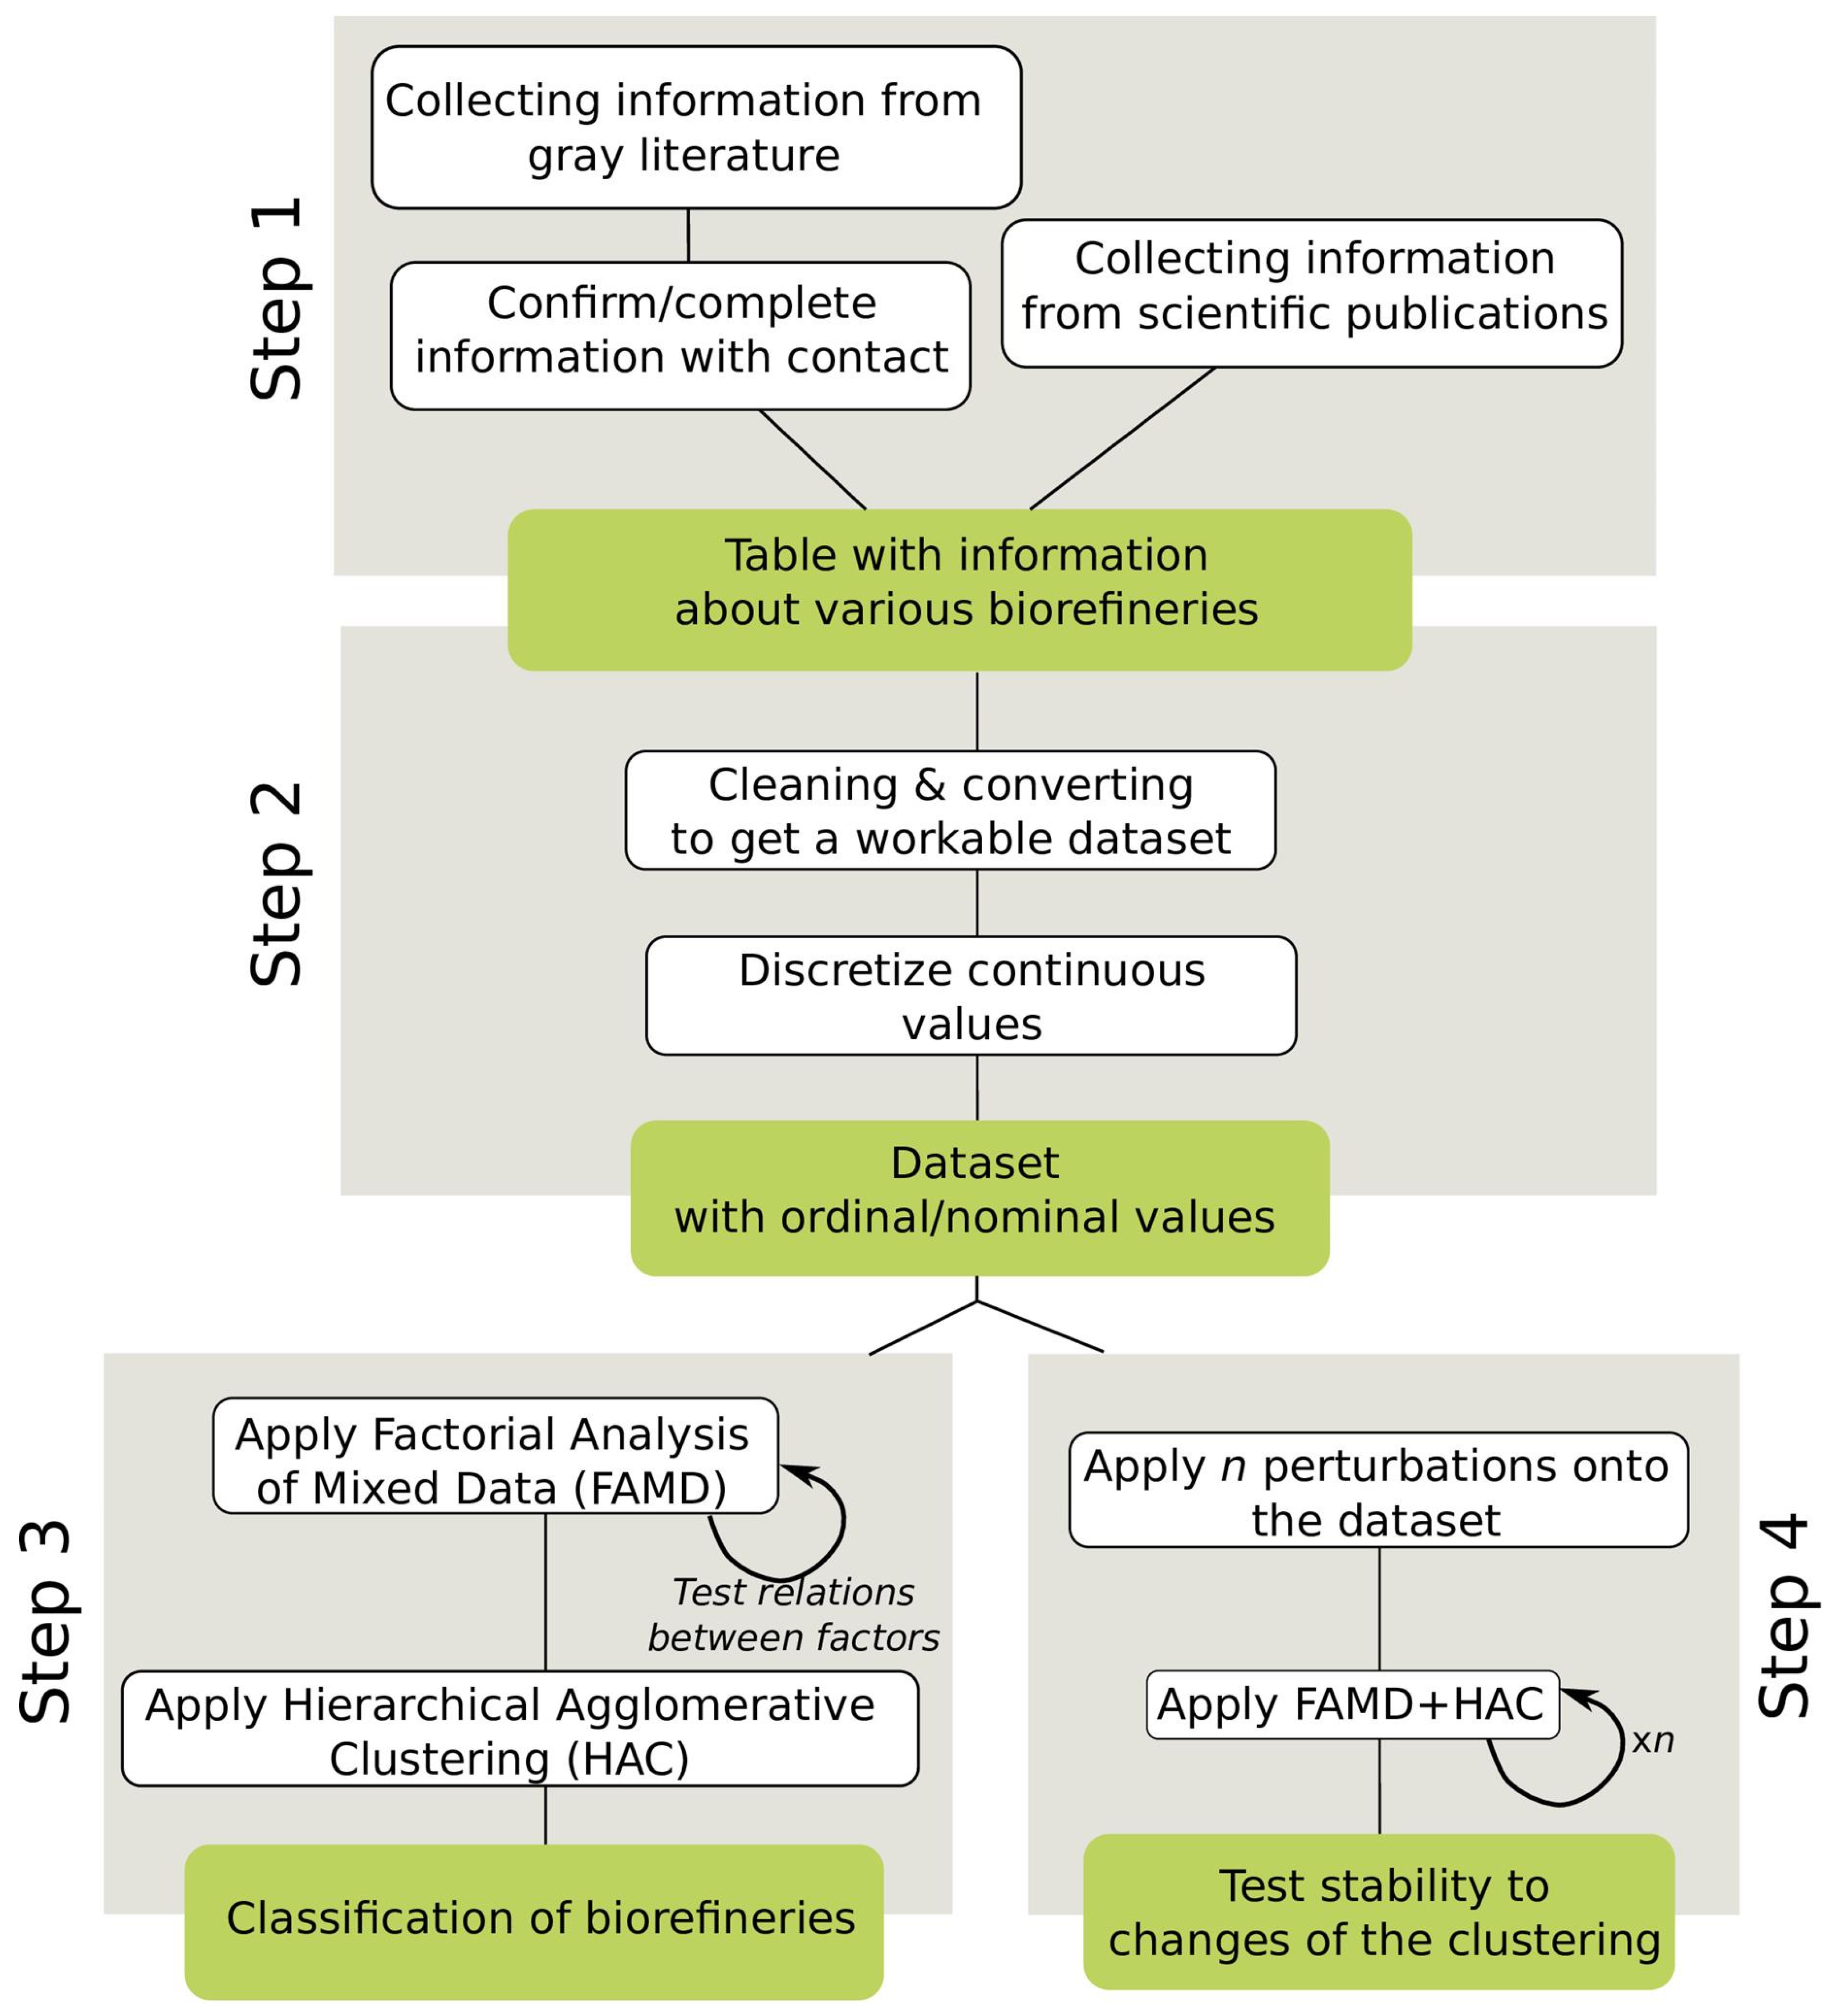
2. Materials and Methods

This paper presents a methodology to build a scale-based classification of biorefineries processing lignocellulosic biomass driven by available data. The approach is bottom-up and unsupervised, in the sense that no preconceived levels of scale are assumed when establishing the classification system. The methodology focuses on characterizing basic strategic choices for various biorefinery projects, starting from disclosed information of heterogeneous quality. A multivariate analysis identifies clusters of biorefineries with similar strategies to reveal how they can be assigned a level of scale. Figure 1 represents the four-step methodology: (1) information about existing biorefineries is collated in a table of information; (2) the table is cleaned, pretreated and encoded to obtain a workable dataset for statistical analysis; (3) a classification of biorefineries is obtained through multivariate analysis combined with unsupervised clustering (no predefined classes or properties are used as inputs); (4) a stability analysis of the classification is carried out by running the clustering method after generating perturbations in the dataset (see Section 2.4).

2.1. Step 1: Collecting Information about Biorefineries

First, general information about biorefineries processing lignocellulosic biomass was collected to build a knowledge/reference base with several case studies. Here, the focus was on biorefinery projects self-defining as small, farm-scale or preprocessing facilities. However, energy and fuel-producing biorefineries, usually regarded as large-scale, were added to the database to increase the diversity of case studies. The information was collected from dedicated web sources such as Biorrefineria Blogspot [19], or from the biorefinery projects’ websites. For each project, the following fields were filled when possible:
  • Identification (project name, comments about why it may be seen as small- or large-scale)
  • Socioeconomic characteristics (geographical area, crop area, investment cost, runtime, direct stakeholders, ownership (public/private), sustainability assessments)
  • Process information (biomass, process type, process scheme, complexity of the process, products, raw material processed, production capacity, flexibility)
A significant part of this information was not publicly disclosed or was missing. Therefore, some project managers were contacted directly to complete the missing information and to further describe their project. Scientific literature was explored as well, to collect additional case studies. The literature search was conducted in the Web of Knowledge database using the following search terms: “small scale” and “biorefinery” or “farm scale” and “biorefinery”. Nine articles were selected but it turned out, in the following steps of the work, that none of them was able to provide factual information about operational case studies, which is practically mandatory to establish a realistic classification.

2.2. Step 2: Building Dataset and Data Pretreatment

The available information about biorefinery projects obtained from step 1 was heterogeneous: it contained figures, texts, expert assessments and so on. Furthermore, certain fields were incomplete, which made the raw information unfit for statistical analysis. A first workable dataset was obtained by selecting the suitable information and by converting it into computable factors, with either continuous, ordinal or nominal values. This selection was performed by dismissing the fields or the biorefinery projects with too much missing information; information unlikely to be used to specify the concept of scale, such as the country of the project, was dismissed as well.
The second step aimed to harmonize the data that described distinct biorefinery configurations with specific conversion pathways, feedstock types, end-products and so on. Such heterogeneity generally makes interrelations between the factors difficult to establish statistically or to understand (due to non-linearity or uncontrolled conditions). To mitigate this risk, it was decided to encode the data into ordinal or nominal values, in order to homogenize the value types, thereby reducing the potential impact of the heterogeneous nature of the data on the results. This involves the discretization of the continuous data as contiguous intervals (or ordinal data).

2.3. Step 3: Establishing a Classification through Clustering Analysis

A clustering analysis was performed by combining a multifactorial data analysis and a hierarchical clustering analysis, according to the methodology reported by Husson et al. [20]. The multifactorial analysis generates the scores for the individuals biorefineries, so as to apply the clustering procedure on the scores scaled to the corresponding eigenvalue.
Factorial analysis of mixed data (FAMD) was the data analysis method used in this work, more precisely, the function FAMD( ) of the FactoMineR R package [21]. FAMD is a multifactorial data analysis method for exploring data with both quantitative and qualitative variables. It is generally described as a mix between principal component analysis for quantitative variables and multiple correspondence analysis for qualitative variables. FAMD is used to visualize the similarities between individual subjects and to study their proximities in Euclidean space [22]. In our case, this method is especially useful: (i) to analyze the interrelations between the factors of the dataset and (ii) to apply the clustering on the scores of the FAMD.
The first step of the analysis reviews the interplay between the factors; if one factor (or more) exhibits no linear relations with the others, it is usually better to rule this factor out of the clustering. This is performed using a leave-one-out strategy: at each run, one factor is removed from the dataset and an FAMD is computed to obtain the percentage of explained variance over the principal components. If removing a factor brings about a large increase of the explained variance percentage, then this factor variance is largely unexplained by the FAMD and should be dismissed from the analysis.
In a second step, a hierarchical clustering was performed on the principal components of the FAMD with the HCPC( ) function of the FactoMineR R package [20]. The hierarchical clustering is a well-known unsupervised learning method that does not make use of pre-existing output categories. We used hierarchical agglomerative clustering (HAC), a classification method that builds a hierarchy of clusters by merging pairs of clusters as the hierarchy moves up. HAC uses measures of dissimilarity between objects to perform clustering following a linkage method (or aggregation index). The distance chosen in this work is the Euclidean distance, and the aggregation index is the unweighted pair-group arithmetic average method.
The classification is obtained by cutting the hierarchy of clusters (usually visualized as a dendrogram) at a selected height to obtain a partitioning of the biorefineries project. While mathematical criteria can be used to compute the cutting height, herein it is driven by expertise to obtain a classification that reflects distinct levels of scales for biorefineries.

2.4. Step 4: Testing HAC Stability over Perturbations in the Dataset

The interpretation of the classification resulting from the clustering analysis can be uncertain, as HAC is a method that is quite sensitive to perturbations in the dataset [23]. To assess the robustness of the classification, we have implemented a simple data perturbation procedure that allows the identification of clusters that are stable, i.e., less affected by perturbations. A common stability test consists of running clustering after removing one factor at a time and then in taking the average of the results [24]. Here the number of factors is not adequate to use this procedure; therefore, we performed an adaptation by excluding a combination of factors from the dataset at a time, instead of only one. The general idea of the procedure is to run the pair FAMD+HAC for every perturbation in order to compute the average level from which two individuals get separated, called the separation level. Then, it is possible to cluster the individuals based on their separation levels. The principle of the procedure is as follows:
  • Generate the combinations of factors;
  • For each combination of factors, exclude the selected factors and run FAMD+HAC to generate a hierarchical clustering visualized as a tree-like representation called dendrogram;
  • Go through each branching from top (2 clusters) to bottom (1 individual per cluster) to compute the matrix of pairwise proximity measures (proportional to the separation level);
  • Average proximity measures over all the combinations to get a single matrix of proximity;
  • Run HAC on the matrix to cluster individuals by pairwise proximities and obtain an average clustering.
The definitions and equations of the procedure are provided in Supplementary Material S1.
Figures reporting statistical analysis results are produced with the R packages ggplot, gplots (heatmap) and factoextra (HAC tree).

3. Results

3.1. Description and Treatment of the Collected Information (Step 1 and Step 2)

A file with information about a total of 24 biorefinery projects collected from websites, surveys and literature is provided in the Supplementary Data. Distinct processes or facilities belonging to the same project are distinguished: GRASSA 1&2 and NETTENERGY1&2. The file was refined first by removing unnecessary and incomplete information. Information in several fields was missing for too many projects—crop area, runtime. Some information was difficult to process as a single factor—process scheme, process flexibility–, and other information was unlikely to be discriminant given the inconsistency of the answers—facility ownership, direct stakeholders. Sorting and synthetizing the information further allowed the obtention of a first consistent dataset with 15 operational case studies and six factors—processing capacity, investment cost, biorefinery mobility, biomass type, added value and process complexity—with the following characteristics:
  • Processing capacity (P.C) in t/day, quantitative variable, value domain: [2, 205];
  • Investment cost (I.C) in M€, quantitative variable, value domain: [<1, 82.5];
  • Biomass type (B.T), nominal variable; modalities are: CoProd for co-product represents the valuable biomass obtained in the production of primary products (e.g., crops) or during monitoring operations such as tree pruning (e.g., NETTENERGY). Waste corresponds to low-quality biomass of null or negative values that has been left out by its owners, as is the case, for instance, for HEPHAETUS that uses agricultural waste from locally harvested selected sorghum. DediBiomass is for dedicated biomass, a raw biomass and a primary product for the biorefinery, as in the case for DATCO, which processes manioc roots.
  • Biorefinery mobility (B.M), nominal variable; modalities are: Centralized, static facility, Mobile, mobile facility. Herein a mobile biorefinery means a facility that has the refining process built on a moving track. This comes in contrast to the conventional stationary centralized organization of biorefineries.
  • Added value (A.V), ordinal variable derived from the product type (see Supplementary Data). Possible product types are bioenergy and heat, biomaterials (bioplastics and polymers), bulk chemicals and biofuels, food additives and fine chemicals. These categories are codified in this order into a scale of five levels of increasing added value (from very low for bioenergy to very high for fine chemicals). This is based on the “Market prices versus market volumes biobased products” classification from de Jong et al. [25];
  • Process complexity (P.Co), ordinal variable, substitutes process type and process scheme (Supplementary Data), given that they provide a too-detailed and hard-to-compute description of the biorefinery process. Modalities of P.Co are: Low, when the process is mainly mechanical and/or thermal and is easily manageable with minimum engineering skills. Medium, when the process is mainly mechanical and chemical or chemical and biotech, with more processing steps than for low-complexity process. High, when many processes (mechanical, chemical and biotech, etc.) are involved, which requires significant engineering resources to run sophisticated facilities.
Codification of the data. To restrict the downside of handling heterogeneous variables for statistical analysis, a codification of P.C, I.C, A.V and P.Co onto an ordinal scale of a maximum of five levels (from very low to very high) was performed, based on domain experts’ interpretations, and on the necessity to ensure all of the levels are represented in the dataset. The ordinal data were coded as 0 (very low), 1 (low), 2 (medium), 3 (high) or 4 (very high) for the sake of statistical analysis. Table 1 shows the end-result of the data codification step. The codification table is presented in (Table S1). Note that, although they have different processing capacities (2 t/day versus 10 t/day), the codification of NETTENERGY 1&2 is similar enough to be in the same codification range.

3.2. Multifactorial Classification of Scale-Based Designs (Step 3)

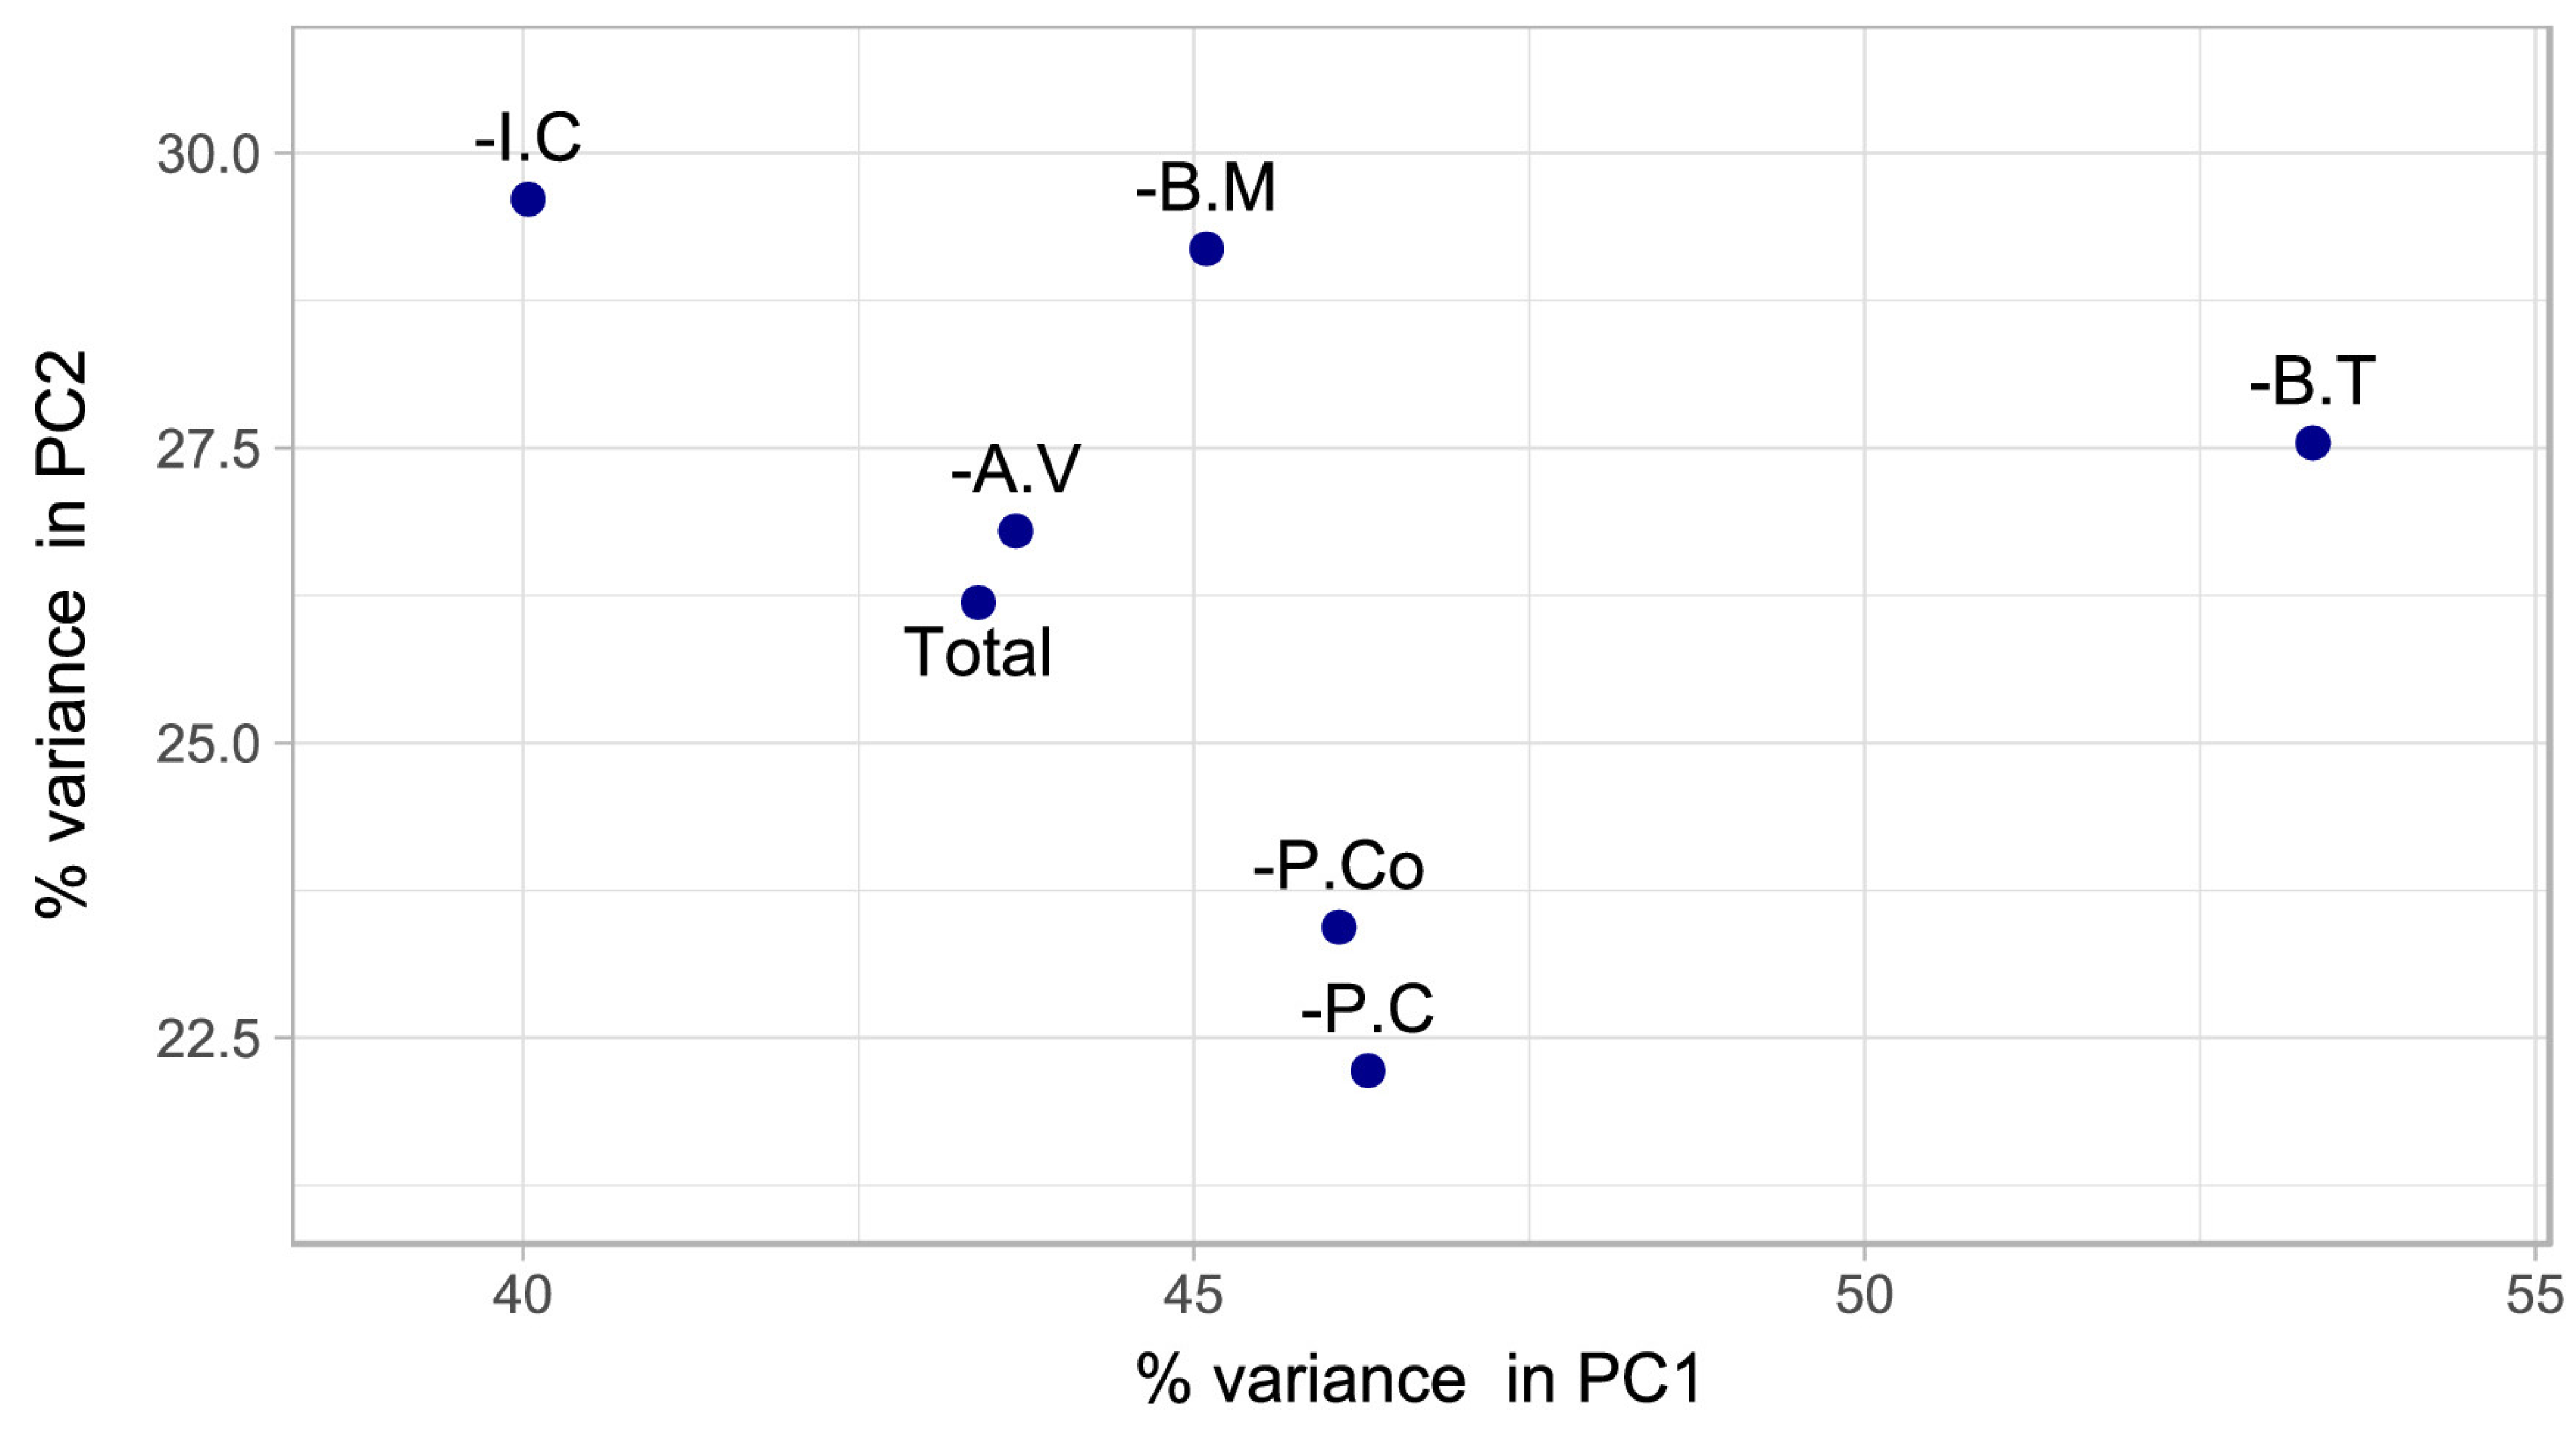
3.2.1. Selecting Factors for Clustering

The relations between the six factors (P.C, I.C, B.M, B.T, A.V, P.Co) were assessed according to the leave-one-out procedure described in Section 2.3. The procedure generates the percentages of variance explained by the principal components of the FAMD when one factor is removed. Figure 2 presents the results for the first and the second principal components. The complete dataset with the six factors (Total in Figure 2) has a total of 69.6% of variance explained by the two principal components. Removing B.T from the dataset brings about a significant increase of the percentage of variance (80.9%). Removing any other factors would only give a negligible decrease or increase of the percentage of variance, except for B.M (74.3%), which remains acceptable. This result shows that B.T is weakly related to the other factors in this dataset. For this reason we chose to rule B.T out of the main clustering analysis; however, we kept B.T to assess the stability of the clusters.

3.2.2. Describing the Relations between the Factors

The relations between the five factors (I.C, P.C, B.M, A.V, P.Co) given by the FAMD are represented in the biplot, Figure 3. Even though the modalities of B.M (Mobile and Centralized in blue) and the quantitative factors (in black) are not represented in the same space, the directions of the arrows still indicate the linear relations between the factors, regardless of their nature. Thus, the graph shows that a centralized plant is related to high I.C and a mobile plant is related to a low I.C. Finally, in our dataset, P.Co is negatively correlated to A.V, while surprisingly, P.C is not strongly correlated to A.V, as one would expect: a negative relation epitomized by the classical production of biofuel (i.e., low A.V, high P.C). Table 1 does include biorefineries complying with a scheme that associates low A.V with high P.C—HEPHAETUS, SAINC BIO—and vice versa—BIOFABRIK, GLAS—however a few biorefineries do not comply with this pattern—NETTERNERGY, MINIDEST, DADTCO.

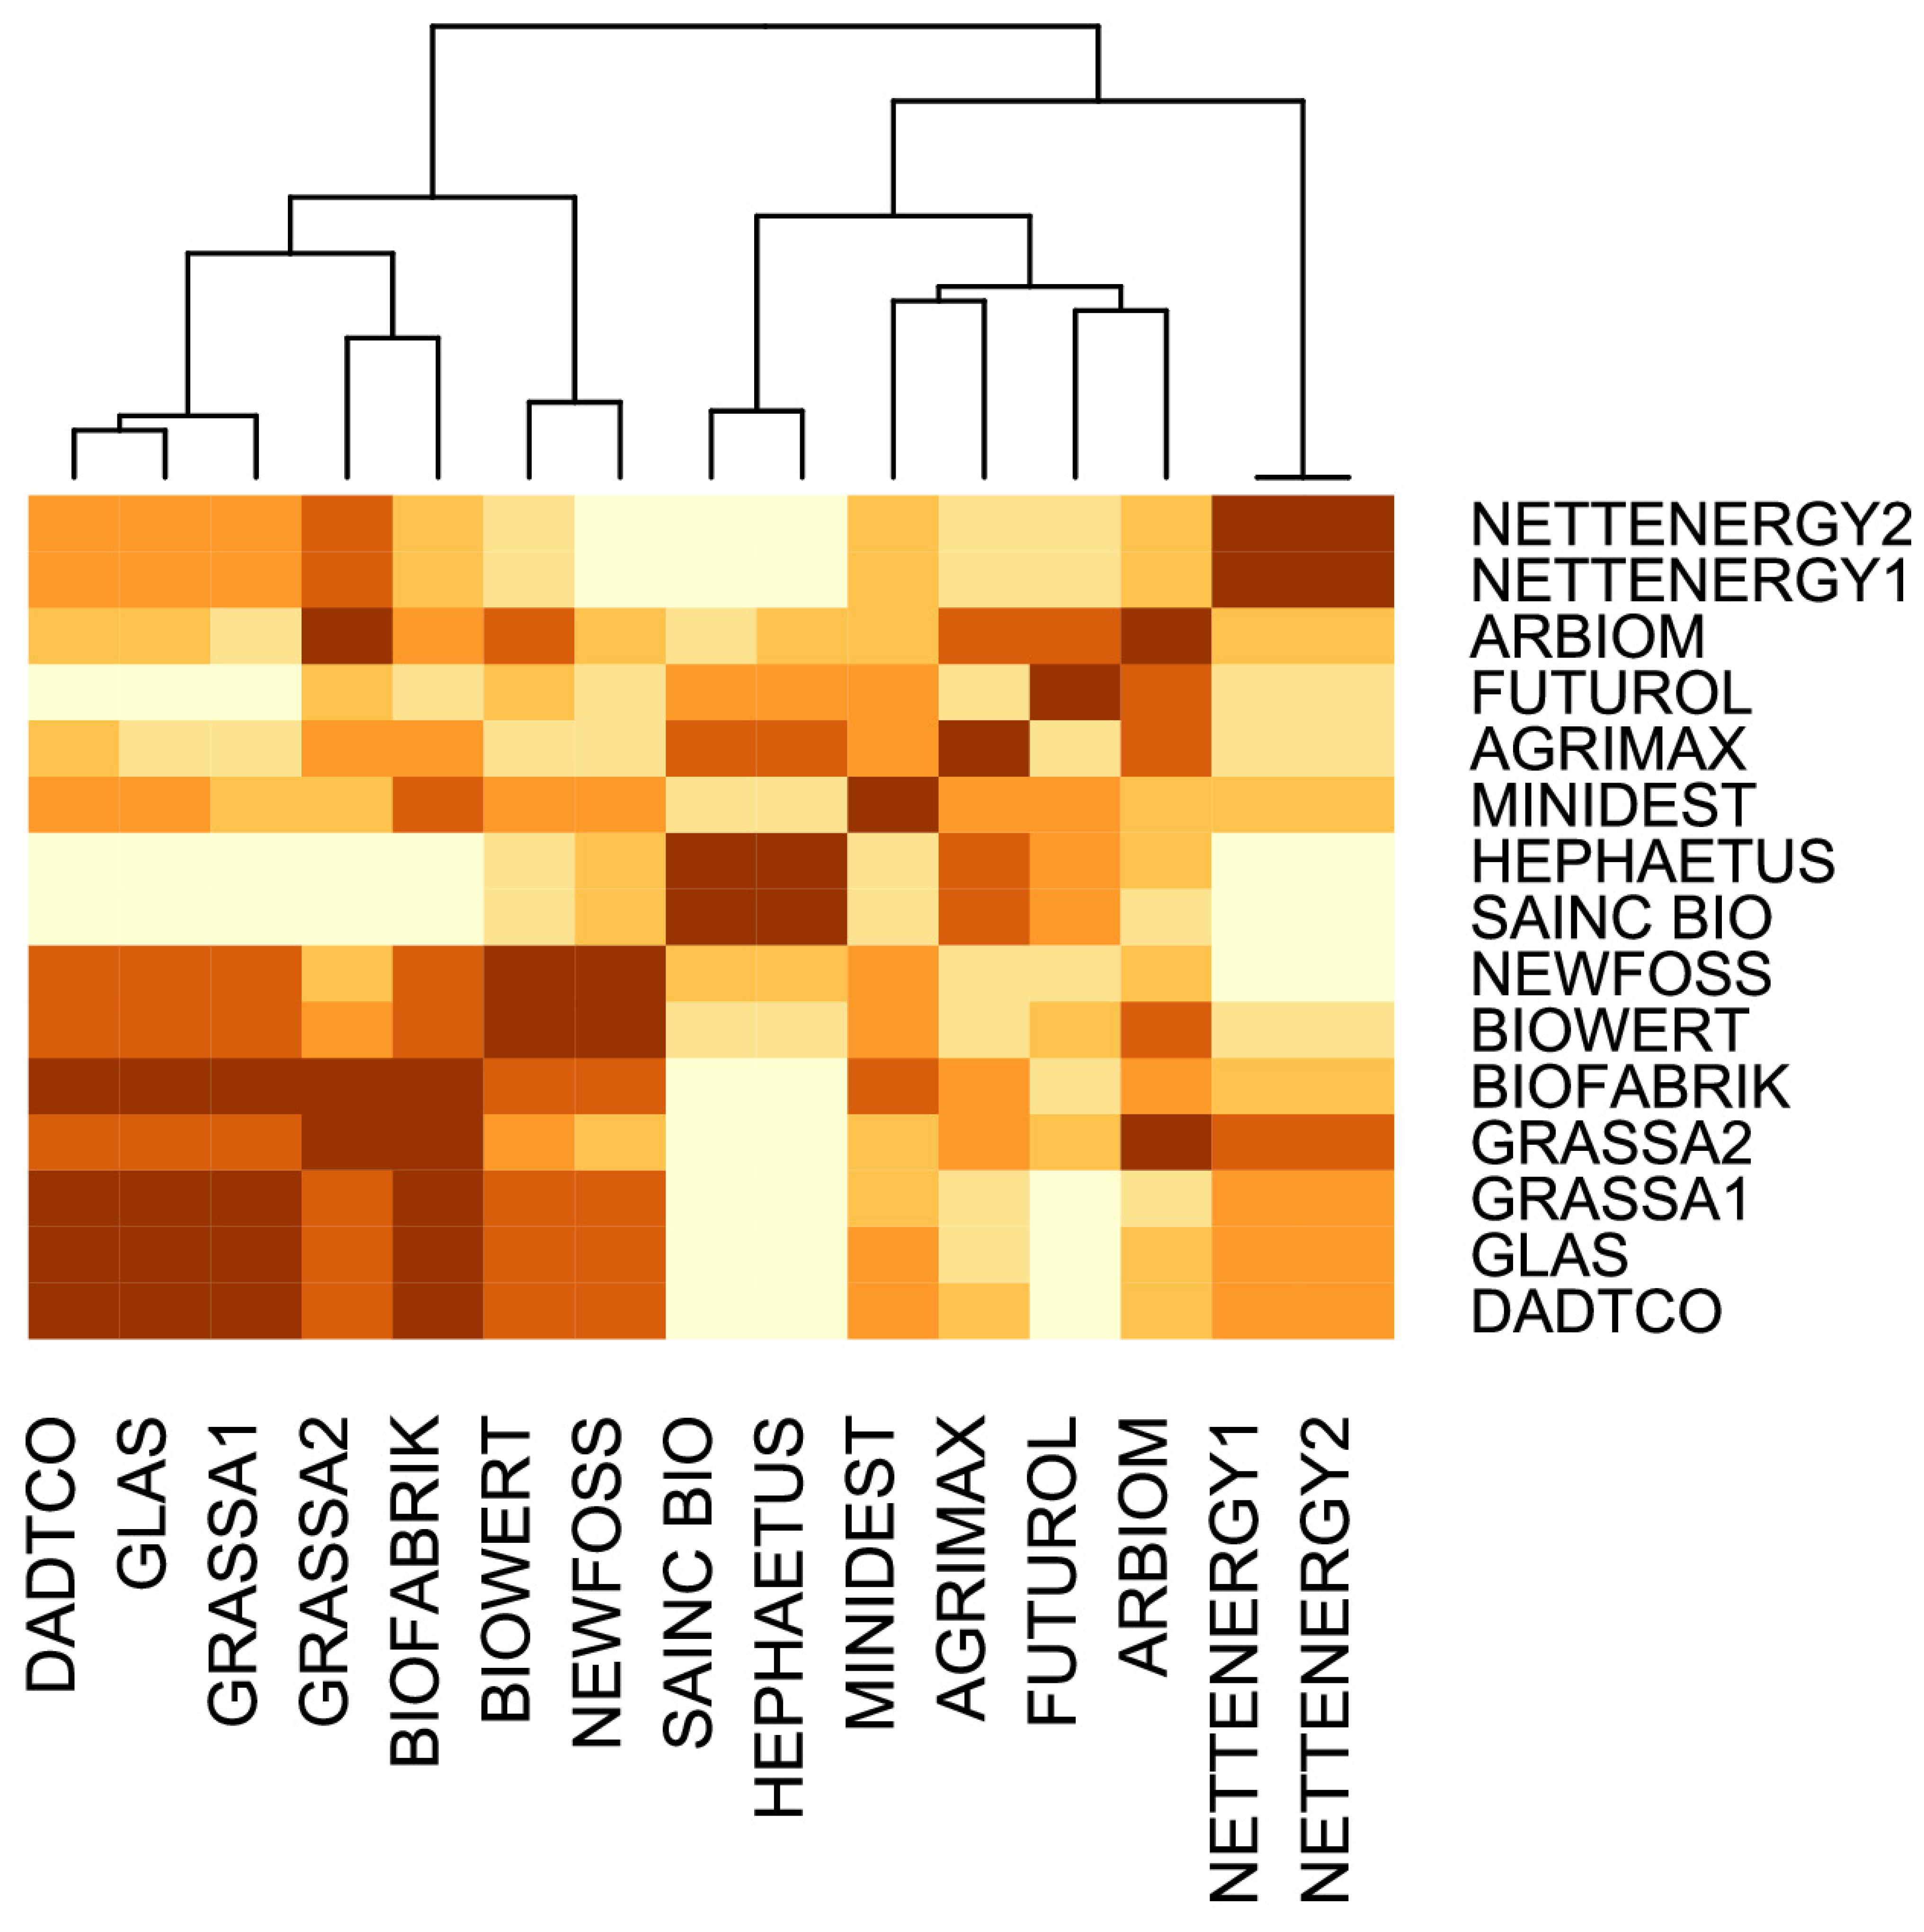
3.2.3. Clustering Results

Clustering is produced by applying the HAC algorithm on the scores of the FAMD. The result is presented as a dendrogram in Figure 4. A representation of a factor map is also provided in Figure S1. Colors indicate four clusters, and the text boxes, placed at various branching points, display the main characteristics of the individuals of that branch compared to the whole. Because NETTENERGY1&2 are identical after the recoding (Table 1), they are always grouped together and serve as a benchmark to aid interpretation. Starting from the top of the figure (that is the trunk of the tree), the clustering distinguishes two clusters based on B.M, P.C and I.C. The cluster on the left embeds 100% of the mobile biorefineries and has low I.C (0.1 against 1.5 for overall mean) and low P.C (0.9 against 1.5 for overall mean), while the cluster on the right is composed of only centralized facilities with high I.C (2.6 against 1.5) and high P.C (2.0 against 1.5). Going down on the left, the cluster NETTENERGY1&2 (in red) stands out with very low P.C (0 against 1.5). The next cluster on the right, in gray, has high A.V (3.2 against 1.9), low I.C (0.2 against 1.5) and low P.Co (1.0 against 1.7). Further, it splits into the mobile biorefineries—GLAS, GRASSA1, DADTCO—and the centralized ones—GRASSA2, BIOFABRIK. Continuing on the right, the yellow cluster—MINIDEST, AGRIMAX, ARBIOM—does not appear to have distinctive features. It includes centralized facilities of limited processing capacities, which represent an intermediary profile in this dataset. This is confirmed by the central position of this cluster’s individuals in the FAMD (Figure S1). The green cluster further on the right gathers biorefineries with high I.C, high P.C and low A.V. This profile gets even more pronounced for—SAINC BIO, HEPHAETUS, and FUTUROL.

3.2.4. A Classification of Scale-Based Designs

The clustering results (Figure 4) distinguish various biorefinery profiles. We selected four clusters, whose interpretable descriptions define four classes of biorefineries with different scales. The four profiles of scale-based designs are described below and in Figure 5:
  • Smallest-Scale Biorefinery. NETTENERGY1&2 characterize the smallest scale biorefinery cluster in our dataset. It is outlined by a low processing capacity (2–10 t/day), a small investment cost (≤1 M€), a mobile facility that can move close to feedstock depots to process it on site. The process converts low energy density and low-value product (e.g., wood residues) into high-energy-density products (bio-oil, biochar), that have low added value. The compactness of the process is crucial to fit in a mobile plant. Small processing capacity and affordable low-complexity technology (pyrolysis) make it inexpensive to build. Finally, the plant produces its own heat and power from the biomass, which favors the circularity of energy consumption and lowers the operational costs. These elements meet some requirements listed by Bramsiepe et al. [26] to obtain viable small-scale biorefineries. The business model is to commercialize truck-scale biorefineries to the producers of biomass feedstocks (farmers, wood producers, municipalities, etc.), who prefer to process the waste with little transportation instead of storing it with little valorization.
  • Small-Scale Biorefinery. This cluster gathers biorefineries with either a mobile—GRASSA1, DADTCO, GLAS—or a centralized facility—GRASSA2, BIOFABRIK. These biorefineries have a low-to-medium processing capacity (≤100 t/day), low investment cost (<2 M€), a mostly mechanical process with low complexity, producing medium-to-high added-value products, such as fibers, proteins and amino acids, inter alia. Looking into the biorefineries’ descriptions (Supplementary Data), one important point of this design is the limitation of the transportation of the feedstock. Mobile units can visit different feedstock depots and farms to transform the biomass close to the production sites, while centralized biorefineries are built in the vicinity of feedstock production sites. In the same line, BIOFABRIK’s principle is to set the conversion process up inside an already existing biogas plant, which provides the necessary infrastructure, as well as large quantities of raw materials. BIOFABRIK brings expertise to biogas plants for converting grass into proteins and amino acids in addition to biogas, without investment or additional expenditure. Moreover, while profiting from the existing machinery, it is environmentally beneficial for having low CO2 emissions [27].
  • Hybrid-Scale Biorefinery. This cluster gathers biorefineries with intermediary characteristics between the small and the large-scale biorefineries. MINIDEST, ARBIOM and AGRIMAX are centralized facilities with low processing capacities (30 t/day on average), variable investment cost and added value, and medium-to-high process complexity.
  • Large-Scale Biorefinery. This cluster gathers centralized biorefineries with the highest investment cost and the highest processing capacity. The process complexity level is high or very high, and the main end-products range from medium-to-low added value. NEWFOSS and BIOWERT are grouped here for their relatively higher added value compared to biorefineries producing mainly energy and bulk chemicals. FUTUROL, SAINC BIO and HEPHAESTUS process corn or sorghum residues to produce mainly ethanol and bulk chemicals. Large-scale biorefineries involve significant logistical costs to collect and manage the volume of feedstock, but the flexibility of the conversion processes can ensure feedstock availability throughout the year and thereby, a controlled collection area and price. Besides, this type of biorefineries aims at benefitting from an economy of scale [28], as is the case for traditional refineries and other industrial sectors [29].

3.3. Stability of the Clusters (Step 4)

To provide an assessment of the stability of the clustering presented in Figure 4, we applied perturbations to the dataset following the procedure described in Section 2.4.
A total of 63 perturbations applied onto the complete dataset (i.e., Table 1) produced 63 distinct clusterings of the biorefineries. Each of the 63 perturbations takes out from zero to five factors from the dataset. Roughly, at each run the procedure keeps track of the separation level, which indicates the branching from which a pair of individuals get separated, starting from separation level = 1 (where a unique cluster contains all the individuals) to a separation level equal to the maximum number of clusters (one individual per cluster). Similar individuals are assigned arbitrarily the maximum separation level value. The heatmap (Figure 6) reports the average separation level over the 63 clusterings. It is reorganized following a hierarchical clustering on the linear correlations.
Figure 6 shows that the clustering obtained with the perturbation and the clustering reported in Figure 4 are different. The major differences take place at the “top” of the dendrogram and can be explained by the inclusion of B.T in the process. For example, the two “top” clusters of the dendrogram of Figure 6 discriminate the biorefineries processing dedicated biomass (on the left) and the biorefineries processing waste or co-product (on the right). This also explains why the mobile NETTENERGY1&2, that process co-product (Table 1) split from a branch with only centralized biorefineries, or why the pair of centralized biorefineries, BIOWERT and NEWFOSS, that process dedicated biomass (Table 1) split from a branch with mobile biorefineries. Figure 4 and Figure 6 have however clusters in common, which are then stable over the perturbations. For example, DADTCO, GLAS, GRASSA1&2 and BIOFABRIK are clustered the same way. A four-classes classification obtained from Figure 6 would actually conserve the smallest and the small-scale biorefinery classes but would distinguish BIOWERT and NEWFOSS as hybrid scale. Hence, the results of stability assessment show that including B.T would produce a partially different classification, certainly less interpretable; however, the distinction between smallest, small and large-scale remain stable over the perturbations.

4. Discussion

4.1. Defining Small-Scale Biorefinery

As far as we know, the majority of articles that addressed the concept of scale in biorefinery (i) associate the scale with the processing/production capacity [12] or (ii) discuss opportunities and challenges for designing small-scale facilities [14,15,17].

4.1.1. Focus on Investment Cost and Processing Capacity in This Work

Usually, the scale of a biorefinery is associated with the plant size or the processing capacity. Classical early-stage cost-estimation methods also relate capital cost with processing capacity through a power function [30], such as:
Capital Cost = Constant * (Processing Capacity) α
If the power factor α is less than 1, the capital cost increases less than proportionately with the plant capacity (economy of scale), and vice-versa if α is more than 1 (diseconomy of scale). The power function is obviously not applicable here as the dataset include distinct kinds of biorefineries. However, the pair—processing capacity and investment cost—might still be sufficient to discriminate the levels of scale. To assess this assumption, the Figure 7 shows the distribution of the 15 biorefineries over these two factors.
Figure 7 portrays the dispersion of the biorefineries over the line SAINC BIO, NETTENERGY1. The former, with the highest investment cost and processing capacity in the dataset, can be labeled as a “large-scale” biorefinery. The latter with the lowest processing capacity and investment cost in the dataset can be labeled as a “small-scale” biorefinery. Despite distinct kinds of biorefineries, there is a general positive power-like relation between the processing capacity and the investment cost, with a power factor α that would be much higher than 1. However, the significant scattering of the points shows that there is a high variability amongst the projects. For example, FUTUROL has an investment cost almost as high as SAINC BIO but half of its processing capacity. Similarly, the investment costs of BIOFABRIK, MINIDEST, GLAS, GRASSA1&2, AGRIMAX and NEWFOSS are all less than 10 M€, yet they present quite distinct processing capacities, ranging between 20 to 140 t/day. Conversely, GRASSA1 and FUTUROL present similar levels of processing capacities but completely different investment cost values. Of course, the apparent discrepancies can be accounted for by additional factors. In the first place, the technology used in the plants may have radically different processing costs. Projects with limited processing capacities, such as NETTENERGY or DADTCO, implement low-cost technologies, respectively thermal and mechanical technologies, and thus, have rather low investment costs. Besides, not all the facilities are at the same operational level. For example, FUTUROL is a pilot plant that took up the technological challenges of second-generation biofuel production [31]. It is only expected that the investment cost be high in comparison to the processing capacity.
The graph in Figure 7 showcases the importance of the investment cost and of the processing capacity for discriminating biorefineries of very distinctive scales. However, the large dispersion of the biorefineries in-between demonstrates that defining scale with only these two factors would be insufficient to build a comprehensive classification for different kinds of biorefinieries. In other words, the ambiguity associated with definition of scale already mentioned in previous works (for example in Serna-Loaiza et al. [13]) would still be present. Therefore, more factors must be included into the analysis to better account for the scale, which is the rationale for the multifactorial data analysis.

4.1.2. A Data-Based Definition of the Scale of Biorefinery

The first understanding of the definition of the scale based mainly on processing capacity can be ambiguous, as the processing of a large amount of raw material is sometimes required to obtain a small amount of final products [13]. To address this ambiguity, a solution is to take into account the dependency of the scale on the process characteristics. This approach was adopted by Serna-Loaiza et al. [13], who associated the scale with an economic evaluation of a specific process in a given context. Small scale is then defined as a trade-off option: the minimum processing scale for economic feasibility, given the technological scheme and the production of available feedstock. Hence, the choice of the scale comes after the choice of a biorefinery type to assess the extent of the feedstock flow, of the equipment and of the plant area. The second understanding refers explicitly to the design of a biorefinery, where small-scale is seen as an alternative to large-scale, which can facilitate the market implementation of a biorefinery [14]. Opportunities, strengths, weaknesses and the design rules of small-scale biorefineries are enumerated in the associated literature [14,15,17]. For instance, selecting partial processing instead of complex technologies, processing biomass on site and recycling water and nutrients are opportunities for local valorization of the products. In addition, mobile plants would avoid costly transportation and feedstock expenses, etc. The scale of a biorefinery is then associated with a design choice that either aims to optimize the economy of scale with high processing capacity, and hence high investment costs, or, aims for minimizing the investment and transportation costs with a suitable process design and proximity to the feedstock resources [32]. Nevertheless, the specification of the biorefinery scale in these works remains partly implicit, and for Aristizábal-Marulanda et al. [6], the boundaries between small and large scales were still not defined by any objective criteria. Accordingly, establishing a definition of biorefinery scale corresponds to the analysis of different trade-offs between contradictory elements. The present work aims to complement the understanding of the biorefinery scale with a data-driven strategy, which specifies important characteristics of distinct scale-based designs, and establishes concrete boundaries. Hence, by analyzing the four classes of scale-based designs (Figure 5), we noticed that the continuum from small to large-scale biorefineries can be accounted for by the two main trade-offs identified in Figure 3.
The first trade-off is between the biorefinery mobility on one side and the pair investment cost, processing capacity (both being positively related) on the other side. Mobile biorefineries represent a solution to process feedstock close to the biomass resources. A more accurate factor would be the distance transportation of the feedstock or the feedstock collection radius (both unavailable for this work). It is natural to think that a high processing capacity is not compatible with the compactness of a mobile biorefinery, or more generally with a settlement close to the feedstock suppliers because it requires a vast collection area. This trade-off has already been studied by Eranki et al. [33], that analysed the scale of the supply chain of a corn stover biorefinery. They estimated that using satellite feedstock depots to process 100 t/day would require a capital cost of 3 M$, and a 10 km collection radius, whereas processing 5000 t/day in a centralized biorefinery, would require 347 M$ and a collection radius of 70 km.
The second trade-off is between the process complexity and the added value. The production of biofuels is an example of low added value products that requires an extensive, and then complex, refining of the biomass through fractionation and biotechnologies approaches that require high level engineering skills and sophisticated processes. Several small-scale biorefineries adopted instead a simpler thermo-mechanical process to produce less refined products which have nevertheless significant added value, such as fiber pulp, protein extract, and fertilizers. The process is easily manageable to enable a facility in the vicinity of the feedstock suppliers with lower need of high level technical skills and also lower processing capacity. We suspect that this trade-off must involve the biomass type, since the higher the value of the raw material is, the higher the added value of the end-product can be (and vice-versa). However, this relation cannot be confirmed with the present dataset.
A biorefinery design plays on several factors, including the mobility of the plant, the process capacity and complexity, the investment cost or the added value of the final products, in search of a sustainable trade-off. Clearly, the concept of scale can be used to enlighten the different strategies of biorefinery systems, in particular the various trade-offs.

4.1.3. Limitations of the Work

The amount and quality of data collected from literature search on the web and from exchanges with biorefinery societies is a limitation to be discussed. Given the exploratory nature of data analysis performed in this work, the dataset had to present sufficient variability, as well as meaningful information. In our experience the existing scientific publications on this topic cannot provide this kind of data, as they are focused on technical aspects and include little information about concrete facilities. Our method also favored an extensive refinement of the data to obtain a usable dataset, making it small. The resulting dataset (Table 1) is coherent and does not contain any outlier that would indicate suspicious data. The discretization step allows working with intervals of values and groups of information instead of specific data, which mitigates greatly the potential impact of approximations and increases confidence in the data analysis. Furthermore, it introduces human expertise into the data analysis process, which can be beneficial in approaching the design of sustainable biorefinery [9]. Obviously, larger datasets are generally better for statistical analysis, however the application of the two techniques (FAMD and HAC) used in this paper are legitimate for a dataset of this size. Two main concerns with small datasets are detecting effects and the stability of the results. Two analyses were performed in that regard: (i) Section 3.2.1 presents the results of the test on the projection of the factors on the FAMD, resulting in the exclusion of biomass type, (ii) Section 3.3 presents the test of clustering stability. Both tests were useful to improve and test the results constancy. They also confirmed the need to test and select the factors prior to the clustering. Overall, the method succeeded in capturing core aspects of the logic underlying the design of the biorefineries. In further studies, appending new data to the dataset, either additional biorefineries or factors, will improve the classification by adjusting the boundaries of the four classes or revealing new sub-classes of scale-based designs. This can be supported by the creation of a global database of biorefinery facilities suitable for regional bioeconomies, as has been done for bioenergy facilities (see for example, https://www.ieabioenergy.com/installations/ (accessed on 9 June 2021))

4.2. Classification Method for Biorefinery Systems

The term biorefinery embraces a large diversity of facilities and systems; hence, specifying different biorefinery types using a common nomenclature is a necessity for the domain. One of the most accomplished classifications of biorefineries in that respect is the classification system developed by the IEA Bioenergy Task Group 42 [4,5,34]. Analyzing the limitations of the previous classification systems, it presented the IEA classification system as a way to specify, unambiguously and at different levels of detail various biorefinery conversion pathways via four main criteria (by order of importance): platforms (intermediate product linking feedstocks and marketable products), products, feedstocks and conversion processes. This classification is also used for explicitly naming biorefinery systems. While the scope of the IEA classification is the conversion pathways from raw to refined bioproducts, a wider scope is needed to specify the performances of biorefinery systems in a biobased economy [35]. In particular, addressing environmental (e.g., reduction of GHG emissions), economical (e.g., market size and price) and social (e.g., employment) aspects would require a holistic approach [10,35,36]. In this purpose, Gnansounou and Pandey [35] proposed a multicriteria analysis method to complement the IEA classification with sustainability criteria. The IEA classification system is fundamentally the result of a top-down approach, i.e., a hierarchy of concepts and criteria defined by domain specialists that specify the different components or aspects of a biorefinery system. Our approach is different since it is bottom-up and more precisely, data-driven and mostly unsupervised, even though human decision-making was still required.

4.3. Future Works

The present classification is currently used as a typology in a scenario analysis with the aim of envisioning the sustainability performance of representative types of biorefineries in selected European regions. The biorefinery types reflect actual facilities and thus, are not defined arbitrarily. Note that building a typology of heterogeneous production systems as a first step of a sustainable assessment study is not uncommon; for example, Díaz-Gaona et al. [37] recently developed a typology of organic livestock farms with this objective in mind, and using the same kind of techniques as the ones we used in this work.

5. Conclusions

This research provides a data-based classification of biorefineries, from which a definition of a small-scale biorefinery is outlined. The classification distinguishes four main types of facilities, which present a progressive change of the scale, from a very small-scale (truck-size) to a large-scale facility. The conventional type of biorefinery is a large-scale centralized facility with high investment costs and processing capacities. The production model of larger biorefineries has a common point with petroleum refineries. On the other hand, SSBs generally operate in the vicinity of feedstock suppliers, using processing plants with low processing capacities, low to medium process complexity, and which require low investment costs to be profitable. The mobility of the units is a sufficient criterion to get an SSB, but it is not mandatory, as centralized SSBs can be sustainable in certain conditions while respecting the above characteristics.
The classification exhibits two structuring trade-offs that account for the differences between the facilities’ production models: (i) the mobility of the facility versus the investment cost and processing capacity, (ii) the process complexity versus the added value. These trade-offs account for the strategies adopted by the biorefineries with regard to the economy of scale and should be studied further with additional data.
Along with the growing development of biorefineries, more data about biorefinery facilities will be available to update and enrich the present classification. The systematic compilation of this kind of data in an open database would greatly favor analogous initiatives and open perspectives to gain insight into biorefinery strategies and into the conditions for viability. Finally, biorefinery is key for sustainable development; however, designing sustainable biorefineries is challenging, as many configurations can be considered. The present biorefinery classification should help focusing on a few representative configurations when conducting sustainability assessments at a regional level. Furthermore, it could help improve the visibility of biorefinery solutions for stakeholders and local authorities.

Supplementary Materials

The following are available online at https://www.mdpi.com/article/10.3390/su13137310/s1, S1: Clustering Stability assessment; Table S1: Codification table into ordinal variables; title, Figure S1: Scatter plot of the FAMD obtained without biomass type, with clustering into six groups; Supplementary Data table: Description of the dataset.

Author Contributions

Conceptualization, A.A.S., K.K., B.C., F.M.; methodology, A.A.S. and K.K.; software, A.A.S., K.K.; validation, A.A.S., K.K.; formal analysis, A.A.S., K.K.; investigation, A.A.S.; data curation, A.A.S., K.K.; writing—original draft preparation, A.A.S., K.K., B.C., F.M.; writing—review and editing, A.A.S., K.K., B.C., F.M.; visualization: A.A.S.; supervision, K.K., B.C. and F.M.; project administration, A.A.S., K.K., B.C. All authors have read and agreed to the published version of the manuscript.

Funding

This research was funded by Region Pays de la Loire and INRAE.

Informed Consent Statement

Not applicable.

Acknowledgments

Acknowledgements are due to the project managers of NETTENERGY, BIOFABRIK, AGRIMAX, ARBIOM and NEWFOSS, who accepted and responded to our questions, replied to interviews and provided us with the necessary information to carry out this study. This work was carried out in the framework of the European Project FLEXIBI from the EraNet JPI FACCE SURPLUS second call: Experimental evaluation of small-scale flexi-feed biorefineries and development of a decision support tool devoted to urban and peri-urban wastes. A project gathering collaborators from Hamburg University, Hamburg University of Technology, Ecole Supérieure du Bois, University of Helsinki, KU Leuven and INRAE as project coordinator.

Conflicts of Interest

The authors declare no conflict of interest.

References

  1. European Commission. Bioeconomy|Horizon. 2020. Available online: https://ec.europa.eu/programmes/horizon2020/en/h2020-section/bioeconomy (accessed on 16 September 2020).
  2. United Nations. Transforming Our World: The 2030 Agenda for Sustainable Development. Available online: https://sustainabledevelopment.un.org/content/documents/21252030%20Agenda%20for%20Sustainable%20Development%20web.pdf (accessed on 25 September 2020).
  3. Heimann, T. Bioeconomy and SDGs: Does the Bioeconomy Support the Achievement of the SDGs? Earths Future 2019, 7, 43–57. [Google Scholar] [CrossRef] [Green Version]
  4. IEA Biorefinery Task 42 Biorefinery. Available online: https://www.iea-bioenergy.task42-biorefineries.com/upload_mm/5/8/2/a47bd297-2ace-44d0-92bb-cb7cc02f75de_Brochure_Totaal_definitief_webs.pdf (accessed on 26 September 2019).
  5. De Jong, E.; Jungmeier, G. Biorefinery Concepts in Comparison to Petrochemical Refineries. In Industrial Biorefineries & White Biotechnology; Elsevier B.V.: Amsterdam, The Netherlands, 2015; pp. 3–33. [Google Scholar] [CrossRef]
  6. Aristizábal-Marulanda, V.; Cardona Alzate, C.A. Methods for Designing and Assessing Biorefineries: Review. Biofuels Bioprod. Biorefin. 2019, 13, 789–808. [Google Scholar] [CrossRef]
  7. FitzPatrick, M.; Champagne, P.; Cunningham, M.F.; Whitney, R.A. A Biorefinery Processing Perspective: Treatment of Lignocellulosic Materials for the Production of Value-Added Products. Bioresour. Technol. 2010, 101, 8915–8922. [Google Scholar] [CrossRef]
  8. Menon, V.; Rao, M. Trends in Bioconversion of Lignocellulose: Biofuels, Platform Chemicals & Biorefinery Concept. Prog. Energy Combust. Sci. 2012, 38, 522–550. [Google Scholar] [CrossRef]
  9. Palmeros Parada, M.; Osseweijer, P.; Posada Duque, J.A. Sustainable Biorefineries, an Analysis of Practices for Incorporating Sustainability in Biorefinery Design. Ind. Crops Prod. 2017, 106, 105–123. [Google Scholar] [CrossRef]
  10. Ubando, A.T.; Felix, C.B.; Chen, W.H. Biorefineries in Circular Bioeconomy: A Comprehensive Review. Bioresour. Technol. 2020, 299. [Google Scholar] [CrossRef]
  11. Daoutidis, P.; Kelloway, A.; Marvin, W.A.; Rangarajan, S.; Torres, A.I. Process Systems Engineering for Biorefineries: New Research Vistas. Curr. Opin. Chem. Eng. 2013, 2, 442–447. [Google Scholar] [CrossRef]
  12. Serna Loaiza, S.; Aroca, G.E.; Cardona, C.A. Small-Scale Biorefineries: Future and Perspectives. In Biorefineries Concepts, Advancements and Research; Torres, I., Ed.; Nova Science Publishers, Inc.: New York, NY, USA, 2017; pp. 39–72. [Google Scholar]
  13. Serna-Loaiza, S.; García-Velásquez, C.A.; Cardona, C.A. Strategy for the Selection of the Minimum Processing Scale for the Economic Feasibility of Biorefineries. Biofuels Bioprod. Biorefin. 2019, 13, 107–119. [Google Scholar] [CrossRef] [Green Version]
  14. De Visser, C.; Van Ree, R. Small-Scale Biorefining. Available online: http://edepot.wur.nl/405718 (accessed on 11 June 2019).
  15. Bruins, M.E.; Sanders, J.P.M. Small-Scale Processing of Biomass for Biorefinery. Biofuels Bioprod. Biorefin. 2012, 6, 135–145. [Google Scholar] [CrossRef]
  16. Clauser, N.M.; Gutiérrez, S.; Area, M.C.; Felissia, F.E.; Vallejos, M.E. Small-Sized Biorefineries as Strategy to Add Value to Sugarcane Bagasse. Chem. Eng. Res. Des. 2016, 107, 137–146. [Google Scholar] [CrossRef]
  17. Kolfschoten, R.C.; Bruins, M.E.; Sanders, J.P.M. Opportunities for Small-Scale Biorefinery for Production of Sugar and Ethanol in the Netherlands. Biofuels Bioprod. Biorefin. 2014, 8, 475–486. [Google Scholar] [CrossRef]
  18. Susmozas, A.; Moreno, A.D.; Romero-García, J.M.; Manzanares, P.; Ballesteros, M. Designing an Olive Tree Pruning Biorefinery for the Production of Bioethanol, Xylitol and Antioxidants: A Techno-Economic Assessment. Holzforschung 2018, 73, 15–23. [Google Scholar] [CrossRef]
  19. Biorrefineria Blogspot. Available online: https://biorrefineria.blogspot.com/p/portada.html (accessed on 1 November 2018).
  20. Husson, F.; Josse, J.; Pagès, J. Principal Component Methods—Hierarchical Clustering—Partitional Clustering: Why Would We Need to Choose for Visualizing Data? Available online: http://factominer.free.fr/more/HCPC_husson_josse.pdf (accessed on 15 September 2020).
  21. Lê, S.; Josse, J.; Husson, F. FactoMineR: An R Package for Multivariate Analysis. J. Stat. Softw. 2008. [Google Scholar] [CrossRef] [Green Version]
  22. Pagès, J. Analyse Factorielle de Données Mixtes. In Revue de Statistique Appliquée; EDP Sciences: Les Ulis, France, 2004; Volume 52, pp. 93–111. [Google Scholar]
  23. Hennig, C. Cluster-Wise Assessment of Cluster Stability. Comput. Stat. Data Anal. 2007, 52, 258–271. [Google Scholar] [CrossRef] [Green Version]
  24. Brock, G.; Pihur, V.; Datta, S.; Datta, S. clValid: An R Package for Cluster Validation. J. Stat. Softw. 2008, 25, 1–22. [Google Scholar] [CrossRef] [Green Version]
  25. De Jong, E.; van Ree, R.; Sanders, J.P.M.; Langeveld, J.W.A. Biorefineries: Giving Value to Sustainable Biomass Use. In The Biobased Economy: Biofuels, Materials and Chemicals in the Post-Oil Era; Langeveld, J.W.A., Sanders, J.P.M., Eds.; Earthscan: Washington, DC, USA, 2010; pp. 111–131. [Google Scholar]
  26. Bramsiepe, C.; Sievers, S.; Seifert, T.; Stefanidis, G.D.; Vlachos, D.G.; Schnitzer, H.; Muster, B.; Brunner, C.; Sanders, J.P.M.; Bruins, M.E.; et al. Low-Cost Small Scale Processing Technologies for Production Applications in Various Environments-Mass Produced Factories. Chem. Eng. Process. Process Intensif. 2012, 51, 32–52. [Google Scholar] [CrossRef]
  27. Muniz Kubota, A.; Dal Belo Leite, J.; Watanabe, M.; Cavalett, O.; Leal, M.; Cortez, L. The Role of Small-Scale Biofuel Production in Brazil: Lessons for Developing Countries. Agriculture 2017, 7, 61. [Google Scholar] [CrossRef] [Green Version]
  28. Ma, S.; Eckhoff, S.R. Economy of Scale for Biomass Refineries: Bulk Densities, Transportation Cost, and Producer Incentives. Trans. ASABE 2014, 57, 85–91. [Google Scholar] [CrossRef]
  29. Richard, T.L. Challenges in Scaling up Biofuels Infrastructure. Science 2010, 329, 793–796. [Google Scholar] [CrossRef] [PubMed] [Green Version]
  30. Tsagkari, M.; Couturier, J.-L.; Kokossis, A.; Dubois, J.-L. Early-Stage Capital Cost Estimation of Biorefinery Processes: A Comparative Study of Heuristic Techniques. ChemSusChem 2016, 9, 2284–2297. [Google Scholar] [CrossRef] [PubMed]
  31. Schieb, P.-A.; Lescieux-Katir, H.; Thénot, M.; Clément-Larosière, B. Biorefinery 2030: Future Prospects for the Bioeconomy; Springer: Berlin/Heidelberg, Germany, 2015. [Google Scholar] [CrossRef]
  32. Clark, J.H.; Deswarte, F.E.I. The Biorefinery Concept—An Integrated Approach. In Introduction to Chemicals from Biomass; Clark, J., Deswarte, F., Eds.; John Wiley & Sons, Ltd.: Hoboken, NJ, USA, 2008; pp. 1–20. [Google Scholar] [CrossRef]
  33. Eranki, P.L.; Bals, B.D.; Dale, B.E. Advanced Regional Biomass Processing Depots: A Key to the Logistical Challenges of the Cellulosic Biofuel Industry. Biofuels Bioprod. Biorefin. 2011, 5, 621–630. [Google Scholar] [CrossRef]
  34. Cherubini, F.; Jungmeier, G.; Wellisch, M.; Willke, T.; Skiadas, I.; van Ree, R.; de Jong, E. Toward a Common Classification Approach for Biorefinery Systems. Biofuels Bioprod. Biorefin. 2009, 534–546. [Google Scholar] [CrossRef]
  35. Gnansounou, E.; Pandey, A. Classification of Biorefineries Taking into Account Sustainability Potentials and Flexibility; Elsevier BV: Amsterdam, The Netherlands, 2017. [Google Scholar] [CrossRef]
  36. Langeveld, J.W.A.; Dixon, J.; Jaworski, J.F. Development Perspectives of the Biobased Economy: A Review. Crop Sci. 2010, 50 (Suppl. 1), S-142–S-151. [Google Scholar] [CrossRef]
  37. Díaz-Gaona, C.; Sánchez-Rodríguez, M.; Rucabado-Palomar, T.; Rodríguez-Estévez, V. A typological characterization of organic livestock farms in the Natural Park Sierra de Grazalema based on technical and economic variables. Sustainability 2019, 11, 6002. [Google Scholar] [CrossRef] [Green Version]
Figure 1. Flowchart of the methodology to generate a classification of biorefineries from collected information.
Sustainability 13 07310 g001
Figure 2. Percentage of variance on the two first principal components of the FAMDs for different combination of factors. Total is the complete dataset (Table 1), -I.C removing Investment Cost, -B.M: removing Biorefinery Mobility, -A.V removing Added Value, -P.C removing Processing Capacity, -P.Co removing Process Complexity, -B.T removing Biomass Type.
Sustainability 13 07310 g002
Figure 3. Biplot with, as blue arrows, the biorefinery mobility modalities-Mobile, Centralized-represented by their projections on PC1 and PC2 and, as black arrows, the others factors coordinates that represent correlations with PC1 and PC2.
Sustainability 13 07310 g003
Figure 4. Dendrogram from HAC without biomass-type data. I.C: investment cost, B.M: biorefinery mobility, A.V: added value, P.C: processing capacity, P.Co: process complexity. Coloring reflects a four-cluster classification. Annotations on selected branching present the main characteristics of the cluster versus the whole. Each modality of the nominal factor B.M is reported as follows: B.M = [Modality] [% of individuals with this modality in the cluster] [% of individuals in this cluster that present this modality] [significant level of p value of a χ2-test (* < 0.05, ** < 0.01)]. Information for quantitative factors are: [Mean in cluster/Overall Mean in the dataset] [significance level for a p value of v-test] [20]. Note that the statistical tests are used to select and rank salient factors in a cluster.
Sustainability 13 07310 g004
Figure 5. Radar charts of the biorefinery scale-based design classes. (ad) represent respectively smallest, small, hybrid and large-scale trade-off radar charts. Note that biorefinery mobility (B.M) has only two qualitative modalities: “Mob”, for mobile and “Centr” for centralized.
Sustainability 13 07310 g005
Figure 6. Heat map that represents roughly the average separation level between the biorefineries over the perturbation procedure. The darker the color, the higher the separation level is and thereby, the more proximity there is between two biorefineries.
Sustainability 13 07310 g006
Figure 7. Scatter plot of investment cost and processing capacity for the biorefineries of the data set. The dashed line represents a power function added as a guide for the eyes.
Sustainability 13 07310 g007
Table 1. The encoded dataset for clustering analysis.
CASE STUDIESProcess CapacityInvestment CostBiorefinery MobilityBiomass TypeAdded ValueProcess Complexity
DADTCO11MobileDediBiomass31
BIOWERT23CentralizedDediBiomass21
NEWFOSS32CentralizedDediBiomass21
GRASSA120MobileDediBiomass31
GRASSA210CentralizedCoProd31
BIOFABRIK10CentralizedDediBiomass41
SAINC BIO34CentralizedWaste12
NETTENERGY100MobileCoProd12
NETTENERGY200MobileCoProd12
MINIDEST11CentralizedDediBiomass13
GLAS10MobileDediBiomass31
HEPHAETUS33CentralizedWaste02
FUTUROL24CentralizedCoProd03
ARBIOM13CentralizedCoProd32
AGRIMAX11CentralizedWaste22
Publisher’s Note: MDPI stays neutral with regard to jurisdictional claims in published maps and institutional affiliations.

