
Perceived Trip Time Reliability and Its Cost in a Rail Transit Network


Abstract
:1. Introduction
2. Literature Review
3. Methodology
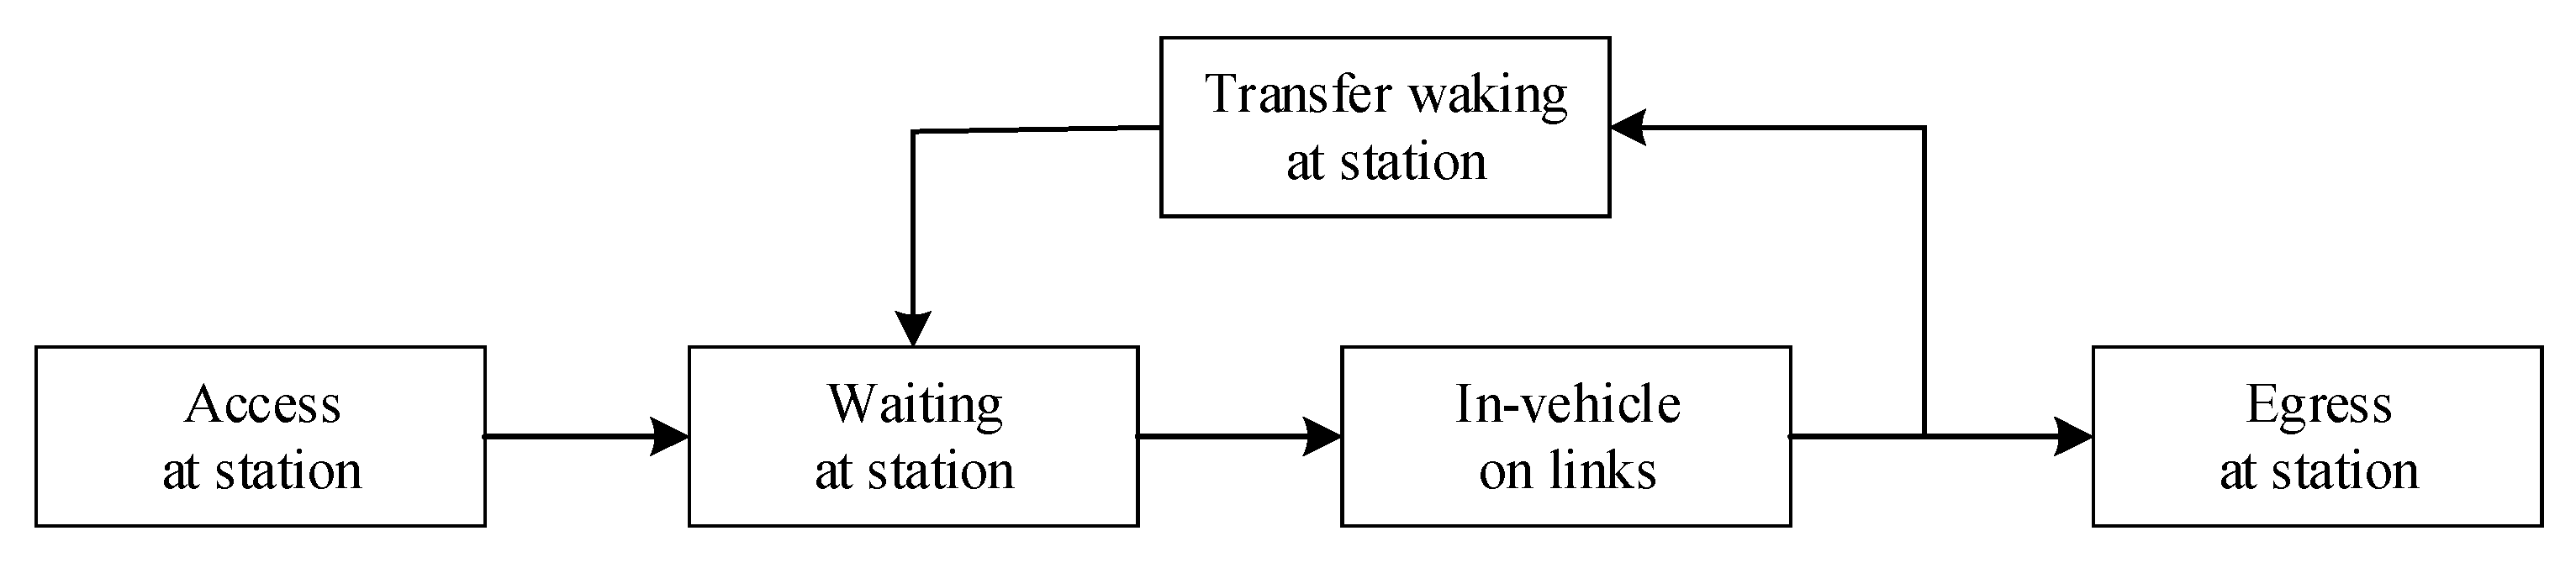
3.1. Passenger’s Clock-Based Trip Time and PTT
3.2. Probability Distributions of Clock-Based Trip Time Components
3.2.1. Probability Distributions of Walking Time
3.2.2. Probability Distributions of Waiting Time
- (1)
- Probability Distribution of Waiting Time on Frequency-based Lines
- (2)
- Probability Distribution of Waiting Time on Schedule-based Lines
3.2.3. Probability Distribution of In-Vehicle Time
3.3. PTR and PTRC Metrics
3.3.1. PTR and PTRC on a Path
3.3.2. PTR and PTRC among OD Pairs
3.3.3. PTR and PTRC on Lines
3.3.4. PTR and PTRC in an RTN
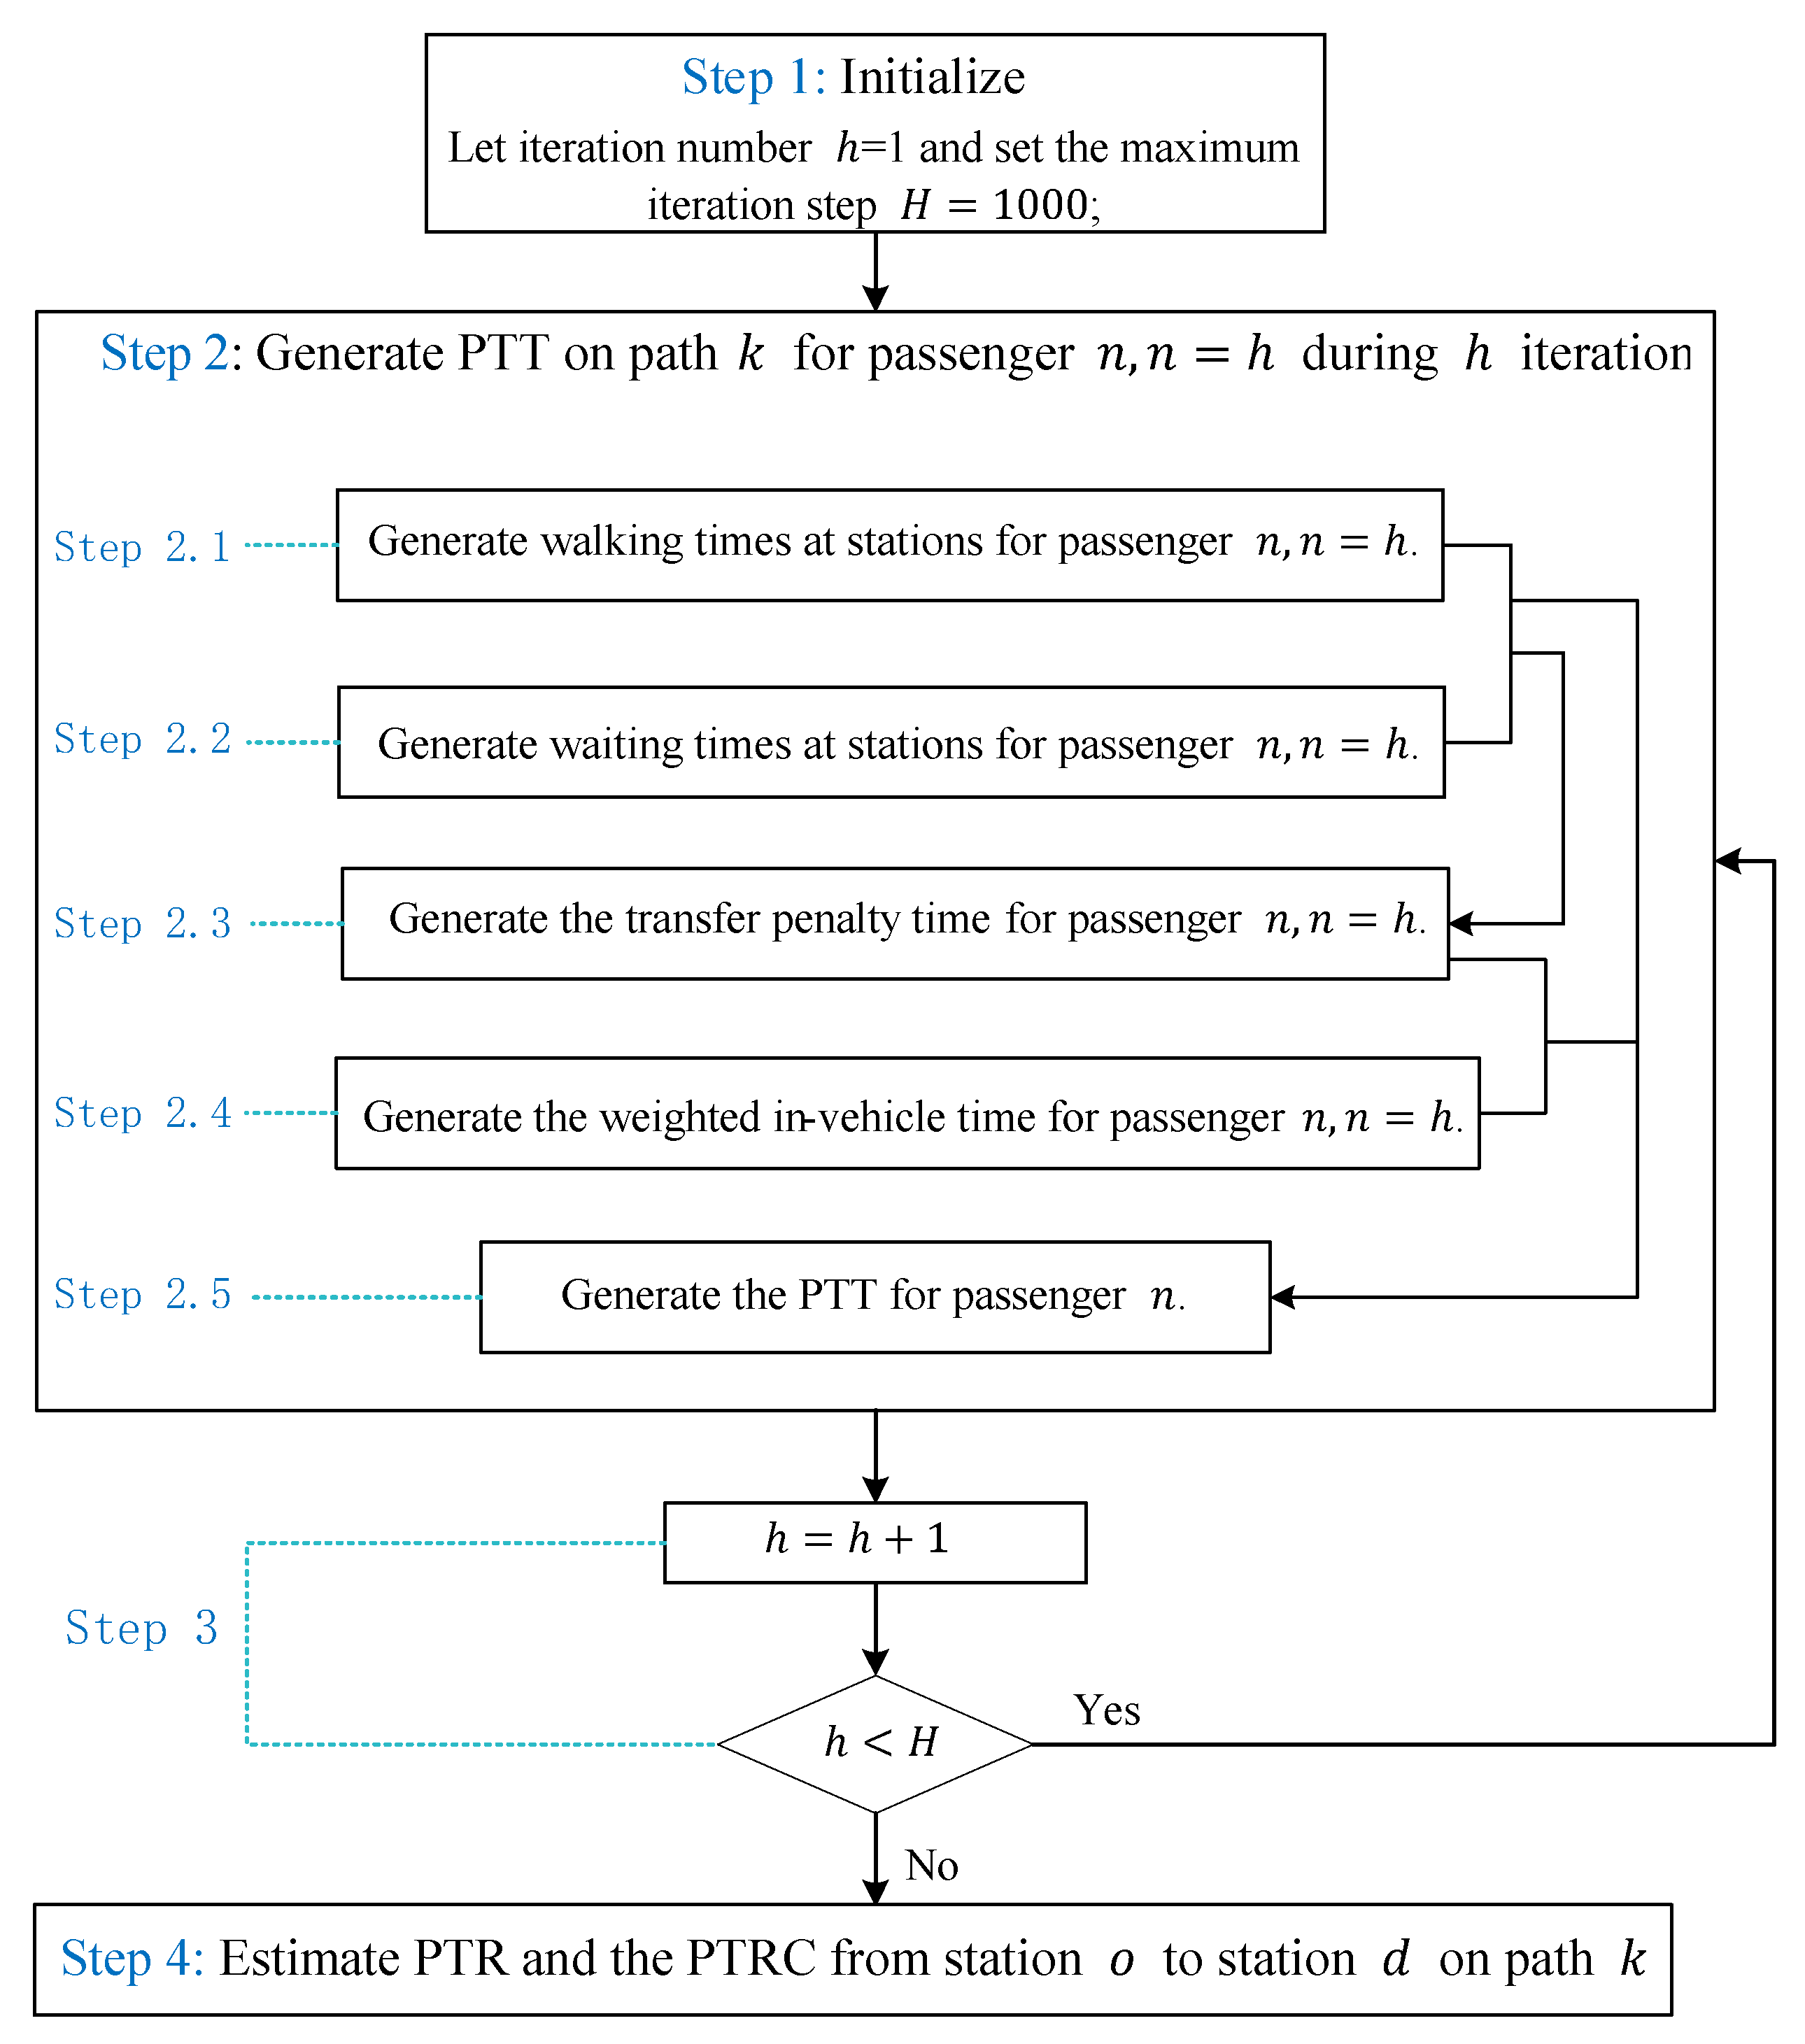
3.4. PTR and PTRC Estimation Based on Passenger Trip Assignment and Monte Carlo Simulation
3.4.1. The Length-Based C-Logit Stochastic User Equilibrium Model
3.4.2. The Method of Successive Weighted Averages
- Step 1:
- Set the iteration’s number , the algorithm variable , the algorithm parameter , and the stop iteration criterion . The effective path sets among OD pairs are determined using Yen’s algorithm. The PTTs of paths in the effective travel path sets are computed without considering passenger flow.
- Step 2:
- Passenger trips are assigned to the RTN with Equations (23) and (24) according to the PTTs of effective travel paths to compute passenger flow on each link, which is represented as .
- Step 3:
- The PTTs of effective travel paths among OD pairs are computed according to the passenger flows on links . The passenger trips among OD pairs are assigned to the RTN again. The passenger flow on each link, is recomputed.
- Step 4:
- Let , and . Passenger flows on links are updated with Equation (28):
- Step 5:
- Convergence assessment. If , then stop iterating and is the passenger flow after passenger trip assignment; otherwise, go to step 3.
3.4.3. The Method of Successive Weighted Averages
4. Case Study
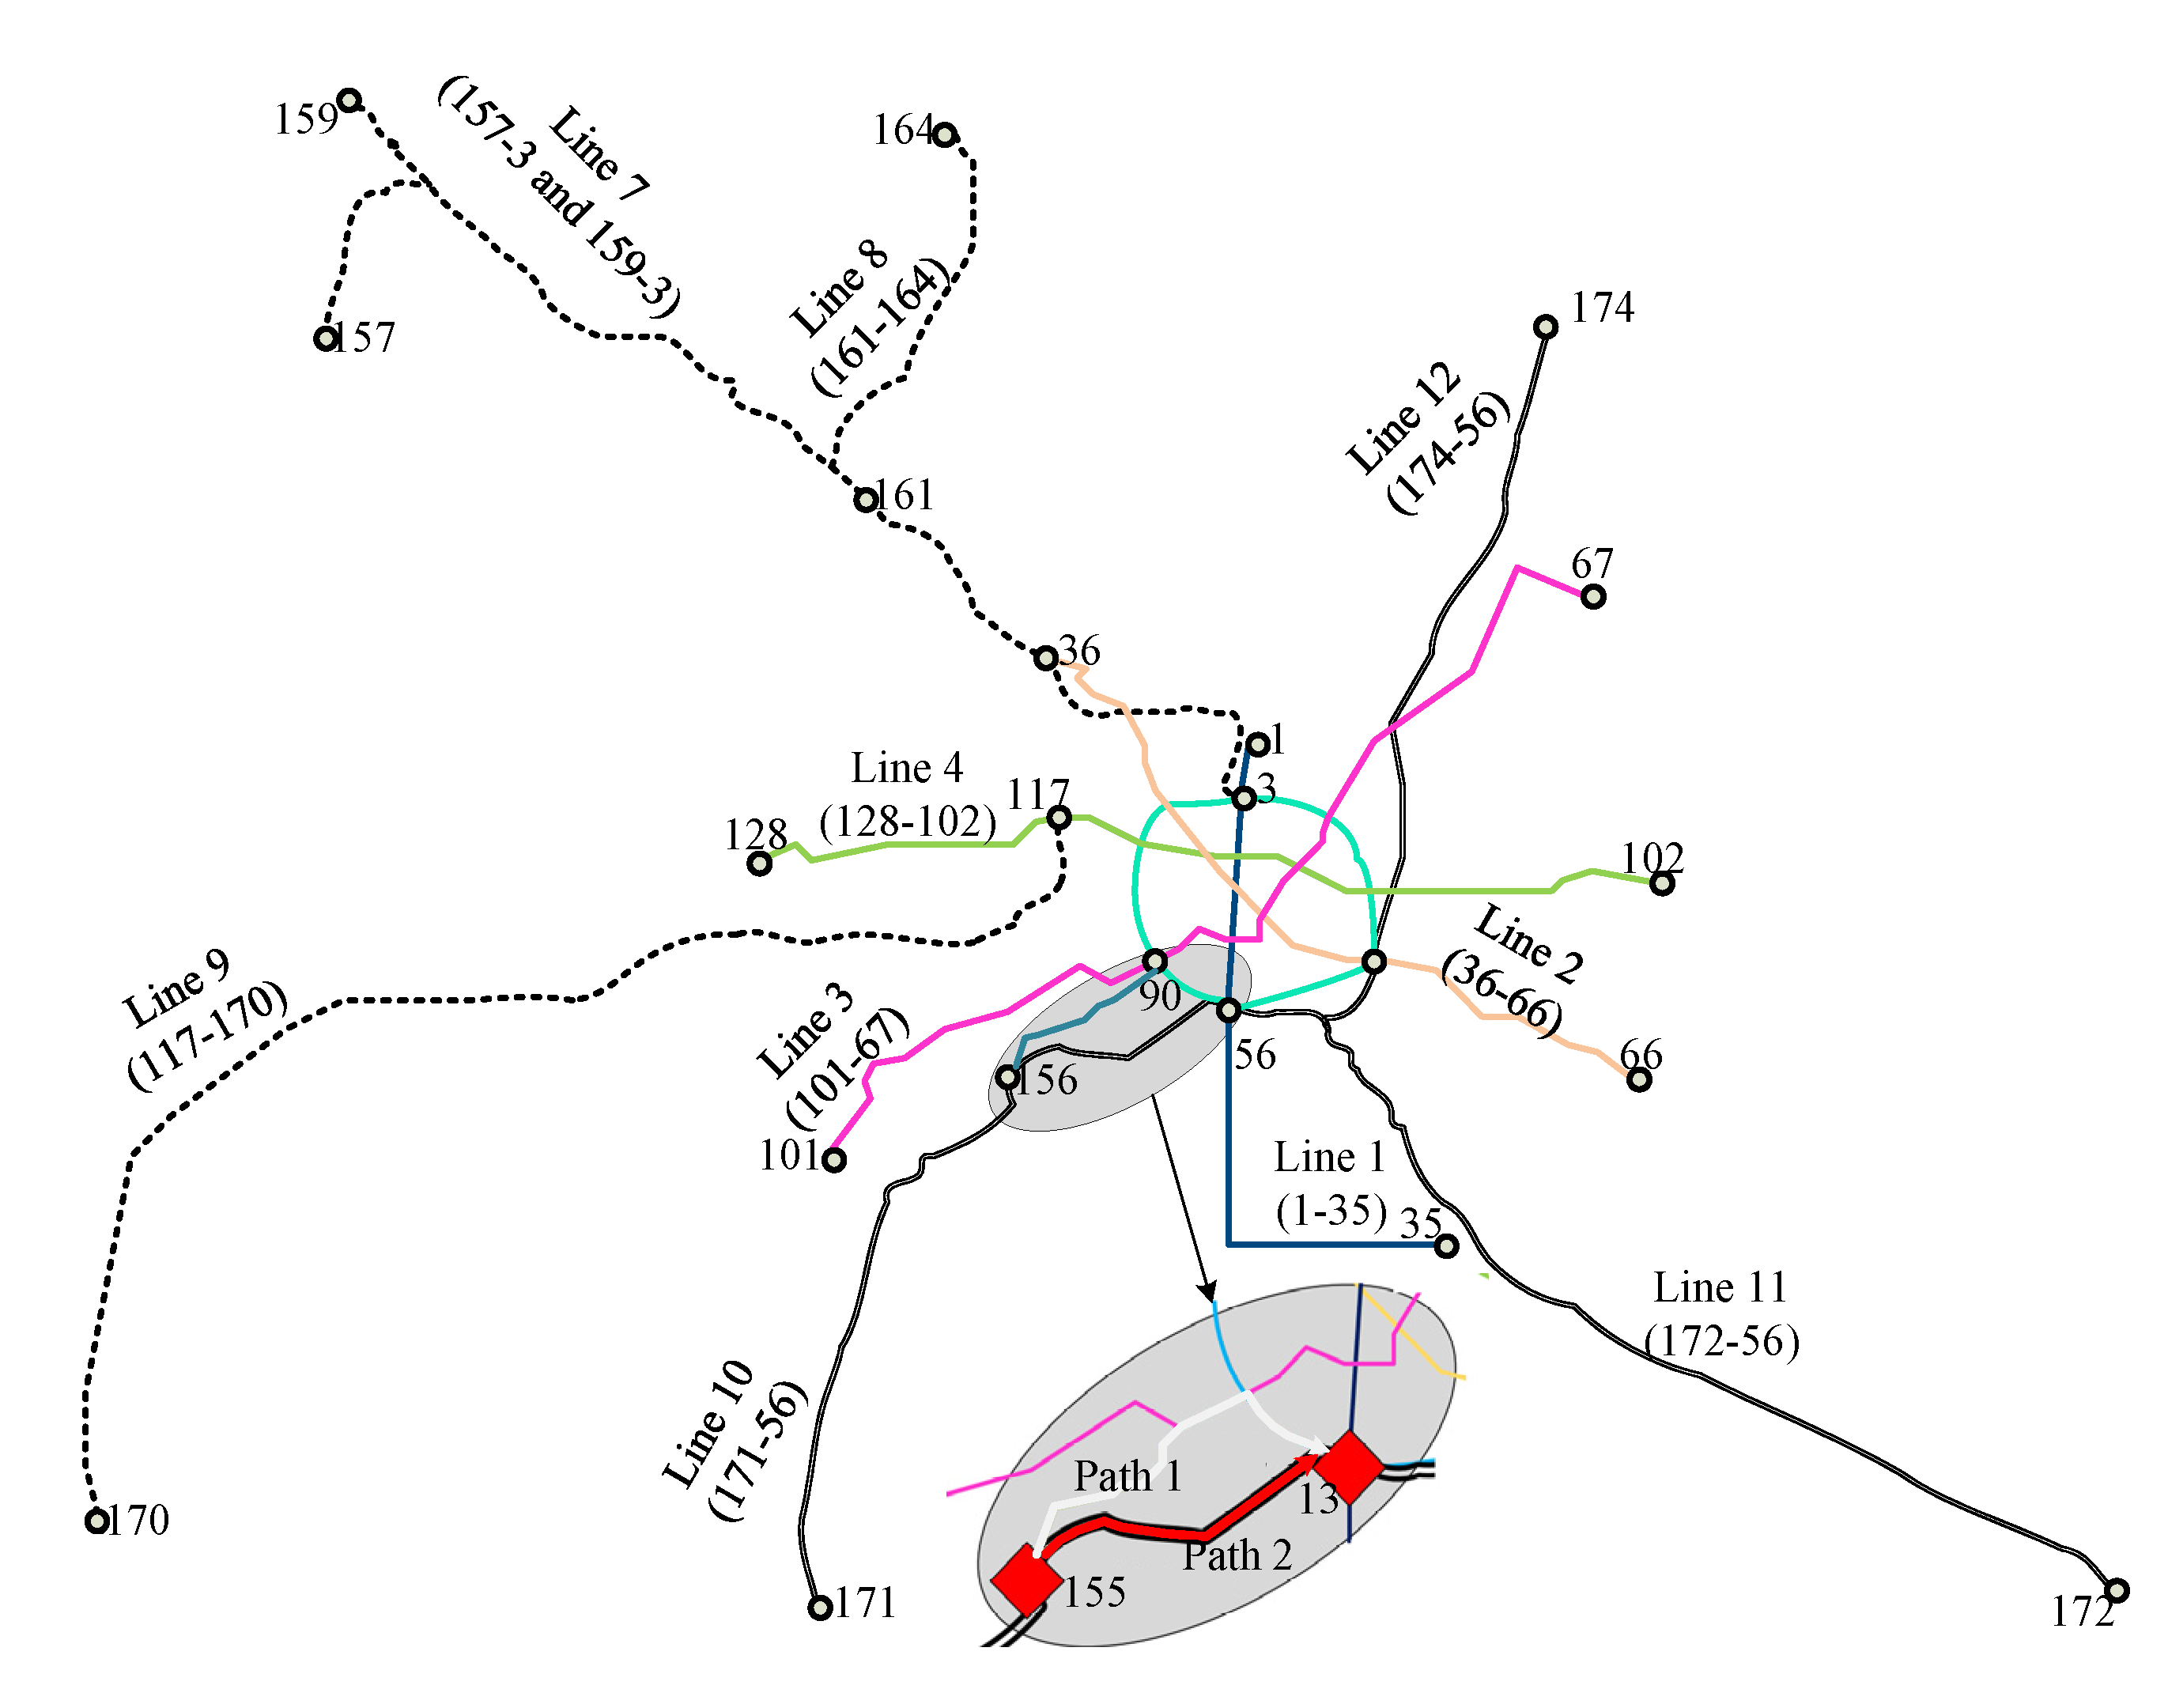
4.1. Chengdu’s RTN
4.2. Chengdu’s RTN Operation Data and Surveyed Data
4.3. PTR and PTRC Estimation
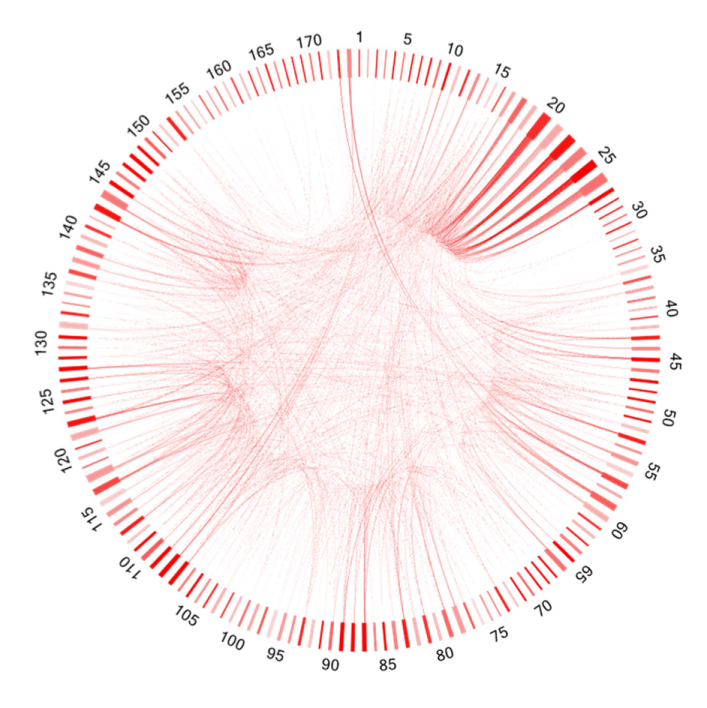
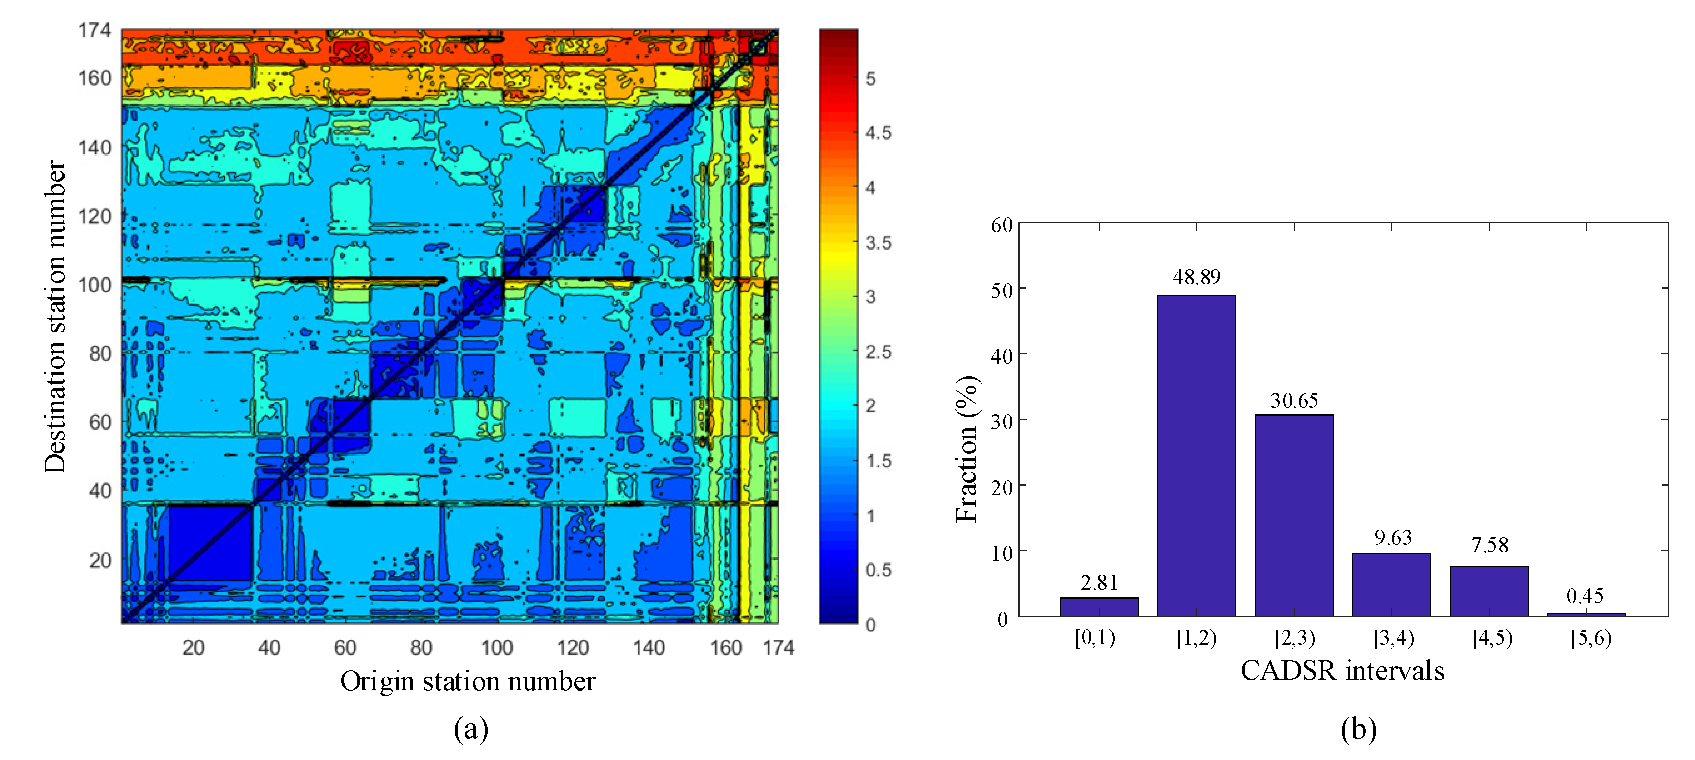
4.3.1. PTR and PTRC among OD Pairs
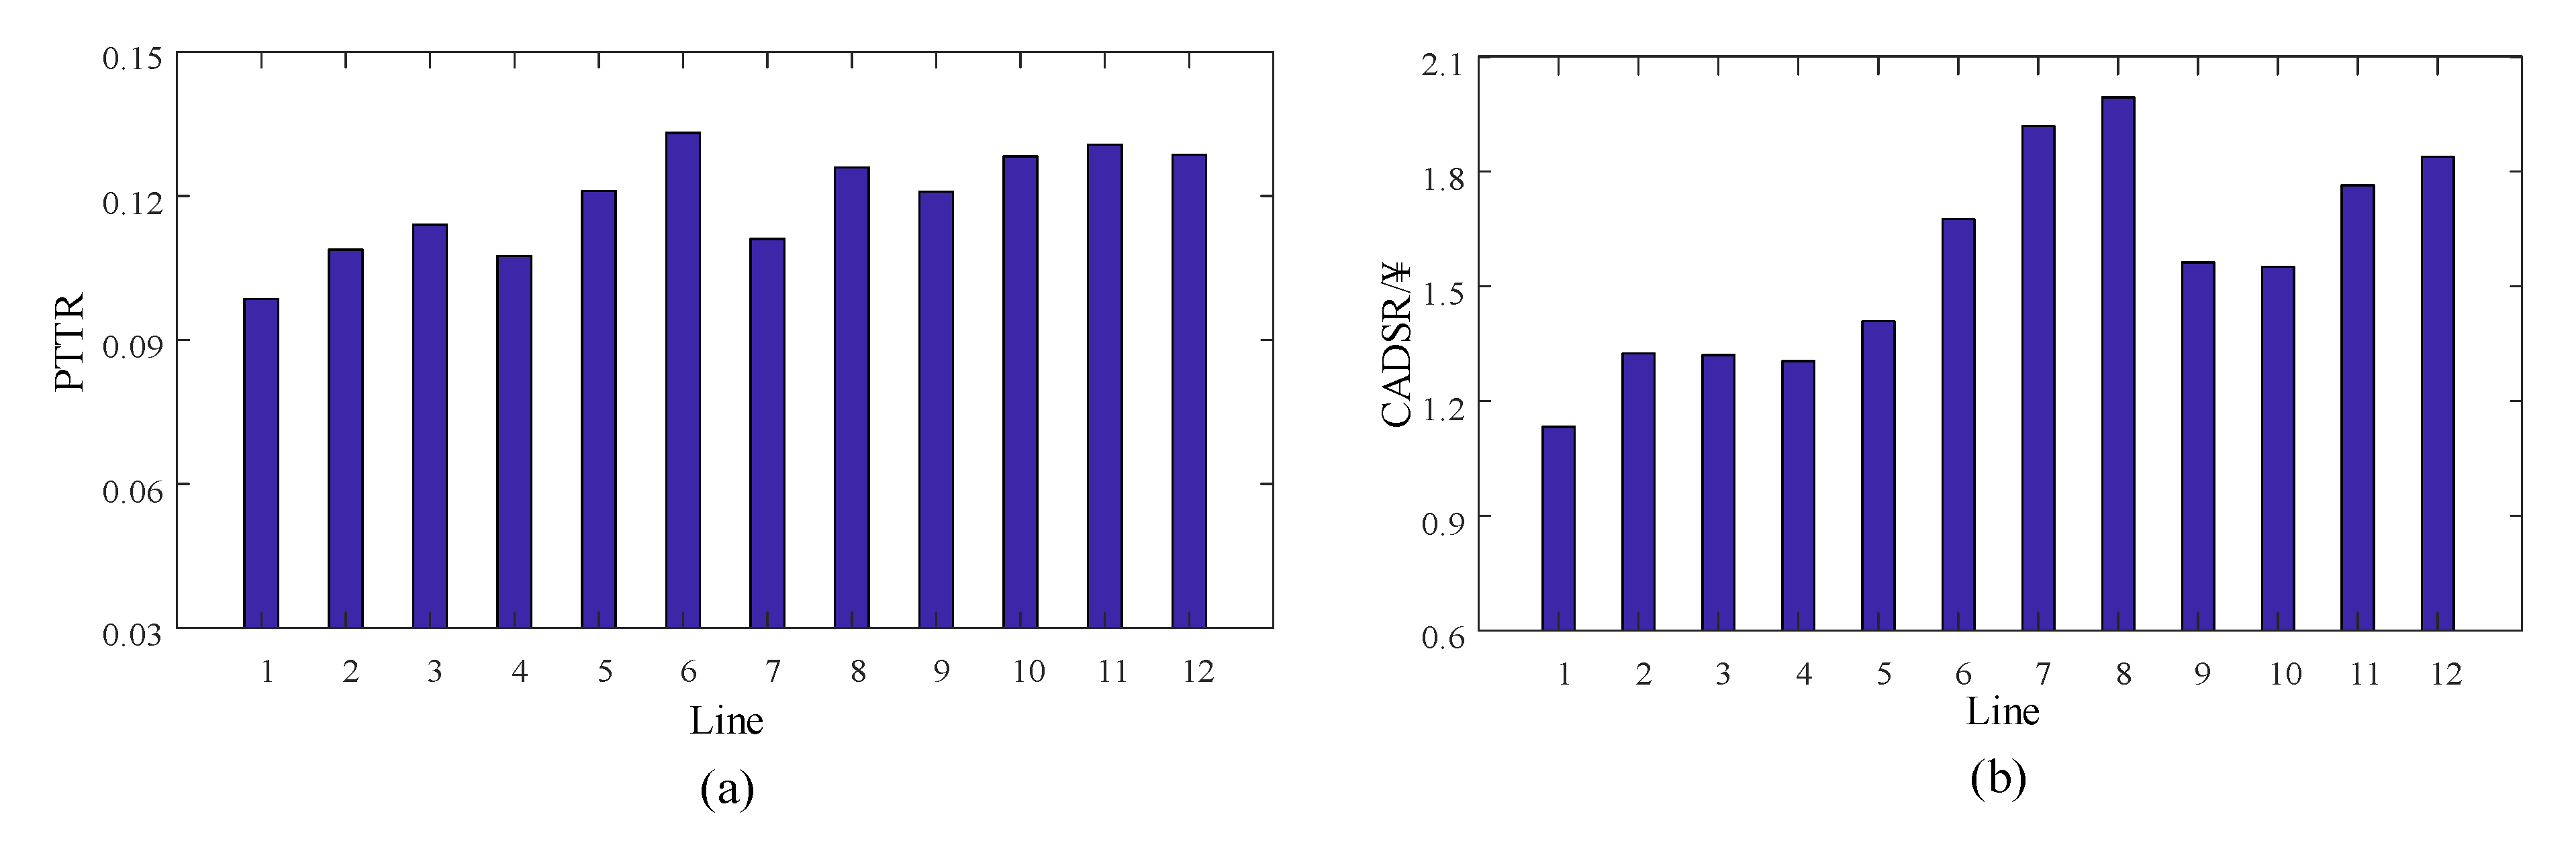
4.3.2. PTRs and the PTRCs on Lines and on the RTN
4.4. Regression Analysis Relating PTRs and PTRCs to Influential Factors
4.4.1. Regression Models Relating PTR and PTRC to Influential Factors
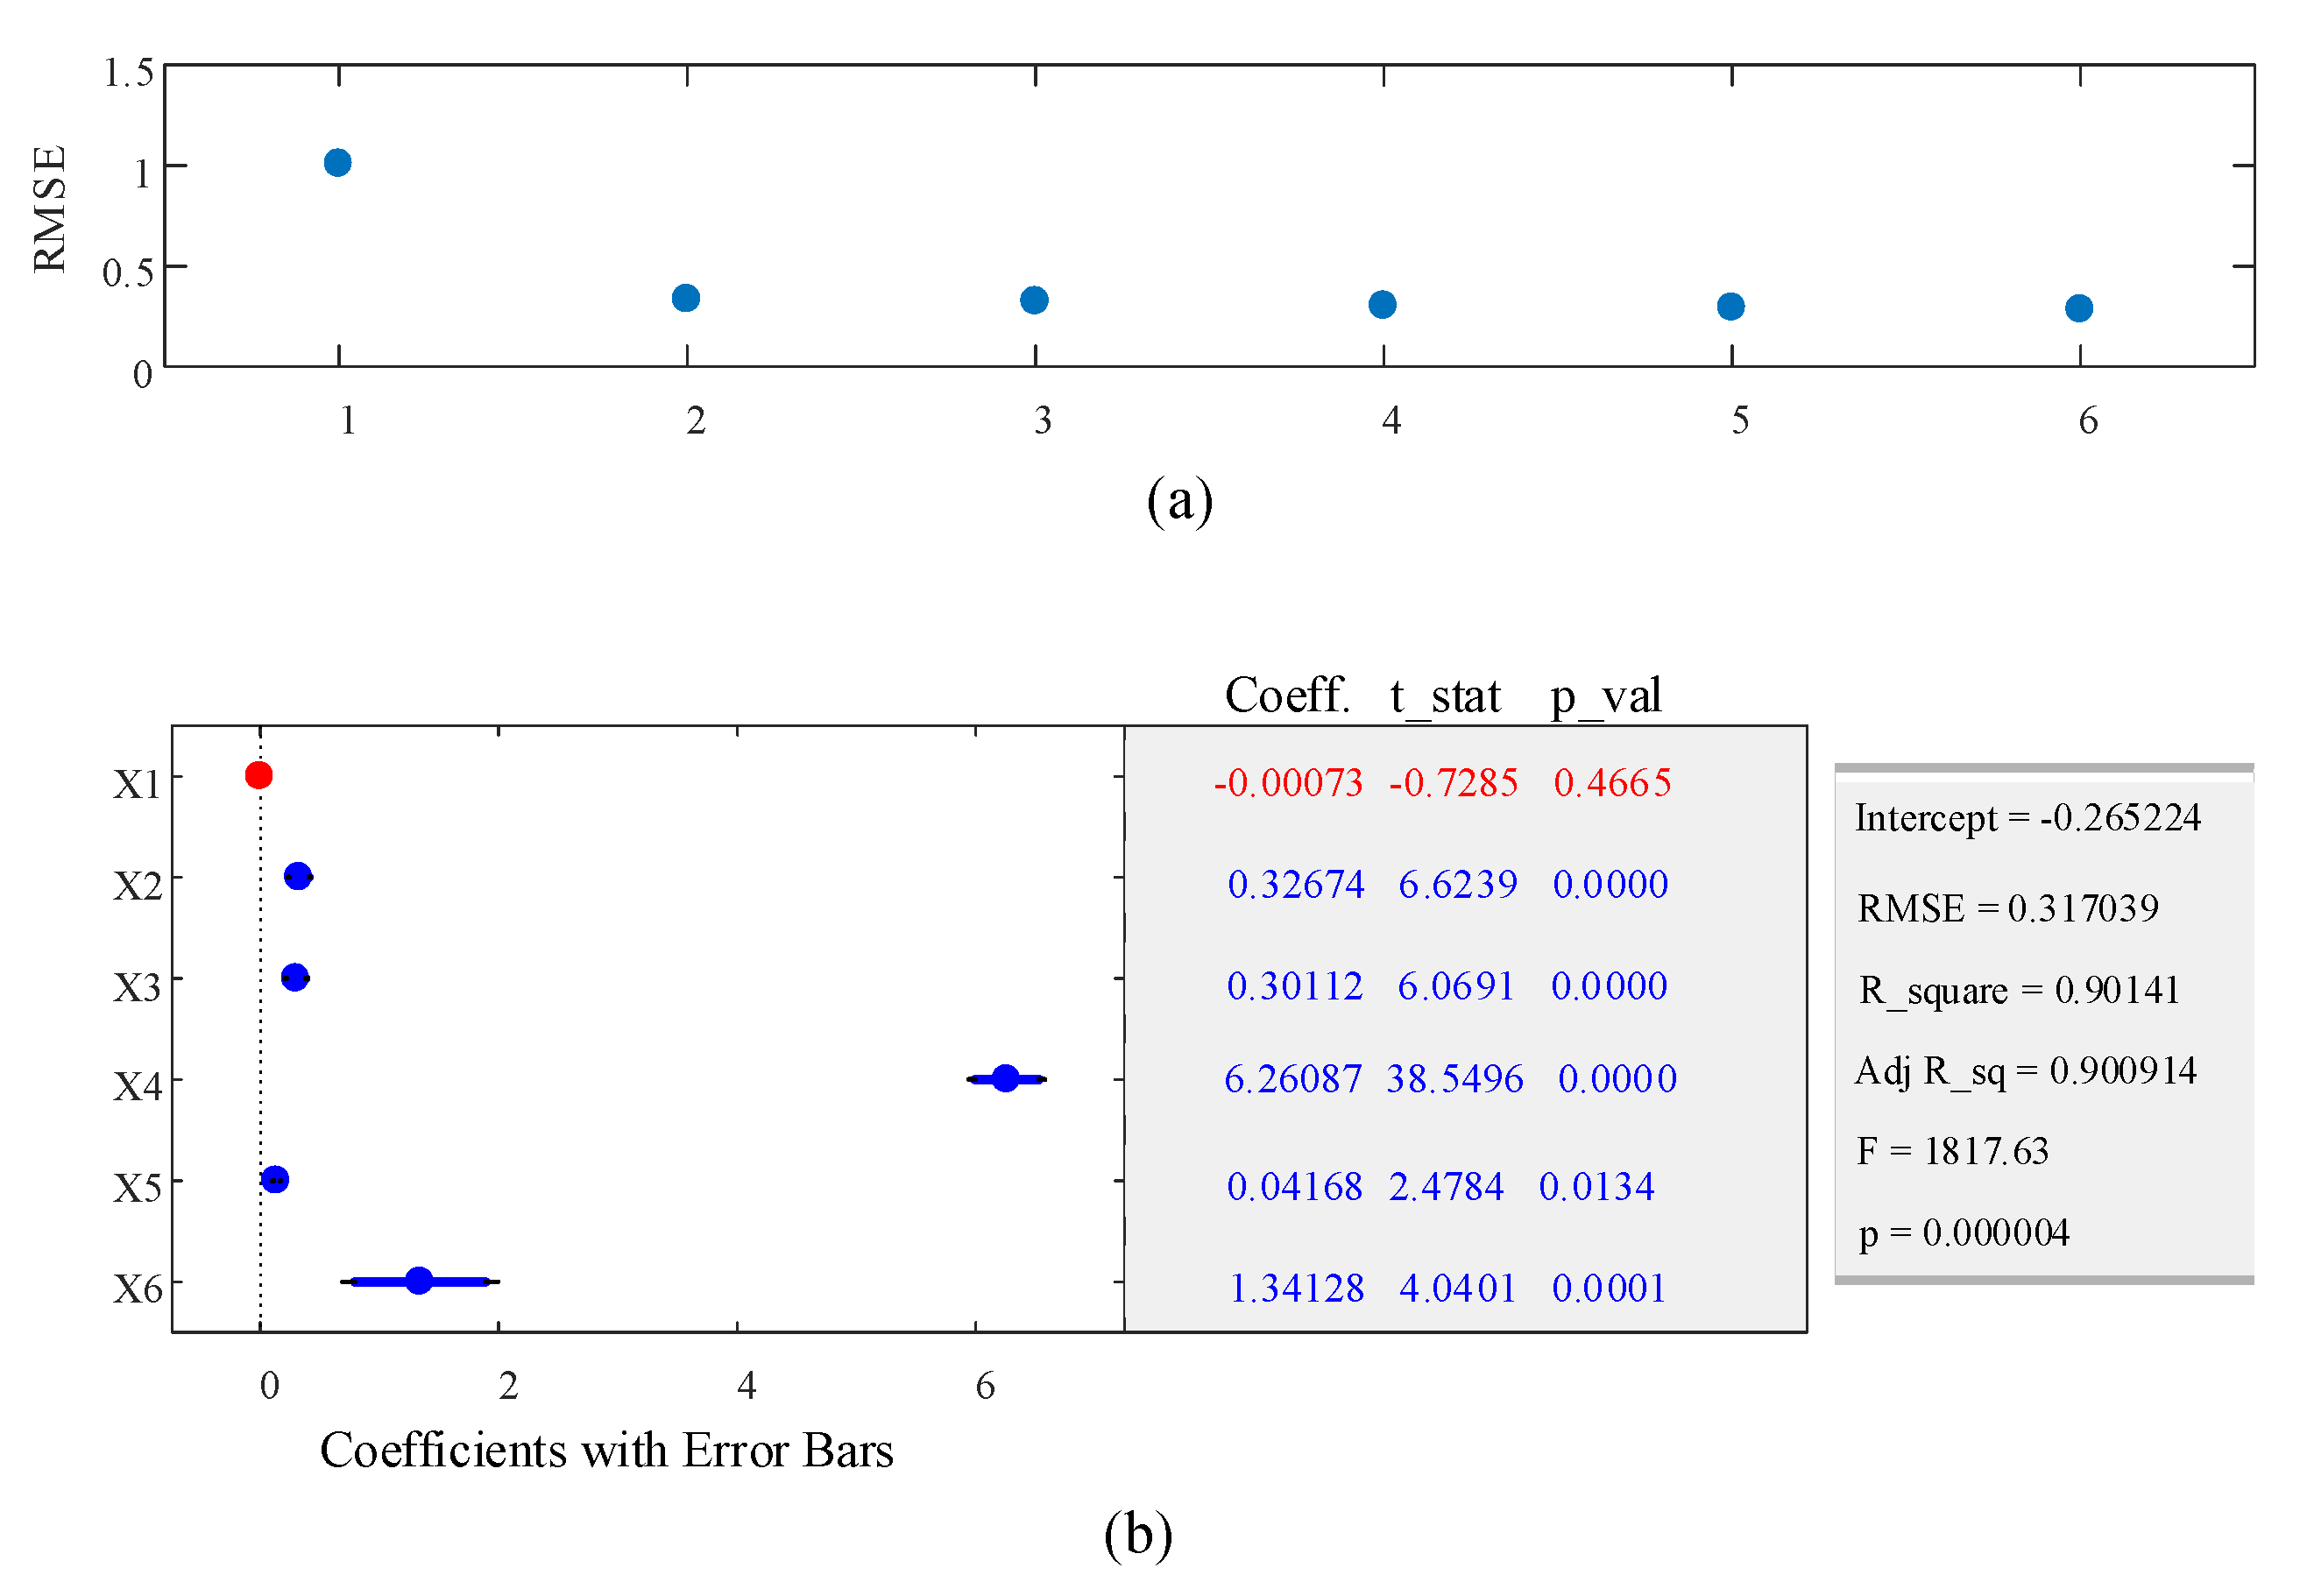
4.4.2. Multiple Linear Regression Analysis for PTRs and Influential Factors
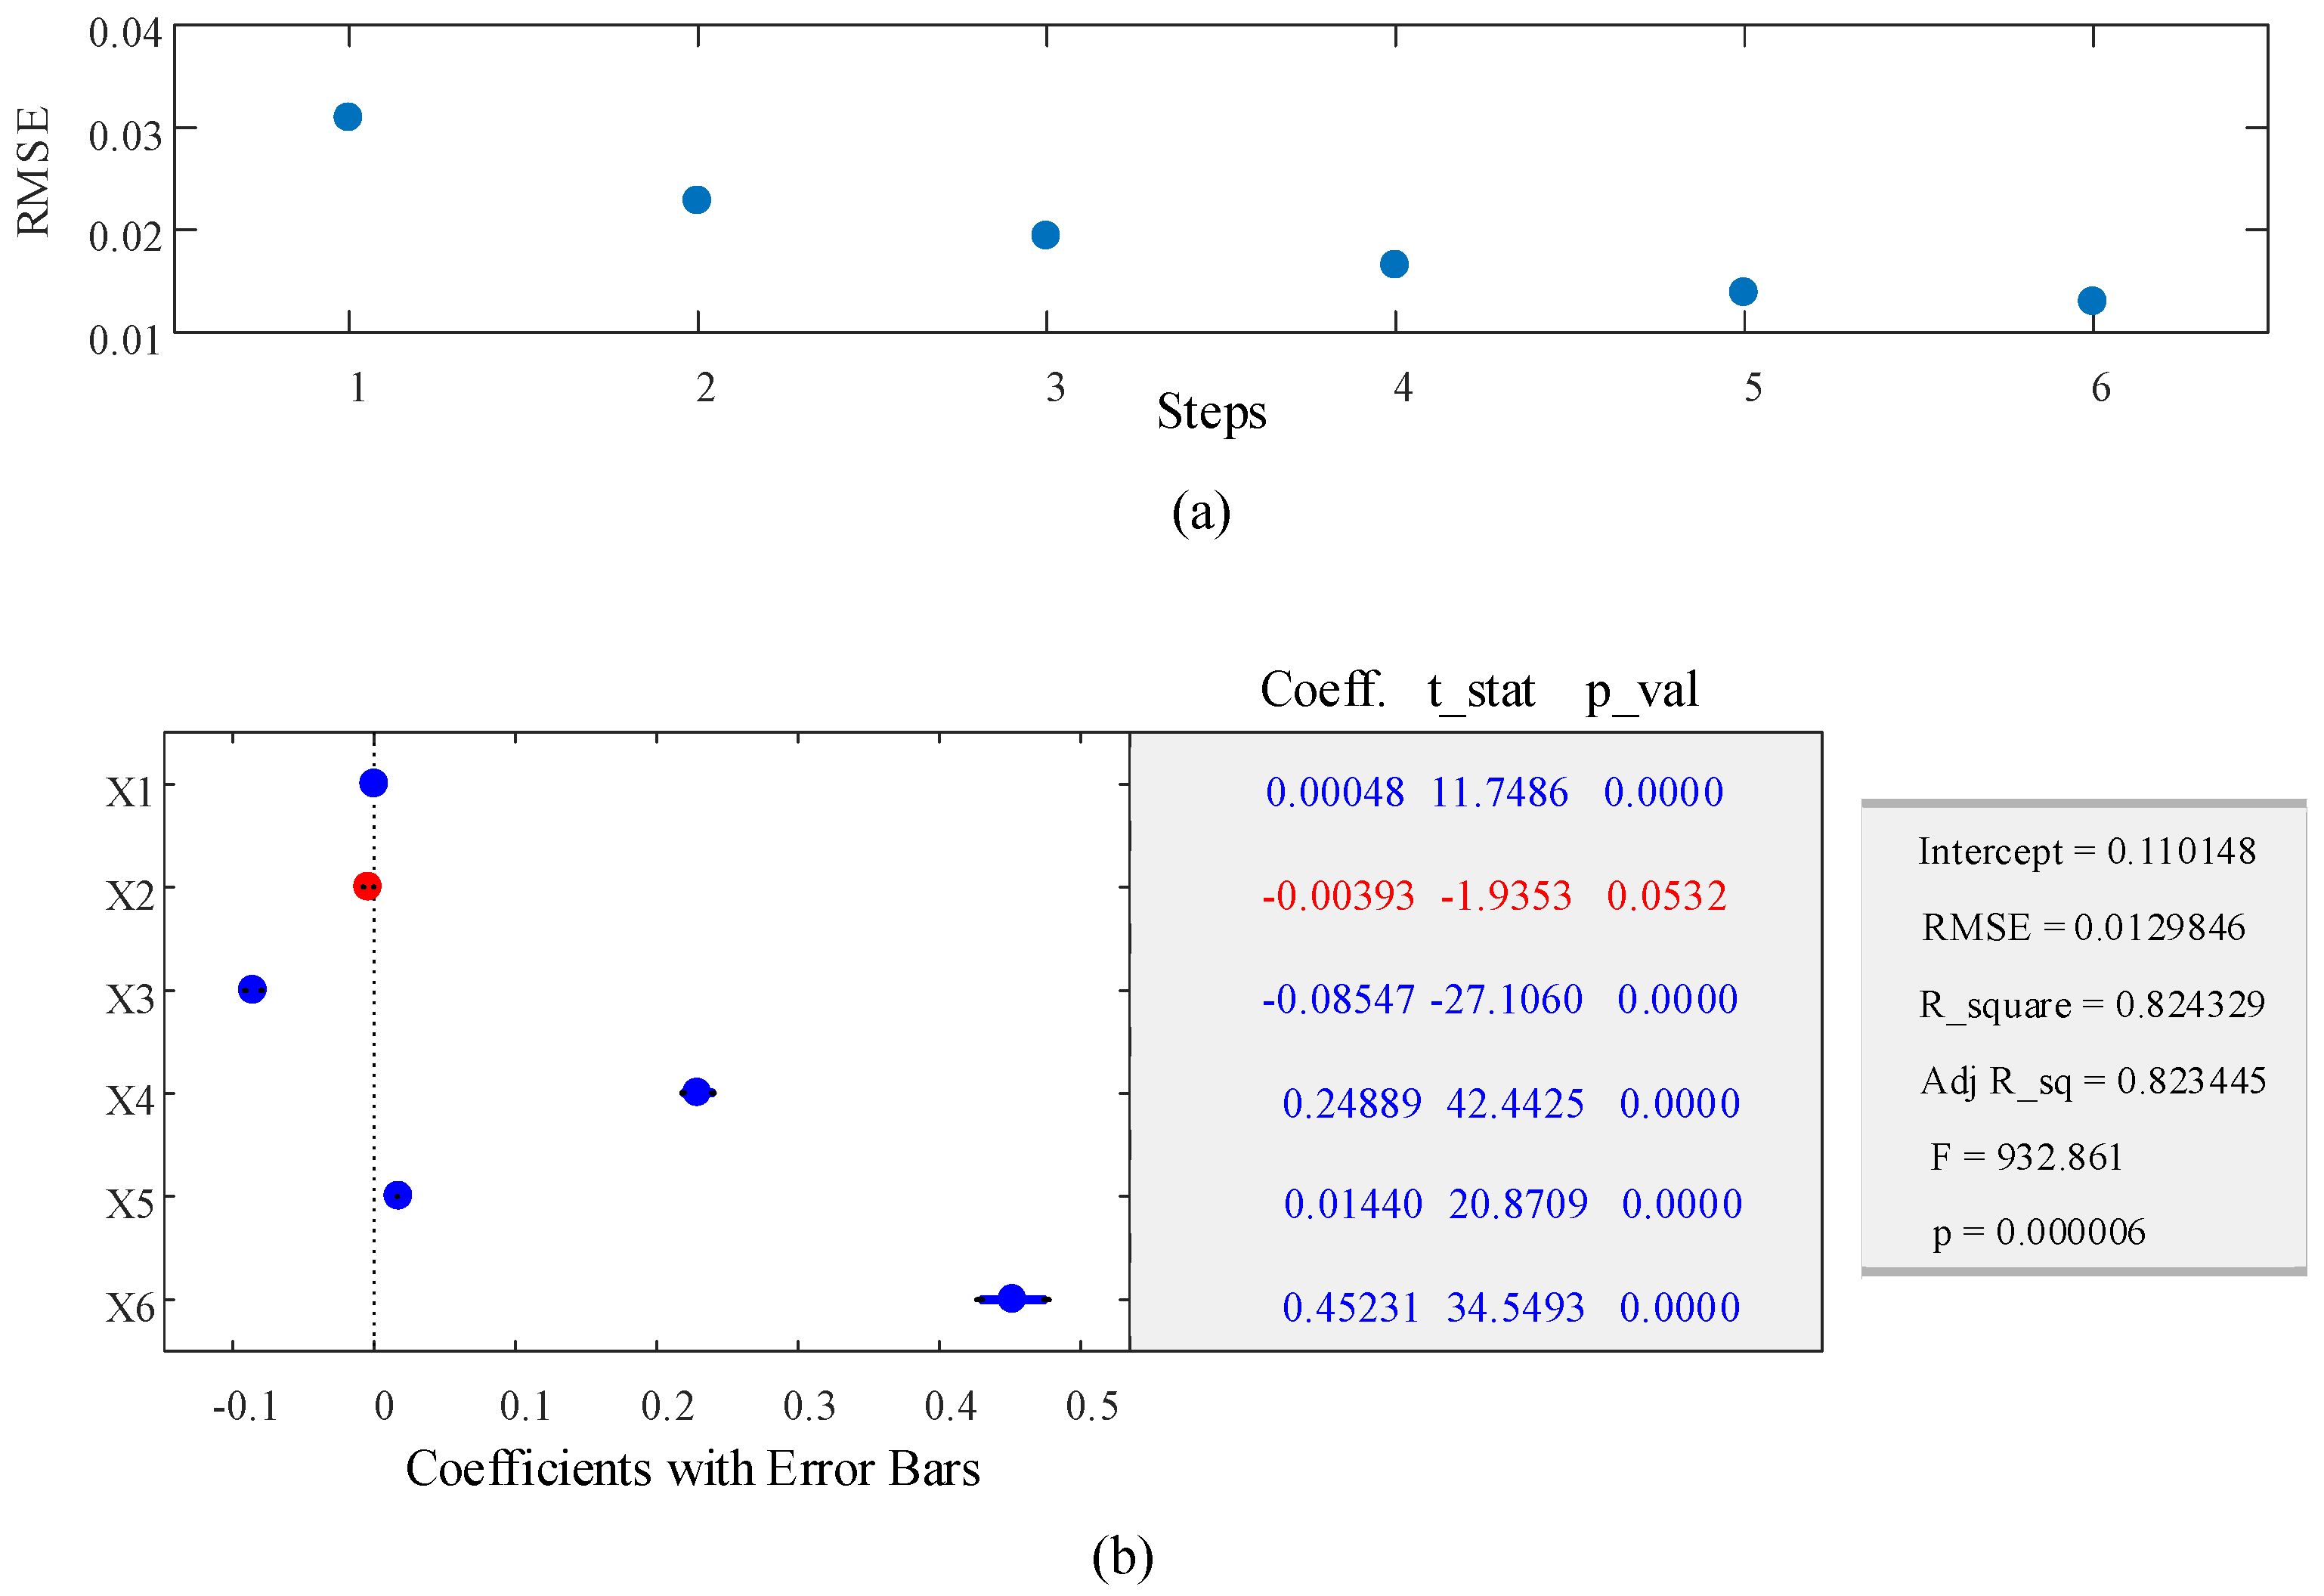
4.4.3. Multiple Linear Regression Analysis for PTRC and Influential Factors
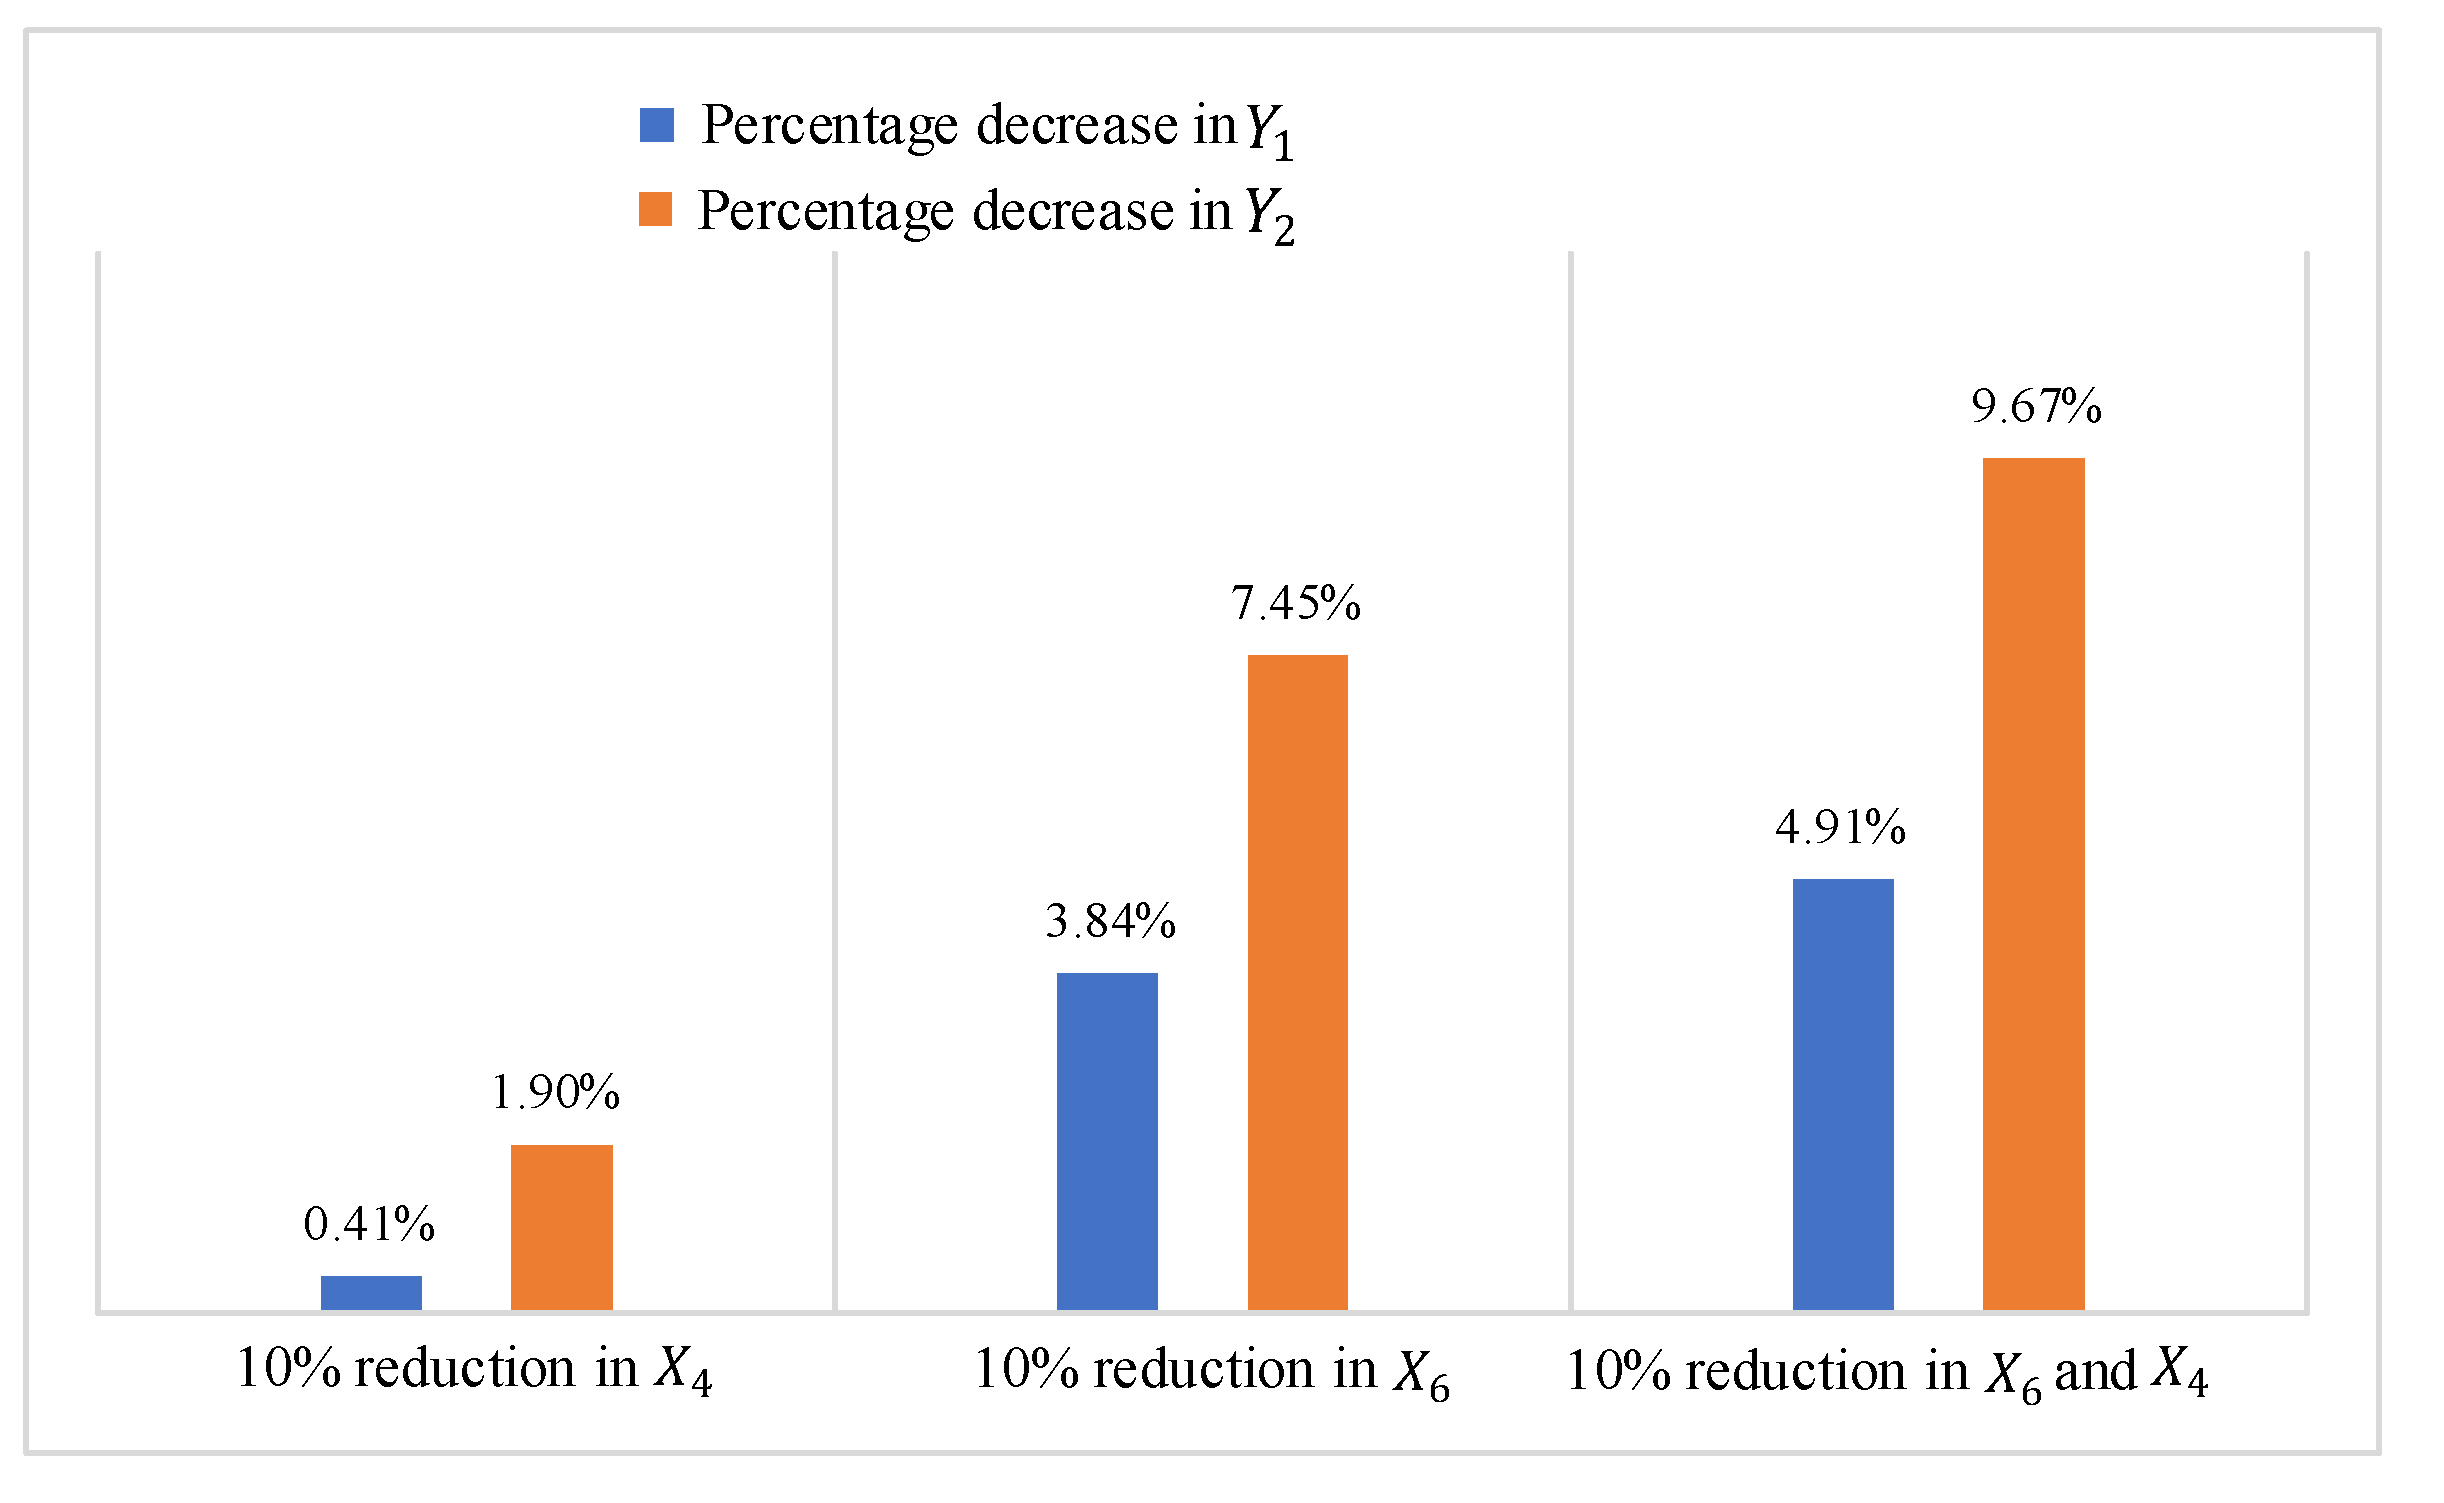
4.4.4. PTR Enhancement and PTRC Reduction Analysis
5. Conclusions
Author Contributions
Funding
Institutional Review Board Statement
Informed Consent Statement
Data Availability Statement
Acknowledgments
Conflicts of Interest
References
- Moghaddam, Z.R.; Jeihani, M.; Peeta, S.; Banerjee, S. Comprehending the roles of traveler perception of travel time reliability on route choice behavior. Travel Behav. Soc. 2019, 16, 13–22. [Google Scholar] [CrossRef]
- Beirão, G.; Cabral, J.S. Understanding attitudes towards public transport and private car: A aualitative study. Transp. Policy 2007, 14, 478–489. [Google Scholar] [CrossRef]
- Li, Z.; Hensher, D.A.; Rose, J.M. Willingness to pay for travel time reliability in passenger transport: A review and some new empirical evidence. Transp. Res. Part E Logist. Transp. Rev. 2010, 46, 384–403. [Google Scholar] [CrossRef]
- De Jong, G.C.; Bliemer, M.C. On including travel time reliability of road traffic in appraisal. Transp. Res. Part A Policy Pr. 2015, 73, 80–95. [Google Scholar] [CrossRef]
- Li, X.; Liu, L.; Mu, H. Evaluation of road network total travel time reliability based on fourth-moment. J. Transp. Syst. Eng. Inf. Technol. 2019, 19, 145–150. [Google Scholar]
- Sun, Y.; Shi, J.; Schonfeld, P.M. Identifying passenger flow characteristics and evaluating travel time reliability by visualizing AFC data: A case study of Shanghai Metro. Public Transp. 2016, 8, 341–363. [Google Scholar] [CrossRef]
- Liu, J.; Schonfeld, P.M.; Peng, Q.; Yin, Y. Measures of Travel Reliability on an Urban Rail Transit Network. J. Transp. Eng. Part A Syst. 2020, 146, 04020037. [Google Scholar] [CrossRef]
- Ma, Z.-L.; Ferreira, L.; Mesbah, M.; Hojati, A.T.; Information, R. Modeling Bus Travel Time Reliability with Supply and Demand Data from Automatic Vehicle Location and Smart Card Systems. Transp. Res. Rec. J. Transp. Res. Board 2015, 2533, 17–27. [Google Scholar] [CrossRef]
- Uno, N.; Kurauchi, F.; Tamura, H.; Iida, Y. Using Bus Probe Data for Analysis of Travel Time Variability. J. Intell. Transp. Syst. 2009, 13, 2–15. [Google Scholar] [CrossRef] [Green Version]
- Jenelius, E. Public transport experienced service reliability: Integrating travel time and travel conditions. Transp. Res. Part A Policy Pr. 2018, 117, 275–291. [Google Scholar] [CrossRef] [Green Version]
- Jennrich, R.I.; Sampson, P.F. Application of stepwise regression to non-linear estimation. Technometrics 1968, 10, 63–72. [Google Scholar] [CrossRef]
- De Oliveira, E.L.; Portugal, L.D.S.; Junior, W.P. Indicators of reliability and vulnerability: Similarities and differences in ranking links of a complex road system. Transp. Res. Part A Policy Pr. 2016, 88, 195–208. [Google Scholar] [CrossRef]
- Wakabayashi, H.; Matsumoto, Y. Comparative study on travel time reliability indexes for highway users and operators. J. Adv. Transp. 2012, 46, 318–339. [Google Scholar] [CrossRef]
- Van Loon, R.; Rietveld, P.; Brons, M. Travel-time reliability impacts on railway passenger demand: A revealed preference analysis. J. Transp. Geogr. 2011, 19, 917–925. [Google Scholar] [CrossRef]
- Lyman, K.; Bertini, R. Using Travel Time Reliability Measures to Improve Regional Transportation Planning and Operations. Transp. Res. Rec. J. Transp. Res. Board 2008, 2046, 1–10. [Google Scholar] [CrossRef] [Green Version]
- Rietveld, P.; Bruinsma, F.R.; van Vuuren, D.J. Coping with unreliability in public transport chains: A case study for Netherlands. Transp. Res. Part A Policy Pr. 2001, 35, 539–559. [Google Scholar] [CrossRef]
- Ma, Z.; Ferreira, L.; Mesbah, M. A framework for the development of bus service reliability measures. In Proceedings of the Presentation to Transport Research Forum 2013, Brisbane, Australia, 2–4 October 2013. [Google Scholar]
- Woodard, D.; Nogin, G.; Koch, P.; Racz, D.; Goldszmidt, M.; Horvitz, E. Predicting travel time reliability using mobile phone GPS data. Transp. Res. Part C Emerg. Technol. 2017, 75, 30–44. [Google Scholar] [CrossRef]
- Rakha, H.; El-Shawarby, I.; Arafeh, M. Trip Travel-Time Reliability: Issues and Proposed Solutions. J. Intell. Transp. Syst. 2010, 14, 232–250. [Google Scholar] [CrossRef]
- Uniman, D.L.; Attanucci, J.; Mishalani, R.G.; Wilson, N.H.M. Service reliability measurement using automated fare card data: Application to the London underground. Transp. Res. Rec. 2010, 2143, 92–99. [Google Scholar] [CrossRef] [Green Version]
- Ehrlich, J.E. Applications of Automatic Vehicle Location Systems Towards Improving Service Reliability and Operations Planning in London. Master’s Thesis, Massachusetts Institute of Technology, Cambridge, MA, USA, 2010. [Google Scholar]
- Wood, D.A. A Framework for Measuring Passenger-Experienced Transit Reliability Using Automated Data. Master’s Thesis, Massachusetts Institute of Technology, Cambridge, MA, USA, 2015. [Google Scholar]
- Pu, X. Analytic relationships between travel time reliability measures. Transp. Res. Rec. 2011, 2254, 122–130. [Google Scholar] [CrossRef]
- Van Lint, J.W.C.; van Zuylen, H.J.; Tu, H. Travel time unreliability on freeways: Why measures based on variance tell only half the story. Transp. Res. Part A Policy Pr. 2008, 42, 258–277. [Google Scholar] [CrossRef]
- Lomax, T.; Schrank, D.; Turner, S.; Margiotta, R. Selecting Travel Time Reliability Measures; Texas Transportation Institute: College Station, TX, USA, 2003. [Google Scholar]
- Furth, P.G.; Muller, T.H.J. Service Reliability and Hidden Waiting Time: Insights from Automatic Vehicle Location Data. Transp. Res. Rec. J. Transp. Res. Board 2006, 1955, 79–87. [Google Scholar] [CrossRef]
- Lo, H.K.; Luo, X.W.; Siu, B.W.Y. Degradable transport network: Travel time budget of travelers with heterogeneous risk aversion. Transp. Res. Part B Methodol. 2006, 40, 792–806. [Google Scholar] [CrossRef]
- Xu, X.; Chen, A.; Cheng, L.; Lo, H.K. Modeling distribution tail in network performance assessment: A mean-excess total travel time risk measure and analytical estimation method. Transp. Res. Part B Methodol. 2014, 66, 32–49. [Google Scholar] [CrossRef]
- Zheng, F.; Liu, X.; van Zuylen, H.V.; Li, J.; Lu, C. Travel Time Reliability for Urban Networks: Modelling and Empirics. J. Adv. Transp. 2017, 2017, 9147356. [Google Scholar] [CrossRef] [Green Version]
- Al-Deek, H.; Emam, E.B. New Methodology for Estimating Reliability in Transportation Networks with Degraded Link Capacities. J. Intell. Transp. Syst. 2006, 10, 117–129. [Google Scholar] [CrossRef]
- Kim, J.; Mahmassani, H.S.; Vovsha, P.; Stogios, Y.; Dong, J. Scenario-Based Approach to Analysis of Travel Time Reliability with Traffic Simulation Models. Transp. Res. Rec. J. Transp. Res. Board 2013, 2391, 56–68. [Google Scholar] [CrossRef] [Green Version]
- Wang, J.; Gao, X.; Sun, Z. A Multilevel Simulation Method for Time-Variant Reliability Analysis. Sustainability 2021, 13, 3646. [Google Scholar] [CrossRef]
- Bruzelius, N.A. Microeconomic theory and generalised cost. Transportmetrica 1981, 10, 233–245. [Google Scholar] [CrossRef]
- Litman, T. Valuing transit service quality improvements. J. Public Transp. 2008, 11, 43–63. [Google Scholar] [CrossRef] [Green Version]
- Qian, K.; Chen, Y.; Mao, B.H. Route choice behavior for urban rail transit considering transfer time. J. Transp. Syst. Eng. Inf. Technol. 2015, 15, 116–121. [Google Scholar]
- Wardman, M.; Whelan, G. Twenty years of rail crowding valuation studies: Evidence from lessons from British experience. Transp. Rev. 2011, 31, 379–398. [Google Scholar] [CrossRef]
- Kim, Y.-J. Monte Carlo vs. Fuzzy Monte Carlo Simulation for Uncertainty and Global Sensitivity Analysis. Sustainability 2017, 9, 539. [Google Scholar] [CrossRef] [Green Version]
- Zhao, Y. On Interchange of Urban Rail Transit Considering Level of Service. Ph.D. Thesis, Beijing Jiaotong University, Beijing, China, 2011. (In Chinese). [Google Scholar]
- Dixit, M.; Brands, T.; van Oort, N.; Cats, O.; Hoogendoorn, S. Passenger Travel Time Reliability for Multimodal Public Transport Journeys. Transp. Res. Rec. J. Transp. Res. Board 2019, 2673, 149–160. [Google Scholar] [CrossRef] [Green Version]
- Sun, Y.; Xu, R. Rail transit travel time reliability and estimation of passenger route choice behavior: Analysis using automatic fare collection data. Transp. Res. Rec. 2012, 2275, 58–67. [Google Scholar] [CrossRef]
- Ingvardson, J.B.; Nielsen, O.A.; Raveau, S.; Nielsen, B.F. Passenger arrival and waiting time distributions dependent on train service frequency and station characteristics: A smart card data analysis. Transp. Res. Part C Emerg. Technol. 2018, 90, 292–306. [Google Scholar] [CrossRef] [Green Version]
- Liu, H.X.; He, X.; He, B. Method of Successive Weighted Averages (MSWA) and Self-Regulated Averaging Schemes for Solving Stochastic User Equilibrium Problem. Netw. Spat. Econ. 2009, 9, 485–503. [Google Scholar] [CrossRef]
- Zhou, Z.; Chen, A.; Bekhor, S. C-logit stochastic user equilibrium model: Formulations and solution algorithm. Transportation 2012, 8, 17–41. [Google Scholar] [CrossRef]
- Cascetta, E. Transportation Systems Engineering: Theory and Methods; Kluwer Academic Publishers: Dordrecht, The Netherlands, 2001. [Google Scholar]
- Zhou, F.; Xu, R.-H. Model of Passenger Flow Assignment for Urban Rail Transit Based on Entry and Exit Time Constraints. Transp. Res. Rec. J. Transp. Res. Board 2012, 2284, 57–61. [Google Scholar] [CrossRef]
- Litman, T. Transportation Cost and Benefit Analysis-Techniques, Estimates and Implications, 2nd ed.; Victoria Transport Policy Institute: Victoria, BC, Canada, 2009. [Google Scholar]
- Chengdu Bureau of Statistics. Chengdu Statistical Yearbook; China Statistics Press: Beijing, China, 2018. [Google Scholar]


| Indicators | Description |
|---|---|
| Coefficient of variation [23] | The ratio of the standard deviation to the mean. |
| Skewness of time [24] | The ratio of the difference between the 90th percentile trip time and 50th percentile trip time to the difference between the 50th percentile trip time and 10th percentile trip time. |
| 90th or 95th percentile trip time [25] | 90th or 95th percentile trip time used as the reliable trip time |
| Buffer time [26] | The difference between the average trip time and 95th percentile trip time. |
| Buffer time index [26] | The percentage of buffer time with respect to the average trip time. |
| On-time arrival [27] | The probability that a trip arrives within the trip time budget. |
| Time unreliability [25] | The fraction of late arriving trips. |
| Total time budget [27] | The minimum trip time threshold that satisfies a certain reliability requirement given by decision-makers at a certain confidence level. |
| Mean-excess total time [28] | The conditional expectation of trip times exceeding the corresponding total trip time budget at a given confidence level. |
| Load Factor (%) | Sitting | Standing |
|---|---|---|
| 0–75 | 0.86 | ---- |
| 75–100 | 0.95 | ---- |
| 100–125 | 1.05 | 1.62 |
| 125–150 | 1.16 | 1.79 |
| 150–175 | 1.27 | 1.99 |
| 175–200 | 1.40 | 2.20 |
| >200 | 1.55 | 2.44 |
| Walking Place | (m/s) | |
|---|---|---|
| passageways | 1.39 | 0.463 |
| upstairs | 0.79 | 0.236 |
| downstairs | 0.81 | 0.174 |
| Headways (min) | ζ | ω | θ |
|---|---|---|---|
| 5 | 0.43 | 0.41 | 2.85 |
| 10 | 0.52 | 0.36 | 3.39 |
| 15 | 0.58 | 0.32 | 3.98 |
| 20 | 0.64 | 0.27 | 4.57 |
| 30 | 0.90 | 0.24 | 6.52 |
| Line | Operation Type | Headway (min) | Seats (per Hour) | Capacity (Passenger Trips per Hour) |
|---|---|---|---|---|
| 1 | frequency-based | 2.00 | 348 × 30 | 1460 × 30 |
| 2 | frequency-based | 2.73 | 348 × 22 | 1460 × 22 |
| 3 | frequency-based | 3.00 | 348 × 20 | 1460 × 20 |
| 4 | frequency-based | 3.00 | 348 × 20 | 1460 × 20 |
| 5 | frequency-based | 4.00 | 348 × 15 | 1460 × 15 |
| 6 | frequency-based | 6.00 | 348 × 10 | 1460 × 10 |
| 7 | schedule-based | 10.00 | 250 × 6 | 680 × 6 |
| 8 | schedule-based | 15.00 | 250 × 4 | 680 × 4 |
| 9 | schedule-based | 15.00 | 250 × 4 | 680 × 4 |
| 10 | schedule-based | 15.00 | 610 × 4 | 1280 × 4 |
| 11 | schedule-based | 10.00 | 610 × 6 | 1280 × 6 |
| 12 | schedule-based | 10.00 | 610 × 6 | 1280 × 6 |
| Transfer Station | Transfer Direction | Walking Distance (m) | Transfer Direction | Walking Distance (m) |
|---|---|---|---|---|
| 3 | Line 1 to line 5 | 178 | Line 5 to line 1 | 155 |
| 3 | Line 1 to line 7 | 237 | Line 7 to line 1 | 207 |
| 6 | Line 1 to line 4 | 252 | Line 4 to line 1 | 155 |
| 7 | Line 1 to line 2 | 215 | Line 2 to line 1 | 200 |
| 10 | Line 1 to line 3 | 200 | Line 3 to line 1 | 104 |
| 13 | Line 1 to line 5 | 252 | Line 5 to line 1 | 126 |
| Link (Station–Station) | Running Time (min) | Link (Station–Station) | Running Time (min) | ||
|---|---|---|---|---|---|
| Upstream | Downstream | Upstream | Downstream | ||
| 1–2 | 1.87 | 1.88 | 18–19 | 1.35 | 1.33 |
| 2–3 | 2.08 | 2.07 | 19–20 | 1.38 | 1.37 |
| 3–4 | 1.47 | 1.47 | 20–21 | 1.57 | 1.57 |
| 4–5 | 1.57 | 1.58 | 21–22 | 1.95 | 1.92 |
| 5–6 | 1.22 | 1.25 | 22–23 | 1.50 | 1.50 |
| 6–7 | 1.35 | 1.33 | 23–24 | 1.83 | 1.83 |
| 7–8 | 1.15 | 1.20 | 24–25 | 1.70 | 1.78 |
| 8–9 | 1.15 | 1.17 | 25–26 | 1.78 | 1.77 |
| 9–10 | 1.32 | 1.32 | 26–27 | 1.93 | 1.93 |
| 10–11 | 1.27 | 1.28 | 27–28 | 2.00 | 2.25 |
| 11–12 | 1.35 | 1.33 | 28–29 | 1.75 | 1.50 |
| 12–13 | 1.40 | 1.45 | 29–30 | 1.77 | 1.77 |
| 13–14 | 1.63 | 1.63 | 30–31 | 1.58 | 1.58 |
| 14–15 | 1.50 | 1.50 | 31–32 | 1.50 | 1.50 |
| 15–16 | 1.17 | 1.17 | 32–33 | 1.33 | 1.33 |
| 16–17 | 1.20 | 1.20 | 33–34 | 1.87 | 1.87 |
| 17–18 | 1.78 | 1.78 | 34–35 | 2.00 | 2.00 |
Publisher’s Note: MDPI stays neutral with regard to jurisdictional claims in published maps and institutional affiliations. |
© 2021 by the authors. Licensee MDPI, Basel, Switzerland. This article is an open access article distributed under the terms and conditions of the Creative Commons Attribution (CC BY) license (https://creativecommons.org/licenses/by/4.0/).
Share and Cite
Liu, J.; Schonfeld, P.; Chen, J.; Yin, Y.; Peng, Q. Perceived Trip Time Reliability and Its Cost in a Rail Transit Network. Sustainability 2021, 13, 7504. https://doi.org/10.3390/su13137504
Liu J, Schonfeld P, Chen J, Yin Y, Peng Q. Perceived Trip Time Reliability and Its Cost in a Rail Transit Network. Sustainability. 2021; 13(13):7504. https://doi.org/10.3390/su13137504
Chicago/Turabian StyleLiu, Jie, Paul Schonfeld, Jinqu Chen, Yong Yin, and Qiyuan Peng. 2021. "Perceived Trip Time Reliability and Its Cost in a Rail Transit Network" Sustainability 13, no. 13: 7504. https://doi.org/10.3390/su13137504
APA StyleLiu, J., Schonfeld, P., Chen, J., Yin, Y., & Peng, Q. (2021). Perceived Trip Time Reliability and Its Cost in a Rail Transit Network. Sustainability, 13(13), 7504. https://doi.org/10.3390/su13137504