Abstract
We examine fund ratings of socially responsible investing (SRI) equity funds in emerging and developed markets by validating the assumptions of the equally weighted U.S. News mutual fund scorecard and the causal interrelations among its rating agencies—Morningstar, Lipper, Zacks, CFRA and TheStreet—for improvement priorities. In so doing, we apply a novel interdisciplinary methodology including cluster analysis, classification analysis, partial least squares structural equation modeling and importance performance analysis. We find evidence against the U.S. News assumptions, as individual rating agencies have unequal effects and exhibit the causal relationships among one another. We suggest emerging (developed) market fund managers allocate their resources—which are often limited—with the first priority to improving fund ratings of CFRA (Zacks), followed by Zacks (CFRA), TheStreet (Lipper), Lipper (Morningstar) and Morningstar (TheStreet). The positive causal relationships among rating agencies indicates that investors consider multiple rating agencies of the U.S. News for investment decisions, rather than simply use any single one of these rating agencies or their equally weighted aggregation. Interestingly, we find disagreement among rating agencies, with Zack (TheStreet) displaying rating deflation for emerging (developed) market funds. Disagreement among rating agencies may increase the monitoring effort of fund managers who usually “shop” for additional ratings in the hope of maximizing their average ratings.
1. Introduction
Socially responsible investing (SRI) is any general investing strategy that considers not only traditional measures of risk and return, but environmental, social and governance (ESG) factors as well. It is widely accepted that SRI results in better business decisions and better outcomes for the market and society. SRI investors typically attempt to obtain financial returns whilst taking aspects of firms’ ESG records into account. Due to its merits, SRI mutual funds have become increasingly popular and attracted ever-growing amount of fund flows over recent years. To select SRI mutual funds and earn profits on investments, many investors rely on fund ratings as their main signal for investment. Fund ratings not only help investors conveniently choose mutual funds suitable for investment but also keep fund managers in check. Fund ratings encourage fund managers to adhere to their investment styles and performance targets since poor performance or a big shift away from fund objectives might result in a downgrade in fund ratings, which in turn leads to fund outflows. To attract fund inflows from potential investors, fund managers attempt to climb the fund rankings and use social media to trumpet their mutual funds that have received the top-ranked ratings [1,2]. Though much of information used for fund ratings is from publicly available data, knowledge of fund ratings is frequently obscured by differences in conceptualization of fund ratings across several rating agencies [3].
Among several providers of fund ratings, the U.S. News has built a one-of-a-kind, one-stop mutual fund scorecard based on the equally weighted aggregation of fund ratings from the five well-known rating agencies including Morningstar, Lipper, Zacks, CFRA and TheStreet. The strength of the U.S. News mutual fund scorecard lies in its combination of fund ratings from various third-party rating agencies into a single composite score. The aggregation of numerous rating agencies appears to capture the multidimensional aspects of fund performance and to be more reliable than each rating agency taken separately. As fund ratings have become very influential in fund selections, a fund’s lower ranking might cause investors to redeem their investment units and asset management companies to forego business. In this spirit, fund managers not only monitor fund ratings to assess whether a fund ranking has improved or gotten worse but also attempt to climb the rankings for promoting their mutual funds. While rating agencies all aim at reflecting fund performance into their fund ratings, knowledge of a fund’s rating is often beclouded by the differences in sample design and methodology across rating agencies. For instance, Morningstar fund rating utilizes fundamental analysis as a larger part of its recommendations, while Zacks fund rating is much more quantitative in nature. Zacks rating system is rooted solely in giving investors the most potential for profit, while Morningstar appears to base its recommendations on an unbiased scale. Morningstar’s rating looks at risk-adjusted historical returns whereas CFRA’s rating takes into consideration the outlook for the individual underlying holdings of a fund. Due to variations across fund rating agencies, improving fund rating of one rating agency may have a positive or negative effect on fund ratings of the others. In this context, the core purpose of our study is to shed new light on disagreement and causal interdependences among multiple rating agencies of the U.S. News mutual fund scorecard.
Despite the widespread popularity of the U.S. News mutual fund scorecard, there has been no empirical analysis of its validity. One of the potential criticisms of the U.S. News mutual fund scorecard is that fund ratings obtained from different rating agencies are weighted arbitrarily by using the equal weighting scheme. The logic of this weighting procedure is based on the assumption that fund ratings provided by different rating agencies are of equal importance and independent. Although fund ratings issued by multiple rating agencies provide additional information over just a single U.S. News mutual fund scorecard, investors and fund managers are traditionally left to their own intuition and device to determine which rating agencies are the critical drivers of the U.S. News mutual fund scorecard. Confronted by multiple rating agencies, investors and fund managers tend to rely on the U.S. News mutual fund scorecard as a holistic measure for benchmarking mutual funds. While fund ratings of individual agencies should be correlated with the U.S. News mutual fund scorecard, it is not necessarily the case that they independently influence the U.S. News mutual fund scorecard. Rating agencies usually claim their information is from unique sources although much of their information obviously is from publicly available data. It is likely that rating agencies share a common set of public information but a different interpretation and time spent. Therefore, the causal relationships appear to exist among rating agencies. There has been no study known to us that attempts to assess the validity of the common assumptions underlying the U.S. News mutual fund scorecard. In this respect, we examine whether fund ratings of multiple rating agencies (i.e., fund ratings issued by Morningstar, Lipper, Zacks, CFRA and TheStreet) have an equal effect and whether there exist causal relationships among these rating agencies.
The present study distinguishes itself from the previous literature by making several important contributions. The major contribution is that we take a new approach to the question of whether some fund rating agencies are indeed better than others in terms of their causal relationships with the U.S. News mutual fund scorecard. We overcome the flawed assumptions of the U.S. News mutual fund scorecard by applying a novel four-stage interdisciplinary methodology. Due to the lack of theoretical guidance on causal interrelations between rating agencies, two well-known machine learning techniques—Expectation Maximization (EM) clustering and Bayesian Network with Tree Augmented NaiveBayes (BN-TAN) classifier—are used to data mine all possible causal directions. Structural equation modeling (SEM) is then utilized to estimate the direct, indirect and total effects of individual rating agencies in the causal diagram. To prioritize rating agencies for improving fund ratings, importance performance analysis (IPA) enables fund managers to contrast importance with performance of individual rating agencies.
The second contribution is that rather than examining the correlation over time of agencies’ fund ratings, we allow for the causal interrelations among rating agencies and analyze cross-sectionally how fund ratings issued by multiple rating agencies are related to the U.S. News mutual fund scorecard. Although we have the limitation on acquiring time series data form the U.S. News website, our approach has a potential advantage in that power of the test can be obtained by using machine learning techniques (i.e., EM clustering and BN-TAN classifier) prior to SEM estimations and by pooling information across rating agencies rather than treating each of them separately. This novel four-stage interdisciplinary methodology is the first attempt known to us to overcome the flawed assumptions of the U.S. News. This approach enables us to determine whether individual rating agencies have an equal effect on the U.S. News mutual fund scorecard and whether the causal interdependences exist between multiple rating agencies. To assess these questions empirically, we use fund ratings of SRI equity mutual funds from the U.S. News website at the end of calendar year 2020.
A final contribution is that our empirical analysis is performed on a unique dataset of fund ratings issued by Morningstar, Lipper, Zacks, CFRA and TheStreet. An interesting peculiarity of multiple fund ratings is that they allow for a comparison among rating agencies as they rate the same mutual funds. Due to plausible differences in duration of historical data used for the construction of fund ratings and time spent on the fund assessment process, the causal linkages might arise between agencies’ fund ratings. To our knowledge, the current study is the first attempt to analyze the causal interdependence among rating agencies of mutual funds. Besides, we perform empirical analysis for SRI equity mutual funds in both emerging and developed market fund categories, accounting for the possibility that fund ratings are related to the U.S. News mutual fund scorecard depending on fund categories.
Our key results can be summarized as follows. First, we find strong evidence of unequal effects and causal interdependences among rating agencies. This evidence casts doubt on the validity of the U.S. News mutual fund scorecard which assumes that fund ratings of individual rating agencies are equally important and independent. The presence of positive causal relationships among rating agencies suggests that fund managers and investors should take into account the causal relations among fund ratings of multiple rating agencies and keep these ratings separated, but simultaneously analyzed rather than composited. Second, our findings enable fund managers to identify rating agencies that a given fund should focus to improve its fund ranking. More specifically, our findings suggest that to climb the rankings of the U.S. News mutual fund scorecard, emerging (developed) market fund managers should allocate resources—which are often limited—with the first priority to improving fund ratings of CFRA (Zacks), followed by Zacks (CFRA), TheStreet (Lipper), Lipper (Morningstar) and Morningstar (TheStreet). Finally, we find that disagreement among rating agencies on fund ratings varies across fund categories. Zacks (TheStreet) on average provides the most pessimistic fund ratings for emerging (developed) market funds. These findings have important implications for investors, fund managers and rating agencies.
2. Literature Review
Given the sheer number of mutual funds from which to choose, investors tend to use fund ratings as a shortcut to aid in their investment decision [4,5,6,7]. Without fund ratings, there are many time-consuming and expensive investigations necessary to perform fund assessment since several aspects of mutual funds need to be considered simultaneously [8]. To provide investors a convenient tool for fund selections, many advisory firms, such as Morningstar, Lipper, Zacks, CFRA and TheStreet, have constructed their own fund rating systems. Among fund rating agencies, Morningstar is one of the most well-established fund ratings amongst investors and fund managers, as it provides both qualitative and quantitative ratings [9]. Fund ratings will be useful and valid in fund selection if fund performance reflects fund ratings [10]. Several studies have investigated the predictive ability of mutual fund ratings. For example, Blake and Morey [4] examine the Morningstar rating system as a predictor of mutual fund performance for U.S. domestic equity funds. They find that low fund ratings of Morningstar are generally related to poor future performance and this finding is robust across different samples, ages and styles of funds, and performance measures. However, there is no statistical evidence that mutual funds with high ratings have better future performance than the average performance of other mutual funds. Recently, Otero-Gonzalez et al. [11] find that fund ratings have an ability to predict future performance of the European equity funds rated by Morningstar in the short- and medium-term and that on average mutual funds with lower ratings have a worse out of sample performance in terms of risk-adjusted measures and annual returns.
Despite their advantages, the use of fund ratings for investment decision has some limitations. First, the lack of a standardized measure of fund ratings across the mutual fund industry causes rating agencies to use diverse rating methodologies that are not entirely disclosed, engendering a wide array of difficulties for investors. Furthermore, rating agencies have a tendency for achieving their own objectives, which do not necessarily coincide with investor protection or the improvement of the overall fund industry [12]. Second, fund analysts may obtain additional information from interviews with key executives or fund managers, and such qualitative information cannot be easily reflected into the quantitative fund ratings. In this respect, Morningstar develops qualitative analyst rating based on analysts’ opinions about whether mutual funds will outperform benchmarks over the market cycle. Graham et al. [13] suggest that a combination of quantitative Morningstar rating and qualitative analyst ratings can avoid poor performance in fund selection. Specifically, they combine both ratings using qualitative comparative analysis to find the combinations of conditions that lead to mutual funds’ under- or out-performance against their rivals. In a similar vein, Otero-Gonzalez and Duran-Santomil [14] point out that certain qualitative aspects, such as quality of management, cannot be completely captured by fund ratings and hence qualitative information can give very useful information when it comes to choosing the best funds. Finally, a potential drawback of fund ratings is that to varying extents the rating systems of various rating agencies are constructed by different methodologies and parameters. Fund rating agencies do not explicitly disclose the way the ratings are constructed. Ratings agencies typically consider a broad range of fund-specific characteristics to rate funds and crunch these characteristics differently in constructing their composite ratings [15]. Multiple rating agencies do not provide the same fund properties in terms of performance evaluation and risks taken into account [3]. This in turn causes complexity for investors who use fund ratings for making investment decisions and fund managers who benchmark their mutual funds against peer groups; an understanding of the differences between rating agencies has been increasingly harder to comprehend.
In light of fund ratings’ popularity among investors, previous studies have addressed the information content of fund ratings in three major areas: fund flows, fund performance and fund characteristics. Amman et al. [16] explore the impact of Morningstar’s Sustainability Rating on mutual fund flows and find convincing evidence that retail investors move money from low-rated into high-rated mutual funds. However, institutional investors respond much more weakly to the publication of Morningstar’s Sustainability Rating. Recently, Huang et al. [17] developed a theory of reputation to describe how investors rationally react to mutual fund ratings and demonstrate that rating upgrades imply reputation hikes, leading to discrete increases in mutual fund flows and expected fund performance. Extant research mostly focuses on the effect of fund ratings on fund flows and fund performance. There is less attention on the association between fund ratings and fund characteristics. For instance, Morey [18] demonstrates that the average overall Morningstar ratings of older mutual funds are consistently higher than those of younger funds, thus implying the age bias in Morningstar ratings. Barron and Ni [19] consider fund characteristics in terms of fund managers’ turnover. They find that Morningstar ratings not only impact the possibility that fund managers are replaced but also are better predictors of manager replacement than alternative measures of fund performance.
To provide a unidimensional measure for mutual fund ratings, most rating agencies use subjective weight to aggregate necessary information for fund assessment in the form of star/scale ratings [6,8]. This can give rise to quite different ratings and ranking outcomes, dependent on the relative importance assigned to individual criteria/indicators of fund evaluation. In the literature, there has been a lot of controversy over various weighting approaches to the rating of mutual funds [20,21,22]. For example, Morey [18] argues that the weighting system appears to be the most obvious source of the age bias in the rating calculation. Bruggemann and Patil [23] point out that when an aggregation to a composite rating is performed, the single indicators lose their individuality because they are just summands contributing to the value of the composite rating. Interestingly Amenc and Le Sourd [3] explain that Morningstar aggregates fund performance over the 3-, 5- and 10-year horizons by using arbitrary weights of 0.2, 0.3 and 0.5, respectively, whereas Lipper assigns equal weighting to each of these three horizons. This implies that Morningstar underweights on the most recent performance. If a particular mutual fund has a relatively poor performance over recent years, it will be highly rated given its top-ranked long-term performance. Lipper therefore argues that Morningstar’s ratings are subjective and might cause misidentification of top-performing mutual funds.
Among a number of weighting methods, the equally weighted aggregation is widely used in rating mutual funds [24]. However, arguments against the use of equal weighting for the composite rating have been the subject of various discussions and debates, as different impacts of individual indicators may be obscured, and the allocation of resource is seemingly inefficient [23]. The key shortcoming of the equally weighted aggregation is that any intercorrelation among rating agencies may lead to the double weighting of a particular rating agency [25]. In this sense, the simple average mutual fund scorecard may misguide fund managers whose main objective is to heighten the overall ratings and rankings by focusing on fund ratings of particular agencies, but these are correlated with others that also matter for the objective they are trying to accomplish. To overcome the need for subjective weights of the composite fund rating, a number of studies propose alternative approaches to fund ratings and rankings such as data envelopment analysis, stability maximization and stochastic dominance [6,22,26].
3. Dataset
In this study, we focus on fund ratings for SRI equity mutual funds classified as emerging and developed market fund categories by the U.S. News. We collect SRI fund ratings issued by five rating agencies (i.e., Morningstar, Lipper, Zacks, CFRA and TheStreet) from the U.S. News website at the end of calendar year 2020. With reference to equity mutual fund categories of the U.S. News, our sample includes emerging (85 SRI mutual funds) and developed (97 SRI mutual funds) market fund categories. In addition to fund ratings provided by individual agencies, the U.S. News reports the U.S. News mutual fund scorecard based on an equal weighting of fund ratings issued by Morningstar, Lipper, Zacks, CFRA and TheStreet. The U.S. News mutual fund scorecard offers a broad look at what some of the brightest minds conducting investing analysis have to say about some important investments. As claimed by the U.S. News, the obvious advantage of a simple average U.S. News mutual fund scorecard is that the aggregation of fund ratings from multiple agencies appears to be more reliable than each rating agency taken separately.
Due to the differences in fund rating methodologies, fund ratings of each agency are normalized to a 100-point scale grounded on point totals assigned to individual scoring systems. The methodology of each rating agency can be referred to Appendix A (i.e., Appendix A.1, Appendix A.2, Appendix A.3, Appendix A.4 and Appendix A.5). To do this, the U.S. News defines that one rating notch equals 20 points. A rating notch is a one level difference on a five-scale/star rating system, such as the difference between 5 and 4 Morningstar ratings. TheStreet’s A-to-E scales are each worth a total of 20 points. A low-rated “E” fund would obtain 20 points whereas a highly rated “A” fund would obtain 100 points. For Morningstar’s and CFRA’s five-star ratings and Zacks’ five-point scales, each star or point awarded would get 20 points. For the five Lipper categories of rankings (i.e., total return, consistent return, preservation, tax efficiency and expense), each category is worth a total of 20 points, giving 4 points to each 1-to-5 point scale assigned to each category of the Lipper rankings. The U.S. News mutual fund scorecard is calculated by dividing total points awarded according to the above system by the number of data sources and then rescaled in the range of 0–10 scores. It is noted that mutual funds must be ranked by all the five rating agencies in order to get the U.S. News mutual fund scorecard.
4. Hypothesis Development and Analytical Framework
4.1. Hypothesis Development
The U.S. News uses the equally weighted score of fund ratings issued by the five ratings agencies—Morningstar, Lipper, Zacks, CFRA and TheStreet—as a holistic measure of fund ratings for benchmarking across mutual funds in each fund category. The interesting question is whether fund ratings vary across rating agencies and fund categories. As pointed out by Amenc and Le Sourd [3], most rating agencies employ the relative rankings within each category of funds, which makes the rating distributions dependent on their own definitions of the fund categories. If each rating agency treats different fund categories equally, the distribution of fund ratings for emerging and developed market fund categories should be similar; that is, they should not reflect fund categories. This leads to the following hypothesis.
Hypothesis 1 (H1).
For a given rating agency, the distributions of fund ratings for emerging and developed market fund categories are indifferent.
In the context of principal-agent theory, investors delegate their monitoring activities to rating agencies to get the most accurate understanding of the underlying quality of mutual funds managed by fund managers. The rating agencies therefore help mitigate the information asymmetry between fund managers (agents) and investors (principal). In an efficient market environment, if fund ratings from different agencies were assumed to be substitutes, one rating agency would be sufficient to fulfill the monitoring function on behalf of investors. In practice, rating agencies provide somewhat different fund ratings for the same mutual funds although they mostly use publicly available information [3,27]. This is possibly because a number of reasons such as private information collection, the manner in which ratings are derived and the rating agency’s perception of fund assessment. For example, rating agencies use different pre-defined percentile distributions to assign their stars/scales to mutual funds. In this regard, we conduct the following hypothesis test.
Hypothesis 2 (H2).
For a given fund category, fund ratings differ across rating agencies.
The U.S. News mutual fund scorecard is constructed by the equally weighted aggregation of fund ratings from Morningstar, Lipper, Zacks, CFRA and TheStreet. In spite of its simplicity, the simple average aggregation of the U.S. News mutual fund scorecard contains two flawed assumptions. Specifically, the U.S. News mutual fund scorecard assumes equal importance and independence among all rating agencies. These assumptions seem invalid in practice and may obfuscate the relative information content of individual rating agencies, as each of the rating agencies the U.S. News rely upon rates mutual funds in different ways. Different rating agencies do not exhibit the same level of comparability due to their unique methodology and focus. For instance, Morningstar’s rating looks at risk-adjusted historical returns whereas CFRA’s rating takes into consideration the outlook for the individual underlying holdings of a fund. Besides, Morningstar fund rating utilizes fundamental analysis as a larger part of its recommendations, while Zacks fund rating is much more quantitative in nature. Zacks rating system is rooted solely in giving investors the most potential for profit, while Morningstar appears to base its recommendations on an unbiased scale. A number of related empirical studies find that the overall score and ranking outcomes are significantly impacted by the weighting methods of the aggregated scores [28]. As the U.S. News mutual fund scorecard indicates a fund reputation, mutual funds with the high ratings generally get close attention from socially responsible investors, which in turn boosts business opportunities of mutual funds. Hence, it would be more reasonable if the weighting system reflected the relative importance of rating agencies rather than assigning equal weight to individual rating agencies. Moreover, while fund ratings of individual agencies should be correlated with the U.S. News mutual fund scorecard, it is not necessarily the case that they independently influence the U.S. News mutual fund scorecard. Rating agencies usually claim their information is from unique sources although much of their information obviously is from publicly available data. It is likely that rating agencies share a common set of public information, but a different interpretation and time spent. Therefore, the causal relationships appear to exist among rating agencies. To verify whether both assumptions of the U.S. News mutual fund scorecard are justified, we propose the following hypotheses.
Hypothesis 3 (H3).
Fund ratings of individual rating agencies have unequal impacts on the U.S. News mutual fund scorecard.
Hypothesis 4 (H4).
There exist causal relationships among fund ratings provided by different rating agencies.
4.2. Analytical Framework
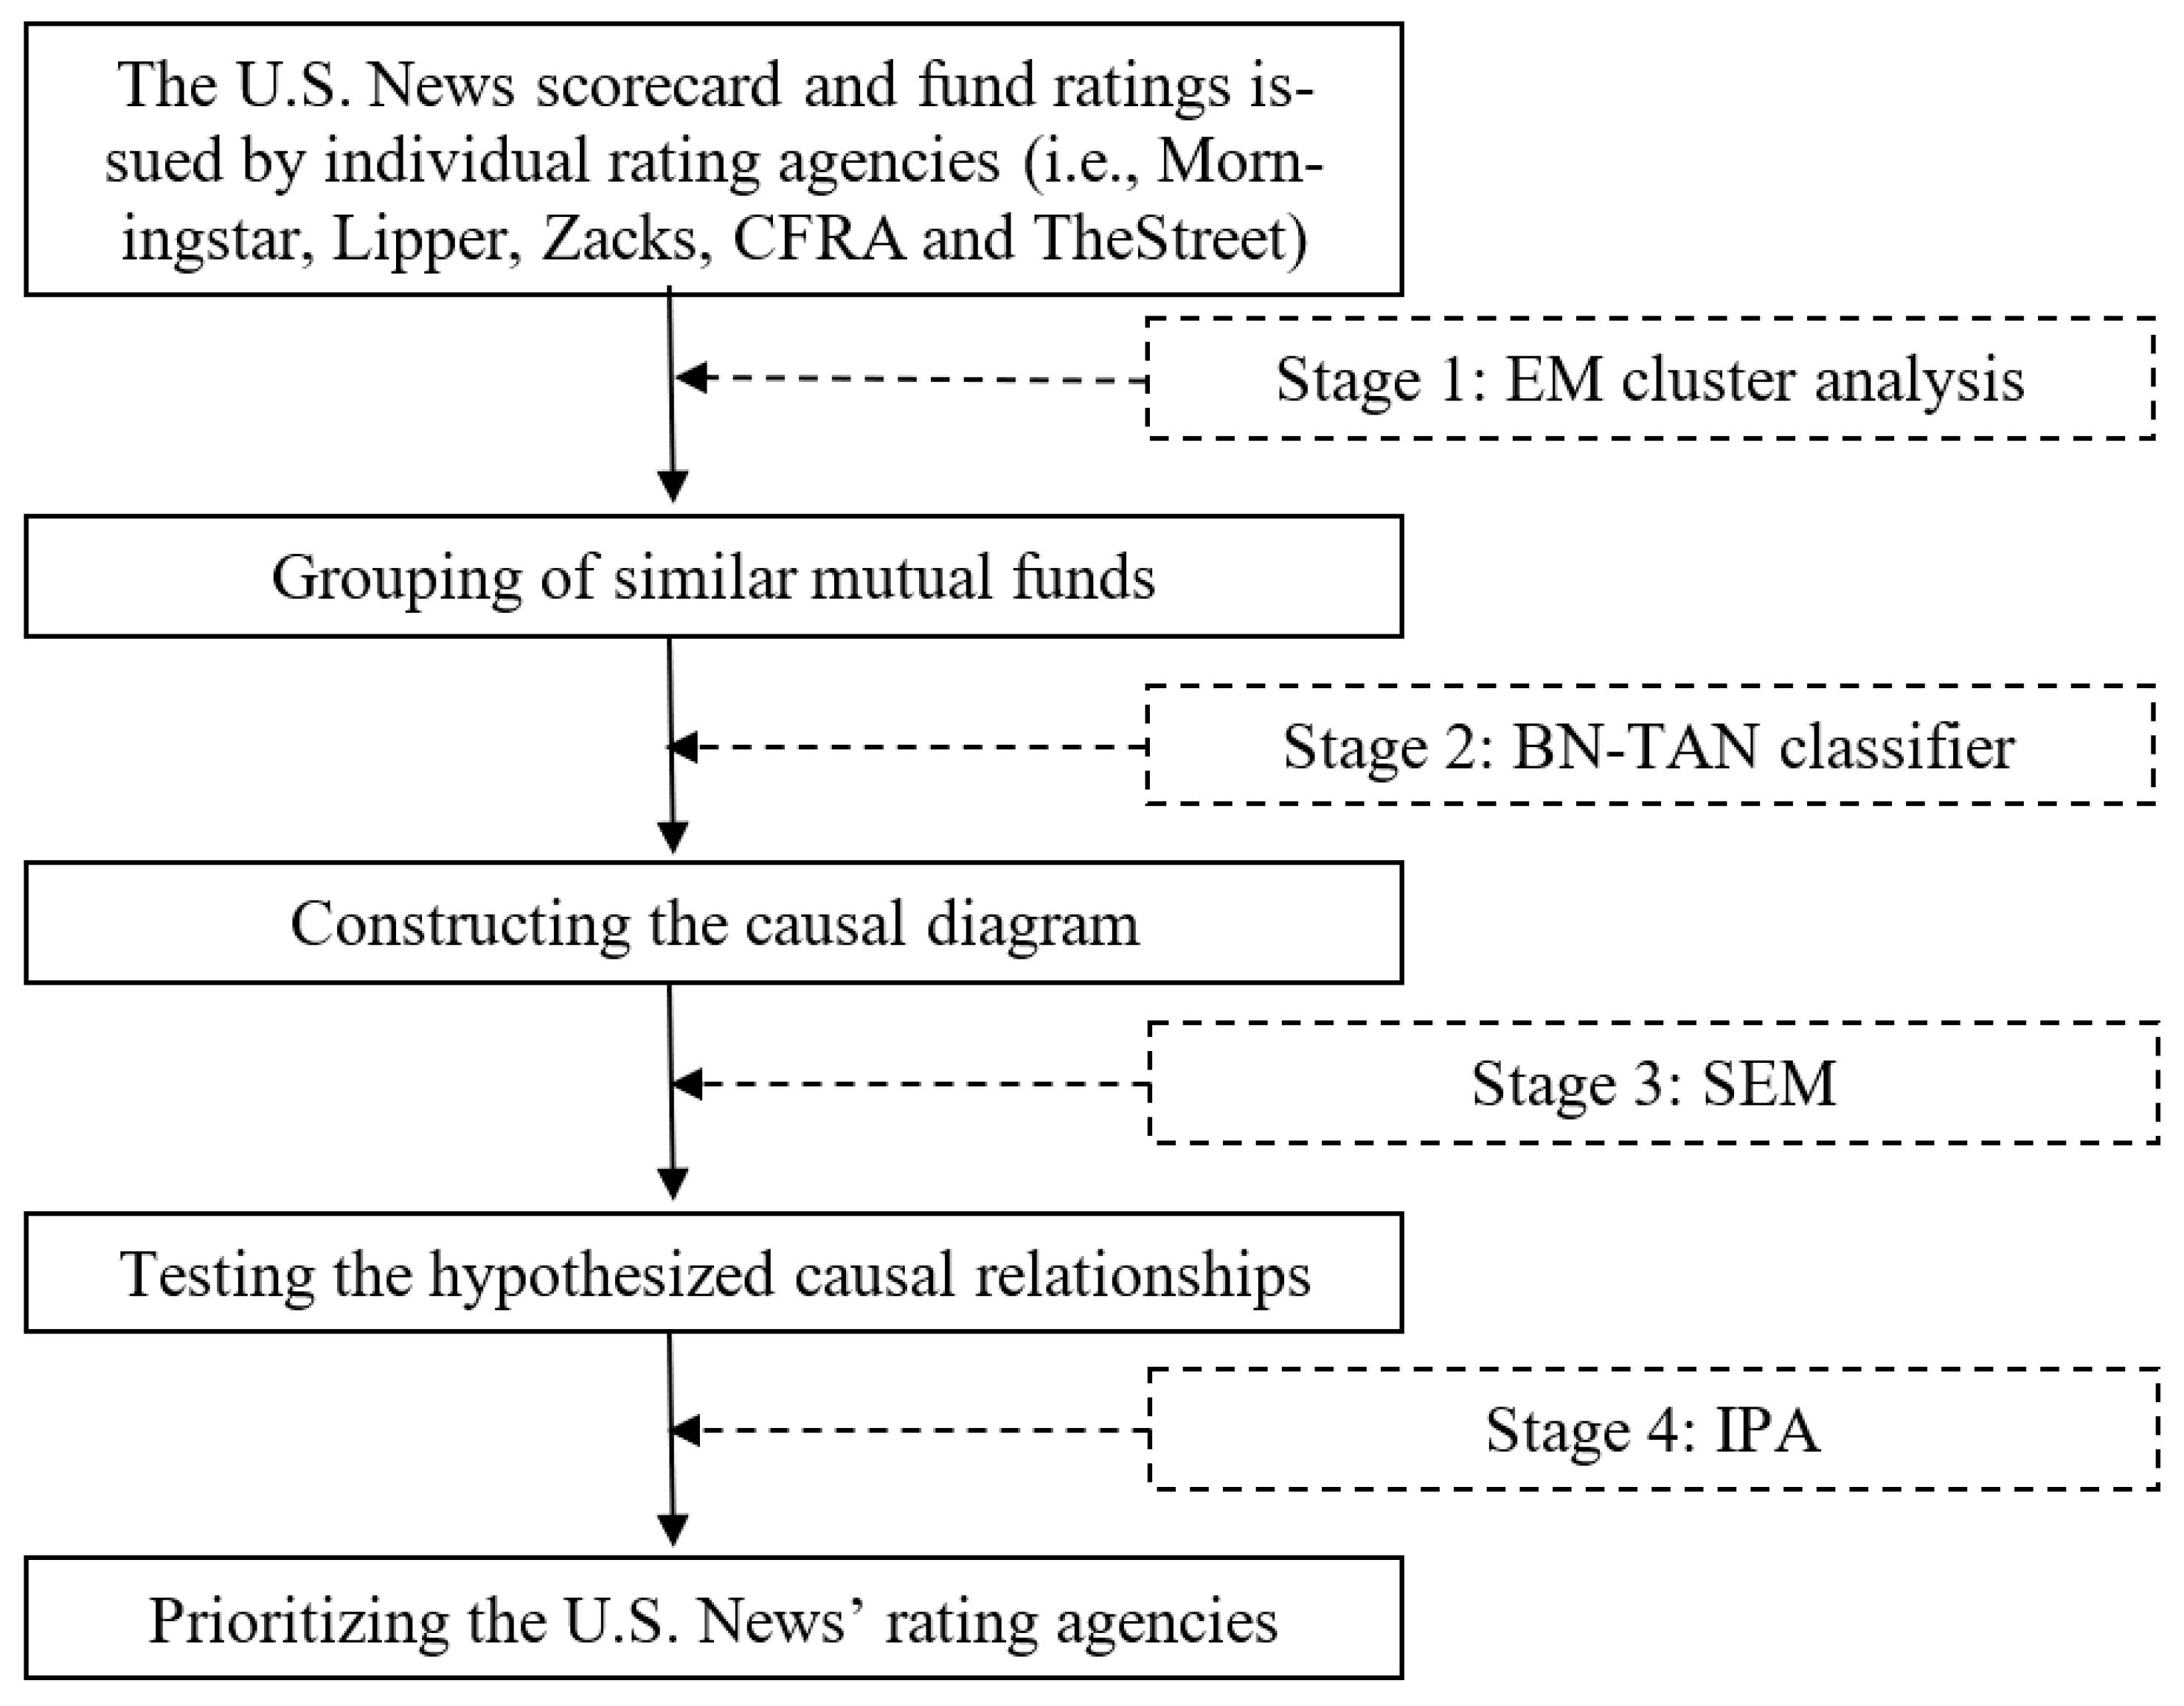
To test the aforementioned hypotheses, we use interdisciplinary techniques new to the literature of fund ratings. A similar technique has been applied in some parallel studies [29,30]. As shown in Figure 1, our four-stage methodology includes Expectation Maximization (EM) cluster analysis, Bayesian Network with Tree Augmented NaiveBayes (BN-TAN) classifier, structural equation modeling (SEM) and importance performance analysis (IPA). Two machine learning techniques—EM clustering and BN-TAN classifier—are used to data mine all causal directions among rating agencies. To elaborate, EM clustering is an unsupervised machine learning technique of finding patterns in the data, i.e., this algorithm works without class attributes. BN-TAN classifier, on the other hand, is supervised and requires a class attribute. Hence, EM clustering should be conducted prior to BN-TAN classifier. Technical information for machine learning techniques (i.e., EM clustering and BN-TAN classifier) can be referred to Friedman et al. [31] and Witten et al. [32]. SEM is used to estimate the direct, indirect and total effects of agencies’ fund ratings on the U.S. News mutual fund scorecard. Finally, IPA contrasts importance with performance of each rating agency to prioritize agencies for rating enhancement. The rationales and explanations of these four techniques are briefly presented as follows.
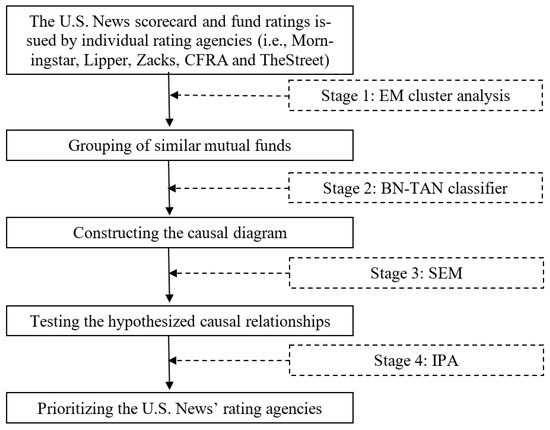
Figure 1.
The proposed analytical framework. Notes: This figure presents a novel four-stage interdisciplinary methodology including (1) Expectation Maximization (EM) cluster analysis, (2) Bayesian Network with Tree Augmented NaiveBayes (BN-TAN) classification analysis, (3) structural equation modeling (SEM) and (4) importance-performance analysis (IPA).
4.2.1. Stage 1: Expectation Maximization (EM) Cluster Analysis
EM cluster analysis is implemented to cluster mutual funds in each fund category into similar classes based on fund ratings of the five rating agencies. EM clustering is the unsupervised clustering technique, thus requiring neither subjective assumption about the weightings of individual rating agencies nor the number of pre-specified clusters. To partition mutual funds into similar classes, EM clustering starts with an initial guess about the parameters, uses them to compute the cluster probability for each mutual fund, employs this probability to re-estimate the parameters, iterates until achieving the maximization of the likelihood of the distributions, and finally selects the number of clusters automatically by the cross-validation method [32]. In this study, we employ Waikato Environment for Knowledge Analysis (WEKA) software for EM cluster analysis with 10fold cross-validation mode and a maximum of 100 iterations. Conducting EM clustering prior to classification analysis helps improve the accuracy of BN-TAN classifier in searching for all causal directions among constructs [33].
4.2.2. Stage 2: Bayesian Network with Tree Augmented NaiveBayes (BN-TAN) Classification Analysis
Classification is one of machine learning techniques for pattern recognition that assigns a class variable to instances described by a set of attributes. Among several algorithms of classification analysis, BN-TAN algorithm generally exhibits high performance in terms of classification accuracy [33]. More importantly, BN-TAN classifier is able to generate a directed acyclic graph that displays causal relations among a set of attributes and allows efficient and effective representation of the joint probability distribution over a set of random variables [31]. For these reasons, we use BN-TAN classifier to construct the causal interrelations among rating agencies. Without this kind of machine learning technique, researchers tend to subjectively identify the causal relationships between constructs using their own judgments. Due to the lack of theoretical guidance on the causal interrelations among rating agencies, BN-TAN classifier can serve as an alternative approach to search for all possible causal linkages between rating agencies. To construct a directed acyclic graph, BN-TAN classifier uses ratings of the five rating agencies as the input constructs and the categorical classes from EM clustering as the output construct. In this study, we use WEKA software for BN-TAN classifier with a test mode of 10fold cross-validation. For classification analysis in WEKA, there are four options (i.e., use training set, supplied test set, cross-validation and percentage split) available to run the classification algorithm. Following many studies, we chose the cross-validation option [33]. By design, BN-TAN classifier in WEKA is batch-trainable, i.e., it gets trained on the whole dataset at once.
4.2.3. Stage 3: Structural Equation Modeling (SEM)
Structural equation modeling (SEM) is a form of causal modeling and can be applied to an ever-expanding range of research disciplines [34]. Previous studies suggest that the directed acyclic graph generated by BN-TAN classifier should be reversed before estimating the path model [33]. The reason for reversing the causal direction produced by BN-TAN classifier is that U.S. News mutual fund scorecard is our target construct and the causal directions should be pointed from fund ratings of individual agencies toward the U.S. News mutual fund scorecard. Based on the reversed directed acyclic graph of BN-TAN classifier, SEM estimates the direct, indirect and total effects of agencies’ fund ratings on the U.S. News mutual fund scorecard. The direct effect is an association of one variable with another specified in the model. The indirect effect is an association of one variable with another mediated in the model through other variables. The total effect is the sum of the direct and indirect effects [34]. In this study, we use STATA software to estimate SEM for path models.
4.2.4. Stage 4: Important Performance Analysis (IPA)
Importance performance analysis (IPA) has been successfully used in various fields to define priorities and guide resource allocation decisions [35,36]. Due to often limited resources of asset management companies, IPA can be used to prioritize rating agencies for rating enhancement. To conduct IPA, we rescale fund ratings of each rating agency to obtain index values by subtracting the minimum possible value from a data point and then dividing this data point by the difference between the maximum and minimum data points [37]. IPA contrasts the total effect (importance) of each agency’s fund ratings on the x-axis and the average values of rescaled fund ratings (performance) on the y-axis. IPA suggests that fund managers should focus on the rating agency of which performance is relatively low, but importance is relatively high for priority improvement. Put differently, the rating agency with the lowest performance–importance ratio justifies the first priority for rating improvement, namely the critical driver of the U.S. News mutual fund scorecard, as it offers somewhat more headroom for future improvement in fund ratings.
5. Empirical Results
5.1. Summary Statistics and Pairwise Correlations of Fund Ratings
Since multiple agencies rate the same mutual funds, it is a matter of interest in whether fund ratings differ across rating agencies. Summary statistics for fund ratings of emerging and developed market fund categories are presented in Panel A of Table 1. The average fund ratings are around 60 points or 3 notches (20 points = 1 notch) for all rating agencies, with the exception of Zacks (34.59 points) for emerging market funds and TheStreet (36.49 points) for developed market funds. This implies that Zacks (TheStreet) on average gives ratings to emerging (developed) market funds around one notch (20 points) lower than any other agency. Compared between both fund categories, emerging market funds tend to receive higher mean ratings than developed market funds for all rating agencies except for Zacks whose emerging market funds receive around 1.5 notches (30 points) lower fund rating than developed markets. Of all rating agencies, Lipper has the lowest standard deviations and maximum–minimum spreads of fund ratings and also provides less extreme ratings at upper and lower bounds for both fund categories. The Jarque-Bera tests for normality indicate that the distributions of fund ratings of almost all rating agencies are normal, with the exception of Zacks (Zacks and TheStreet) for emerging (developed) market funds. Taken altogether, these results suggest that rating agencies seemingly disagree in fund ratings for both fund categories. We will shed more light on disagreement among rating agencies in the subsequent section.

Table 1.
Summary statistics and pairwise correlations of fund ratings.
To examine the interdependence between rating agencies, we report a pairwise correlation matrix of agencies’ fund ratings in Panel B of Table 1. Although the rating agencies do not perfectly agree with one another, fund ratings are somewhat correlated among rating agencies. For both fund categories, CFRA (Morningstar) has the highest (lowest) correlation with the U.S. News mutual fund scorecard. For emerging market funds, correlations between pairs of rating agencies range from −0.15 (between Morningstar and Zacks) to 0.79 (between CFRA and TheStreet). Similarly, pairwise correlations for developed market funds show that Morningstar and Zacks (CFRA and TheStreet) have the lowest (highest) correlation of 0.22 (0.70). The average correlation across all pairs of agencies for emerging market funds (0.344) is lower than that for developed market funds (0.446). This implies that the interdependence among rating agencies is less pronounced for emerging market funds than developed market funds.
5.2. The Comparison of Fund Ratings across Fund Categories and Rating Agencies
5.2.1. The Distribution of Fund Ratings across Fund Categories
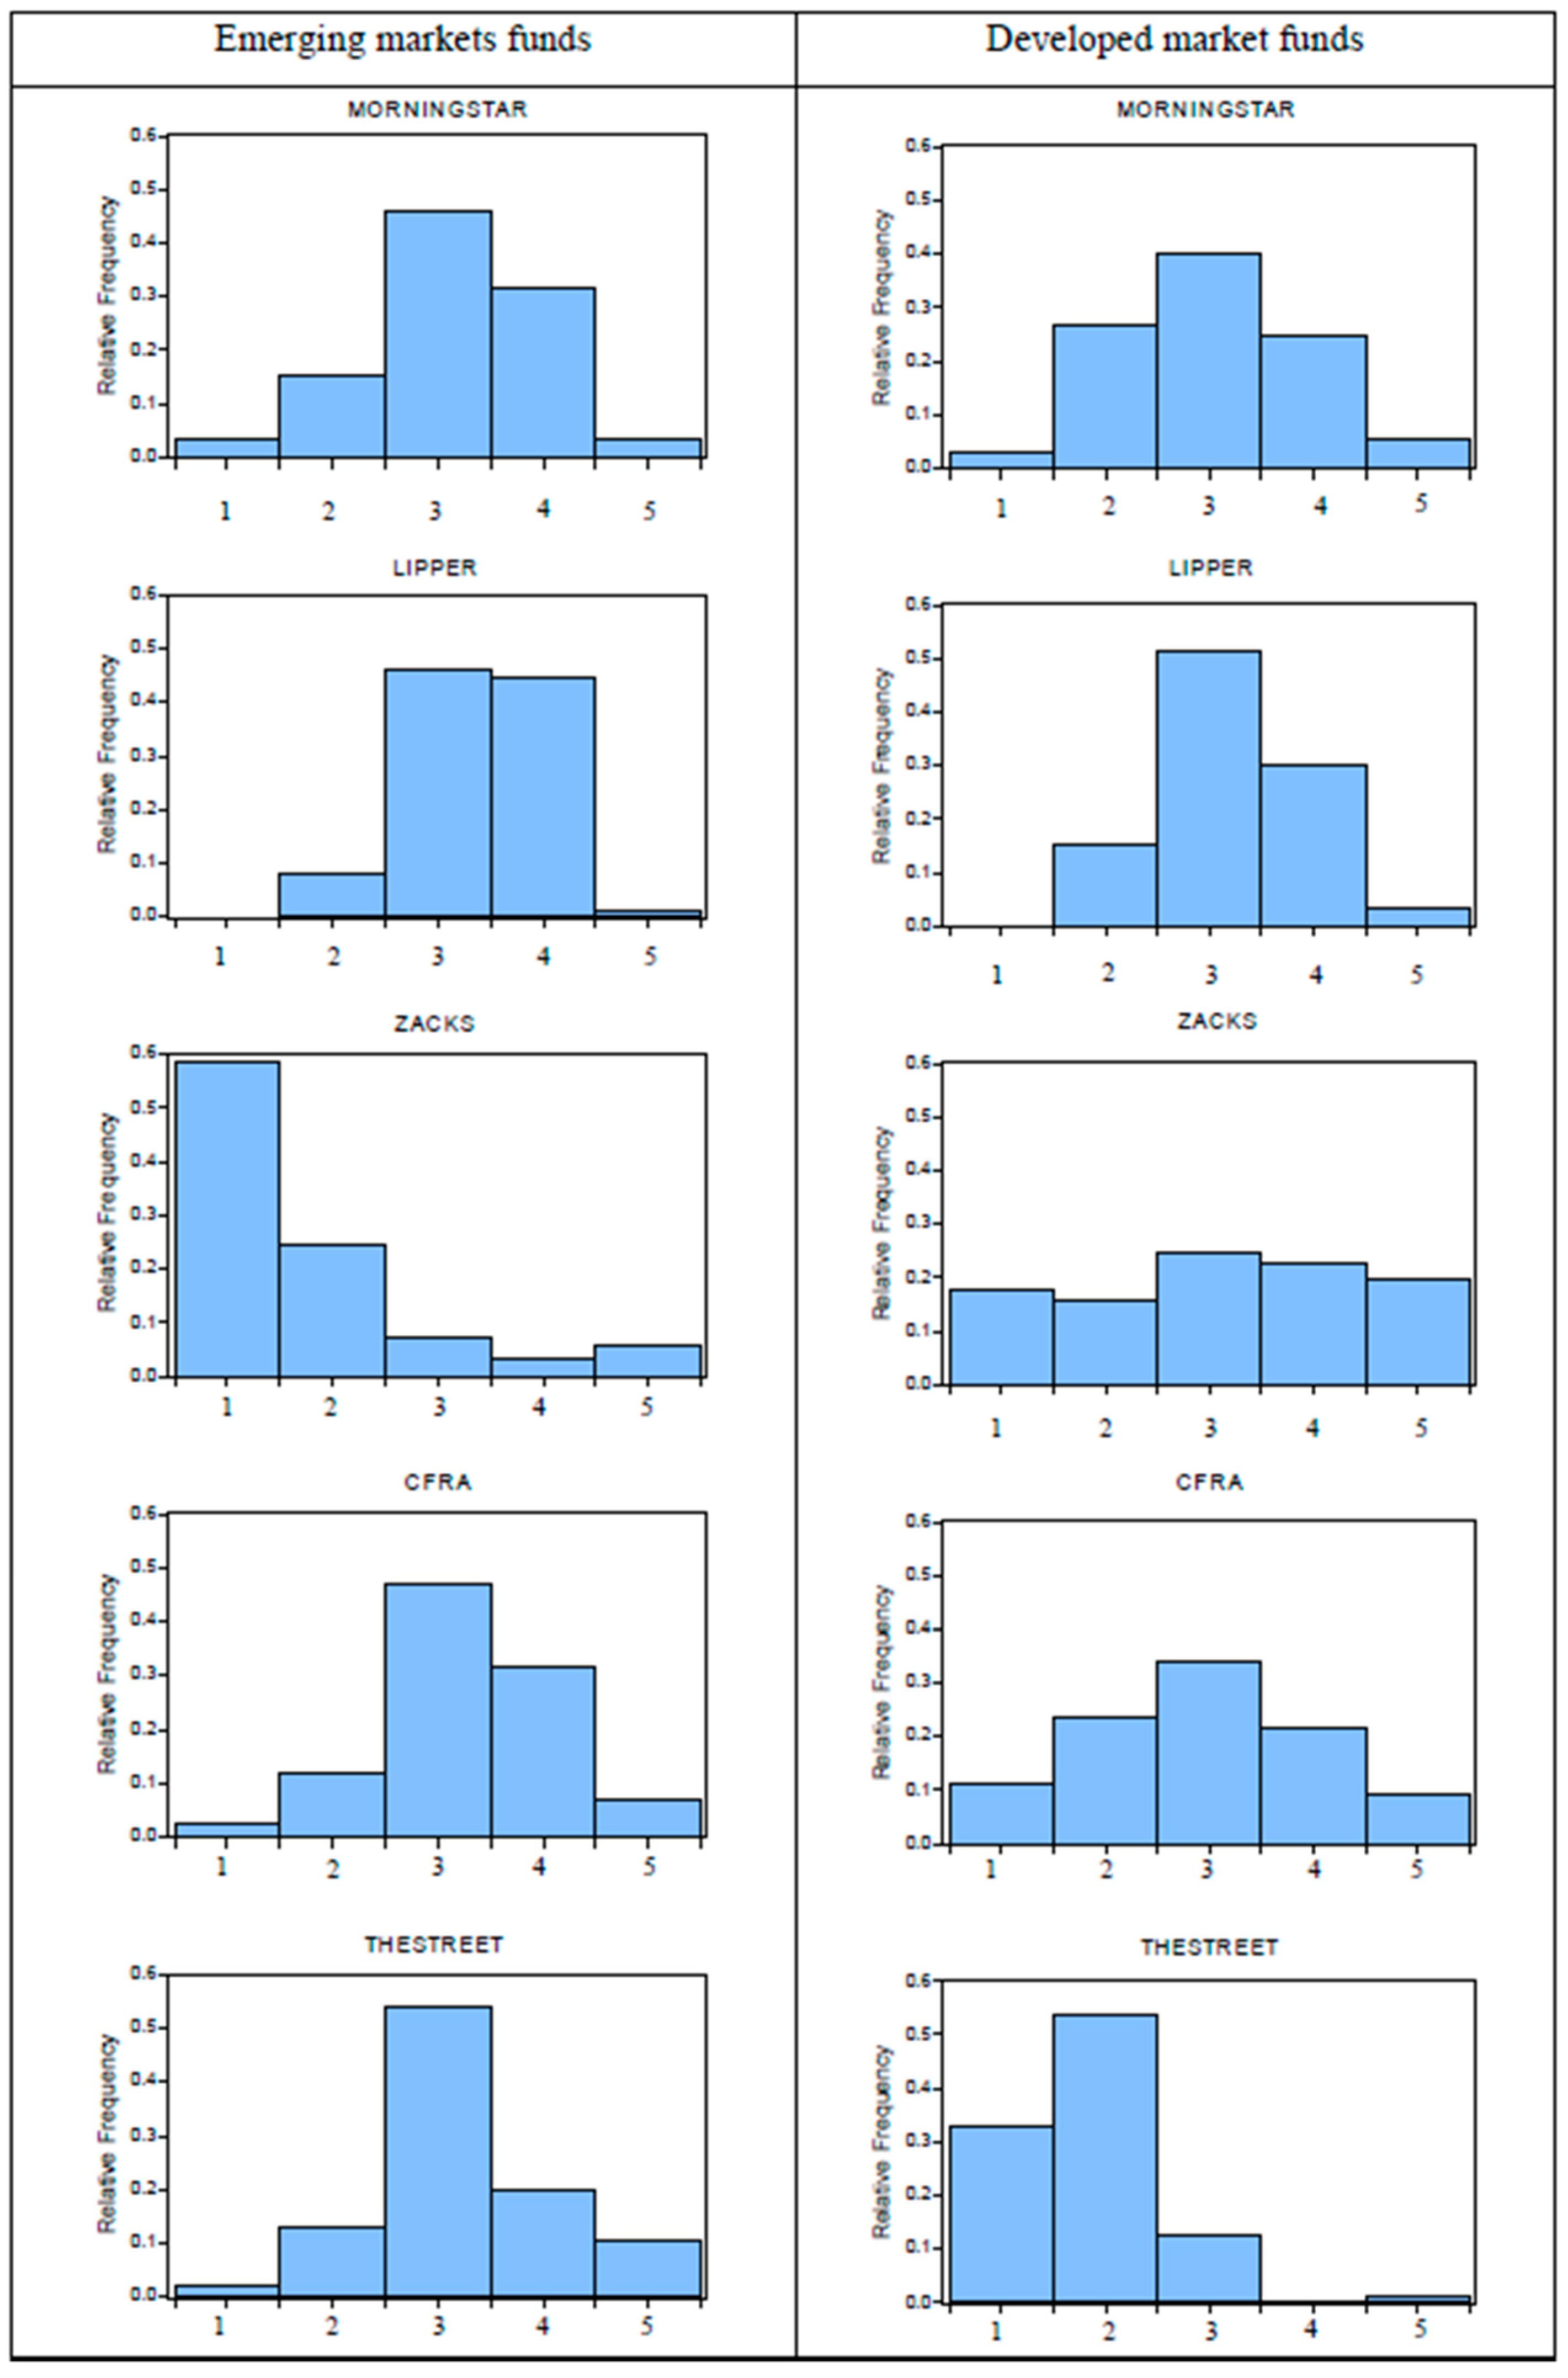
We first compare fund ratings between emerging and developed market fund categories. If rating agencies treat both fund categories equally, the distributions of fund ratings for emerging and developed market funds should be similar; that is, they should not reflect fund categories. In Figure 2, we illustrate the relative distribution of each agency’s fund ratings. For the sake of clarity, we show on the horizontal axis the five broader rating categories classified by the U.S. News’ normalized 100-point scale of each agency’s fund ratings: 0–20 (category 1), 21–40 (category 2), 41–60 (category 3), 61–80 (category 4) and 81–100 (category 5). This rating classification is consistent with the U.S. News’ method to convert fund ratings of a particular rating agency to the U.S. News mutual fund scorecard.

Figure 2.
The distributions of fund ratings. Notes: This figure shows the distributions of fund ratings for Morningstar, Lipper, Zacks, CFRA and TheStreet. The horizontal axis indicates the five broader rating categories classified by the U.S. News’ normalized 100-point scale of individual rating agencies: 0–20 (category 1), 21–40 (category 2), 41–60 (category 3), 61–80 (category 4) and 81–100 (category 5), with rating category 5 (1) being the highest (lowest) rating.
From Figure 2, two observations deserve particular attention. First, Morningstar and Lipper display fairly similar rating distributions across fund categories. Different from Morningstar, Lipper rates approximately 80% of mutual funds in rating categories 3 and 4, but none in the worst-rated category 1. This apparent rating inflation, an optimistic bias toward higher ratings, of Lipper can lead investors to believe that the number of top-ranked funds is higher than normal. Second, it is evident that the distributions of ratings for Zacks, CFRA and TheStreet somewhat differ across fund categories. CFRA has a skewed distribution for emerging market funds, while its developed market funds show a well-defined symmetrical distribution. Exceptionally, there is a rating deflation, the pessimistic fund ratings, in case of Zacks (TheStreet) for emerging (developed) market funds, as the vast majority of mutual funds fall in the lower rating categories 1 and 2. In this study, rating deflation (inflation) means that the sum of the percentage of mutual funds in rating categories 3 and 4 is less (greater) than that in rating categories 1 and 2. Rating deflation (inflation) implies the pessimistic (optimistic) fund assessment.
To perform statistical tests for the equality of rating distributions between both fund categories, we used the exact p-values of Kolmogorov–Smirnov tests under the null hypothesis that emerging and developed market fund ratings of a particular rating agency come from the same distribution. The results in Panel A of Table 2 confirm insignificant evidence against the equality of rating distributions between both fund categories for Morningstar and Lipper, as their exact p-values of Kolmogorov–Smirnov tests are above the 5% level of significance. By contrast, both fund categories of Zacks, CFRA and TheStreet do not have the same rating distribution function at conventional levels of significance. This rejects the first hypothesis (H1). A plausible rationale for this finding is that most rating agencies employ the relative rankings within each category of funds, which makes the rating distributions dependent on their definitions of the fund categories [3]. This implies that the U.S. News’ definitions of emerging and developed market fund categories tend to be different from those of Zack, CFRA and TheStreet, but similar to those of Morningstar and Lipper.
Table 2.
The comparisons of fund ratings across fund categories and rating agencies.
5.2.2. The Pairwise Comparison of Fund Rating across Rating Agencies
We next examine whether fund ratings vary across rating agencies. For each fund category in Figure 2, a visual inspection of rating distributions reveals some disagreement among rating agencies. To confirm this, we conduct pairwise comparisons of mean ratings using the U.S. News’ normalized 100-point scale of individual rating agencies. The results in Panel B of Table 2 show that for each fund category 4 of the 10 mean differences in fund ratings are significantly different from zero at a 1% significance level. More precisely, there are differences in the mean ratings between Zacks (TheStreet) and other rating agencies for emerging (developed) market funds. Zacks (TheStreet) on average provides the most pessimistic fund ratings for emerging (developed) market funds, as the corresponding t-statistics are highly significant. Therefore, this supports the second hypothesis (H2). For other rating agencies, we have insufficient information to statistically distinguish the mean ratings between any pair of Morningstar, Lipper, CFRA and TheStreet (Morningstar, Lipper, CFRA, Zacks) for emerging (developed) market funds, thereby implying that fund ratings of these rating agencies can be substitutes.
Disagreement among certain rating agencies is possibly due to differences in their methodologies and interpretations of information used for rating mutual funds. As suggested by Amenc and Le Sourd [3], disagreement among multiple rating agencies seems probable since rating agencies normally use different pre-defined percentile distributions to attribute their rating stars/scales. Disagreement in fund ratings has important implication for fund managers, investors and rating agencies. Disagreement among rating agencies may increase the monitoring effort of fund managers who usually “shop” for additional ratings in the hope of maximizing their average ratings for marketing campaigns. The term “rating shopping” is derived from the parallel studies of credit rating [38]. However, the key difference between credit ratings and fund ratings is that firms generally pay credit rating agencies to assess the firms’ credit quality, whereas mutual funds typically receive fund ratings from independent rating agencies without fees. In this study, “rating shopping” means fund managers’ behavior in seeking for the best possible ratings for promoting their mutual funds.
Rating shopping is likely to occur when rating agencies do not completely agree on fund ratings. In this context, fund managers may have every incentive to shop for the best possible ratings and choose to promote the most favorable ones to the public via media, while concealing the lower ratings. In addition, this rating shopping is likely to make rating agencies compromise on the quality of fund ratings and hence give higher than warranted fund ratings. For these reasons, investors should cross-check fund ratings from several agencies to gain more reliable ratings rather than depend on fund ratings from a particular rating agency for investment decision.
5.3. The Causal Relationships among Agencies’ Fund Ratings
Due to disagreement among rating agencies, it is highly unlikely that investors would directly compare agencies’ fund ratings to gain consensus for investment decisions. Investors may instead rely on the U.S. News mutual fund scorecard as a single indicator or a whole measure for fund selections. However, the U.S. News mutual fund scorecard using the simple average of fund ratings across rating agencies does not imply anything about the relative correlations, causal interrelations or explanatory power of either set of ratings in predicting the U.S. News mutual fund scorecard. It therefore seems invalid for the U.S. News to use the equally weighted aggregation of fund ratings issued by Morningstar, Lipper, Zacks, CFRA and TheStreet. To examine the relative importance and the causal interrelations among agencies’ fund ratings, we apply the four-stage interdisciplinary methodology as follows.
5.3.1. Stage 1: Expectation Maximization (EM) Cluster Analysis
We performed EM cluster analysis to classify mutual funds into similar classes. To do this, we used fund ratings of the five rating agencies (Morningstar, Lipper, Zacks, CFRA and TheStreet) as the independent variables and the resulted class as the outcome variable. For each fund category, EM clustering groups mutual funds into three classes: class 1 (22 funds), class 2 (38 funds) and class 3 (25 funds) for 85 emerging market funds and class 1 (24 funds), class 2 (40 funds) and class 3 (33 funds) for 97 developed market funds. The list of emerging and developed market funds in each cluster is available upon request. In Table 3, we report the descriptive statistics of fund ratings across classes, rating agencies and fund categories. Most of the associations between classes and rating agencies are apparent for both fund categories. From the sample mean, it is clear that class 3 is the top-rated class, followed by class 2 and class 1, respectively. This pattern holds for all rating agencies, with the exception of Zacks whose emerging market funds in class 1 (37.27 points) on average have higher ratings than class 2 (24.21 points).
Table 3.
Summary statistics of fund ratings by clusters.
5.3.2. Stage 2: Bayesian Network with Tree Augmented NaiveBayes (BN-TAN) Classification Analysis
To search for all possible causal relationships among rating agencies, we use BN-TAN classifier, with agencies’ fund ratings as the inputs and the categorical classes from EM clustering as the output. BN-TAN classifier generates a causal network in the form of directed acyclic graph as shown in Figure 3. It is worth noting that only unidirectional causality is allowed because the directed acyclic graph assumes that no rating agency can be both the cause and the effect of any other rating agency. Furthermore, a closed loop from one rating agency through one or more other rating agencies and back to the original rating agency is not allowed. It can be seen that fund ratings of individual agencies not only have the causal linkages to EM classes but also have the causal relationships with one another. The patterns of causal directions are different between emerging and developed market funds.
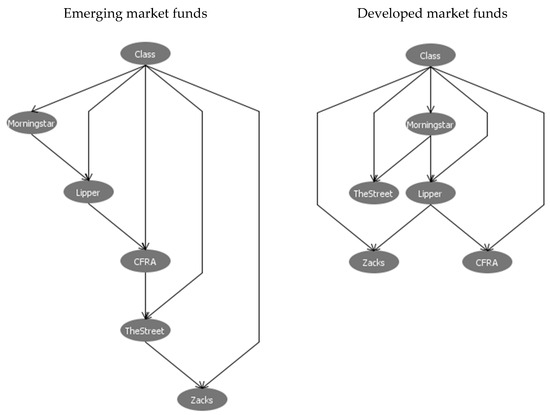
Figure 3.
The directed acyclic graphs of BN-TAN classification analysis. Notes: This figure shows the directed acyclic graphs of BN-TAN classifier produced by WEKA software. Fund ratings of the five rating agencies (Morningstar, Lipper, Zacks, CFRA and TheStreet) are used as the inputs. The categorical class from EM clustering is used as the output. WEKA software is used for BN-TAN classifier with a test mode of 10-fold cross-validation. In directed acyclic graph, only unidirectional causality is allowed because it assumes that no rating agency can be both the cause and the effect of any other rating agency. Furthermore, a closed loop from one rating agency through one or more other rating agencies and back to the original rating agency is not allowed.
As pointed out in the analytical framework, EM clustering is used to enhance BN-TAN classifier to produce accurate causal directions in Figure 3. Hence, the performance of EM clustering can be evaluated by the predictive accuracy of BN-TAN classifier relative to other classification algorithms [33]. This implies that EM clustering outcomes are not evaluated per se but are viewed as a means to improving the accuracy of BN-TAN classifier. To assess the accuracy of BN-TAN classifier, we repeat our classification analysis using several commonly used algorithms including J48, NaiveBayes, RBFNetwork and DTNB. The results in Table 4 reveal that classification accuracy of any algorithm is above 90%, with BN-TAN outperforming other algorithms. This suggests that the application of EM cluster analysis prior to BN-TAN classifier is quite satisfactory.
Table 4.
The classification accuracy.
5.3.3. Stage 3: Structural Equation Modeling (SEM)
As we described in the methodology section, we reversed the causal directions of the directed acyclic graph in Figure 3 and estimated the following system equations of SEM.
The system equations for emerging market fund category are:
The system equations for developed market fund category are:
where denotes the mutual fund, denotes the U.S. News mutual fund scorecard, , , , and denote fund ratings of individual rating agencies, is the error term, and are parameters.
We report the maximum likelihood estimates of SEM with the standardized solution in Table 5. The R-squared value indicates how much variance we explain for each endogenous construct. For both emerging and developed market funds, the R-squared values of the U.S. News unsurprisingly show that the combination of all agencies’ fund ratings has predictive power of 99% for the U.S. News mutual fund scorecard. Interestingly, the R-squared values of other endogenous constructs display some variations across rating agencies. Among the five rating agencies, our path models explain much variance in CFRA (Morningstar) for emerging (developed) market funds, with the R-squared value of 63% (43%).
Table 5.
The estimations of SEM for path models between the U.S. News mutual fund scorecard and agencies’ fund ratings.
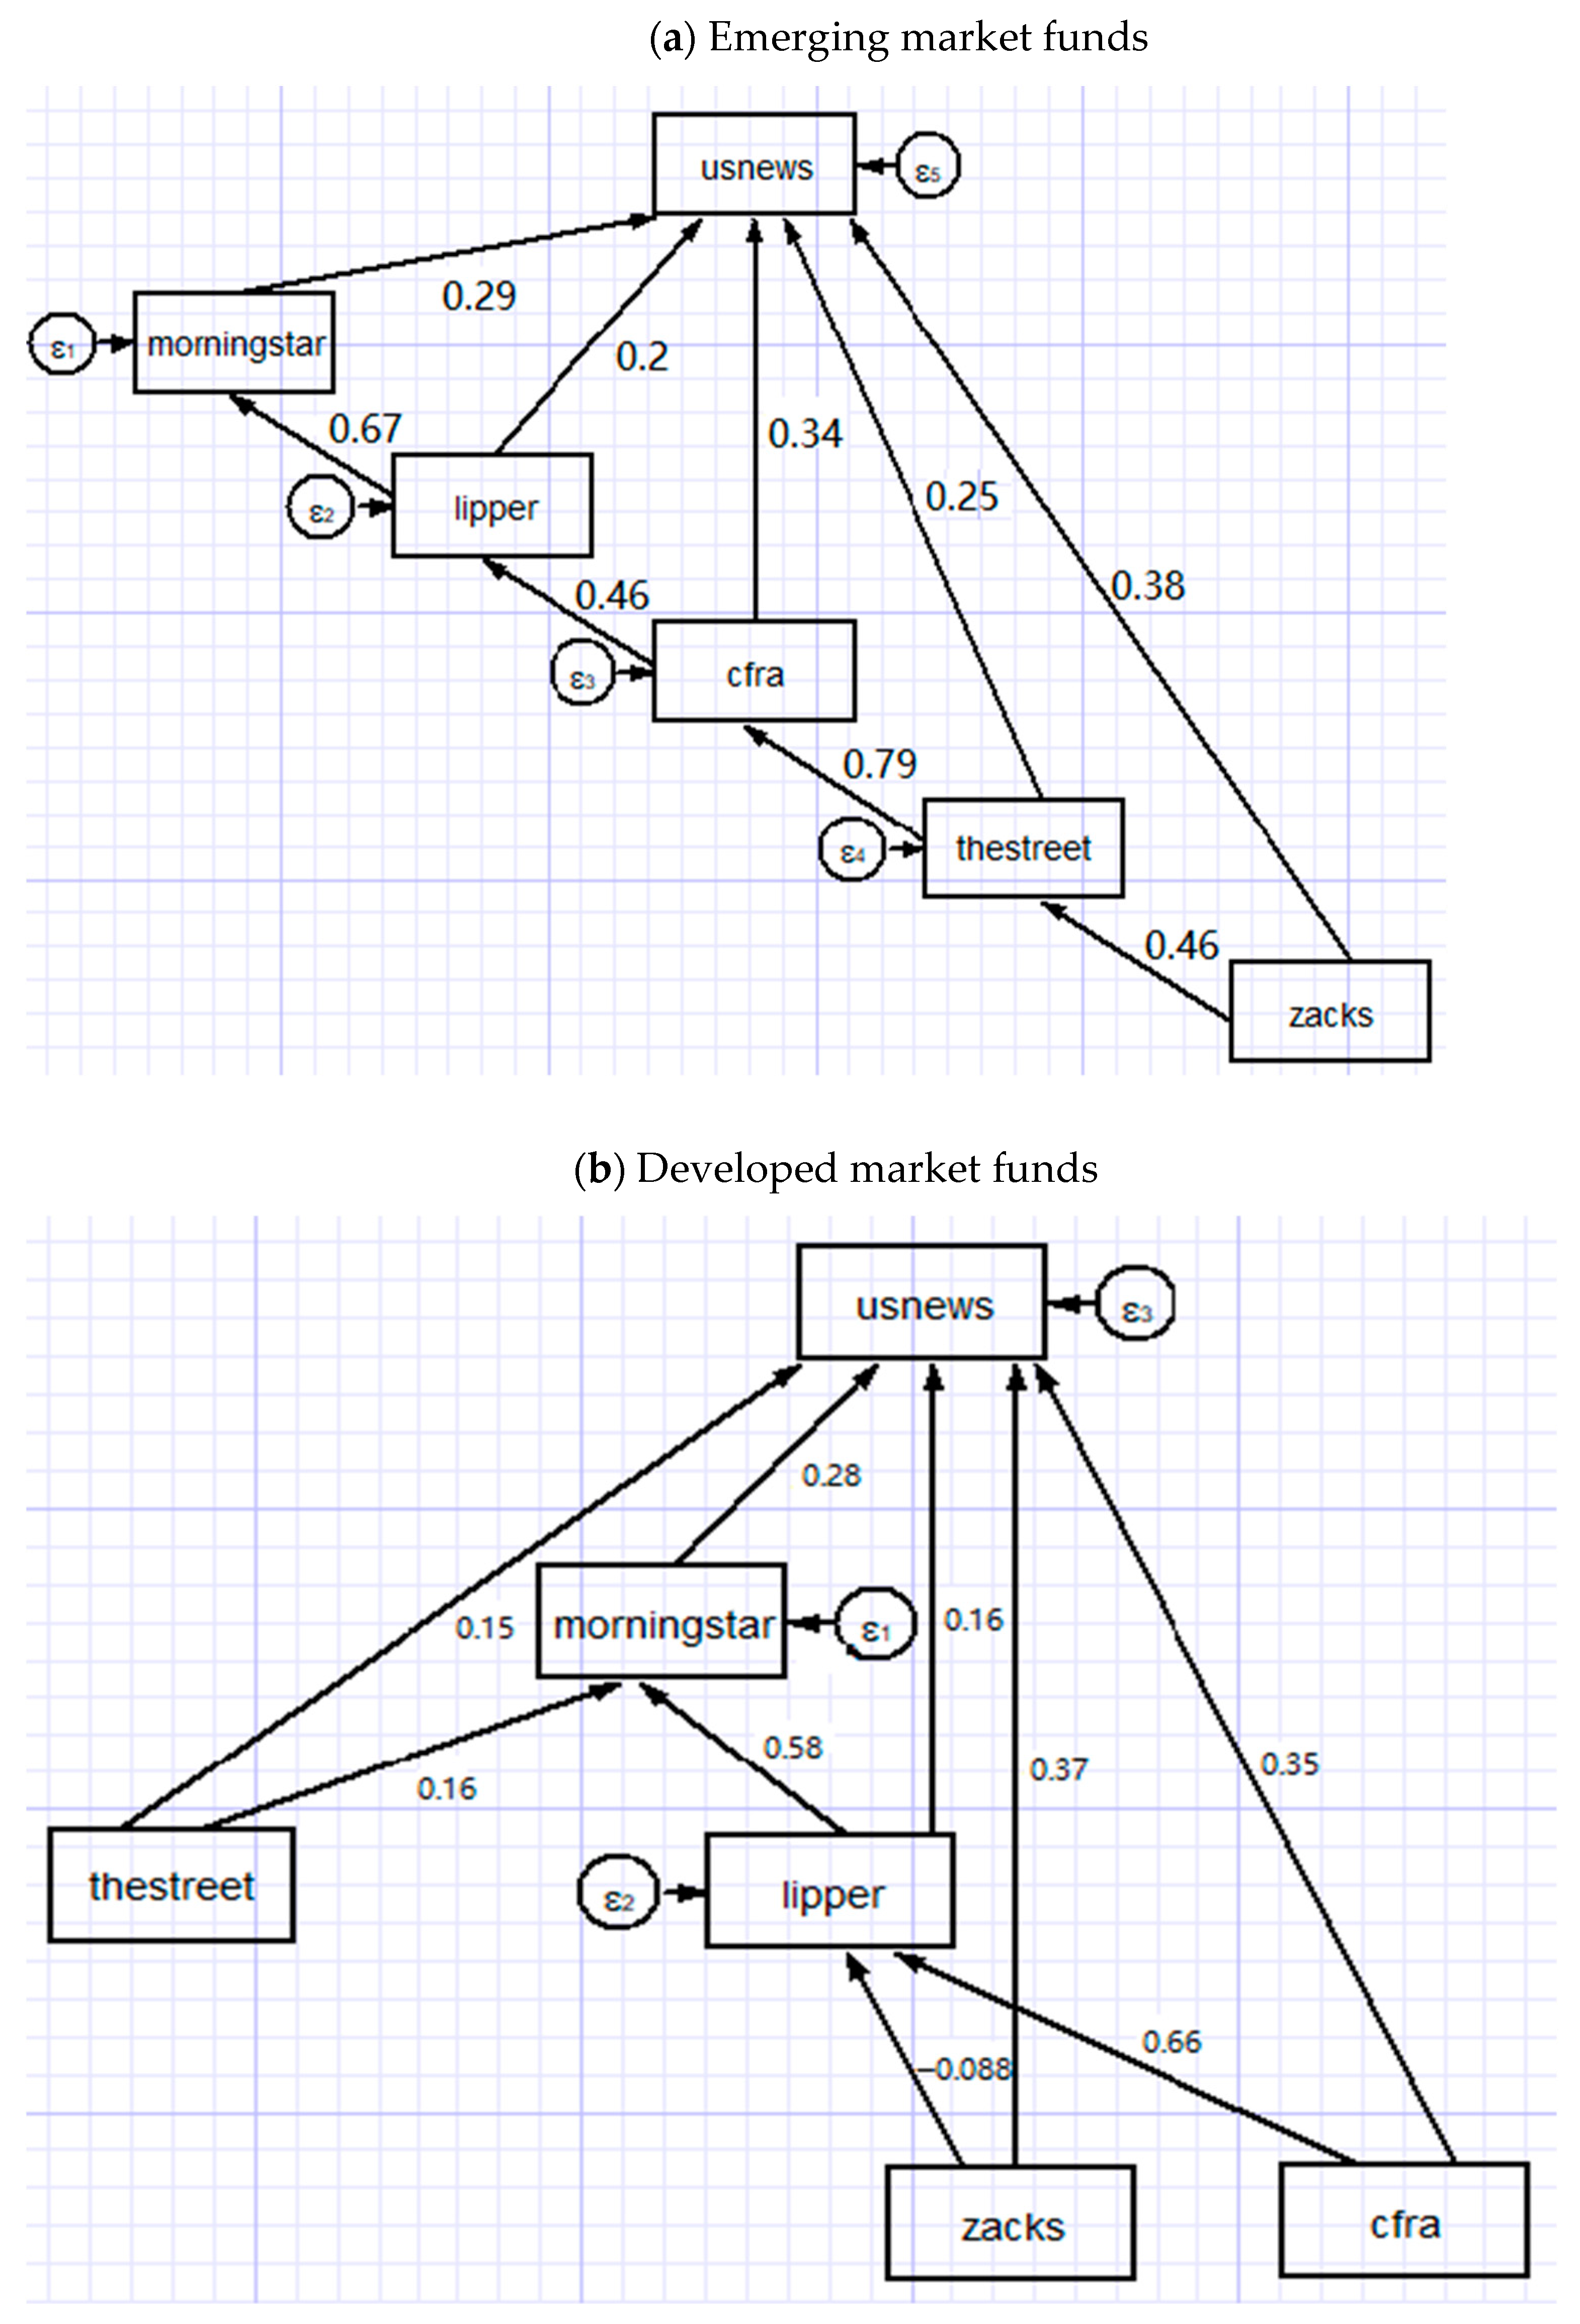
The standardized path coefficients in Figure 4 show that the U.S. News mutual fund scorecard is affected by not only the direct effects of individual agencies’ fund ratings but also their causal interrelations. To explore the relative influence of individual rating agencies, we report the direct, indirect and total effects in Table 5. The total effect equals the sum of direct and indirect effects. For instance, the path model of emerging market funds in Figure 4 and its estimated results in Table 5 show that Lipper and U.S. News are connected by the direct path Lipper → U.S. News, with the path coefficient of 0.203. Moreover, Lipper has the indirect effect on the U.S. News through indirect paths: Lipper → Morningstar → U.S. News. The indirect effect can be calculated as the product of path coefficients of Lipper → Morningstar (0.670) and Morningstar → U.S. News (0.287). Hence, the indirect effect is 0.670 × 0.287 = 0.192 and the total effect is 0.203 + 0.192 = 0.395.
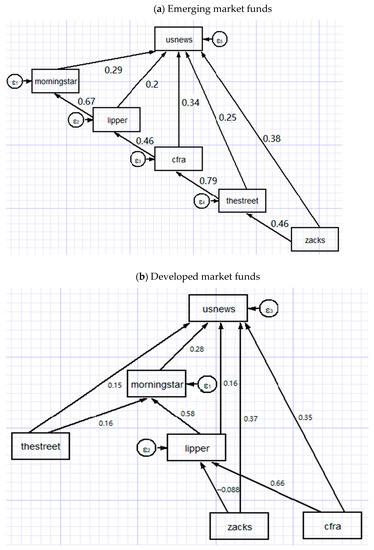
Figure 4.
The estimations of SEM for path models. Notes: This figure shows the path diagrams estimated by structural equation modeling (SEM) in system Equations (1) and (2). The causal directions are derived from the directed acyclic graph generated by BN-TAN classifier but reversed before estimating SEM. The path model includes six constructs: the U.S. News mutual fund scorecard and fund ratings of Morningstar, Lipper, Zacks, CFRA and TheStreet. The standardized path coefficients are presented along the corresponding single-headed arrows.
It is evidently clear that all direct, indirect and total effects are positive and highly statistically significant, with the exception of a few cases whose standardized effects are negative but insignificant. Focusing on the U.S. News construct of emerging (developed) market funds in Panel A (Panel B) of Table 5, Zacks (Zacks) has the greatest direct effect of 0.382 (0.371) on the U.S. News mutual fund scorecard, while TheStreet (CFRA) has the greatest indirect effect of 0.417 (0.210) and Zacks (CFRA) has the greatest total effect of 0.691 (0.558). The relative importance of total effects reveals that for emerging (developed) market funds Zacks (CFRA) exhibits the greatest total effect on the U.S. News, followed by TheStreet (Zacks), CFRA (Lipper), Lipper (Morningstar) and Morningstar (TheStreet). These unequal total effects provide evidence against the assumption of the U.S. News about the equal importance of fund ratings issued by individual rating agencies. These findings are supportive of the third hypothesis (H3). Furthermore, the indirect effects of all rating agencies but Zacks in case of developed market funds are statistically significant at conventional significance levels. This provides evidence against the assumption of the U.S. News about the independence between fund ratings of different agencies. Therefore, the fourth hypothesis (H4) cannot be rejected. The positive and significant indirect effects bring good news for investors and fund managers who benefit from multiple fund ratings due to the positive causal relationships (indirect effects) among rating agencies.
To assess how well our SEM estimations for path models fit the data, we report the goodness-of-fit statistics in Table 6. For both fund categories, the values of R-squared show that more than 90% of the variance in the U.S. News mutual fund scorecard is explained by our path models. As suggested by Acock [34], the insignificant Chi-squared values at the 5% level mean that we succeed in accounting for the covariance among our constructs. The root mean square errors of approximation (RMSEA) are below the goal of being less than 0.05. The comparative fit indices (CFI) are better than the conventional CFI target of 0.95. Overall, all goodness-of-fit statistics substantiate that our SEM estimations appropriately fit the data.
Table 6.
The estimations of SEM for path models.
5.3.4. Stage 4: Important Performance Analysis (IPA)
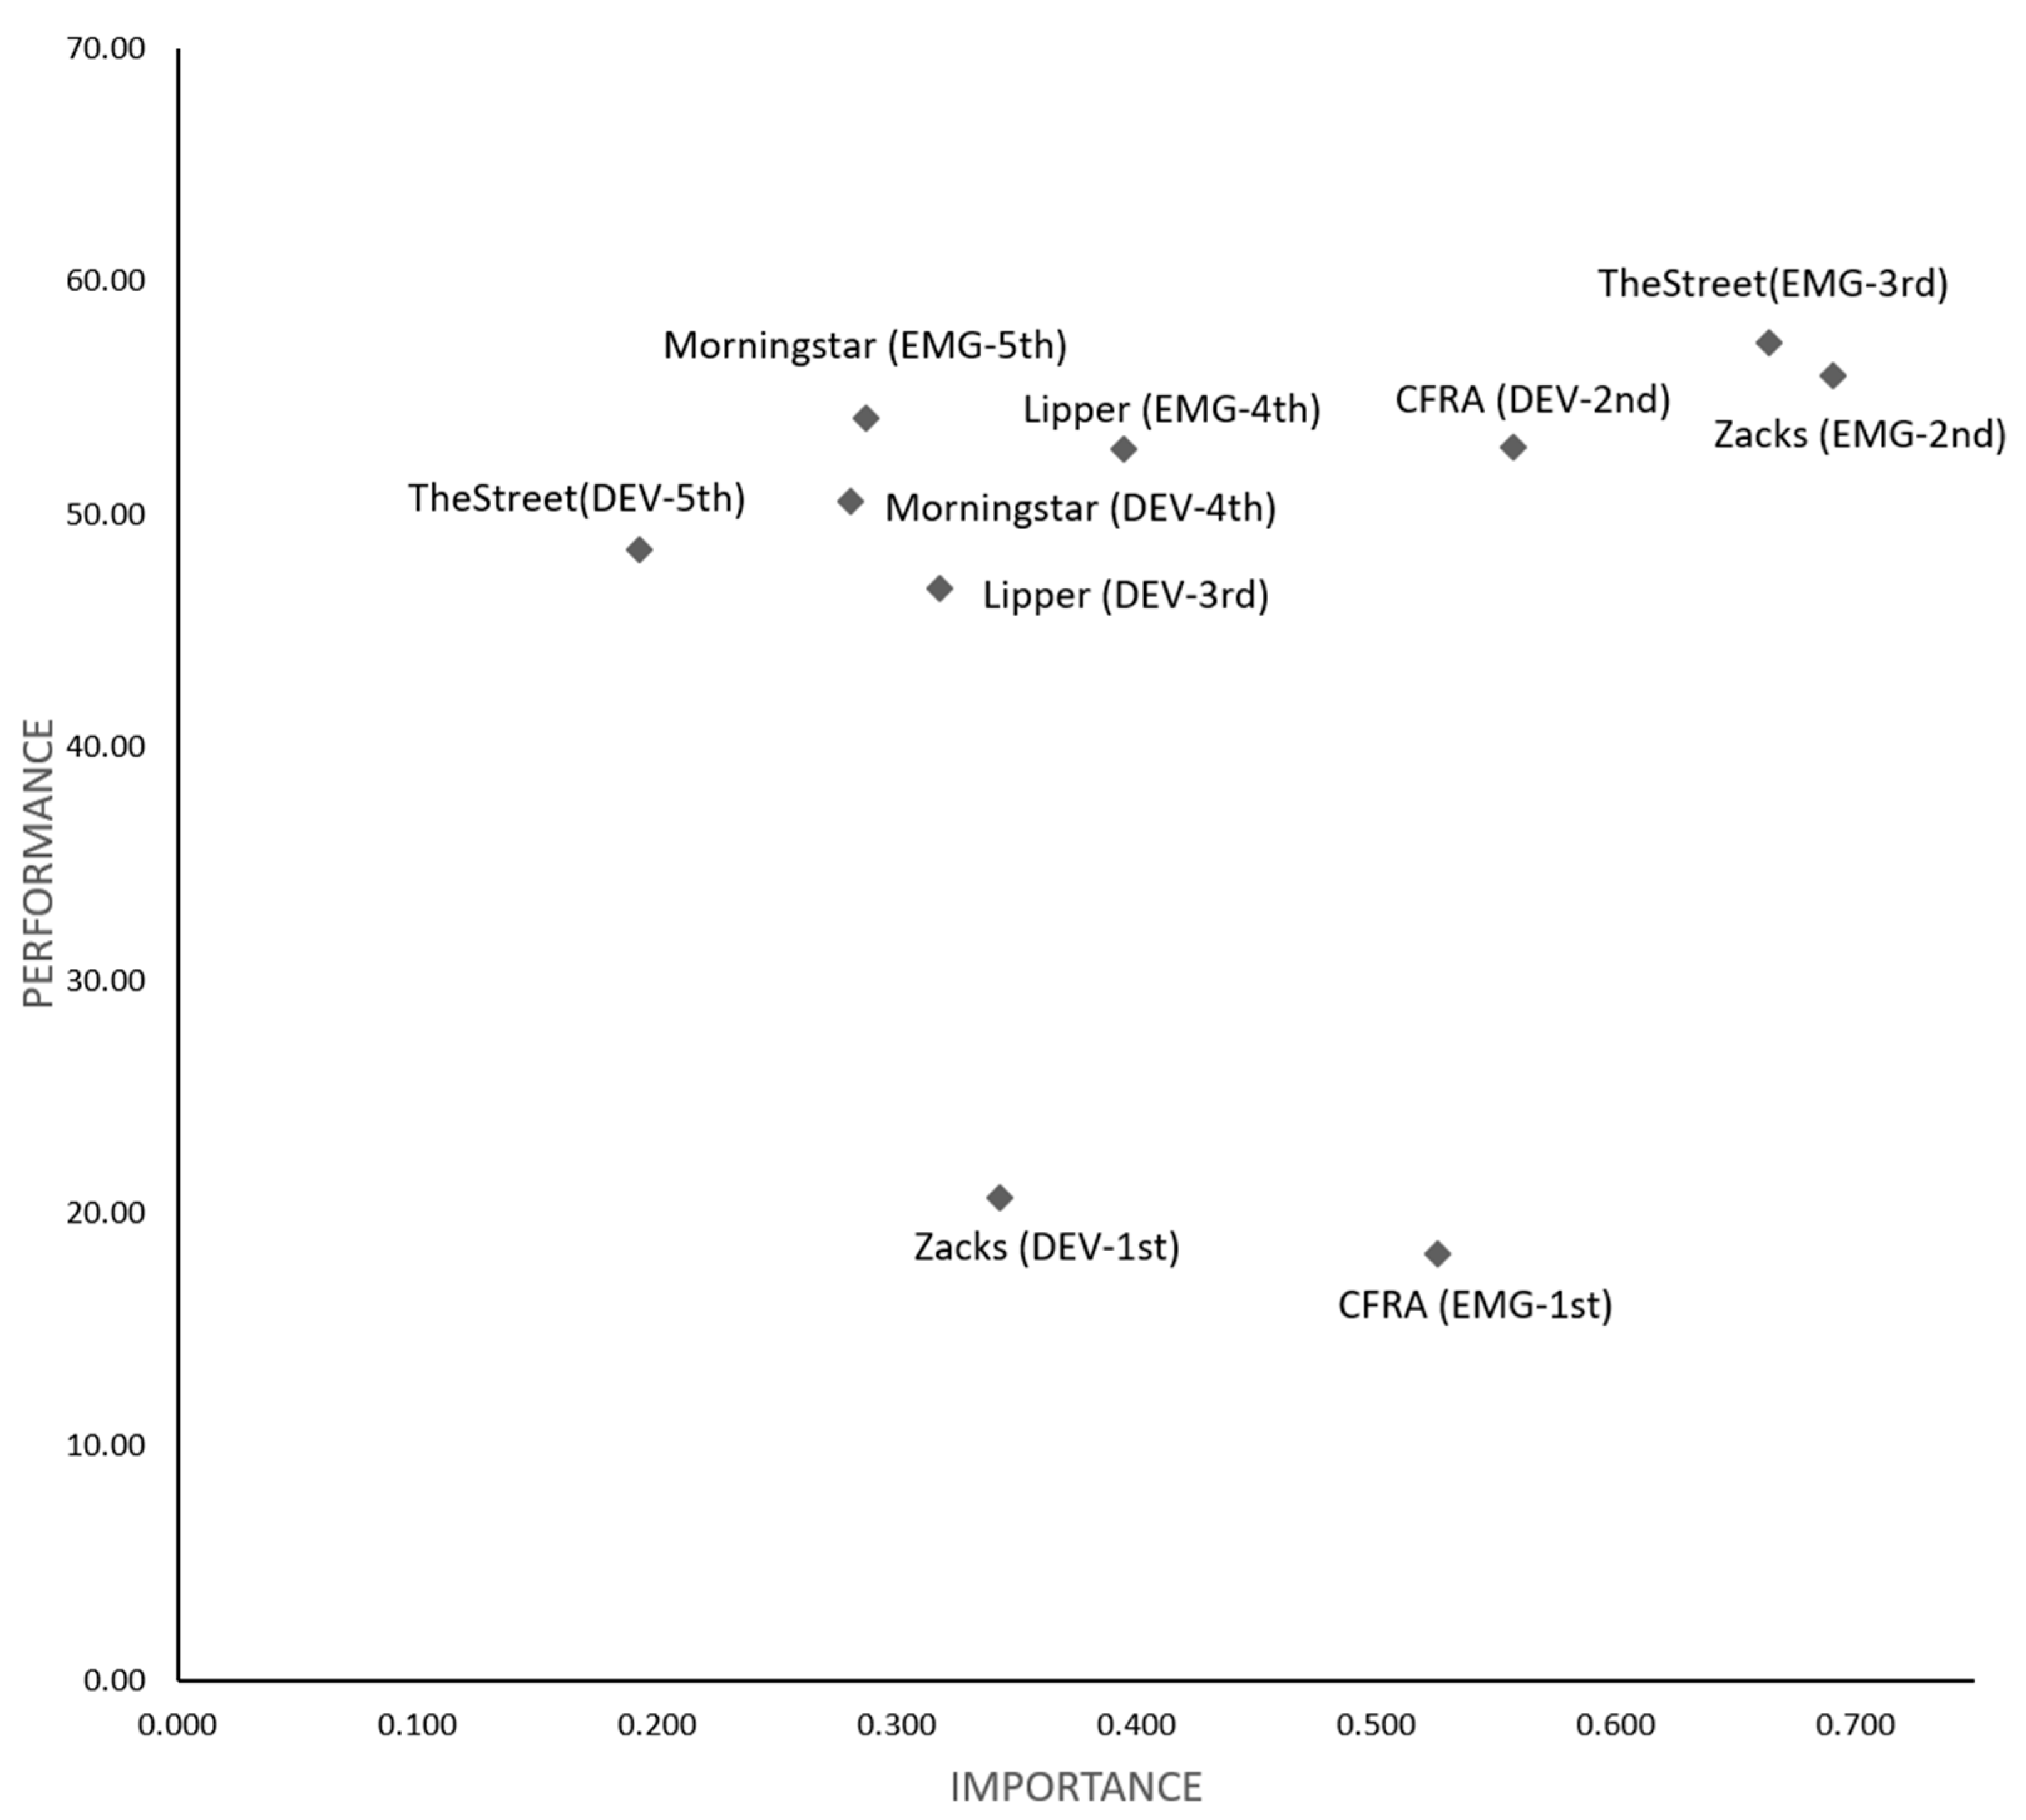
In practice, there is incentive for fund managers to achieve the top-ranked ratings in an attempt to attract fund flows from investors. With information regarding the critical rating agencies of the U.S. News mutual fund scorecard, fund managers are able to use their often limited resources more efficiently in improving fund ratings. To help fund managers identify the improvement prioritization of rating agencies, we performed IPA as shown in Figure 5. The rating agency with the lowest performance–importance ratio justifies the first improvement priority for fund managers to climb the U.S. News mutual fund scorecards and rankings since it offers somewhat more headroom for future improvement. The performance–importance ratios in Table 7 indicate that emerging market fund managers should improve fund ratings with the highest priority of CFRA (34.68), followed by Zacks (80.87), TheStreet (86.37), Lipper (133.57), and Morningstar (188.57), respectively. By the same token, developed market fund managers should focus on the highest priority rating agencies, which are ranked Zacks (60.11), CFRA (94.70), Lipper (147.17), Morningstar (179.79) and TheStreet (251.04).
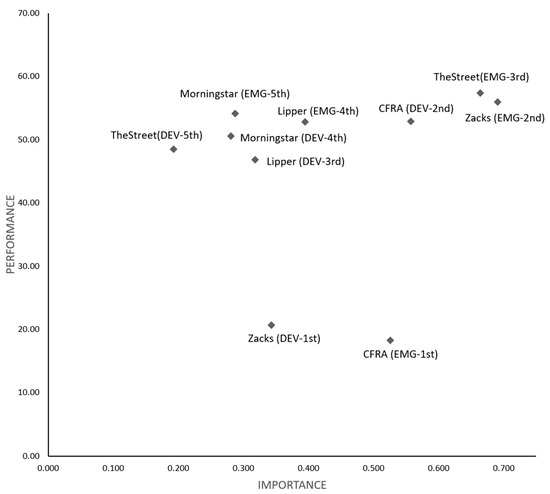
Figure 5.
Importance performance analysis. Notes: This figure shows the importance performance analysis (IPA) which contrasts the total effect (importance) of individual rating agencies on the x-axis and their corresponding average values of rescaled ratings (performance) on the y-axis. The rating agency with the lowest performance–importance ratio justifies the first priority for rating improvement, as it offers somewhat more headroom for future improvement. The five rating agencies (Morningstar, Lipper, Zacks, CFRA and TheStreet) are presented in IPA for emerging market funds (EMG) and developed market funds (DEV), with improvement prioritization (1st, 2nd, 3rd, 4th and 5th).
Table 7.
Performance–importance ratio.
6. Concluding Remarks
In this study, we provide one of the first comprehensive studies on SRI mutual fund ratings across multiple rating agencies—Morningstar, Lipper, Zacks, CFRA and TheStreet—in terms of their rating disagreement and causal interrelationships with the U.S. News mutual fund scorecard. We argue that a potential problem with the U.S. News mutual fund scorecard is that it aggregates fund ratings across multiple rating agencies by the equal weighting scheme, thus implicitly assuming that fund ratings of individual rating agencies are of equal importance and independent. To examine whether both assumptions of the U.S. News mutual fund scorecard are valid, we employed a novel four-stage interdisciplinary methodology including cluster analysis, classification analysis, structural equation modeling and importance performance analysis. The current study is the first attempt to apply this methodology to investigate the causal interdependence among rating agencies of SRI mutual funds. Based on a unique record of 85 emerging market funds and 97 developed market funds from the U.S. News website, our study provides a number of interesting results and implications.
First, there is disagreement in fund ratings across rating agencies. Compared to other rating agencies, Zacks (TheStreet) issues the most pessimistic fund ratings, the so-called rating deflation, for emerging (developed) market funds. When rating agencies do not completely agree on fund ratings, “rating shopping” is likely to occur [38]. Disagreement in fund ratings therefore has important implications for fund managers, rating agencies and investors. Fund managers probably commit rating shopping in the hope of maximizing their average fund ratings for marketing campaigns. Furthermore, rating shopping is likely to make rating agencies compromise on the quality of fund ratings and hence give higher than warranted fund ratings. As rating shopping influences fund managers and rating agencies, investors should cross-check fund ratings from various rating agencies to gain more reliable fund ratings rather than depend on a particular rating agency for investment decision.
Second, fund ratings of individual rating agencies have unequal effects on the U.S. News mutual fund scorecard and exhibit the causal relationships among one another. This evidence casts doubt on the validity of the equally weighted U.S. News mutual fund scorecard. Interestingly, there exists the positive causal relationships (the positive indirect effects) among multiple rating agencies. An important implication of this finding is that multiple rating agencies are indeed of avail to investors and fund managers. Due to the differences in sample design and methodology across rating agencies, fund ratings from various rating agencies are particularly important to capture the multidimensional aspects of fund performance (e.g., Sharpe ratio, expense ratio, information ratio, net return, standard deviation). Moreover, great variations across rating agencies may increase the monitoring effort of fund managers who have every incentive to select the best possible data source scores for promoting their mutual funds but concealing the lower ones. To guard against cherry picking of fund ratings from certain rating agencies by fund mangers, investors ought to rely on fund ratings of multiple rating agencies rather than any single one of these ratings or their equally weighted aggregation.
Finally, although individual rating agencies of the U.S. News are essential for investors in making investment decisions, it does not necessarily mean that fund managers should treat them with equal importance. Our proposed methodology has an important implication for fund managers who aim to climb the rankings of the U.S. News mutual fund scorecard. Fund managers should contrast importance with performance of individual rating agencies. This enables fund managers to identify which rating agencies are the critical drivers of the U.S. News mutual fund scorecard. Moreover, we find that improvement priorities of fund ratings differ across fund categories. We thus suggest emerging (developed) market fund managers allocate resources—which are often limited—with the first priority to improve ratings of CFRA (Zacks), followed by Zacks (CFRA), TheStreet (Lipper), Lipper (Morningstar) and Morningstar (TheStreet). With information regarding the critical drivers of the U.S. News mutual fund scorecard, fund managers use their resources more efficiently by focusing on rating agencies whose fund ratings are important and have more headroom for improvement.
While our study contributes to the existing literature by providing important insights into disagreement among agencies’ fund ratings and their causal interrelations, its limitations suggest future avenues for empirical studies. Rather than using cross-sectional data analysis techniques, rolling window Granger causality tests allow for the detection of changes in the directions of causality over time [39,40]. The dynamic causal linkages across percentiles through a rolling window scheme could offer a clearer understanding of the plausible dynamic interrelations at different parts of the distribution of fund ratings. Furthermore, although our methodology overcomes the need for a priori weights to aggregate fund ratings across rating agencies, it does not provide a new weighting scheme for the U.S. News mutual fund scorecard. Future research could take into account other weighting approaches to the construction of the composite fund ratings such as data envelopment analysis, stability maximization and stochastic dominance [6,26].
Author Contributions
Conceptualization, P.B., B.J.; methodology, B.J.; software, B.J.; validation, P.B.; formal analysis, B.J.; investigation, B.J.; resources, P.B.; data curation, B.J.; writing—original draft preparation, B.J.; writing—review and editing, P.B., B.J.; visualization, B.J.; supervision, P.B.; project administration, P.B., B.J. All authors have read and agreed to the published version of the manuscript.
Funding
This research received no external funding.
Institutional Review Board Statement
Not applicable.
Informed Consent Statement
Not applicable.
Data Availability Statement
The data that support the findings of this study are available from the corresponding author.
Conflicts of Interest
The authors declare no conflict of interest.
Appendix A. The Rating Methodology of Rating Agencies
Appendix A.1. The Lipper Rating
The Lipper ratings provide a measure of a fund’s success against five key metrics (i.e., total return, consistent return, preservation, tax efficiency and expense). The Lipper rating for total return identifies a fund that has provided relatively superior total returns (i.e., capital appreciation and income from dividends and interest rate) when compared to a group of similar funds. The Lipper rating for total return may be the best fit for investors who need the best historical return, without considering risk. The Lipper rating for consistent return is a fund that has provided relatively superior consistency and risk-adjusted returns when compared to a group of similar funds. A fund which achieves high ratings for consistent return may be the best fit for investors who focus on a fund’s year-to-year consistency relative to the funds in a particular peer group. The Lipper rating for preservation identifies a fund that has shown a superior ability to preserve capital in a variety of markets when compared with other funds in the same asset class. Choosing a Lipper rating for preservation may help to minimize downside risk relative to other fund choices in the same asset class. The Lipper rating for tax efficiency denotes a fund that has been successful at deferring taxes over the measurement period relative to similar funds. The Lipper rating for tax efficiency may be the best fit for tax-conscious investors who hold investments that are not in a defined-benefit or retirement plan account. The Lipper rating for expense denotes a fund that has effectively managed to keep its expenses low relative to its peer groups and within its load structure. The Lipper rating for expense may be the best fit for investors who want to minimize their total costs.
Appendix A.2. The Zacks Rating
The goal of the Zacks mutual fund rating is to facilitate investors to select funds that will potentially outperform the market in the future. The rating system for the Zacks mutual fund rank works exactly like the popular Zacks rank for stocks. Unlike most of the fund-rating systems, the Zacks Rating is not just focused on past performance, but the likely future success of the fund. The rating system for the Zacks Rating gives every fund a ranking on a one-to-five scale: 1 (Strong Buy), 2 (Buy), 3 (Hold), 4 (Sell) and 5 (Strong Sell). A rating of one signifies what they consider a “strong buy” recommendation, and a rating of five suggests a “strong sell” recommendation. The Zacks rating system differs from most popular fund rating systems which generally give five ratings to the best-performing funds. Investors should hold on to their funds that are ranked 1 (Strong Buy), 2 (Buy) and 3 (Hold). Nevertheless, if investors have any rated funds with 4 or 5 ratings, then they should consider selling them now and replace them with higher ranked funds.
Appendix A.3. The CFRA Rating
The CFRA mutual fund rating model assigns an overall star rating by using a five-tiered star ratings approach for mutual funds. The 1-star rating means that total return is expected to underperform the total return of related mutual funds over the coming 12 months. The 2-star rating means that total return is expected to slightly underperform the total return of related mutual funds over the coming 12 months. The 3-star rating means that total return is expected to closely approximate the total return of related mutual funds over the coming 12 months. The 4-star rating means that total return is expected to slightly outperform the total return of related mutual funds over the coming 12 months. The 5-star means that total return is expected to outperform the total return of related mutual funds over the coming 12 months.
Appendix A.4. The TheStreet Rating
TheStreet fund rating system condenses the available fund performance and risk data into a single composite opinion of each fund’s risk-adjusted performance. The rating system for TheStreet gives every fund a ranking on a A-to-E scale: A (Excellent), B (Good), C (Fair), D (Weak) and E (Very Weak). The A-rating means that the fund has an excellent track record of maximizing performance while minimizing risk, thus delivering the best possible combination of total return on investment and reduced volatility. While past performance is just an indication—not a guarantee—this fund is among the most likely to deliver superior performance relative to risk in the future. The B-rating means that the fund has a good track record of balancing performance with risk. Compared with other funds, it has achieved above-average returns given the level of risk in its underlying investments. While the risk-adjusted performance of any fund is subject to change, this fund has proven to be a good investment in the recent past. The C-rating means that in the trade-off between performance and risk, the fund has a track record which is about average. With other funds, the risk may be lower than average, but the returns are also lower. In short, based on recent history, there is no particular advantage to investing in this fund. The D-rating means that the fund has underperformed in the universe of other funds given the level of risk in its underlying investments, resulting in a weak risk-adjusted performance. While the risk-adjusted performance of any fund is subject to change, this fund has proven to be a bad investment over the recent past. The E-rating means that the fund has significantly underperformed most other funds given the level of risk in its underlying investments, resulting in a very weak risk-adjusted performance. While the risk-adjusted performance of any fund is subject to change, this fund has proven to be a very bad investment in the recent past.
Appendix A.5. The Morningstar Rating
The Morningstar rating has two key characteristics: (1) the peer group for each fund’s rating is its Morningstar category and (2) the ratings are based on funds’ risk-adjusted returns. The Morningstar rating is based on Morningstar risk-adjusted return, using Morningstar risk-adjusted return % rank for funds in a category. Morningstar calculates ratings for the 3-, 5- and 10-year periods, and then the overall Morningstar rating is based on a weighted average of the available time-period ratings. Morningstar ranks all funds in a category using Morningstar risk-adjusted return, and the funds with the highest scores receive the most stars. A fund’s peer group for the 3-, 5-, and 10-year ratings is based on the fund’s current category. That is, there is no adjustment for historical category changes in the 3-, 5-, and 10-year ratings. All funds in the category are sorted by Morningstar risk-adjusted return % rank in descending order. Starting with the highest Morningstar risk-adjusted return % rank, those funds with a rank that meets but does not exceed 10% receive a 5-star rating. Funds with a rank that meets but does not exceed 32.5% receive a 4-star rating. Funds with a rank that meets but does not exceed 67.5% receive a 3-star rating. Funds with a rank that meets but does not exceed 90% receive a 2-star rating. The remaining funds receive 1 star.
References
- Barber, B.M.; Odean, T.; Zheng, L. Out of sight, out of mind: The effects of expenses on mutual fund flows. J. Bus. 2005, 78, 2095–2119. [Google Scholar] [CrossRef]
- Jain, P.C.; Wu, J.S. Truth in mutual fund advertising: Evidence on future performance and fund flows. J. Financ. 2000, 55, 937–958. [Google Scholar] [CrossRef]
- Amenc, N.; Le Sourd, V. Rating the ratings: A critical analysis of fund rating systems. Work. Pap. EDHEC Bus. Sch. 2007, unpublished. [Google Scholar]
- Blake, C.; Morey, M. Morningstar ratings and mutual fund performance. J. Financ. Quant. Anal. 2000, 35, 907–936. [Google Scholar] [CrossRef]
- Dyakov, T.; Verbeek, M. Can mutual fund investors distinguish good from bad managers? Int. Rev. Financ. 2018, 19, 505–540. [Google Scholar] [CrossRef] [Green Version]
- Morey, M.R.; Morey, R.C. Mutual fund performance appraisals: A multi-horizon perspective with endogenous benchmarking. Omega 1999, 27, 241–258. [Google Scholar] [CrossRef]
- Zeng, Y.; Yuan, Q.; Zhang, J. Blurred stars: Mutual fund ratings in the shadow of conflict of interest. J. Bank. Financ. 2015, 60, 284–295. [Google Scholar] [CrossRef]
- Adkisson, J.A.; Fraser, D.R. Reading the stars: Age bias in Morningstar ratings. Financ. Anal. J. 2003, 59, 24–27. [Google Scholar] [CrossRef]
- Bolster, P.J.; Trahan, E.A. Investing in Morningstar five-star stock upgrades: Price and style effects. J. Account. Financ. 2013, 6, 193–208. [Google Scholar]
- Chen, A.N.; Wang, S.Y.; Yu, P.L. Evaluating multi-criteria ratings of financial investment options. Int. Rev. Econ. Financ. 2014, 31, 46–58. [Google Scholar] [CrossRef]
- Otero-González, L.; Santomil, P.D.; Correia-Domingues, R.H. Do investors obtain better results selecting mutual funds through quantitative ratings? Span. J. Financ. Account. 2020, 49, 265–291. [Google Scholar] [CrossRef]
- Mugerman, Y.; Hecht, Y.; Wiener, Z. On the failure of mutual fund industry regulation. Emerg. Mark. Rev. 2019, 38, 51–72. [Google Scholar] [CrossRef]
- Graham, J.E.; Lassala, C.; Ribeiro Navarrete, B. A fuzzy-set analysis of conditions influencing mutual fund performance. Int. Rev. Econ. Financ. 2018, 61, 324–336. [Google Scholar] [CrossRef]
- Otero-González, L.; Santomil, P.D. Is quantitative and qualitative information relevant for choosing mutual funds? J. Bus. Res. 2021, 123, 476–488. [Google Scholar] [CrossRef]
- Brandouy, O.; Kerstens, K.; van de Woestyne, I. Frontier-based vs. traditional mutual fund ratings: A first back testing analysis. Eur. J. Oper. Res. 2015, 242, 332–342. [Google Scholar] [CrossRef]
- Ammann, M.; Bauer, C.; Fischer, S.; Müller, P. The impact of the Morningstar sustainability rating on mutual fund flows. Eur. Financ. Manag. 2019, 25, 520–553. [Google Scholar] [CrossRef]
- Huang, C.; Li, F.; Weng, X. Star ratings and the incentives of mutual funds. J. Financ. 2020, 75, 1715–1765. [Google Scholar] [CrossRef]
- Morey, M.R. Mutual fund age and Morningstar rating. Financ. Anal. J. 2002, 58, 56–63. [Google Scholar] [CrossRef]
- Barron, J.M.; Ni, J. Morningstar ratings and mutual fund manager turnover. J. Appl. Financ. 2013, 23, 95–110. [Google Scholar]
- Glawischnig, M.; Sommersguter-Reichmann, M. Assessing the performance of alternative investments using non-parametric efficiency measurement approaches: Is it convincing. J. Bank. Financ. 2010, 34, 295–303. [Google Scholar] [CrossRef]
- Murthi, B.P.S.; Choi, Y.K.; Desai, P. Efficiency of mutual funds and portfolio performance measurement: A non-parametric approach. Eur. J. Oper. Res. 1997, 98, 408–418. [Google Scholar] [CrossRef]
- Vinod, H.D. Ranking mutual funds using unconventional utility theory and stochastic dominance. J. Empir. Financ. 2004, 11, 353–377. [Google Scholar] [CrossRef]
- Bruggemann, R.; Patil, G.P. Ranking and Prioritization for Multi-Indicator System; Springer: New York, NY, USA, 2011. [Google Scholar]
- Tower, E.; Zheng, W. Ranking of mutual fund families: Minimum expenses and maximum loads as markers for moral turpitude. Int. Rev. Econ. 2008, 55, 315–350. [Google Scholar] [CrossRef]
- Goyal, P.; Rahman, Z. Identification and prioritization of corporate sustainability practices using analytical hierarchy process. J. Model. Manag. 2015, 10, 23–49. [Google Scholar] [CrossRef]
- Lozano, S.; Gutierrez, E. Data envelopment analysis of mutual funds based on second-order stochastic dominance. Eur. J. Oper. Res. 2008, 189, 230–244. [Google Scholar] [CrossRef]
- Elton, E.J.; Gruber, M.J.; Blake, C.E. A first look at the accuracy of the CRSP mutual fund database and a comparison of the CRSP and Morningstar mutual fund databases. J. Financ. 2001, 56, 2415–2430. [Google Scholar] [CrossRef] [Green Version]
- Grupp, H.; Schubert, T. Review and new evidence on composite innovation indicators for evaluating national performance. Res. Policy 2010, 39, 67–78. [Google Scholar] [CrossRef]
- Budsaratragoon, B.; Jitmaneeroj, B. A critique on the corruption perceptions index: An interdisciplinary approach. Socio-Econ. Plan. Sci. 2020, 70. [Google Scholar] [CrossRef]
- Jitmaneeroj, B. Reforms priorities for corporate sustainability: Environmental, social, governance, or economic performance? Manag. Decis. 2016, 54, 1497–1521. [Google Scholar] [CrossRef]
- Friedman, N.; Geiger, D.; Goldszmidt, M. Bayesian network classifiers. Mach. Learn. 1997, 29, 131–163. [Google Scholar] [CrossRef] [Green Version]
- Witten, I.; Frank, E.; Hall, M. Data Mining: Practical Machine Learning Tools and Techniques; Morgan Kaufmann: San Francisco, CA, USA, 2011. [Google Scholar]
- Lan, L.W.; Lee, Y.T.; Wu, W.W. On the decision structures and knowledge discovery for ANP modeling. Int. J. Intell. Sci. 2013, 3, 15–23. [Google Scholar] [CrossRef]
- Acock, A.C. Discovering Structural Equation Modeling Using Stata; Stata Press: Texas, TX, USA, 2013. [Google Scholar]
- Budsaratragoon, B.; Jitmaneeroj, B. Measuring causal relations and identifying critical drivers for corporate sustainability: The quadruple bottom line approach. Meas. Bus. Excell. 2019, 23, 1368–3047. [Google Scholar] [CrossRef]
- Jitmaneeroj, B. Beyond the equal-weight framework of the social progress index: Identifying causal relationships for policy reforms. Int. J. Soc. Econ. 2017, 44, 2336–2350. [Google Scholar] [CrossRef]
- Hair, J.F.; Hult, G.T.M.; Ringle, C.M.; Sarstedt, M. A Primer on Partial Least Squares Structural Equation Modeling (PLS-SEM); Sage: California, CA, USA, 2017. [Google Scholar]
- Skreta, V.; Veldkamp, L. Rating shopping and asset complexity: A theory of rating inflation. J. Monet. Econ. 2009, 56, 678–695. [Google Scholar] [CrossRef] [Green Version]
- Delis, M.D.; Mylonidis, N. The chicken or the egg? A note on the dynamic interrelation between government bond spreads and credit default swaps. Financ. Res. Lett. 2011, 8, 163–170. [Google Scholar] [CrossRef] [Green Version]
- Nyakabawo, W.; Miller, S.M.; Balcilar, M.; Das, S.; Gupta, R. Temporal causality between house prices and output in the US: A bootstrap rolling-window approach. North Am. J. Econ. Financ. 2015, 33, 55–73. [Google Scholar] [CrossRef] [Green Version]

Publisher’s Note: MDPI stays neutral with regard to jurisdictional claims in published maps and institutional affiliations. |
© 2021 by the authors. Licensee MDPI, Basel, Switzerland. This article is an open access article distributed under the terms and conditions of the Creative Commons Attribution (CC BY) license (https://creativecommons.org/licenses/by/4.0/).