Article

The Dynamics of Financial Development, Government Quality, and Economic Growth in Different Groups of Economies

1
Department of Management Sciences, COMSATS University Islamabad, Wah Campus 47040, Pakistan
2
Department of Management Sciences, Riphah International University, Islamabad 44100, Pakistan
3
Saudi Central Bank (SAMA), Riyadh 11587, Saudi Arabia
*
Author to whom correspondence should be addressed.
Sustainability 2021, 13(14), 7573; https://doi.org/10.3390/su13147573
Submission received: 3 June 2021 / Revised: 21 June 2021 / Accepted: 30 June 2021 / Published: 7 July 2021
(This article belongs to the Section Economic and Business Aspects of Sustainability)

Abstract

:
This study examines the causal relationship between economic growth, financial development, and national governance. To analyze the three-way link of the stated variables, the Panel Vector Auto-Regressive (PVAR) model was applied to 115 economies between 1996 to 2018. The impact of each variable shock is explored through Impulse Response Function (IRF) and variance decomposition. The results indicate that the financial development and national governance shocks have a more persistent impact on economic growth in low-income economies than emerging and developed economies. In contrast, output shock influences long-term financial development in developed economies and affects national governance in a monotonic fashion in all three sets of economies. Moreover, national governance is explored as a critical factor for economic growth especially in low-income economies.

1. Introduction

Increasing income inequalities and limited access to economic resource around the world is nowadays a crucial global issue [1]. The top economies enjoy life standards of up to 58 times better than low-income nations, who hardly avail basic needs of life. For example, the World Bank data shows that the GDP per capita of high-income countries remained $43,559 against an aggregate world GDP of $10,858, while low-income nations only generated $740 per capita in 2018. A glimpse of these differences can be seen in Figure 1, which plots GDP per capita distribution (2010 constant) across the different income groups of the economy, i.e., high income, upper medium, lower medium, and low income from 1980 to 2018.
The most important and challenging factor is to understand how some countries are so rich while others remain so poor [2] and to consider which type of economies grow more rapidly. However, fundamental economic theories suggest that human capital, physical capital, and technology can significantly increase aggregate output [3,4]. However, if these factors can cause such a difference in income across countries (up to fifty-fold), why do various nations fail to invest more in human resources and physical capital or improve their technologies? It is fair to conclude that there must be some other underlying reasons which may prevent many economies from investing enough in these proximate causes, i.e., technology, workforce, and physical capital. For example, a country with weak law and order situations, extreme corruption, and political instability creates hurdles for the business community to contribute to economic growth [5,6,7]. While on the other side, a nation that provides opportunities and incentives for investment boosts business activities and ultimately enhances the economy [8]. Therefore, it is important to consider the fundamental causes along with proximate causes while examining income differences across nations—reasons such as the role of institutions, geography, culture, and other exogenous factors. However, of those four primary fundamental causes (luck, geography, institutions, and culture), only institutions can be potentially reformed for better results, making this factor more critical than others.
The institution was defined as the rules of the game for society by North [9]. It refers to regulations, laws, and policies that ensure the appropriate allocation of resources and support for businesses and individuals with less economic resources. Thus, it is essential to contextualize the quality of institutions/national governance while investigating income differences across nations. Moreover, recent financial reforms and technological improvements further enhance the importance of government quality in securing cross-border financial contracts. As such, various studies have been initiated to incorporate institutional quality into growth models, mainly categorized into three forms.
The first strand of the literature has mainly focused on the governance–growth nexus. For example, Ref. [10] constructed a governance index to analyze public capital effectiveness in economic growth. The constructed index’s governing factors were telephone faults, electricity losses, road conditions, and diesel locomotive availability. The study concluded infrastructure effectiveness is the most critical factor in explaining cross-country differences in economic growth. Similarly, the studies of [11,12,13] also evaluated that good governance ensures the allocation of public expenditure to a productive outcome, which in turn promotes economic growth. Unfortunately, developing nations mainly misallocate government spending, which causes them to be unproductive at the margin [2].
The second strand of the literature states that governance basically enhances financial development (FD) and that improved FD further contributes to economic growth. For instance, Refs. [5,14] introduced the investor protection phenomenon and concluded that financial effectiveness variation around the world could be traced to differences in their legal rules and enforcement quality. They evaluated that effective laws and their vigorous enforcement by the legal system encourage investors to finance businesses, which in turn leads to a better, more developed financial market. These developed financial markets in turn exhibit faster economic growth—see for example [15,16,17]. However, the failure of financial development in economic growth may be a reason for malpractice in the banking sector, political interruption, or loose governance, which deviate credit from productive allocation to unproductive activities [13].
The third strand of the literature suggests a mediating role of governance/institutional quality in financial development and economic growth [13,18,19]. These studies documented that the potential outcome FD is essentially linked to rules, law, and quality of financial regulation. It has been noted that only rare financial development measures support economic growth in the absence of institutional quality. However, its inclusion dramatically changes the results, and all measures of FD promote growth. Besides that, [20] documented that of many factors leading to the Asian crisis, one was the deprivation of institutional quality and governance. However, the study was mainly conducted for Malaysia and Indonesia, which cannot be generalized to the whole region considering the specific economic structure and institutional quality of these countries.
Meanwhile, the absence of a consensus after wide research shows that no single theory is fully supported by the entire economic committee. The factors that may affect the links between FD, economic growth, and governance have remained uncertain till now. What distinguishes this paper from previous studies is that instead of using the traditional model, Autoregressive-Distributed Lag (ARDL), this study used an advanced technique and applied the VAR model to analyze the three-way link between national governance, financial development, and economic growth. Second, most of the stated studies used the institution quality index for governance. In contrast, the current study selected a broader index for government quality that consists of six broad governance dimensions, as compiled by [21]. Third, different studies used distant proxies to measure financial development that are unable to represent the entire financial sector. However, this study used a more comprehensive and newly developed index of financial development established by [22], which covers all three dimensions of the financial sector, i.e., length, depth, and width.

2. Materials and Methods

The current study explores the link between financial development, government quality, and economic growth for developed, emerging, and low-income economies. The economies’ categorizations are based on the International Monetary Fund (IMF) classification, considering their income level, living standards, market maturity, and productivity level. Their dataset consists of 35 advanced, 40 emerging, and 40 low-income economies, all of which were selected for the study. Meanwhile, the time interval of the study is 1996–2018, mainly for two reasons. First, in order to measure the real performance of the selected economies, certain volatile periods should be excluded from the study. For example, hyperinflation caused by oil shocks in 1980–81 lead to abnormal performances for various economies. An identical scenario was faced by Russia and its former republics in 1990–91, years in which their economies shrunk badly. Second, to capture real national governance outcomes and uninfluential economic policies, individual economy data should only be considered from the day of their independence. As in the selected sample, 20 nations out of 115 obtained their independence between 1990 to 1995 (most of them were under the control of the USSR). Therefore, the study period is considered from 1996 onwards.
Some control variables are also considered for the study besides the main variables of interest, i.e., Foreign Direct Investment (FDI), inflation, trade openness, capital formation, and human capital. Foreign Direct Investment (FDI) contributes to GDP through increased investment, the transfer of technology, and skills [23]. Similarly, inflation was considered as per its vital link with financial activities and businesses’ profitability. Trade openness increases competition between domestic and international enterprises [24], and human development also leads to improved governance [25].

Model of the Study

The production function of macroeconomics is based on four major factors, which can be written mathematically as:
Y =   f ( K , L , P , H )
where Y is total output, K is capital, L is labor, P is land, and H represents entrepreneurs. As is apparent, all four factors are not used by every single business; therefore, [26] presented an alternate relation between total input and output:
Y =   A L α K β
The function reflects the relation between physical capital, labor, and the amount of output. Where α and β are the output elasticity of labor and capital. The additional A reflects the efficiency parameter known as the Total Factor Productivity (TFP). The production function (2) is a homogeneous function and its degree of homogeneity α + β can be summarized as:
A ( xL ) α ( xK ) β = x α + β AL α K β = x α + β Y
This shows how the C–D function becomes linearly homogeneous by a degree of one i.e., α + β = 1 . Additionally, it is suggested that the efficiency parameter can be enhanced through financial development and national governance along with the constant factor ϑ. Which implies that:
A = ϑ FD γ Gov δ
Now replacing the value of A in Equation (2), we have:
Y = ϑ FD γ Gov δ L α K β
Dividing Equation (5) by L, we obtain:
Y L = ϑ ( Gov L ) δ ( FD L ) γ ( L L ) α ( K L ) β
In simplifying Equation (6), we now have:
Y L = ϑ ( Gov L ) δ ( FD L ) γ ( K L ) β
Now Equation (7) is transformed into a log-linear function as:
log ( Y ) log ( L ) = log ( ϑ ) + γ log ( FD ) + δ log ( Gov ) + β log ( K ) log ( L ) γ + δ + β
As it is assumed that the production function has a constant return to scale, thus γ + δ + β = 1. Additionally, it is supposed that log ( ϑ ) = a, the equation in growth form is rewritten with the specifications of time and cross observations as:
log ( Y ) it = a + γ log ( FD ) it + δ log ( Gov ) it + β log ( K ) it +   ε it
where Y represents the real output of each economy, FD is financial development, Gov is governance, and K is for capital formation. To analyze the three-way link in economic growth, financial development, and government quality, the Panel Vector Auto-Regressive (PVAR) technique is applied to Equation (9). This technique has the advantage of involving delay lags of endogenous variables. Thus we have:
lgGDP it = a + p = 1 q η i lgGDP t i + p = 1 q γ j lgFD t j + p = 1 q δ k lgGov t k + p = 1 q β l lgK t l + p = 1 q μ m lgFDI t m + ε it  
The Foreign Direct Investment (FDI) is also added to the model above as literature emphasizes its importance, especially for developing economies—see for example [8,27,28]. Similarly, to explain financial development based on national governance and GDP per capita, two other control variables are added to the model:
lgFD it = a + p = 1 q γ j lgFD t j + p = 1 q η i lgGDP t i + p = 1 q δ k lgGov t k + p = 1 q λ n lgInf t n + p = 1 q φ r lgTR t r + ε it
Here Inf stands for inflation and TR is trade openness. Lastly, the governance is explained by GDPC, FD, and human capital as:
lgGov it = a + p = 1 q δ k lgGov t k + p = 1 q η i lgGDP t i + p = 1 q γ j lgFD t j + p = 1 q ψ s lgHC t s + ε it
The dependency of economic growth on FD, national governance, capital, and FDI is measured in Equation (10). While Equation (11) measures financial development reliance on GDPC, national governance, inflation, and trade. The last equation evaluates the influence of human capital, FD, and GDPC on national governance.

3. Results and Discussion

The panel data’s cross-sectional units were tested for cross-sectional dependency using [29,30] tests and were found to be independent across the units. Moreover, two-panel unit root tests were applied for a stationarity check, i.e., the Im-Pesaran-Shin (IPS) and Levin-Lin-Chu (LLC) as suggested by [31] in the case of independent cross-sectional data. Their results are summarized in Table 1 below. Moreover, the correct lag length is essential before applying the PVAR model. Considering many lags rather than true ones can lead to higher forecast errors and cause an auto-correlation error, while considering too short lags leads to omitted variable bias and an inability to capture system dynamics correctly. The lag-length selection criteria were measured with five different tests, i.e., the Akaike Information Criterion (AIC), Schwarz (SC), Hannan-Quinn (HQ), final prediction error (FPE), and the LR test, and the lags suggested by most of these tests were considered.
PVAR has the advantage of only allowing the analysis of contemporaneous effects among variables of the study. The basic specification does not allow for serial correlation in error, neither does it include fixed effects between the variables. Moreover, the impulse response function of PVAR is used to capture the fluctuation of economic growth, financial development, and national governance. The analysis uses the residuals from the regression of each selected variable.
Table 2 represents the descriptive statistics summary of each selected variable of the study.

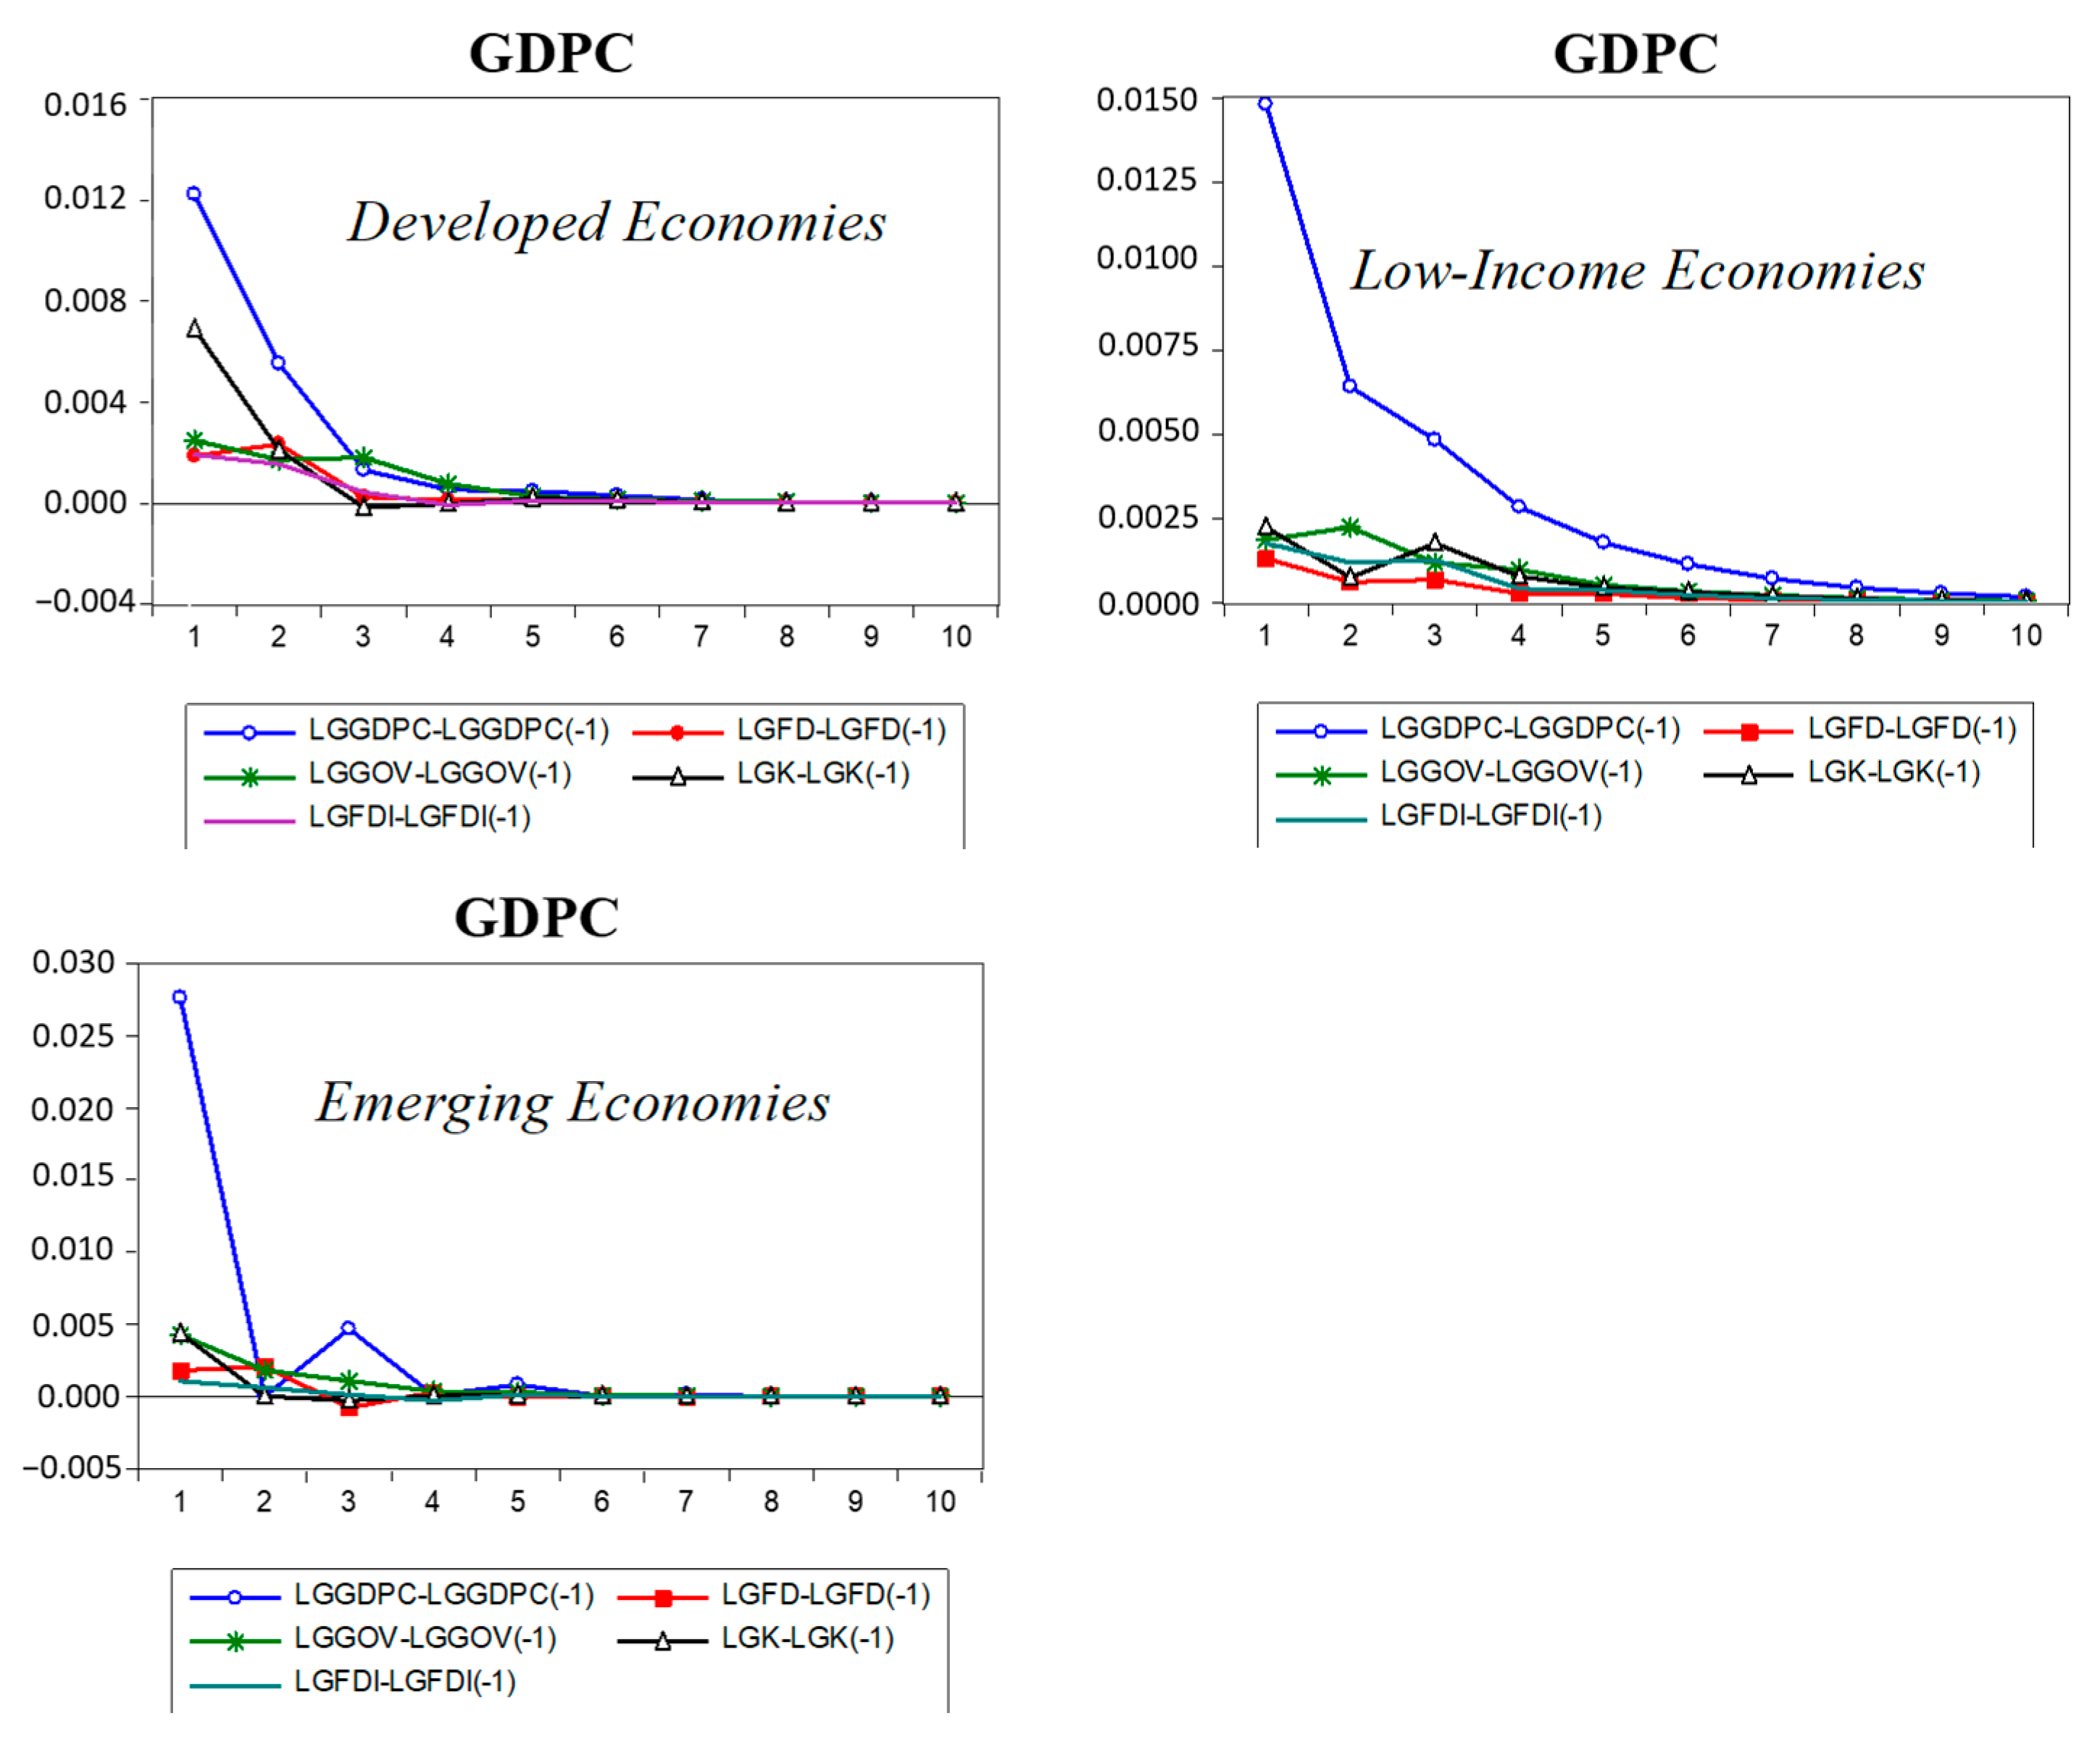
3.1. Impulse Response Function (IRF)

This section represents the analysis of the impulse response and variance decomposition functions of the model. Impulse response function (IRF) refers to the dynamic system that generates a response (output) based on various endogenous changes, called impulse or shocks.
Figure 2 visualizes the combined reaction of GDP per capita to all shocks in model 10 for all three groups. The GDPC had a much larger and more persistent response to GDPC innovation, especially in developed and low-income economies, and remains transitory in emerging economies. The markets of developed economies are more efficient and their investors quickly respond to the information. Positive signals of previous GDP encourage investors to participate in capital formation, which further contributes to current GDP [32]. While in the case of low-income economies, high investment risk restricts their access to maximize investment and other alternatives to improve current GDP. Meanwhile, in emerging economies, other factors such as FDI and debt financing also contribute to current GDP [33]. Simultaneously, FD’s positive shock increases the GDPC (through the enlarged flow of funds by the banking sector and financial market to the economy) for the next two years in developed and emerging economies. However, this has a more continual impact on low-income economies and affects their performance for the next five years. The prolonged impact of FD shocks in low-income economies as compared to others can be explained as the attached high investment risk condense flow of funds from the banking to the private sector. Only projects with high success rates and lower risk can qualify, which ultimately increases FD effectiveness and prolongs impact in low-income economies [34]. A similar positive effect of financial development on economic growth has been studied by [20,35,36], while [37] analyzed the transitory nature of the impact of FD in emerging economies. However, [38] suggests no causality relationship between FD and economic growth.
Similarly, national governance shocks also positively influence economic growth through improved governance, political stability, and corruption control. Good government quality remained more effective and had a prolonged impact on GDPC in low-income economies. As compared to other economies, most of the resources of low-income economies are inefficiently allocated or remain somewhat idle [39]. Meanwhile, good governance ensures the appropriate allocation of resource along with corruption control and political stability which further contribute to economy for longer period. Similarly, Ref. [12] also analyzed the positive impact of institutional quality on aggregate income, while [2,40] found governance to be critical factor for economic growth, especially in developing economies. The response of GDPC to FDI shock is positive but momentary, and steeper in both developed and emerging economies; however, it influences low-income economies for a more extended period. Such shocks dissimilarities are explained by [8,27,41], who state that FDI is more crucial for emerging and low-income economies as it brings technology and expert knowledge along with investment. Imported innovation and expert knowledge are gradually absorbed into the local economy and continuously improve its performance over longer period. Whereas capital formation shocks also influence GDPC positively through enhanced investment, leading to increased production and aggregate income. This appears to be more significant in low-income economies and continuously influences their economy in a monotonic pattern for five years.
The response of financial development to the regressors of model 11 is shown in Figure 3. The immediate reaction from financial development to FD innovation is higher and transitory for all three groups of economies, indicating that FD shock consists primarily of (unsystematic) measurement errors [42]. In contrast, a positive shock of GDPC increases the FD through the accelerator effect, which ultimately expands the banking sector and financial market activities. This affects developed economies for a longer time and stays transitory in emerging and low-income economies. In fact, developed economies have the advantage of asymmetrical information. Different organizations and industries quickly respond to positive GDP signals by financing their projects through the financial sector [43]. On the other hand, emerging and low-income economies face problems regarding asymmetrical information causing industries to take more time to respond to GDP signals. This bidirectional relationship between financial development and economic growth has also been explored by [16,20,35]. On the other hand, [44] explored the unidirectional effect of FD on economic growth.
Meanwhile, governance and trade shocks seem unimportant for FD almost in all three sets of economies. Although no direct impact is generated by these two factors, their contribution to FD can be occur through the channel of GDP. Contrary to these results, Ref. [45] suggest that trade openness is a crucial factor for financial development, while [46] concluded that the finance–trade nexus remains country-specific and affects different economies in different ways. Meanwhile, inflation negatively alters the FD in all clusters of economies. One possibly explanation for this is that high inflation discourages industrial investors to finance moderate and low-return projects [47]. Second, high inflation decreases individuals’ real income and squeezes their savings, which in turn shrinks the flow of funds from society to financial institutes [47]. Both aspects ultimately squeeze financial sector performance and its contribution to the economy. These findings align with the previous studies of [35,48].
The combined reaction of national governance to the explanatory variables of model 12 is presented in Figure 4. The immediate response of national governance to innovation is much higher, but temporary for all types of economies. A positive per capita output shock has a more persistent impact on governance and influences it in a monotonic fashion. This implies that with increased levels of income comes improvements in national governance performance, meaning that one of the root causes of ineffective governance and corruption can be low levels of income, especially in low-income economies [49]. However, increases in GDP lead to improved aggregate income which ultimately reduces corrupt practices and improves governance. However, Ref. [50] revealed that economic growth does not promote better governance practices, while good governance can endorse economic growth. Moreover, human capital amazingly impacts national governance positively in developed economies and negatively in low-income economies. This indicates that developed economies consistently update their education system and apply innovative techniques to improve its quality [51]. However, the education systems of low-income economies remain opposed to this strategy. Meanwhile, this has no significant role in the national governance of emerging economies. Besides this, financial development plays no significant role in national governance and seems to be a less important factor for governance in all three types of economies, confirming that there is no direct relation between financial development and governance.

3.2. Variance Decomposition

The variance decomposition explains each variable’s percentage change by the shocks of other variables of the model and itself. The Table 3 figures show cumulative variations in GDPC, FD, and national governance in response to each variable shock. When all three shocks hit, GDPC varies 98%, 99%, and 100% respectively in developed, emerging, and low-income economies. In the initial period, the GDPC shock has a large impact on economic growth, and other shocks produce minor influences.
Meanwhile, after five years, the variation in GDPC in developed economies is affected by financial development by 3.2%, and by national governance by 0.7%. While in emerging economies, governance was similarly important to FD and it caused a 1.08% variation in GDPC, whereas FD counted for 1.98%. After ten years, GDPC shock accounts for almost 95% of variation. The rest of the 5% variation is sustained by FD and national governance in both developed and emerging economies. However, in low-income economies, GDPC shocks still explains most of its variation, around 97.5%.
The variance decomposition of financial development shows that FD shock causes variation in FD in developed and emerging economies during the initial period. In both developed and emerging economies, a variation of almost 1% is explained by GDPC shock and a minor portion by national governance at the five-year stage. However, in low-income economies at the same phase, GDPC shock contributes significantly to FD variation, by almost 3.4%. Whereas, in ten years, a bit change can be seen in developed economies’ figures. In emerging economies, GDPC and governance shocks account for 1.22 and 1.38% of variation; in low-income economies these factors account for 5.38 and 1.05% variation.
The decomposition of national governance variance is influenced even in the first period by the other two shocks in all sets of economies. The shock of GDPC represents 3.26, 2.70, and 1.34% changes in developed, emerging, and low-income economies, respectively. However, after five years, GDPC shock caused a 5.73% deviation in national governance in developed economies, 3.05% in emerging, and 2.94% in low-income economies. In contrast, FD shock has a small contribution to governance. These figures slightly changed over the next five years.

4. Conclusions

Fundamental economic theories have focused on various proximate causes for economic growth, such as labor, capital, and technology, while recent literature also highlights the importance of financial development for better aggregate output. However, various nations are still unable to take advantage of these proximate causes, and they face fundamental barriers such as extreme corruption, political instability, weak law and order situations, ineffective financial systems, and unstable markets. Therefore, to analyze the impact of both proximate and fundamental causes, this study analyzed the three-way link of economic growth, national governance, and financial development for 115 economies around the world. These economies are mainly divided into three groups, i.e., developed, emerging, and low-income economies. The Panel VAR model was applied to data from 1996 to 2018 and the results of the impulse response function and variance decomposition are summarized.
The outcomes indicate that a positive FD shock increases economic growth through the flow of funds mainly from the banking sector and financial market of the economy and remains more significant for low-income economies than others. In fact, high investment risk in low-income economies condenses the flow of funds from the banking to private sector as projects with high success rates and lower risk only qualify for it. This strong filtering process ultimately increase FD effectiveness and prolongs impact in these economies. Similarly, national governance remained a more effective tool for economic growth, especially in low-income economies through improved governance, political stability, and corruption control. In fact, resources in these economies are inefficiently allocated or remain idle, while good governance can ensure appropriate allocation which ultimately boosts the economy. However, governance has a lesser role in promoting financial development. While on the other hand, economic growth increases financial development through the accelerator effect, ultimately expanding the banking sector and financial market activities. This relationship is more significant in developed economies having the advantage of asymmetrical information and their informed investors can quickly respond to GDP signals. This relationship remains transitory in other groups of economies as they do not have this advantage of asymmetrical information. Likewise, growth shocks also influence national governance in a monotonic pattern in low-income economies. This indicates that one of the root causes of ineffective governance in low-income economies can be poverty.
Therefore, based on the above results, it is suggested that low-income economies should mainly focus on national governance along with other factors for better economic growth. Similarly, emerging and low-income economies should provide regulatory relaxation to the financial sector and need to safeguard stakeholders’ interests for economic prosperity. Developed economies follow the view of “where enterprise leads, finance follows” as per their efficient markets and informed nature of investors. Therefore, they should focus on growth determinants for improved performance of their financial sectors.

Author Contributions

The concept and design of this article came from A.Q.K. Subsequent data collection, the empirical study review of conceptual development, and the drafting was done by S.I. Finally, the critical review and import intellectual content assessment was done by M.Y.K., L.A.-A. critically reviewed the entire writeup and editing ready for publication. All authors have read and agreed to the published version of the manuscript.

Funding

We did not receive any financial assistance from any agency. All of the costs associated with preparing this article were provided solely by authors.

Institutional Review Board Statement

Not applicable.

Informed Consent Statement

Not applicable.

Data Availability Statement

All the data used are available on World Bank database (https://tcdata360.worldbank.org/topics# (accessed on 21 May 2021)) and IMF data set (https://data.world/imf/financial-development-fd (accessed on 21 May 2021)).

Acknowledgments

The authors wish to thank Sharif Ullah Jan for his extra ordinary contribution and guidance that improve the quality of our research.

Conflicts of Interest

The authors declare no conflict of interest.

References

  1. Balcilar, M.; Gupta, R.; Ma, W.; Makena, P. Income inequality and economic growth: A reexamination of theory and evidence. Rev. Dev. Econ. 2021. [Google Scholar] [CrossRef]
  2. Cooray, A. Government Expenditure, Governance and Economic Growth. Comp. Econ. Stud. 2009, 51, 401–418. [Google Scholar] [CrossRef]
  3. Solow, R.M. A Contribution to the Theory of Economic Growth. Q. J. Econ. 1956, 70, 65–94. [Google Scholar] [CrossRef]
  4. Swan, T.W. Economic growth and capital accumulation. Econ. Rec. 1956, 32, 334–361. [Google Scholar] [CrossRef]
  5. La Porta, R.; Lopez-de-Silanes, F.; Shleifer, A.; Vishny, R.W. Legal Determinants of External Finance. J. Financ. 1997, 52, 1131–1150. [Google Scholar] [CrossRef]
  6. Shen, C.-H.; Lee, C.-C. Same Financial Development yet Different Economic Growth: Why? J. Money Credit Bank 2006, 38, 1907–1944. [Google Scholar] [CrossRef]
  7. Acemoglu, D. Introduction to economic growth. J. Econ. Theory 2012, 147, 545–550. [Google Scholar] [CrossRef]
  8. Hayat, A. Foreign direct investments, institutional quality, and economic growth. J. Int. Trade Econ. Dev. 2019, 28, 561–579. [Google Scholar] [CrossRef]
  9. North, D.C. Institutions, Institutional Change and Economic Performance; Cambridge University Press: Cambridge, UK, 1990. [Google Scholar]
  10. Hulten, C.R. Infrastructure Capital and Economic Growth: How Well You Use It May Be More Important than How Much You Have. NBER Working Paper 5847. December 1996. Available online: https://www.nber.org/papers/w5847 (accessed on 15 June 2021).
  11. Jung, J. Institutional Quality, FDI, and Productivity: A Theoretical Analysis. Sustainability 2020, 12, 7057. [Google Scholar] [CrossRef]
  12. Kunieda, T.; Takahashi, M. Inequality and institutional quality in a growth model. Evol. Inst. Econ. Rev. 2021. [Google Scholar] [CrossRef]
  13. Kutan, A.M.; Samargandi, N.; Sohag, K. Does Institutional Quality Matter for Financial Development and Growth? Further Evidence from MENA Countries. Aust. Econ. Pap. 2017, 56, 228–248. [Google Scholar] [CrossRef]
  14. Porta, R.L.; Lopez-de-Silanes, F.; Shleifer, A.; Vishny, R.W. Law and finance. J. Political Econ. 1998, 106, 1113–1155. [Google Scholar] [CrossRef]
  15. Lee, B.-S. Bank-based and market-based financial systems: Time-series evidence. Pac. Basin Financ. J. 2012, 20, 173–197. [Google Scholar] [CrossRef]
  16. Chow, W.W.; Fung, M.K.; Leung, M.-K. Finance–growth nexus in China from an endogenous switching perspective. J. Int. Trade Econ. Dev. 2018, 27, 443–462. [Google Scholar] [CrossRef]
  17. Yang, F. The impact of financial development on economic growth in middle-income countries. J. Int. Financ. Mark. Inst. Money 2019, 59, 74–89. [Google Scholar] [CrossRef]
  18. Klomp, J.; de Haan, J. Bank Regulation, the Quality of Institutions, and Banking Risk in Emerging and Developing Countries: An Empirical Analysis. Emerg. Mark. Financ. Trade 2014, 50, 19–40. [Google Scholar] [CrossRef]
  19. Bonnal, M.; Yaya, M.E. Political Institutions, Trade Openness, and Economic Growth: New Evidence. Emerg. Mark. Financ. Trade 2015, 51, 1276–1291. [Google Scholar] [CrossRef]
  20. Sohag, K.; Shams, S.M.R.; Omar, N.; Chandrarin, G. Comparative study on finance-growth nexus in Malaysia and Indonesia: Role of institutional quality. Strateg. Chang. 2019, 28, 387–398. [Google Scholar] [CrossRef]
  21. Kraay, A.; Kaufmann, D.; Mastruzzi, M. The Worldwide Governance Indicators: Methodology and Analytical Issues. World Bank Policy Reseach Working Paper 5430. September 2010. Available online: https://openknowledge.worldbank.org/handle/10986/3913 (accessed on 20 June 2021).
  22. Katsiaryna, S. Introducing a New Broad-Based Index of Financial Development1; International Monetary Fund: Washington, DC, USA, 2016. [Google Scholar] [CrossRef] [Green Version]
  23. Carr, D.L.; Markusen, J.R.; Maskus, K.E. Estimating the Knowledge-Capital Model of the Multinational Enterprise. Am. Econ. Rev. 2001, 91, 693–708. [Google Scholar] [CrossRef] [Green Version]
  24. Kim, D.-H.; Lin, S.-C.; Suen, Y.-B. Dynamic effects of trade openness on financial development. Econ. Model. 2010, 27, 254–261. [Google Scholar] [CrossRef]
  25. Safkaur, O.; Sagrim, Y. Impact of Human Resources Development on Organizational Financial Performance and Its Impact on Good Government Governance. Int. J. Econ. Financ. Issues 2019, 9, 29. [Google Scholar] [CrossRef] [Green Version]
  26. Cobb, C.W.; Douglas, P.H. A Theory of Production. Am. Econ. Rev. 1928, 18, 139–165. [Google Scholar]
  27. Ibrahim, M.; Acquah, A.M. Re-examining the causal relationships among FDI, economic growth and financial sector development in Africa. Int. Rev. Appl. Econ. 2021, 35, 45–63. [Google Scholar] [CrossRef]
  28. Elgin, C. Foreign direct investment, informality and technology transfer. Rev. Dev. Econ. 2020. [Google Scholar] [CrossRef]
  29. Pesaran, M.H. General diagnostic tests for cross-sectional dependence in panels. Empir. Econ. 2004, 60, 1–38. [Google Scholar]
  30. Breusch, T.S.; Pagan, A.R. The Lagrange Multiplier Test and its Applications to Model Specification in Econometrics. Rev. Econ. Stud. 1980, 47, 239–253. [Google Scholar] [CrossRef]
  31. Breitung, J.; Pesaran, M.H. Unit roots and cointegration in panels. In The Econometrics of Panel Data; Springer: Berlin/Heidelberg, Germany, 2008; pp. 279–322. [Google Scholar]
  32. Di Maio, F.; Rem, P.C.; Baldé, K.; Polder, M. Measuring resource efficiency and circular economy: A market value approach. Resour. Conserv. Recycl. 2017, 122, 163–171. [Google Scholar] [CrossRef]
  33. Economou, F.; Hassapis, C.; Philippas, N.; Tsionas, M. Foreign Direct Investment Determinants in OECD and Developing Countries. Rev. Dev. Econ. 2017, 21, 527–542. [Google Scholar] [CrossRef]
  34. Bist, J.P. Financial development and economic growth: Evidence from a panel of 16 African and non-African low-income countries. Cogent Econ. Financ. 2018, 6, 1449780. [Google Scholar] [CrossRef] [Green Version]
  35. Mtar, K.; Belazreg, W. Causal Nexus Between Innovation, Financial Development, and Economic Growth: The Case of OECD Countries. J. Knowl. Econ. 2020. [Google Scholar] [CrossRef]
  36. Abu-Bader, S.; Abu-Qarn, A.S. Financial Development and Economic Growth: Empirical Evidence from Six MENA Countries. Rev. Dev. Econ. 2008, 12, 803–817. [Google Scholar] [CrossRef]
  37. Samargandi, N.; Fidrmuc, J.; Ghosh, S. Is the Relationship Between Financial Development and Economic Growth Monotonic? Evidence from a Sample of Middle-Income Countries. World Dev. 2015, 68, 66–81. [Google Scholar] [CrossRef] [Green Version]
  38. Mushtaq, S. Causality between bank’s major activities and economic growth: Evidences from Pakistan. Financ. Innov. 2016, 2, 7. [Google Scholar] [CrossRef] [Green Version]
  39. Jindra, C.; Vaz, A. Good governance and multidimensional poverty: A comparative analysis of 71 countries. Governance 2019, 32, 657–675. [Google Scholar] [CrossRef] [Green Version]
  40. Su, T.D.; Bui, T.M.H. Government size, public governance and private investment: The case of Vietnamese provinces. Econ. Syst. 2017, 41, 651–666. [Google Scholar] [CrossRef]
  41. Chortareas, G.; Magkonis, G.; Moschos, D.; Panagiotidis, T. Financial Development and Economic Activity in Advanced and Developing Open Economies: Evidence from Panel Cointegration. Rev. Dev. Econ. 2015, 19, 163–177. [Google Scholar] [CrossRef] [Green Version]
  42. Asif, M.; Jan, S.U.; Iqbal, S. Oil prices movements and industry stock returns: Evidence from pakistan stock exchange (PSX). Gomal Univ. J. Res. 2021, 37, 84–96. [Google Scholar] [CrossRef]
  43. Ripamonti, A. Financial institutions, asymmetric information and capital structure adjustments. Q. Rev. Econ. Financ. 2020, 77, 75–83. [Google Scholar] [CrossRef]
  44. Olayungbo, D.O.; Quadri, A. Remittances, financial development and economic growth in sub-Saharan African countries: Evidence from a PMG-ARDL approach. Financ. Innov. 2019, 5, 9. [Google Scholar] [CrossRef] [Green Version]
  45. Zhang, C.; Zhu, Y.; Lu, Z. Trade openness, financial openness, and financial development in China. J. Int. Money Financ. 2015, 59, 287–309. [Google Scholar] [CrossRef]
  46. Wajda-Lichy, M.; Kawa, P.; Fijorek, K.; Denkowska, S. Trade Openness and Financial Development in the New EU Member States: Evidence from a Granger Panel Bootstrap Causality Test. East. Eur. Econ. 2020, 58, 242–263. [Google Scholar] [CrossRef]
  47. McConnell, C.R.; Brue, S.L.; Flynn, S.M. Economics: Principles, Problems, and Policies; McGraw-Hill/Irwin: New York, NY, USA, 2005. [Google Scholar]
  48. Swamy, V.; Dharani, M. The dynamics of finance-growth nexus in advanced economies. Int. Rev. Econ. Financ. 2019, 64, 122–146. [Google Scholar] [CrossRef]
  49. Ünver, M.; Koyuncu, J.Y. The impact of poverty on corruption. J. Econ. Libr. 2016, 3, 632–642. [Google Scholar]
  50. Kaufmann, D.; Kraay, A. Governance and growth: Causality which way? Evidence for the world, in brief. World Bank Febr. 2003. [Google Scholar] [CrossRef] [Green Version]
  51. Squicciarini, M.P. Devotion and development: Religiosity, education, and economic progress in nineteenth-century France. Am. Econ. Rev. 2020, 110, 3454–3491. [Google Scholar] [CrossRef]
Figure 1. The graph demonstrates the income difference of different economic groups in comparison to aggregate world income. HIC = high-income counties; LMC = lower-medium countries; UMC = upper-medium countries; LIC = low-income countries; WLD = world aggregate income.
Sustainability 13 07573 g001
Figure 2. The response of the GDPC to all shocks in model 10 for all three groups of economies. Note: The figure shows the response of the variables to a generalized one-standard-deviation of innovation.
Sustainability 13 07573 g002
Figure 3. The response of financial development to all shocks in model 11 for all three groups of economies. Note: The figure shows the response of the variables to a generalized one-standard-deviation of innovation.
Sustainability 13 07573 g003
Figure 4. The response of governance to all shocks in model 12 for all three groups of economies. Note: The figure shows the response of the variables to a generalized one-standard-deviation of innovation.
Sustainability 13 07573 g004
Table 1. Panel unit root test.
VariablesLLC Test IPS Test
Level Level
t Statisticsp Value t Statisticsp Value
Developed Economies
FD−5.792310.0000 −6.200310.0000
FDI−5.729330.0000 −7.521090.0000
GDPC−5.502300.0000 0.068000.5271
GOV−1.973100.0242 −0.52880.2985
HC−3.394260.0003 −1.807760.0353
INF−8.175420.0000 −7.278090.0000
INVST−5.032180.0000 −5.042140.0000
TR−3.119120.0009 0.266180.6050
Emerging Economies
FD−2.543410.0055 0.316280.6241
FDI−3.199790.0007 −4.734060.0000
GDPC−1.278480.1005 5.028331.0000
GOV−1.075940.1410 0.306640.6204
HC−2.005790.0224 2.429360.9924
INF−6.291760.0000 −6.873700.0000
INVST−4.320140.0000 −4.928300.0000
TR−3.102090.0010 −1.678720.0466
Low-Income Economies
FD0.406210.6577 1.357850.9127
FDI−2.226350.0130 −3.366060.0004
GDPC−0.286570.3872 7.314101.0000
GOV−1.919960.0274 −0.925060.1775
HC−6.277560.0000 −1.816860.0346
INF−8.722340.0000 −8.789230.0000
INVST−1.626380.0519 −1.583670.0566
TR−2.479350.0066 −0.143550.4429
Table 2. Descriptive statistics.
VariablesMeanStd. DevMinimumMaximumObservation
Developed Economies
FD0.6439640.1936440.1117551.00000805
FDI8.44980827.95833−58.32288451.7155805
GDPC38651.6519957.235329.849111968.3805
GOV1.2754070.4195740.1562031.969566805
HC1749.8887653.87279.9021649440.97805
INF2.2507792.237838−4.47810317.61047805
Capital (K)23.450734.41058710.2170141.44911805
TR114.055985.2871918.34896442.6200805
Emerging Economies
FD0.3367830.1472560.0256060.753043920
FDI3.1603935.426509−46.7692255.07590920
GDPC10457.8012811.78711.928869679.09920
GOV−0.2382830.601833−1.9044641.287036920
HC84.3734020.084019.058750123.2299920
INF7.7393188.050081−9.79764739.66936920
Capital (K)25.074727.3058119.48100257.99043920
TR72.8957035.7660015.63559220.4074920
Low-income Economies
FD0.1304910.0639300.0000000.470773920
FDI3.8277985.650260−37.1547650.63641920
GDPC1072.161647.7313187.51674210.042920
GOV−0.7729900.450865−2.1003170.251952920
HC45.6026623.165744.979884107.2295920
INF8.9177058.594494−8.97474051.48755920
Capital (K)24.145118.1499361.52517760.15617920
TR71.2761435.017880.167418200.3846920
Table 3. Variance decomposition.
Variance Decomposition of GDPC
Developed EconomiesEmerging EconomiesLow-Income Economies
PeriodS.E.GDPCFDGOVS.E.GDPCFDGOVS.E.GDPCFDGOV
10.01298.1111.8880.0000.02699.0970.9020.0000.014100.000.0000.000
20.02096.7193.2090.0700.03798.0221.5980.3790.02699.7890.0100.199
30.02696.2803.5380.1810.04597.5211.8090.6680.03699.5440.0630.391
40.03196.1403.5360.3230.05197.1831.9200.8950.04499.3100.1610.528
50.03696.1013.4020.4960.05796.9251.9851.0880.05299.0730.3060.620
60.03996.0843.2130.7010.06296.7062.0261.2660.05898.8180.4980.683
70.04396.0563.0050.9380.06796.5082.0541.4370.06498.5380.7340.727
80.04696.0002.7931.2060.07196.3202.0721.6060.07098.2271.0130.758
90.04995.9062.5881.5050.07596.1392.0851.7740.07597.8831.3330.782
100.05195.7702.3951.8330.07895.9612.0941.9430.07997.5071.6900.801
Variance Decomposition of Financial Development
10.0080.000100.000.0000.0080.000100.000.0000.0051.17098.8290.000
20.0110.35399.6340.0110.0110.61499.1740.2100.0071.85397.8530.293
30.0130.64299.3310.0250.0130.79098.7940.4140.0082.42997.1170.452
40.0150.84399.1160.0400.0150.90198.5190.5780.0092.94596.4710.583
50.0170.98198.9590.0590.0170.97998.2970.7220.0103.40895.9040.687
60.0191.08298.8370.0800.0181.04198.1010.8570.0113.83695.3870.776
70.0201.15898.7380.1030.0201.09397.9180.9880.0124.24194.9030.855
80.0211.21898.6510.1300.0211.13997.7401.1200.0124.63094.4420.927
90.0221.26798.5730.1590.0221.18197.5651.2520.0135.00893.9950.995
100.0231.30998.4990.1910.0231.22197.3901.3870.0145.38093.5601.059
Variance Decomposition of Governance
10.0103.2670.10696.6250.0212.7010.54596.7530.0181.3460.03098.622
20.0154.4690.23695.2940.0322.8140.74596.4390.0291.9510.09897.950
30.0195.1510.27394.5740.0412.9140.80696.2790.0372.3980.13497.467
40.0225.5280.26994.2010.0482.9900.82696.1820.0432.7160.17197.112
50.0245.7330.24994.0160.0543.0560.83096.1120.0482.9400.21096.849
60.0275.8390.22393.9360.0603.1180.82796.0540.0533.0990.25296.647
70.0295.8850.19793.9160.0643.1760.81996.0030.0573.2140.29996.486
80.0315.8940.17493.9310.0693.2330.81095.9560.0603.2990.34996.351
90.0335.8780.15593.9660.0733.2880.79895.9120.0633.3630.40296.234
100.0355.8450.14194.0130.0763.3430.78795.8690.0663.4120.45996.127
Publisher’s Note: MDPI stays neutral with regard to jurisdictional claims in published maps and institutional affiliations.

