Article

Modelling the Carbon Footprint of Various Fruit and Vegetable Products Based on a Company’s Internal Transport Data

Institute of Machines and Motor Vehicles (IMRiPS), Poznan University of Technology, 60965 Poznań, Poland
*
Author to whom correspondence should be addressed.
Sustainability 2021, 13(14), 7579; https://doi.org/10.3390/su13147579
Submission received: 17 May 2021 / Revised: 25 June 2021 / Accepted: 4 July 2021 / Published: 7 July 2021

Abstract

:
Many organisations consider environmentally friendly activities, including the reduction of their carbon footprint, to be a significant aspect of their operation. In this study, a mathematical model was used to calculate the carbon footprint of food products at different stages of internal transport, using data on internal transport energy consumption. It was shown that for most products, the highest carbon footprint was related to the raw material transport stage from the loading/unloading point to the workstations on the production line. Broccoli showed the highest carbon footprint for internal transport per tonne of raw material. The study proposes methods of reducing the internal transport-related carbon footprint, which involves reorganising the distribution of goods in the warehouse and using nutritionally valuable vegetable waste in the production of food products.

1. Introduction

In September 2015, the world’s leaders adopted the UN (United Nations) programme “Transforming our world: the 2030 Agenda for Sustainable Development” and established a set of core sustainable development goals. One goal is to take urgent action to address climate change and its consequences [1]. There is no doubt that the increasing greenhouse gas emissions trigger climate changes that are experienced globally. The effects include altered weather patterns, rising sea levels due to melting glaciers, extreme weather conditions, changes in precipitation patterns and threats to flora and fauna. Carbon dioxide is one of the greenhouse gases that is currently recognised as a major factor contributing to the increasingly severe problem of climate change [2,3]. Carbon dioxide emissions are associated with the concept of carbon footprint, which first appeared in the literature in the 1960s [4]. Since then, many definitions of the term have emerged. In LCA (life cycle assessment), the environmental impact due to greenhouse gas (GHG) emissions is assessed in the impact category named as global warming or climate change (depending on the LCA method). In environmental analyses focused only on this particular im-pact category, the final results are often (in simplification) referred to as “carbon foot-print” (CF). However, the carbon footprint indicator is not limited to the emitted mass of carbon dioxide. It also takes into account various other gaseous chemicals that can induce the greenhouse effect. Therefore, the carbon footprint is often defined as the sum of all emissions (and capture) of carbon dioxide and other GHGs for the particular life cycle of a given product, quantitatively expressed in CO2 equivalent [5,6]. The carbon footprint is, therefore, an important tool based on LCA, which takes into account, among others, the category of global warming impact (or climate change, depending on the LCA method) [7].
Virtually every branch of industry, including the food industry, leaves a carbon footprint. The food industry produces carbon dioxide as the dominant greenhouse gas, which accounts for about 71% of all greenhouse gases [8]. Carbon dioxide emissions from the food industry include both direct and indirect emissions. Transport is, therefore, one of the critical links among many determinants of carbon footprint in the food sector. However, it should be stressed that apart from external transport, which is most often associated with high CO2 emissions, internal (intra-factory) transport also plays a vital role in the food industry and should not be ignored. Internal plant transport is responsible for conveying the goods within the plant area. Internal transport-related carbon footprint is most often determined based on the FLT (forklift truck) emission. These forklift trucks are used to deliver raw materials to production sites, transport the finished products to the warehouse, and remove post-production waste. The most commonly used approaches for estimating the carbon footprint are based on the amount of fuel consumed and the respective emission factors for the type of fuel used [9]. The emissions for each type of fuel are often quoted in kgCO2/TJ, which for the sake of computations are expressed in kgCO2/kWh. Similar assumptions for estimating the carbon footprint apply to Non-Road Mobile Machinery (NRMM) and are used in different European countries. In the Netherlands, for the sake of simplicity, the emissions per unit of load carried (e.g., per pallet or container) are taken into account [10]. In Spain, for example, national databases containing ecological factors are used for the different types of forklift truck drives [6]. More complex models attempt to explain the components of the total carbon footprint resulting from various operating statuses of the forklift trucks, such as the proportion of time spent working with and without a load, the FLT speed distribution, the frequency of acceleration, etc. [11,12]. However, these models require the installation and monitoring of specific operating parameters for each forklift truck model, and may be different for different types of goods and sizes of warehouses served. In turn, such detailed analyses provide the basis for determining the indicators necessary for the overall calculations in the solutions evaluated. It is worth noting that the carbon footprint of internal transport should be considered in decision-making processes as a component of the total operating cost of logistics facilities [13].
Literature sources allow specific ranges of carbon footprint to be defined depending on the forklift drives used, but some dispute remains when defining these ranges [14]. The wide range of emission factors present in the databases may be due to, among other things, the non-uniform behaviour of drivers, the use of navigation, data communication and route optimisation systems, the organisational diversity of warehouses depending on the goods stored and the size of the storage facilities [15,16]. Furthermore, due to the simple implementation of fuel-consumption-based models and the basic geometrical parameters of warehouses, the application of models using FLT-dependent emission factors is widespread in carbon footprint estimation in actual storage facilities [17].
This paper presents a methodology for calculating the carbon footprint of the internal transport of food products (used by the company Unifreeze, located in Miesiączkowo, Poland), using data on internal transport-related energy consumption. For this purpose, actual data were used, including the overall dimensions of the storage areas in which the internal transport takes place, the amount and type of raw material processed in the company and the type of internal transport means. The data obtained made it possible to estimate the component of the carbon footprint associated with internal transport for individual commodities. An analysis of the carbon footprint associated with internal transport for individual food products was carried out, the contribution of each internal transport stage to the total carbon footprint was determined, and a summary of these parameters was made in relation to the weight of the raw material. Key stages and products with the largest internal transport carbon footprint were identified. Based on this, solutions were proposed to reduce the carbon footprint for these stages and products, as well as to reduce the carbon footprint for waste products.

2. Materials and Methods

2.1. Methodology for Calculating the Carbon Footprint of Internal Transport Equipment

The study used a model for calculating internal transport’s carbon footprint based on the energy consumption of the transport equipment used during its operation [17]. The model considers two main forklift truck classes used for material handling: internal combustion engine forklifts and electric forklifts. It is assumed that the carbon footprint of the material handling processes depends on the energy consumption of the forklift and its working time in each operating state. The material handling process is considered in three primary operating states: i. the unloaded forklift leaves the loading/unloading area of the warehouse and reaches the storage area (unloaded state); ii. the forklift stops in the storage area and picks up the unit loads (lifting state); iii. the loaded forklift leaves the storage area and reaches the loading/unloading area of the warehouse (transfer state) [18].
Assuming that the emissions are generated during the above work states, the carbon footprint (CF) is calculated based on Equation (1):
CF = EHR t
where:
EHR–the hourly CO2 emission factor [kgCO2/h],
t–total cycle time [h]
The hourly CO2 emission factor (EHR) was calculated using Equation (2) for forklift trucks equipped with an internal combustion engine and (3) for forklift trucks with an electric motor:
EHR FUEL = FEF FCHR
EHR EL = 1 η EEF ECHR
where:
FEF–fuel emission factor [kgCO2/kWh];
FCHR–average fuel consumption per hour [kWh/h];
EEF–electrical energy emission factor [kgCO2/kWh];
ECHR–average electrical energy consumption per hour [kWh/h];
η–the overall efficiency of the electricity transfer process from the production source to the storage of energy in the batteries; it adopts a value of 0.85, taking into account an assumption of 90% energy efficiency for battery charging and about 95% for all other auxiliary equipment [17].
The total time (t) considered in the model is defined as the average cycle time (tC) multiplied by the number of cycles (N). The average cycle time (tC) consists of the travel time of the forklift in both directions (in the unloaded and transfer states) and the lifting time (in the lifting state). The number of cycles (N) represents the number of repetitive work states required to complete the material transport process. Assuming that all the objects in the warehouse are identical (the same weight W and dimensions) and that the loads are stackable, the batch size (BS) of the forklift is defined as the maximum number of load units that the forklift can transport (the maximum utilisation of the forklift capacity). The BS is calculated as an integer rounded down from the ratio between the rated load capacity (LC) of the forklift and the weight (W) of the load unit. Consequently, the number of cycles (N) is calculated as an integer rounded up from the ratio between the storage capacity (Q) and the batch size (BS). The total time (t) is then expressed by Equation (4).
t = 2 ( d s t + h s l ) ( Q BS )
where:
d–the average cycle distance [m], including the distance travelled from the storage area to the warehouse loading/unloading area by a loaded FLT and the distance travelled by an unloaded FLT to pick up objects.;
st–average transport speed [m/h];
h–average lifting height [m];
sl–average lifting speed [m/h];
BS–size of the batch [load unit].

2.2. Calculating the Carbon Footprint of Internal Transport Based on Actual Data

The production company has four storage areas whose overall dimensions and characteristic data are shown in Table 1.
In order to estimate the total carbon footprint of internal transport in a manufacturing company, three steps have been specified:
  • transporting raw materials from the loading/unloading point to work stations on the production line,
  • internal transport of finished product
  • internal transport of post-production waste.
The weight of the raw materials delivered to the production company was approximately 20 tonnes regarding all the products analysed. The internal transport of the raw materials delivered to the production company and the stage of internal transport of post-production waste is carried out by electric (Linde E14, Linde E16) and diesel (Linde H14T) means of transport, while the stage of internal transport of finished products is carried out exclusively by electric FLTs (Linde R14HD). The characteristic data for the internal means of transport used are shown in Table 2 and Table 3.

2.2.1. Internal Transport from the Point of Loading to Work Stations

The first stage/form of internal transport is the transport of raw materials from the loading/unloading point to the workstations on the production line. Table 4 shows the actual data for this stage. Each of the products was transported with forklifts: E14, E16, H14T. This stage is indicated by the subscript “s”.
(Qs) pallets of various raw harvested materials reached the production company. The number of cycles (Ns) is calculated as an integer rounded up from the ratio between the quantity of raw materials that entered the production company (Qs) and the batch size (BSs)—the number of pallets transported by the means of transport in one operation. Under these assumptions, the total time (t) is expressed by Equation (4). Regarding the stage of transporting the raw materials from the loading/unloading point to the workstations on the production line, the total operation time (ts) is calculated from Equation (5):
t s = 2 ( d s s t + h s s l ) ( Q s BS s )
where:
ds–average distance covered in the cycle [m];
st–average speed of transporting [m/h];
hs–average height of lifting [m];
sl–average lifting speed [m/h];
Qs–amount of raw materials delivered to the production plant [load unit].
BSs–size of the FLT batch [load unit].
The operations for transporting the raw materials from the loading/unloading point to the workstations on the production line are carried out by both electrically and diesel-powered means of transport. Taking into account data from the company according to which electric FLTs cover 80% of the working time and combustion FLTs cover 20% of the working time, it is possible to estimate the time for the said operations for both means of transport from actual data. In addition, a factor was added in the following formulae to reflect the average actual lifting and moving speeds. According to the company’s data, the estimated time would be 30% higher than when using the maximum speeds (hence the factor of 1.3).
The final equations for the completion time of one transport cycle are given below:
  • for transport with electric FLTs
    t se = 1.3 2 ( d s s t + h s s l ) ( 0.8 Q s BS s )
  • for transport with internal combustion engine FLTs
    t ss = 1.3 2 ( d s s t + h s s l ) ( 0.2 Q s BS s )

2.2.2. Internal Transport of Finished Products

The second stage is the internal transport of finished products from the workstations to the racking storage area. Table 5 shows the actual data from this stage. Each of the products was transported with forklifts: R14HD. This stage is indicated by the subscript “p”.
The second stage of internal transport, i.e., the transport of the finished product, was carried out by only one type of electric FLTs (Linde R14HD). For each product in this stage, the FLT always transported one pallet unit in one operation (for each case, BSp is 1), i.e., the number of cycles Np is equal to the number of pallets of the finished product Qp.
For this stage of transport, the total time (tp) is calculated from Equation (8). As in the previous stage, according to the company’s data, the estimated time would be 30% higher than when the maximum speeds were used (hence the coefficient 1.3).
t p = 1.3 2 ( d p s t + h p s l ) N p
where:
dp–average distance covered in the cycle [m],
st–average transporting speed [m/h],
hp–average height of lifting [m],
sl–average speed of lifting [m/h],
Np-number of transport cycles [pcs.].

2.2.3. Internal Transport of Post-Production Waste

The third stage is the internal transport of post-production waste from the workstations to the waste storage area. Post-production waste contains products unfit for consumption (rotten, mouldy) as well as nutritionally valuable products which do not meet the visual criteria to be approved by the consumer (e.g., unsuitable shape, dimensions, etc.). Table 6 shows the actual data from this stage. Each of the products was transported with forklifts: E14, E16, H14T. This stage is indicated by the subscript “o”.
The final stage of internal transport, namely the transport of production waste, takes into account the small number of load units transported. The number of cycles (No) is calculated as an integer rounded up from the ratio between the number of pallets of waste (Qo) and the batch size (BSo)—the number of pallets transported by a means of transport in one operation. Its total time (to), due to the use of two types of FLTs, is calculated from the correlations similar to those used in step one:
  • for electric FLTs
    t oe = 1.3 2 ( d o s t + h o s l ) ( 0.8 Q o BS o )
  • for combustion engine FLTs
    t os = 1.3 2 ( d o s t + h o s l ) ( 0.2 Q o BS o )
where:
do–average distance covered in one cycle [m];
st–average transporting speed [km/h];
ho–average height of lifting [m];
sl–average lifting speed [km/h];
Qo–total quantity of post-production waste [load unit].
BSo–the size of batch for the FLT [load unit].
For this stage of transport, the respective shares of internal transport means were assumed at 80% of the working time for electric-powered FLTs and at 20% of the working time for diesel-powered ones. A factor was added to the following equations to reflect the actual average lifting and displacement speeds. It was assumed that the estimated time would be 30% longer than if maximum speeds were used (hence the coefficient of 1.3).

3. Results and Discussion

3.1. Calculating the Hourly CO2 Emission Coefficient HER

In order to facilitate the estimation of the carbon footprint for forklift trucks, the information on the relevant coefficients was analysed. Taking into account the fact that, in the case of carbon footprint emissions during fuel combustion in the analysed forklift trucks, there are no substances with extremely high GWP (global warming protection) values, only CO2 emissions resulting from fuel combustion were taken into account. One of the most crucial coefficients is the EHR-the hourly CO2 emission coefficient [kgCO2/h]. Its value was determined based on [17,19,20,21,22] (Table 7).
It was calculated that the average hourly CO2 emission coefficient is the highest in the LPG (liquefied petroleum gas)-powered FLTs (19.6 kgCO2/h) and the lowest in the electric FLTs (4.84 kgCO2/h). According to Facchini et al., the type of internal means of transport must be considered on a case-by-case basis taking into account many variables and recommending an appropriate type of FLT for the concrete situation. By way of example, the authors point out that electric forklifts should be considered preferable for low and medium weight units [1].

3.2. Estimation of the Carbon Footprint of Transporting Raw Materials from the Loading/Unloading Point to the Workstations on the Production Line

Table 8 presents a summary of the estimated transport time by electric FLTs tse, by combustion FLTs tss and of the carbon footprint from the transport of the raw material from the loading/unloading point to the workstations on the CFs production line. For this step, not all the required data were obtained. Hence, it was impossible to establish a carbon footprint for several products (peas, beans, spinach).
The highest carbon footprint was determined for broccoli (23.162 kg CO2), while the lowest one was for sprouts (4.478 kg CO2). This is, among other things, caused by the high number of transport cycles for broccoli (53) (due to the irregular shape of the produce—in one cycle, a much smaller mass of broccoli is transported compared to the other produce) and the long transport distance (500 m). Despite the high number of cycles for sprouts (48), their carbon footprint is the smallest because of the short distance of transport (100 m).

3.3. Estimating the Carbon Footprint Left as a Result of Transporting Finished Products

Table 9 provides a summary of the estimated transport time by electric forklift tp and the carbon footprint of finished product transport CFp. This stage is carried out exclusively by electric FLTs. At this stage, both the average conveying distance and the average height of lifting are the same for all products, so the number of cycles is the most relevant factor for the amount of carbon footprint. In this case, the highest carbon footprint was obtained for sprouts (17.319 kgCO2), while the lowest was for three products: peas, currants and rice (9.352 kg CO2). The number of cycles at this stage is clearly different from that of the previous stage due to the fact that in it the raw material was transported, while at this stage the finished product—the frozen produce—was transported.

3.4. Estimating Carbon Footprint from Transporting Post-Production Waste

Table 10 summarises the estimated transport time by electric FLTs toe, transport by combustion FLT tos and the carbon footprint from the transport of CFo waste. The highest carbon footprint was established for the transport of waste cherry (2.121 kg CO2), while the lowest was for waste peas (0.179 kg CO2).
It should be noted that post-production waste includes products that are unfit for consumption (rotten, mouldy) as well as ones that are nutritionally valuable but do not meet the visual criteria of the consumer (e.g., unsuitable shape, dimensions, etc.). The high carbon footprint of sour cherries compared with other products may be due both to the weight of the stones and the specific delicate and soft structure of the fruit, which is easily damaged mechanically if only during transportation.

3.5. Total Carbon Footprint

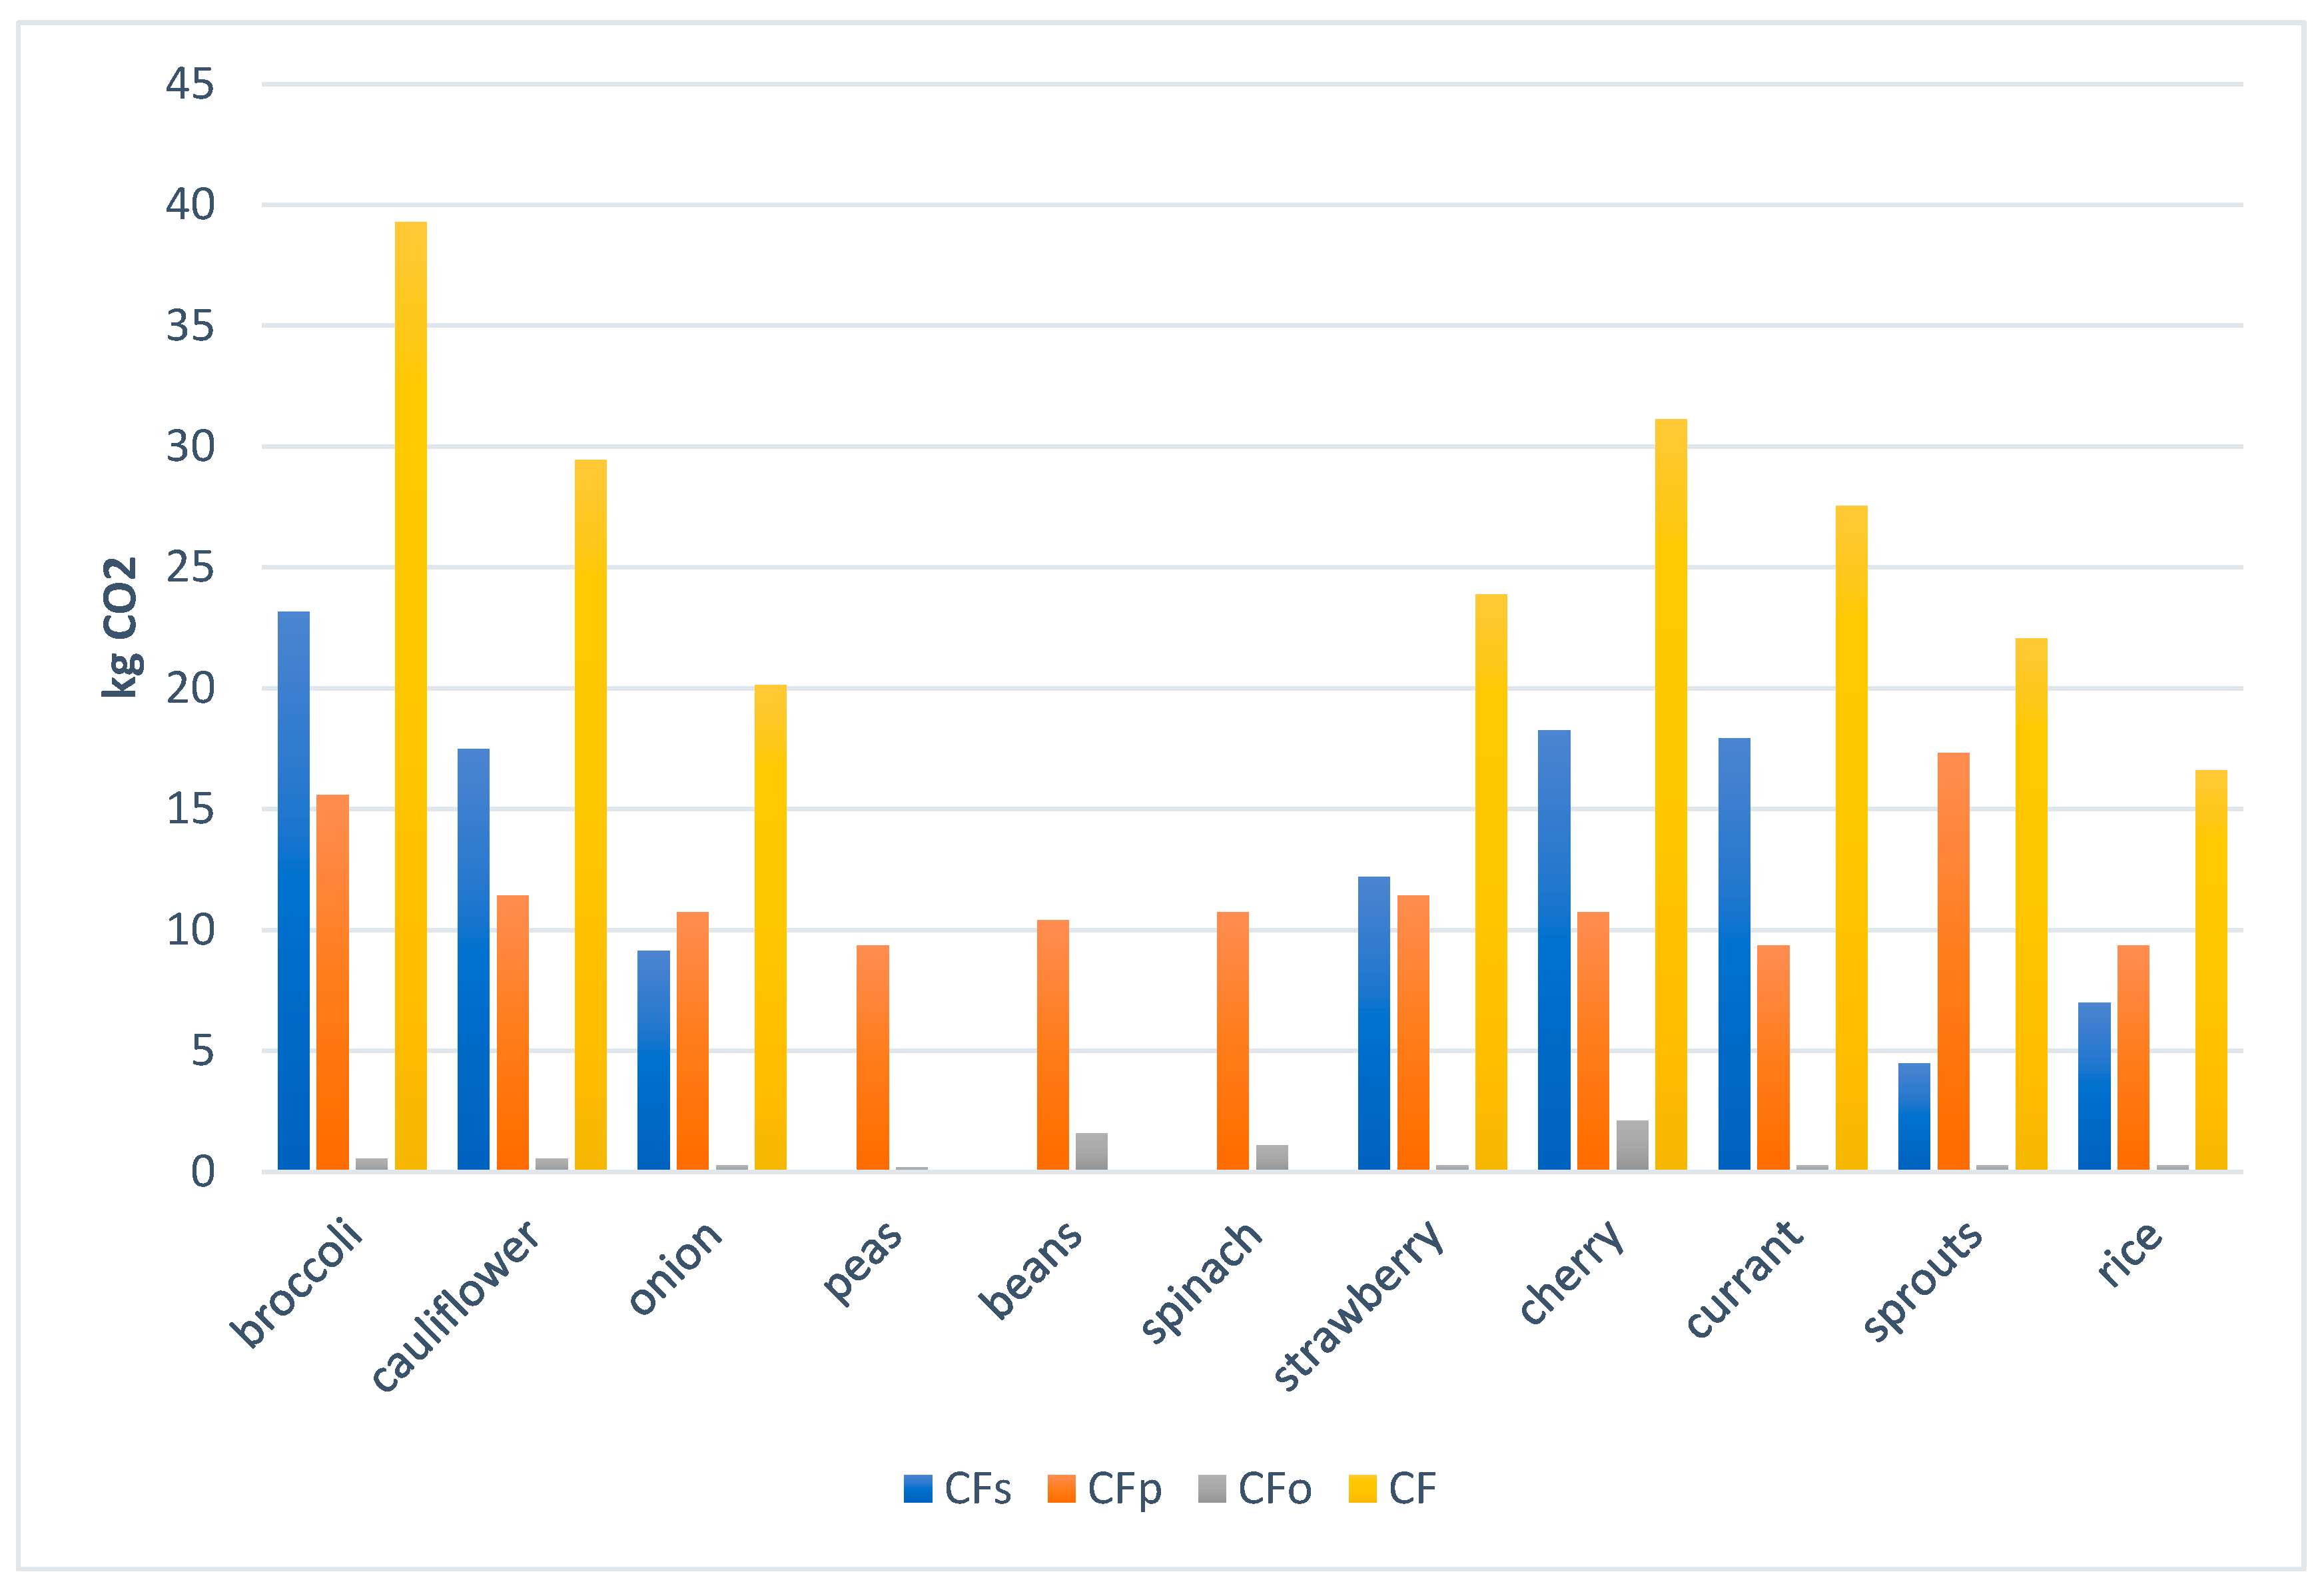
The total carbon footprint of CF was computed by adding up the component results for all three specified stages of internal transport. For a few products, not all the necessary data for carbon footprint calculation for the transport of raw materials in the first stage were obtained (peas, beans, spinach). Hence it was not possible to calculate a total carbon footprint for these types of produce. The values of the total carbon footprint range from 16.610 kgCO2 to 39.279 kg CO2. Thus, despite a similar amount of raw material (approximately 20 t) for all products, the total carbon footprint of CF emitted during the internal transport process differs more than twice. The highest total carbon footprint was determined for broccoli (39.279 kg CO2), cherries (31.115 kg CO2) and cauliflower (29.441 kg CO2), while the lowest was determined for rice (16.610 kg CO2), onions (20.131 kg CO2) and sprouts (22.062 kg CO2) (Figure 1).
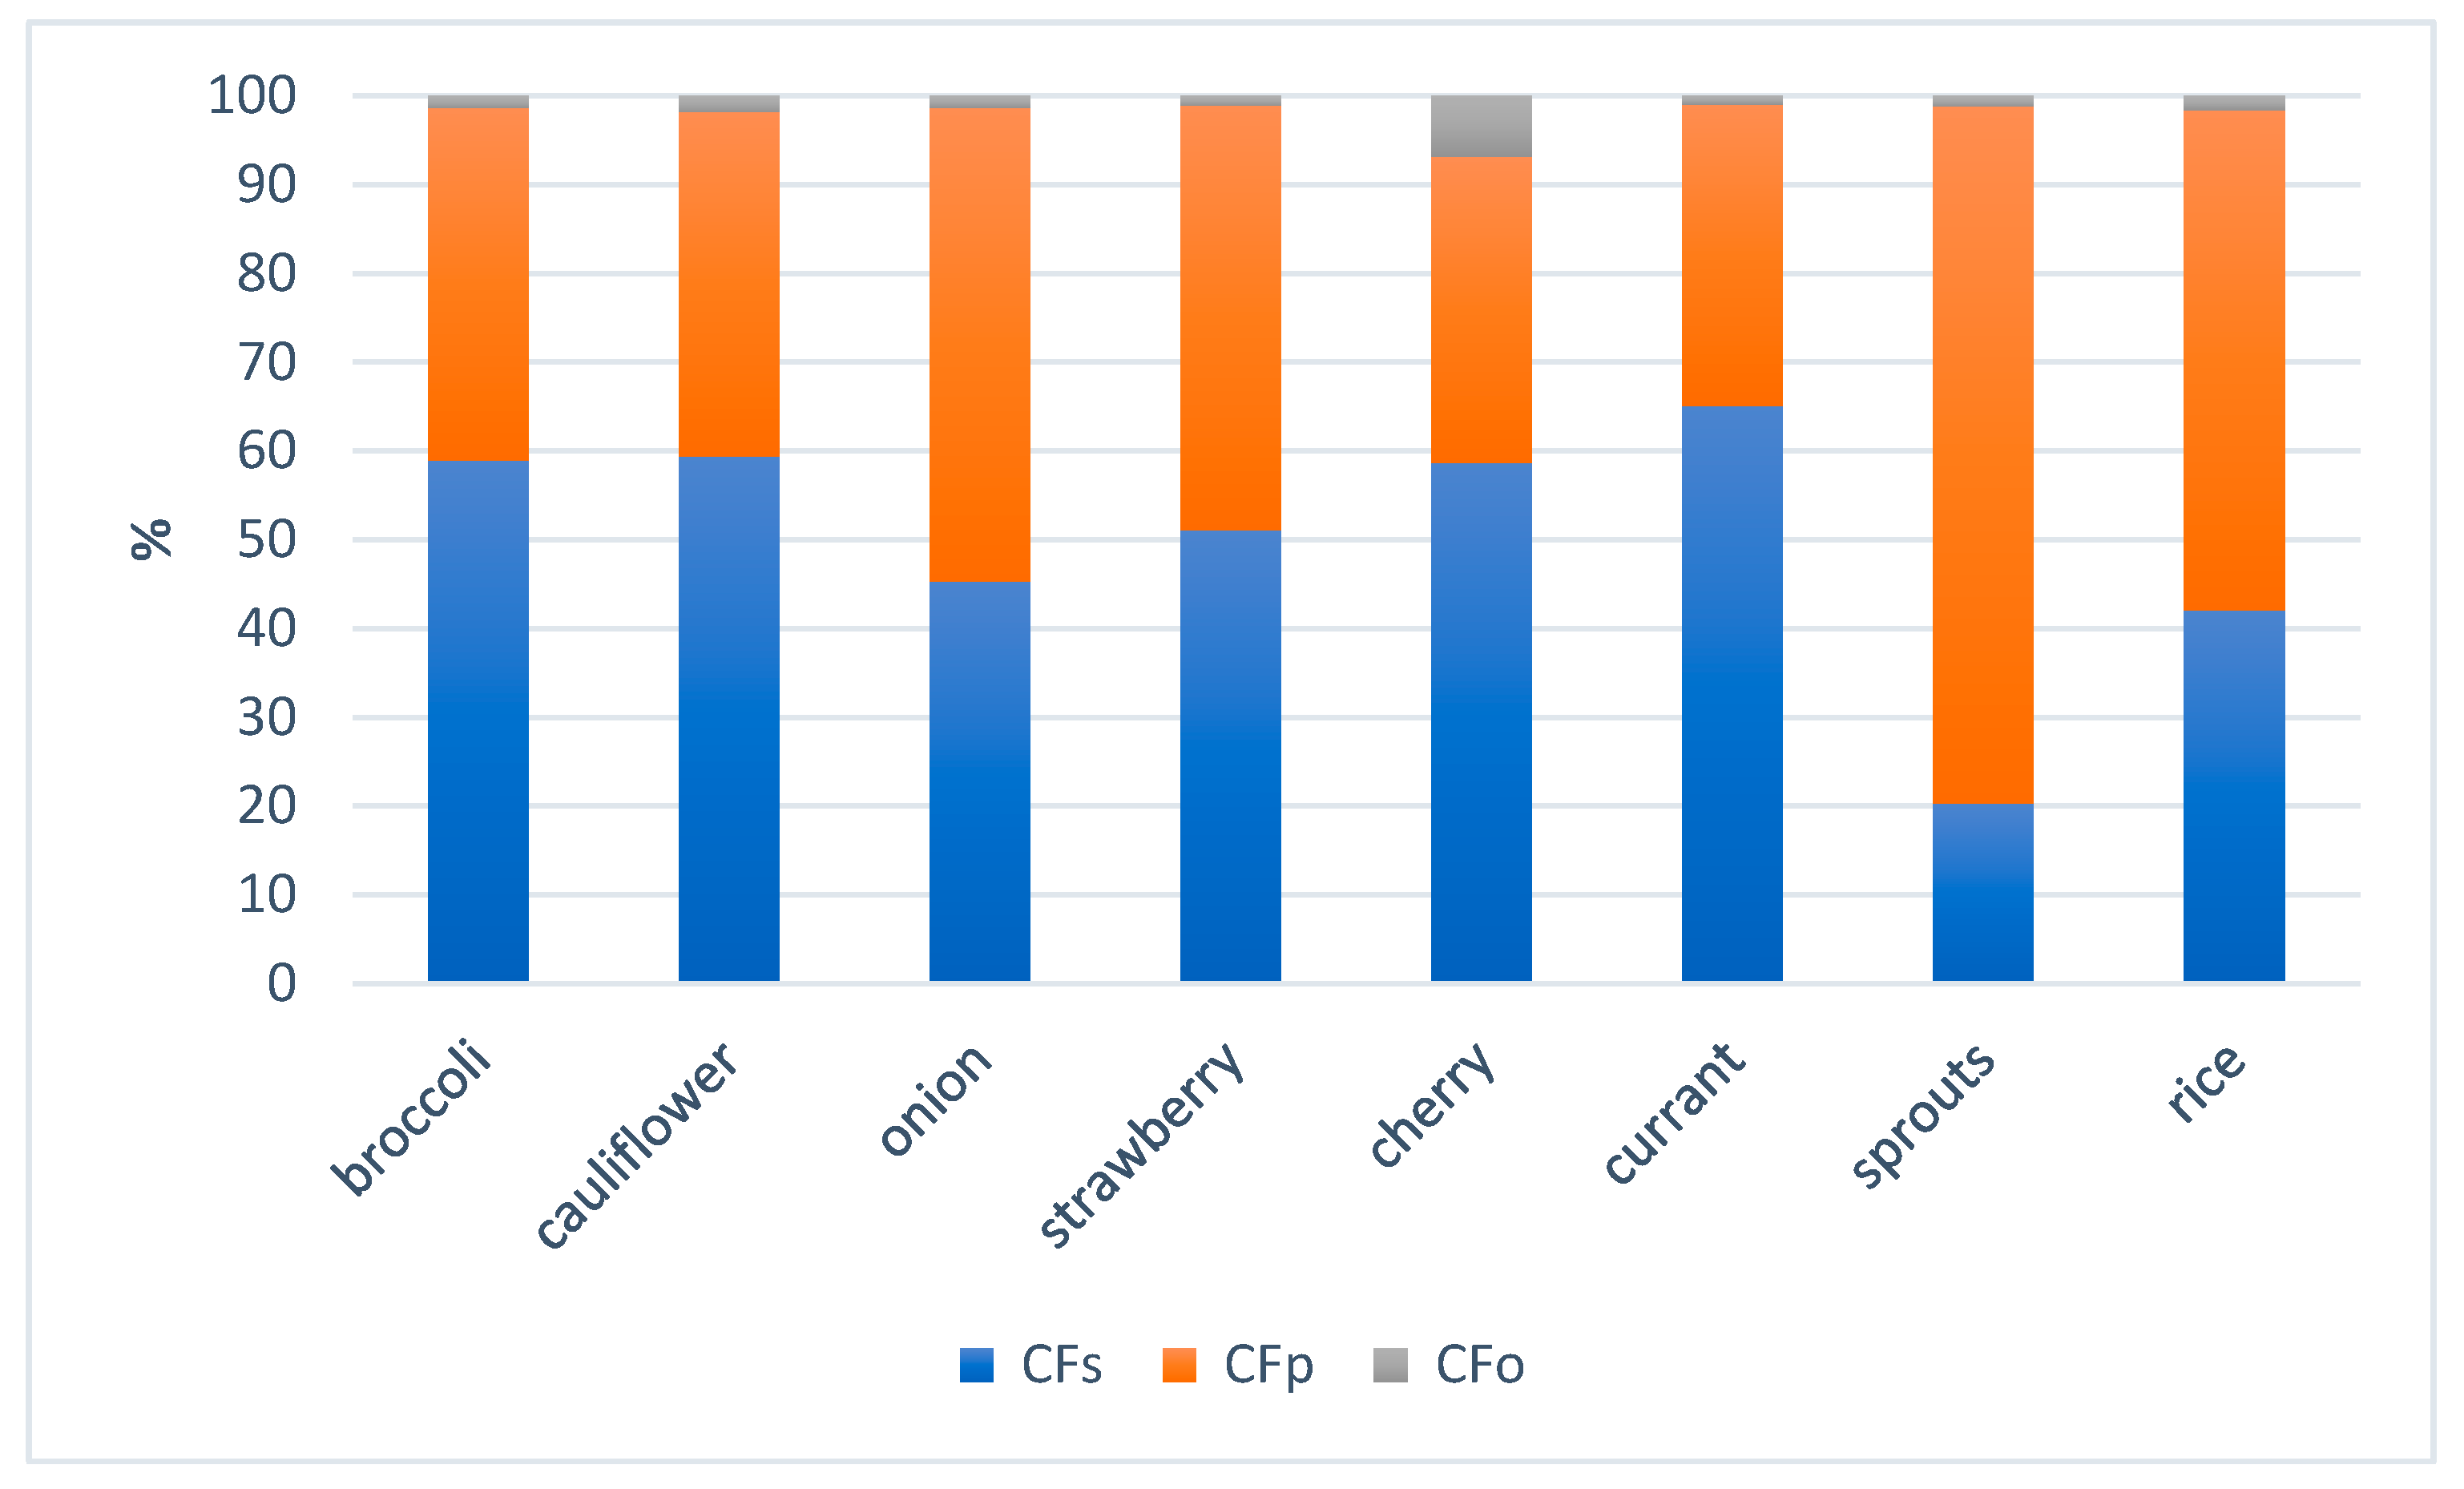
The contribution of the different stages of internal transport to the total carbon footprint is an important indicator (Figure 2). For most products, most of the emissions were found for the raw material transport stage from the loading/unloading point to the production line workstations, ranging from 20% to 65%. The dominant ones were for broccoli, cauliflower, cherry and currant and were respectively: 58.97%, 59.37%, 58.67% and 65.07%. In contrast, for several products, the dominant emitter was the transportation of finished products (53.34% for onions, 78.50% for sprouts, 56.31% for rice). The least impact on the total carbon footprint was caused by the transport of post-production waste and ranged from 1% to 7%, rounding up to 1–2% for seven of the eight products analysed, while only for transporting waste cherries the carbon footprint amounted to 6.82%.
For the purpose of comparing the carbon footprint, a comparison was made in relation to the weight of the raw material (Table 11). As a result of the internal transport, the factors for the analysed cases were estimated in the range of 1 to 1.9 kg of CO2/t of transported raw material.
The high carbon footprint of individual products can be directly attributed to the high number of cycles. Thus, reducing the carbon footprint would mainly involve introducing solutions that reduce the number of forklift trips. An appropriate mechanical pre-treatment of broccoli, e.g., by crushing it (before being transported to the production company) to obtain a more regular shape, might result in increasing the weight of the produce per unit of volume per one FLT trip. It may also be essential to reorganise the distribution of goods in the warehouse, so that, for example, the average handling time of the products with the highest number of cycles, such as broccoli, could be reduced. In addition, consideration should be given to increasing the distance for the transport of the waste product (which is not abundant) in order to reduce the distance for the raw material and the finished product.
According to the computation, cherries have the highest carbon footprint at the level of production waste, which is due to the characteristic delicate structure of this fruit as well as the substantial weight of their stones. In order to reduce the carbon footprint of soft fruits, which are easily damaged mechanically, the fruits should be properly separated, e.g., using additional baskets, separators, etc. However, in this case, it is necessary to optimise the process; it should be estimated whether an adequate separation would not result in a significant increase in volume and consequently an increase in cycles during the first and second stages, which would be a disadvantageous situation, since it is this stage of transportation that is the key CO2 emitter.
Due to the fact that part of the post-production waste is a product with full nutritional value and is rejected as a consumer product only for visual reasons (shape, size, mechanical damage), it seems reasonable to utilise such waste. Composting is the standard operation of utilising such waste adopted in the aforementioned company. The implementation of additional processes for the management of the waste (e.g., production of vegetable pastes, freeze-dried vegetable and fruit bars, vegaburgers, etc.) would not only solve the problem of wasting wholesome produce, but also reduce the carbon footprint associated with part of the waste product which would become the raw material for the next stage. This is particularly important given the efforts of governments and policy makers to move from a linear to a circular economy and to follow the 5Rs, i.e., reducing, reusing, restoring, refurbishing and recycling of resources along the entire product chain [23]. Eriksson and Spångberg checked four waste management options: incineration, anaerobic digestion, conversion and donation in the aspect of life cycle assessment for tomatoes, apples, bananas, oranges and sweet peppers. The authors’ findings show that it was conversion and donation that significantly contributed to the reduction of greenhouse gas emissions compared to incineration and anaerobic digestion [24]. Other authors also suggest the production of freeze-dried vegetable snacks with hydrocolloids (sodium alginate with calcium lactate and the mixture of locust bean gum with xanthan gum) from vegetables that are wasted in the production of frozen vegetables [25].
The proposed methodology for determining the carbon footprint based on actual data is a universal tool for estimating the carbon footprint of internal transport, which can be used to develop a list of raw materials that will provide a product with a maximally reduced carbon footprint generated at the stage of internal transport. It should be emphasized at this point that calculating the total CF requires knowing the entire production process or the overall functioning of the organisation. The possible ranges are: from cradle to grave and from cradle to gate. In the case of the strategy from cradle to grave, all stages from the extraction of raw materials to disposal are taken into account. On the other hand, the strategy focused on cradle-to-grave emissions considers many hypothetical scenarios, e.g., product use or disposal, and uses average values for situations that may or may not happen. This increases uncertainty and exposes the enterprise to calculation errors. Most entrepreneurs, however, decide to calculate the total of CF for their products using the cradle to gate strategy, where the stages from raw material extraction to the delivery of the finished product to the customer are counted. This results in a lower risk of making a mistake [26]. The model proposed by the authors can thus become a component of a universal application estimating the carbon footprint based on individual processes. In the case of the Unifreeze company (from which the data for this article was taken), there are the following stages/individual processes: production of raw material, transport from supplier to enterprise, production line, internal transport, storage, delivery to the recipient, sales and waste disposal. The CF calculator application should take into account the variety of possible data models and should allow the user to match them to the actual production process. It should also be possible for the user to input data from various sources, e.g., from the database or from measuring devices [27]. According to [28], it is essential to study the techniques used in manufacturing products in terms of their carbon footprint, since this makes it possible to identify and improve the weakest links in the production chain. Therefore, it is necessary to continue research in this area and extend it to as many products and processes as possible.

4. Conclusions

This paper presents mathematical models using internal transport energy consumption data to calculate the internal transport carbon footprint of food products (considering the operation of electric and internal combustion FLTs). The provided calculations are based on the data of a real fruit and vegetable processing company, which eliminates uncertainties related to the use of estimated or averaged values that are often difficult to access. Furthermore, the calculated internal transport carbon footprint values can be a source of data for future CF or LCA analyses focused on more extensive studies associated with various food products containing fruits and vegetables. Once the necessary data are entered (e.g., warehouse dimensions, number of forklift cycles, etc.) into the developed models, the carbon footprint for individual products can be easily determined, thus creating a list of raw materials with the lowest carbon footprint in order to create an end product that is as ecological as possible.
For most products, the highest carbon footprint was at the raw material transport stage from the loading/unloading point to the workstations on the production line. Reducing the number of cycles by the appropriate pre-treatment of some vegetables (e.g., broccoli with the highest CO2 emitter at the internal transport stage), as well as reorganising the warehouse or the whole company production site, could provide a solution to the problem of reducing the carbon footprint. The other factor that needs to be considered is the use of alternative material handling equipment (MHE), e.g., conveyor belt systems or automated storage and retrieval systems (ASRS) that can be used in companies with significant raw material processing. These systems may not only decrease the carbon footprint of the products, but also facilitate logistics related to battery charging or refuelling of FLTs, save space in warehouses and increase the safety of products and employees [29,30]. Based on the fact that food products belong to a Fast Moving Consumer Goods (FMCG) market, which is to some degree resistant to global or national consumption fluctuations (e.g., caused by pandemics or economic crisis), the investment in new MHE solutions can bring economic and environmental gains in the long term.
As observed, the lowest carbon footprint for all the types of produce was determined for the transport of post-production waste. Taking into account the fact that part of the post-production waste is a product with full nutritional value which does not meet visual standards, it is reasonable to utilise it (e.g., in the form of vegetable pastes, freeze-dried fruit and vegetable bars, etc.), which will not only allow companies to eliminate the problem of food waste, but also reduce the carbon footprint associated with the transportation of the production waste and its composting.

5. Limitations and Future Perspectives

Although internal transport energy consumption can differentiate various fruits and vegetables in terms of their carbon footprint values, it remains a less significant step of the fruits/vegetables supply chain. In the “farm to fork” approach, there are other parts of the supply chain with much higher carbon dioxide emissions, such as external transport or emissions associated with technological machines, etc. A carbon footprint-oriented analysis of real data of the remaining supply chain phases should be performed in future studies. Additionally, to significantly reduce the carbon footprint of FMCGs (especially the quickest perishing fruits and vegetables), it is essential to concentrate on (i) local products, (ii) seasonal products, and (iii) transport channels from the manufacturer/retailer to the customer. These issues need to be addressed in future studies to provide data on the most significant environmental impacts and variables. Of course, it would be optimal to calculate CF for various fruits and vegetables considering their whole life cycle, or at least all processes from raw material acquisition to the delivery of the final product to the customer. As the carbon footprint takes into account only one impact category—global warming—it is essential to remember that more complicated environmental tools such as LCA (which consider a wide range of impact categories, e.g., ozone depletion, toxicity and ecotoxicity etc.) are more representative in terms of impact on the whole environment and the various ecosystems, as they concentrate on a wide range of emitted or acquired chemicals. As the developed models concentrate solely on the internal transport using FLTs, it should be highlighted that the obtained results might be vastly different for the same fruits and vegetables, but transported using alternative MHEs. However, the profitability of more complex MHEs (conveyor belt systems or ASRSs) for companies depends on their production scale, which can additionally influence the obtained CF results. Moreover, this study was limited to fuel consumption data, omitting all greenhouse gas emissions considered in well-to-tank approach and emissions related to the production of electrical energy from various (renewable and non-renewable) energy sources. Finally, the obtained CF values are based on the specific models of FLTs, which cannot be directly extrapolated to other FLTs models with different fuel or electric energy consumption.

Author Contributions

Conceptualisation, K.G. and K.B.; methodology, K.G.; formal analysis, K.B.; investigation, N.I.; resources, N.I.; data curation, N.I.; writing—original draft preparation, Z.S.; writing—review and editing, K.G. and N.I.; visualisation, Z.S.; supervision, K.B.; project administration, N.I.; funding acquisition, K.B. All authors have read and agreed to the published version of the manuscript.

Funding

This research was funded by National Center for Research and Development, grant CFOOD number 0414/NCBR/7917.

Data Availability Statement

Not applicable.

Conflicts of Interest

The authors declare no conflict of interest.

References

  1. Transforming Our World: The 2030 Agenda for Sustainable Development. Available online: https://stg-wedocs.unep.org/bitstream/handle/20.500.11822/11125/unepswiosm1inf7sdg.pdf?sequence=1 (accessed on 13 May 2021).
  2. Gao, W.; Liang, S.; Wang, R.; Jiang, Q.; Zhang, Y.; Zheng, Q.; Xie, B.; Toe, C.Y.; Zhu, X.; Wang, J.; et al. Industrial carbon dioxide capture and utilization: State of the art and future challenges. Chem. Soc. Rev. 2020, 23, 8584–8686. [Google Scholar] [CrossRef] [PubMed]
  3. Lewis, H.Z. The role of climate change and increasing atmospheric carbon dioxide on weed management: Herbicide efficacy. Agric. Ecosyst. Environ. 2016, 231, 304–309. [Google Scholar]
  4. Wiedmann, T.; Minx, J. A definition of ‘carbon footprint’. Ecol. Econ. Res. Trends 2008, 1, 1–11. [Google Scholar]
  5. Biron, M. 11—Plastics Sustainability: Drivers and Obstacles. In A Practical Guide to Plastics Sustainability; William Andrew Publishing: Norwich, NY, USA, 2020; pp. 557–593. [Google Scholar]
  6. Lo-Iacono-Ferreira, V.G.; Viñoles-Cebolla, R.; Bastante-Ceca, M.J.; Capuz-Rizo, S.F. Carbon Footprint Comparative Analysis of Cardboard and Plastic Containers Used for the International Transport of Spanish Tomatoes. Sustainability 2021, 13, 2552. [Google Scholar] [CrossRef]
  7. Pattara, C.; Russo, C.; Antrodicchia, V.; Cichelli, A. Carbon footprint as an instrument for enhancing food quality: Overview of the wine, olive oil and cereals sectors. J. Sci. Food Agric. 2016, 97, 396–410. [Google Scholar] [CrossRef] [PubMed]
  8. The American Carbon Foodprint. Available online: http://www.kohalacenter.org/HISGN/pdf/carbofoodprint.pdf (accessed on 13 May 2021).
  9. Gómez, D.R.; Watterson, J.D.; Americano, B.B.; Ha, C.; Marland, G.; Matsika, E.; Namayanga, L.N.; Osman-Elasha, B.; Saka, J.D.K.; Treanton, K. IPCC Guidelines for National Greenhouse Gas Inventories. Available online: https://www.ipcc-nggip.iges.or.jp/public/2006gl/pdf/2_Volume2/V2_2_Ch2_Stationary_Combustion.pdf (accessed on 13 May 2021).
  10. Geilenkirchen, G.; Roth, K.; Sijstermans, M.; Hulskotte, J.; Ligterink, N.; Dellaert, S.; Hoen, M. Methods for Calculating the Emissions of Transport in the Netherlands; PBL Netherlands Environmental Assessment Agency: The Hague, The Netherlands, 2020. [Google Scholar]
  11. Al-Shaebia, A.; Khader, N.; Daoud, H.; Weiss, J.; Won Yoon, S. The effect of forklift driver behavior on energy consumption and productivity. Procedia Manuf. 2017, 11, 778–786. [Google Scholar] [CrossRef]
  12. Pashkevich, N.; Haftor, D.; Karlsson, M.; Chowdhury, S. Sustainability through the Digitalization of Industrial Machines: Complementary Factors of Fue Consumption and Productivity for Forklifts with Sensors. Sustainability 2019, 11, 6708. [Google Scholar] [CrossRef] [Green Version]
  13. Boenzi, F.; Digiesi, S.; Facchini, F.; Mummolo, G. Sustainable warehouse logistics: A NIP model for non-road vehicles and storage configuration selection. In Proceedings of the XX Summer School “Francesco Turco-Operational, Excellence, Experiences”, Napoli, Italy, 16–18 September 2015. [Google Scholar]
  14. Johnson, E. Disagreement over carbon footprints: A comparison of electric and LPG forklifts. Energy Policy 2008, 36, 1569–1573. [Google Scholar] [CrossRef]
  15. Baumgartner, M.; Léonardi, J.; Krusch, O. Improving computerized routing and scheduling and vehicle telematics: A qualitative survey. Transp. Res. Part D Transp. Environ. 2008, 13, 377–382. [Google Scholar] [CrossRef]
  16. Wang, Y.; Sanchez Rodrigues, V.; Evans, L. The use of ICT in road freight transport for CO2 reduction—An exploratory study of UK’s grocery retail industry. Int. J. Logist. Manag. 2015, 26, 2–29. [Google Scholar] [CrossRef] [Green Version]
  17. Facchini, F.; Mummolo, G.; Mossa, G.; Digiesi, S.; Boenzi, F.; Verriello, R. Minimising the Carbon Footprint of Material Handling Equipment: Comparison of Electric and LPG Forklifts. J. Ind. Eng. Manag. 2016, 9, 1035–1046. [Google Scholar]
  18. ANSI/ITSDF B56.1-2016—Safety Standard for Low Lift and High Lift Trucks. Available online: https://webstore.ansi.org/standards/ansi/ansiitsdfb562016 (accessed on 13 May 2021).
  19. Eurostat. Electricity Production, Consumption and Market Overview. European Commission Report. 2015. Available online: https://ec.europa.eu/eurostat/statistics-explained/index.php?title=Electricity_production,_consumption_and_market_overview (accessed on 9 July 2020).
  20. Eggleston, H.S.; Buendia, L.; Miwa, K.; Ngara, T.; Tanabe, K. IPCC Guidelines for National Greenhouse Gas Inventories; Institute for Global Environmental Strategie: Hayama, Japan, 2006. [Google Scholar]
  21. Fuc, P.; Kurczewski, P.; Lewandowska, A.; Nowak, E.; Selech, J.; Ziolkowski, A. An environmental life cycle assessment of forklift operation: A well-to-wheel analysis. Int. J. LCA 2016, 21, 1438–1451. [Google Scholar] [CrossRef] [Green Version]
  22. Comparison of CO2 Emission Factors for Fuels Used in Greenhouse Gas Inventories and Consequences for Monitoring and Reporting under the EC Emissions Trading Scheme. Available online: https://www.eionet.europa.eu/etcs/etc-cme/products/etc-cme-reports/etcacc_techpaper2003_10_co2_ef_fuels-1/@@download/file/ETCACC_TechnPaper_2003_10_CO2_EF_fuels.pdf (accessed on 13 May 2021).
  23. Camilleri, M.A. European environment policy for the circular economy: Implications for business and industry stakeholders. Sustain. Dev. 2020, 28, 1804–1812. [Google Scholar] [CrossRef]
  24. Eriksson, M.; Spångberg, J. Carbon footprint and energy use of food waste management options for fresh fruit and vegetables from supermarkets. Waste Manag. 2017, 60, 786–799. [Google Scholar] [CrossRef] [PubMed]
  25. Ciurzyńska, A.; Marczak, W.; Lenart, A.; Janowicz, M. Production of innovative freeze-dried vegetable snack with hydrocolloids in terms of technological process and carbon footprint calculation. Food Hydrocoll. 2020, 108, 105993. [Google Scholar] [CrossRef]
  26. Kulczycka, J.; Wiernicka, M. Zarządzanie śladem węglowym w przedsiębiorstwach w Polsce—bariery i korzyści. Polityka Energetyczna 2014, 18, 61–72. (In Polish) [Google Scholar]
  27. Stawska, Z.; Milczarski, P.; Zieliński, B.; Hłobaż, A.; Maślanka, P.; Kosiński, P. The Carbon Footprint Methodology in CFOOD Project. Int. J. Electron. Commun. 2020, 66, 781–786. [Google Scholar]
  28. Karwacka, M.; Ciurzyńska, A.; Lenart, A.; Janowicz, M. Sustainable Development in the Agri-Food Sector in Terms of the Carbon Footprint: A Review. Sustainability 2020, 12, 6463. [Google Scholar] [CrossRef]
  29. Carli, R.; Dotoli, M.; Digiesi, S.; Facchini, F.; Mossa, G. Sustainable Scheduling of Material Handling Activities in Labor-Intensive Warehouses: A Decision and Control Model. Sustainability 2021, 13, 2552. [Google Scholar] [CrossRef] [Green Version]
  30. Kawalec, W.; Król, R.; Suchorab, N. Regenerative Belt Conveyor versus Haul Truck-Based Transport: Polish Open-Pit Mines Facing Sustainable Development Challenges. Sustainability 2020, 12, 9215. [Google Scholar] [CrossRef]
Figure 1. The carbon footprint of all stages of internal transport.
Sustainability 13 07579 g001
Figure 2. Share of the different stages of internal transport in the total carbon footprint.
Sustainability 13 07579 g002
Table 1. Dimensions of the available storage areas (data collected in 2019). SM means storage magazine.
Storage AreaCapacity of the Storage AreaShare of the Overall Storage AreaDimensions of Storage Areas
Distance–Horizontal Transport [m]Height–Vertical Transport [m]
MinMaxAverageShareMinMaxAverageShare
Number of Pallet Spaces [Row of Racks][%][m][m][m][m][m][m][m][m]
SM1400023.510018014032.941740.94
SM2240014.111019015021.181740.56
SM3500029.416024020058.821105.51.62
SM4560032.917022019564.241105.51.81
Total17000100 177.2 4.94
Table 2. Actual data regarding the electric internal transport means (data collected in 2019).
ParameterUnitType of Means of Transport
Linde R14HDLinde E14Linde E16
motor for horizontal transportkW6.52 × 4.62 × 4.6
motor for lifting operationkW141010
max. horizontal speed (st)km/h141616
max. lifting speedm/s0.550.4–0.60.4–0.6
max. lowering speedm/s0.550.580.58
average max. vertical speed (sl)m/s0.550.540.54
Table 3. Actual data regarding the internal transport means Linde H14T–combustion engine.
ParameterUnitValue
enginekW28
max. horizontal speed (st)km/h20
max. lifting speedm/s0.6
max. lowering speedm/s0.57
average max. vertical speed (sl)m/s0.585
Table 4. Actual data for the internal transport of the raw materials delivered to the manufacturing plant (data collected in 2019).
ProductRaw Material Quantity (Qs)—Number of PalletsNumber of Trips (BSs)Average Distance of Transport (ds)Average Height of Lifting (hs)
[pcs.][pcs.][m][m]
broccoli10525001
cauliflower4015001
onion5224001
strawberry4613001
cherry5214001
currant4115001
sprouts9521001
rice1615001
Table 5. Actual data for internal transport of finished products (data collected in 2019).
ProductRaw Material Quantity (Qp)—Number of PalletsNumber of Trips (BSp)Average Distance of Transport (dp)Average Height of Lifting (hp)
[pcs.][pcs.][m][m]
broccoli4513505
cauliflower3313505
onion3113505
peas2713505
beans3013505
spinach3113505
strawberry3313505
cherry3113505
currant2713505
sprouts5013505
rice2713505
Table 6. Actual data for the internal transport of post-production waste (data collected in 2019).
ProductRaw Material Quantity (Qo)—Number of PalletsNumber of Trips (BSo)Average Distance of Transport (do)Average Height of Lifting (ho)
[pcs.][pcs.][m][m]
broccoli213001
cauliflower213001
onion113001
peas112001
beans613001
spinach612001
strawberry113001
cherry813001
currant113001
sprouts113001
rice113001
Table 7. Average hourly CO2 emission coefficient [kgCO2/h] for various types of FLT [17,19,20,21,22].
Type of FLTFEF or EEF [kgCO2/kWh] FCHR   or   ECHR /   η   [ kWh / h ] Average EHR [kgCO2/h]
Diesel0.26639.178.85 (7.02–10.67)
LPG0.227; 0.234;86.4619.6 (13.0–26.2)
Electric0.338; 0.34010.64.84
Table 8. Estimation of the carbon footprint from the transport of raw materials from the loading/unloading point to the workstations on the production line (index s).
ProductNumber of Cycles NsTime of Transport by Electric FLT tse [h]Time of Transport by Diesel FLT tss [h]Carbon Footprint CFs [kgCO2]
broccoli533.5020.70223.162
cauliflower402.6430.53017.481
onion261.3800.2779.128
strawberry461.8430.37012.197
cherry522.7600.55418.256
currant412.7090.54317.918
sprouts480.6750.1374.478
rice161.0570.2126.992
Table 9. Estimating carbon footprint from transporting finished products (index p).
ProductNumber of Cycles Np.Time of Transport by Electric FLT tp [h]Carbon Footprint CFp [kgCO2]
broccoli453.22015.587
cauliflower332.36211.430
onion312.21910.738
peas271.9329.352
beans302.14710.391
spinach312.21910.738
strawberry332.36211.430
cherry312.21910.738
currant271.9329.352
sprouts503.57817.319
rice271.9329.352
Table 10. Estimating the carbon footprint left by transporting post-production waste (index o).
ProductNumber of Cycles NoTime of Transport by Electric FLT toe [h]Time of Transport by Diesel FLT tos [h]Carbon Footprint CFo [kgCO2]
broccoli20.0800.0160.530
cauliflower20.0800.0160.530
onion10.0400.0080.265
peas10.0270.0050.179
beans60.2400.0481.591
spinach60.1620.0331.075
strawberry10.0400.0080.265
cherry80.3210.0642.121
currant10.0400.0080.265
sprouts10.0400.0080.265
rice10.0400.0080.265
Table 11. Amount of carbon footprint emitted for the internal transport of 1 tonne of raw material.
ProduceCF per Tonne [kgCO2/t] of Raw Material
broccoli1.88842
cauliflower1.41545
onion0.98682
strawberry1.15424
cherry1.29647
currant1.34317
sprouts1.00282
rice1.0381
Publisher’s Note: MDPI stays neutral with regard to jurisdictional claims in published maps and institutional affiliations.

