1. Introduction
Rising economic growth in developing countries and continued growth in industrialized countries have increased energy demand. Naturally, various energy sources are used in power plants, which can include fossil fuels (oil, gas, coal) or new energy sources (solar, wind, geothermal, etc.). The increasing dependence on energy has made this sector more interactive with other economic sectors and has made the pace of economic growth and development dependent on energy consumption.
Coal, as one of the main sources of energy, is a non-renewable fossil fuel that has been used since ancient times. Given that most of the first-grade coals have already been mined, the coal that remains for future use is mostly low-grade with high ash and moisture content. In addition, environmental issues related to its extraction, processing, and combustion, threaten the sustainability of coal use. Today, environmental issues, including the factors that have led to climate change through the emission of carbon dioxide, are of global concern, and this is one of the serious problems that coal will face in the future and threaten its sustainability [
1,
2]. Although coal will continue to be a major player in the global energy spectrum for at least the next two to three decades, coal’s sustainable future still depends on reducing its pollution.
Iran has an average level of coal reserves. This valuable fuel is used in many industries, including power plants, steel plants, cement production, chemical and pharmaceutical industries, ammonia gas recovery to produce chemical fertilizers, paper making, and liquid fuel as the main element in production. The lack of coal-fired power plants in Iran reduces the consumption of thermal coal and just a part of this is exported. On the other hand, due to the consumption of coking coal concentrate in steel plants, the shortage of this product in Iran, and the difference in the quality of domestic and foreign coking coal, the tendency to import this fossil fuel has increased. Lack of advanced equipment has reduced efficiency and increased costs, and the lack of a proper strategy in the mining sector has reduced the attractiveness for investors, especially in coal mines. As a result, the cost of domestic coal has increased compared to foreign coal. This has reduced Iran’s competitiveness with producers in the global market.
To manage the energy supplement, it is necessary to understand the factors that affect the amount of energy needed in a region. Since the energy demand procedure and the factors that influence it follow a hazy and complicated pattern, efficient tools are needed for efficient use of energy [
3]. So, it is necessary to determine effective tools to determine energy demands precisely.
Non-classical approaches have been prolonged to detect and predict complex system-based problems. Despite numerous methods for predicting natural phenomena all over the world, accurately forecasting the events is still difficult. Several non-linear systems exist in the real world, some with dynamic behaviours based on their current state. For such an assessment, different statistical demonstration approaches have been used based on socioeconomic indicators. These models can be appropriately forecasted considering birds, fireflies, bats, and other living organisms utilizing intelligent optimization techniques.
It is believed that artificial neural network (ANN) is one of the highest breakthroughs in the field of computational intelligence. Its application is supported in various fields, which assist in taking further steps to realize the dream of machines capable of thinking and learning in a similar way to the human brain. To model ANN, biological nervous systems have been used (the human brain). Despite processing information, compared to the human brain, it is relatively simple and easy to operate. The ANNs are a model for processing the information created by the imitation of biological neural networks such as the human brain. It should be noted that the novel structure for the information processing system is a critical element of this model, comprising numerous elements (neurons) with robust internal connections, working towards solving some definite problems.
Such neuron/node layers comprise a neural net, with a structure starting with the first layer as the input and ending by the end layer at the output. The layers existing within these two are called hidden layers. An activation value for each node is determined from the previous layers nodes’ activation values. The factor is determined by the connection weights or parameters, where each node in the former layer has a role in the subsequent layer nodes’ value. Determining the ultimate values for these parameters is an optimization problem, which should be stated.
There have been numerous attempts to determine the connection weights’ optimum value within a Multi-layer Perceptron neural network. Generally, the trainers are classified into two groups of gradient-based and stochastic search algorithms. A backpropagation [
4] algorithm and its variants are included in gradient-based training algorithms representing the eye-catching advantages of the convergence’s high speed. However, they tend to rely heavily on the initial solution, which possibly causes them to become trapped in a local optimal. Nevertheless, stochastic algorithms have gained popularity since they can solve such disadvantages. In these algorithms, the primary solution is made or selected randomly, therefore, they do not end up in local optimal entrapments.
Another method for solving optimization problems is meta-heuristic algorithms related to the class of stochastic optimization algorithms. They aim to solve optimization problems in a “fairly good” way, though they do not always achieve the best results. Nature-oriented algorithms are a kind of meta-heuristic algorithm, inspired by biological systems present in the environment, such as the grey wolf optimization, which imitates the hunting pattern and hierarchical structure of wolves, bat algorithm, which imitates the bats’ hunting behaviour by utilizing echolocation, and the genetic algorithm, which is based on Darwin’s theory of “survival of the fittest” and next generation evolution.
Bio-inspired algorithms were formerly utilized in various fields for addressing application-based optimization problems. Inconsistency with the no-free-lunch theorem, as the definite algorithms present better results for only definite specific applications. No optimization algorithm exists that works for all fields universally. An enhanced version of the Binary Bat algorithm was proposed by Gupta [
5] to solve the optimization problem of selecting the features on the white blood cells dataset. Different approaches to nature-inspired algorithms were discussed by Tiwari and Bansal [
6] on industrial applications. Suguna et al. [
7] performed medical image processing (classification and segmentation), using bio-inspired algorithms, such as Lion Optimization Algorithm (LOA) and Monkey Search Optimization Algorithm (MSO).
Related Works
The scope of using nature-based algorithms was examined and run to train an MLP neural network. The grey wolf optimizer was similarly employed by Mirjalili [
8] and its performance was compared on multiple benchmark data-sets, versus some other recognized evolutionary trainers, such as genetic algorithm (GA), ant colony optimization (ACO), population-based incremental learning (PBIL), evolution strategy (ES) and particle swarm optimization (PSO). Aljarah et al. [
9], working along similar lines to solve this optimization problem, used whale optimization algorithm, which is another nature-based algorithm. Various variants of bat-inspired algorithms were employed by Jaddi et al. [
10] as a new method to represent optimizing both the ANNs framework and connecting weights. The application of grey wolf optimization (GWO) was extended by Faris et al. [
11], providing a new hybrid encoding scheme to automatically select hidden neurons and weights within a neural network. A multi-verse optimizer was tested and compared with other present meta-heuristic evolutionary algorithms as feed-forward neural network trainers for binary classification problems [
12].
A bio-inspired firefly algorithm was analysed by Nandy et al. [
13] to train a back-propagation neural networks. Ojha et al. [
14] investigated the progress within the metaheuristic methods utilized for designing feed-forward neural networks over the years. An emergent stochastic training algorithm was studied by Heidari et al. [
15] and proposed to train an MLP.
Such optimized neural networks are applied in different fields and over various data sets to solve day-to-day problems. A PSO trained ANN was employed by Blum and Socha [
16] to detect the possibility of failures in a multi-storeyed reinforced concrete building structure. Neural network optimization was used to analyse rain patterns and discover wet and drought year alarms by Valipour [
17]. The use of artificial neural networks was reviewed by Villarrubia et al. [
18] to approximate an objective function and solve optimization problems. An innovative Elman neural network was suggested by Ruiz et al. [
19] to estimate energy use in public buildings and obtain energy savings through a genetic algorithm and optimize the connection weights. An ANN model was compared by Yang et al. [
20], both with and without a genetic algorithm to predict and parametrically optimize the ORC system. Numerous bio-inspired algorithms exist, each with its disadvantages and advantages. The multiple meta-heuristic algorithms fusion was introduced via hybridization to highlight the best in each one and cover each lacunae.
Several studies have suggested various models for managing energy demand policy using different methods. Particle swarm optimization (PSO) energy demand models were developed by Unler in Turkey to assess energy demands based on economic indicators [
21]. Using the genetic algorithm (GA), Canyurt and Ozturk proposed models for estimating Turkey’s fossil fuel consumption [
22]. Toksari used ant colony optimization models to estimate Turkey’s energy demand [
23]. To predict monthly electrical energy usage; Azadeh et al. used an artificial neural network (ANN) [
24]. Azadeh et al. introduced and compared the genetic algorithm, ANN, and Fuzzy Regression Algorithm (FRA) to evaluate improvements in electricity use in developing countries in a separate paper [
25]. PSO and GA were used by Amjadi et al. to forecast Iran’s electricity demand [
26]. To estimate China’s transportation energy consumption, Zhang et al. used the Partial Least-Squares Regression (PLSR) approach [
27]. In Iran, Assareh et al. established a PSO and GA program to estimate oil demand [
28]. The bees algorithm, BA, was used by Behrang et al. to predict Iran’s total energy demand [
29]. Behrang et al. used PSO and GA to predict electricity demand in Iran’s industrial sector [
30]. Bahmani et al. forecasted Iran’s oil consumption using the BA with ANN [
31]. Horák et al. [
32], applied an artificial neural network to show how financial and nonfinancial indicators play important roles in the explanation of corporate health and support a company’s possibilities of reaching relevant performance levels. Vochozka et al. [
33], used artificial neural networks to create a methodology for the prediction of a company failure. The study of [
34] investigated the influence of the international price of oil on the value of the EUR/USD exchange rate by using the approach of neural networks. In another study Vochozka et al. [
35], used (Long Short-Term Memory) for predicting oil prices.
Vrbka et al. [
36], used neural networks to determine value-based drivers for SMEs operating in the rural areas of the Czech Republic. Taner et al. [
37,
38,
39,
40] carried out optimization, energy-exergy analysis, and techno-economic and cost analysis of a drying plant, model of a sugar factory, and turbine power plant of sugar in Turkey, respectively. In another study, Taner [
41] carried out an experimental optimization of a PEM fuel cell to enhance the efficiency and development of the simulations and modelling of a PEM fuel cell. Topal et al. [
42,
43] presented case studies of the poultry industry and power plants in Turkey, based on the application of trigeneration and exergy analysis of the plant.
This paper aims to present a novel hybrid computational intelligence approach for forecasting coal consumption. The hybrid Grey Wolf-Bat Optimization Algorithm with ANN is used to build a demand prediction model for predicting coal consumption in Iran based on socioeconomic indicators.
2. Materials and Methods
2.1. Bat Algorithm (BA)
The bat algorithm, which is an evolutionary algorithm inspired by the behaviour of natural bats, was introduced by Yang [
44] and is used to solve various problems. The bat algorithm (BA) works based on the sound echo and the position of the bat. The bat produces sound pulses and receives their echoes. The bats can detect prey from the barriers based on echoes as the sound echoes produced for different objects vary; their corners use this method to detect positions. BA works based on the following three basic steps:
All bats can make a sound and receive an echo. They can distinguish the food source from the barrier according to this ability.
The bats fly randomly and have a vi velocity in the xi position and a constant frequency of and wavelength λ during flight. They can produce sound pulses between 0 and 1.
The loudness of bats can differ from a large positive value to a small positive value .
One can assume that the value of frequency f can differ between
and
and the corresponding wavelength from
to
. Wavelength amplitude can vary too. The wavelength should be selected based on the problem search space [
45].
Xbest in BA is considered as the global answer to the problem or the best position of the bats. Equations (1)–(3) show the updated frequency, velocity, and position of the bats, respectively [
46].
is the frequency of the
ith bat,
new velocity of the
ith bat,
the previous velocity of the
ith bat,
the new position of the
ith bat,
the previous position of the
ith bat, and β a random vector with an array between 0 and 1. First, a random number between
fmin and
fmax is assigned to each bat. The bat velocity and position are then updated based on Equations (2) and (3). Then a random number is generated. The local search is performed using the production of a random step based on Equation (4) if the pulse generation rate is less than this random number:
It is a random number and is the average volume. The volume decreases and the pulse rate increases when bats find prey. Volume and pulse output rate are calculated as Equation (5):
γ and
α are constant parameters.
2.2. Grey Wolf Optimization Algorithm (GWO)
There are always signs around for modelling to solve and optimize complex problems. The paper will examine an algorithm that can be used to solve optimization problems by modelling a natural organization. GWO imitates the grey wolf organization for hunting in the wild. The algorithm was presented in 2014 by Mirjalili [
47]. Similar to PSO and ACO algorithms, this algorithm is among the collective intelligence algorithms and uses only one (hybrid) operator to determine the position of wolves in the problem-solving space.
Grey wolves are creatures living in a semi-democratic way and the status of each wolf is clear in their community. In this community, the leader wolf, her successors, and other wolves are known too. Grey wolves live and hunt in a pack. In each pack of grey wolves, there are on average between 7 and 12 wolves. These 4 groups are the most dangerous predators. The grey wolves first loop around the prey and surround it to hunt and begin to exhaust the prey by tightening the siege. Then, in turn, at the order of the leader wolf, they attack and finally kill the prey. The following is an example of a wolf attack in the real world.
As already stated, grey wolves live in a hierarchical (very strict) manner. The figure below is the structure of the grey wolf hierarchy. Known as the group leader, the Alpha pair makes decisions about hunting, sleeping location, waking time, and so on. Alpha decisions apply to the whole pack. However, there is a kind of democratic behaviour as well. The second rank in the hierarchy belongs to Beta wolves. Beta wolves help the alpha in group decisions and other activities. These wolves are the best candidates for alpha when the alpha is very old or dies.
The wolves with the lowest status are the Omega wolves. This group of wolves has the role of pre-death in the pack. They have to follow all other wolves and are the last wolves to eat. It seems that Omegas have a low significance in the category, yet it has sometimes been observed that if the Omegas are lost, the whole group suffers from problems and civil wars. The wolves not stated in the above hierarchy are called Delta wolves. Delta wolves are commanded by Alpha and Beta but are superior to Omega. Accordingly, the GWO is explained, and following mathematical equations are used. As already stated in the previous sections, grey wolves surround their prey during the hunting process. The following equations are used to model the hunting mechanism:
In the above equations, t is the algorithm iteration.
Vectors A and C are the prey location vector coefficients and X is the grey wolf location vector.
decreases linearly from 2 to 0 during repetitions. r1 and r2 are random vectors in the range [1/0].
For a two-dimensional problem, the vectors will be as follows (position the vectors in two dimensions and their next position) [
47].
Mathematical equations of GWO considering the hierarchy in
Figure 1:
2.3. Artificial Neural Network (ANN)
An artificial neural network, simply called a neural network, is a computing system inspired by the human brain. This inspiration has developed an artificial neural network to a set of simple and strong computing methods. The characteristics including the power of learning and adaptation, the possibility of underlying information processing, the power of generalization, error tolerance, and uniformity of analysis and design give a strong capability of processing to neural networks and enable them to successfully conduct activities, such as the estimation of nonlinear complex functions and pattern identification and classification. The structure of the neural network is usually a multi-layered network or graph with simple connections among layers. There are one or more computational units in each layer called a node or artificial neuron, which is in fact a simple model of neurons of the human brain. The role of neurons in the neural network is data processing and this is done by a mathematical processor which is an activation function in the artificial neural network. The activation function or operational function considers the problem which is going to be solved by a neural network and selected by the designer. An artificial neural network in the simplest way has an input layer and output layer. But the network with hidden layers has more capabilities. It can be proved that a feed-forward neural network with a hidden layer, sigmoid activation function in the hidden layer, linear activation function in the output layer, and enough neurons in the hidden layer can estimate every function with sufficient accuracy. The network acts as an input-output system and uses the value of input neurons to compute the value of output neurons. Each neuron connection in different layers has its weights and the network learns the pattern in input and output variables by adjusting these weights during the training phase. According to the learning methods, neural networks can generally be classified into two categories: supervised learning and unsupervised learning [
48]. In supervised learning, the correct response (output) for each input pattern is given to the network. Weights are determined in a way that the network creates responses that are close to the correct responses. During repeated weight correction, a network is trained. Repeating the learning process, the network identifies the correct value of weights and lowers the possibility of errors. For a set of identified inputs, the error means the difference between the actual value and the network output. In unsupervised learning, there is no need for an actual response for each input pattern in the training set. In this model of learning, the network discovers the basic structure of the data and the correlations between the patterns in the data and organizes the patterns into appropriate classes. According to the structure, artificial neural networks are divided into two types of feed-forward networks and recurrent networks. The feed-forward network, in which there is no feedback loop, and the recurrent network, which has a feedback loop and neurons in each layer, gives the data from previous and post layers.
The following hypotheses are considered in artificial neural networks:
Data processing takes place in simple units called neurons. These artificial neurons (or simply neurons) are a simple model of brain neurons.
The data are exchanged in communications between neurons.
Each communicative way between neurons has weight.
Each neuron uses an operational function (usually non-linear), to apply it to the neuron input (the weighted data) and create a definite output.
The neural network is identified through the communicative pattern between different layers of the network, the number of neurons, the number of layers, the learning algorithm, the operational function of the neuron. But there is no general rule about the standard size of these components for each network and in each application. In most cases, it is an innovative method in which the multi-layered networks with a different number of neurons in each layer, are trained with different learning rates and various activation functions, and then the best network is elected. In the learning phase, the network is trained through weight adjustment to be able to predict or classify target outputs based on a set of inputs.
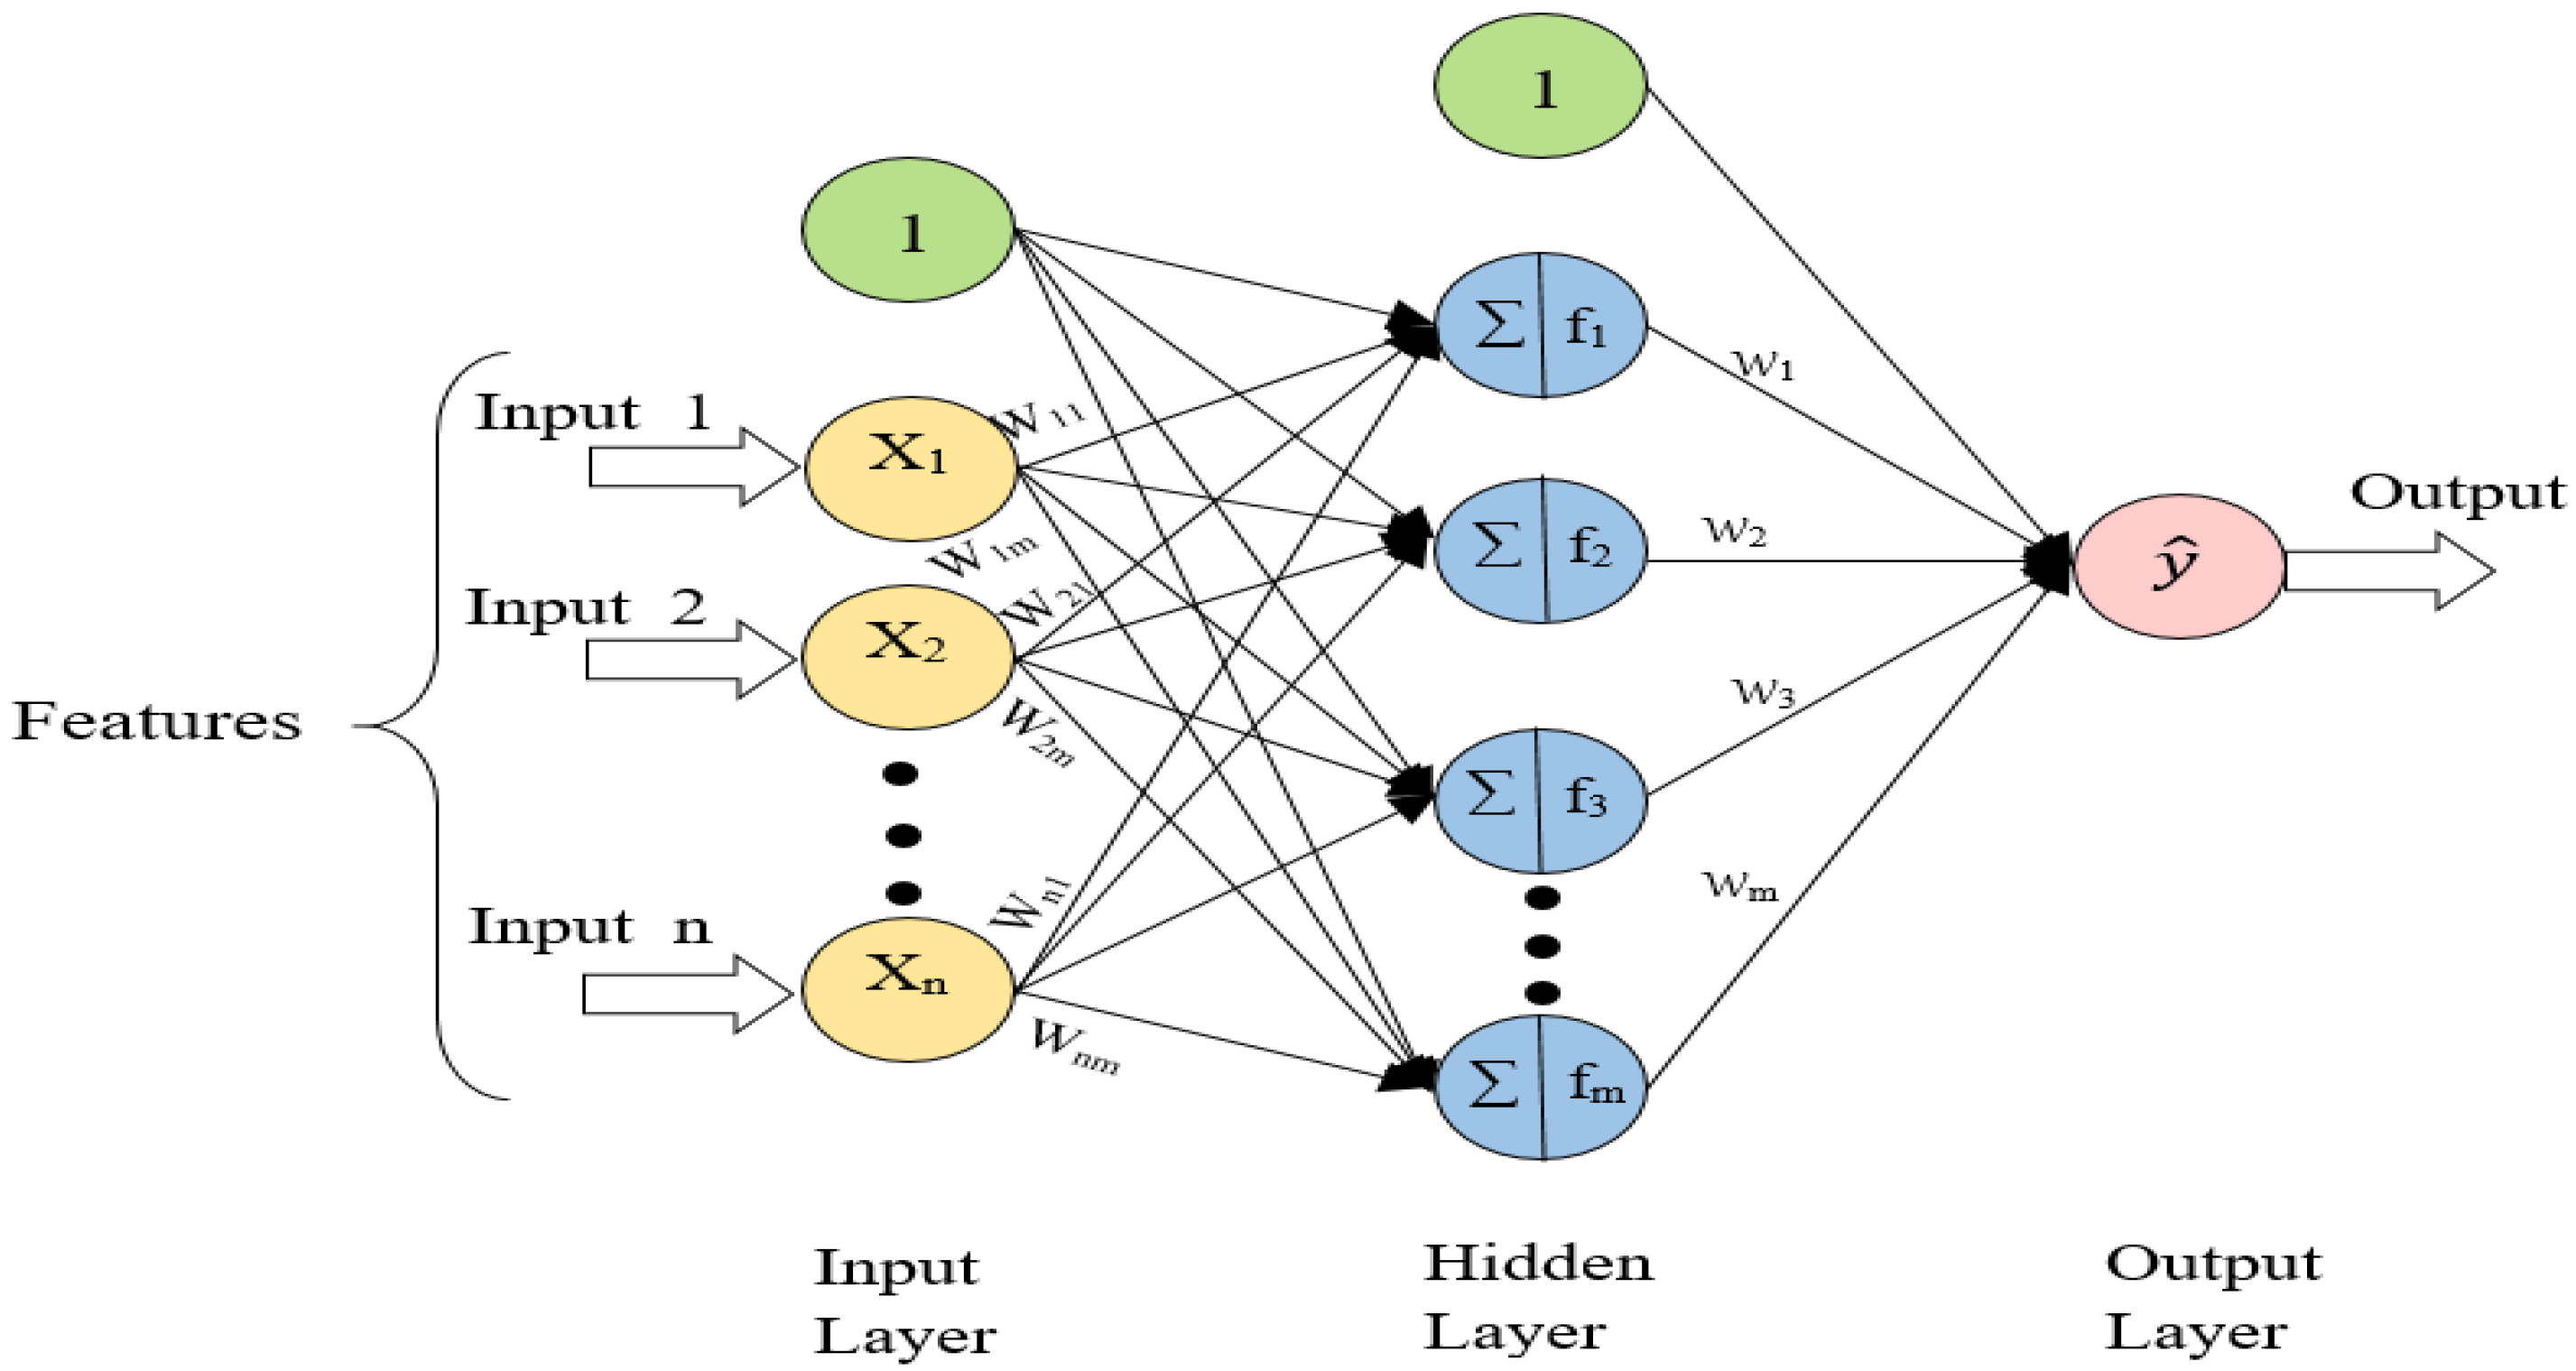
In
Figure 2, an artificial neural network (ANN) is demonstrated with a hidden layer, containing certain weights linking the layers. Through the following steps, the output values will be calculated. Firstly, as follows, weights sum is calculated:
In the above-mentioned formula, the input variable is , the weight existing between neuron j and the input variable is , and is for the input variable.
Second, using an activation function, values of neurons output in the hidden layers are generated using the weighted summation received values (Equation (13)). A sigmoid function is a popular candidate for such a function, as seen below:
where
signifies the sigmoid function regarding neuron
j and
refers to the sum of weights.
Lastly, the neuron j output is calculated as seen below:
where
refers to the neuron output j,
refers to the weight existing between the output variable neuron
j and
,
refers to the neuron
j activation function, and
is the bias term for the output variable [
39].
2.4. Proposed Method
To deal with the connection weight optimization problem for MLP training, the presented Hybrid Wolf-Bat Optimization (HWBO) Algorithm combines two well-known nature-inspired algorithms, bat algorithm (BA) and grey wolf optimization (GWO) algorithm.
Figure 3 represents the flowchart of the proposed approach. HWBO combines the best features of the two algorithms above: GWO’s excellent exploration skills allow for a thorough examination of the whole search space, whereas bat’s high exploitative feature allows for better local search capabilities. The MLP network’s mean square error is used as the fitness function for both BA and GWO, with the intention of lowering this value. Each hybrid algorithm’s iteration consists of one run of a GWO algorithm and an individual run of a BA. The GWO translates to BA as an output of its best three wolves, i.e., α, β, and δ. When the bat population is initialized, three bat posts with the best positions achieved from the GWO are initialized, the rest are randomly initialized. The initialization of three α, β, and δ positions ensures that the whole search area, which was originally lacking in BA, will be covered with a view to finding more optimal solutions [
49].
After that, the BA runs as normal, changing the pulse rate and loudness according to equations, and the Global Best solution is revised if it has changed. The α wolf’s position is reset to the Global Best outcome from the preceding iteration for the next iteration, and the process begins. Other hybrid algorithm methods were also checked by passing either α or both α and β to BA, while retaining the rest of the configuration the same. When all three, α, β, and δ, were used and moved on to BA, the best results were achieved. Based on these approximations and idealization, the basic steps of the BGWAN can be summarized as the pseudo-code shown in
Figure 4.
3. Results
In this paper, a novel hybrid computational intelligence approach for predicting coal consumption in Iran is coded with MATLAB 2019 software. Data on Iran’s population, GDP, import, export, and coal consumption were collected during the years 1981–2019 [
50]. The input parameters of the BGWAN included population, GDP, import, export, and coal consumption were considered as the output parameter. The data on these parameters were divided into training and testing. Of these data, 70% were used for training, 30% of data for validation and testing. To estimate coal consumption in Iran, it is necessary to normalize the data in the first step. Equation (16) was used to normalize the data:
where
shows the normalized data and
represents the original data value.
The performance of the BGWAN method is evaluated with mean squared error (MSE), mean absolute error (MAE), root mean squared error (RMSE), error standard deviation (STD), and correlation coefficient (
) between the output of the BGWAN and the actual dataset [
46,
51,
52]. These errors are specified in the forms of Equations (17)–(21).
Figure 5,
Figure 6 and
Figure 7 indicate the best Validation Performance Graph and regression plot between actual and predicted data in the BGWAN method.
Table 1 and
Figure 8 show the performance evaluation of BGWAN outputs.
Figure 9 and
Table 2 for the modelling and the testing data show the performance of the BGWAN method.
Table 3 indicates a comparison of the different models introduced in the introduction and present study.
4. Conclusions
A hybrid BGWAN based on the bat algorithm and grey wolf optimization with an artificial neural network is proposed in this study for enhancing the Iran Coal Consumption via investigating the population, GDP, import, export, and coal consumption. Using error standard deviation (STD), mean absolute error (MAE), mean squared error (MSE), root mean squared error (RMSE), and correlation coefficient (R^2) between the actual dataset and the BGWAN output, the BGWAN technique’s performance can be evaluated. Using the successful application of the suggested approach, the Iran Coal Consumption was estimated. According to
Table 3, the empirical results of Iran’s data exhibit that the BGWAN method accuracy was more precise than the other methods. Hence, the findings proved that the recommended model was an appropriate tool for effective coal consumption prediction in Iran. It will provide a level playing field for checking how the energy policy authority impacts on the structure of Iran’s energy with high economic interventionism by the government.
The BGWAN success in such a study suggests that it may be applied as a practical instrument for economic analysis in various areas, such as the energy system designs with more theoretical specification complexity. The Iran Coal Consumption prediction approach proposed in this work indicates advantages BGWAN, compared to other mathematical programming models for the easy and simple modelling of linear and nonlinear dependencies between variables, merely from data observed here.
It is also possible to investigate the Iran Coal Consumption forecasting by neural networks or new metaheuristics, such as simulated annealing, harmony search, etc. Comparisons can be made between the results of different approaches and the BGWAN technique. There is a need for more research focused on comparing methods described here with other presentation tools. Moreover, forecasting the Iran Coal Consumption can be studied by krill herd optimization algorithm, electro-magnetism mechanism algorithm, and other intelligent optimization approaches. We can compare the results of applying different methods with BGWAN. According to the proposed model’s promising results, it is recommended that future studies apply it to other areas, such as solar radiation and biogas production.


 ,
, 


