Article

Applying Remotely Sensed Environmental Information to Model Mosquito Populations

by
Maria Kofidou
1,
Michael de Courcy Williams
2,
Andreas Nearchou
2,
Stavroula Veletza
2,
Alexandra Gemitzi
1,* and
Ioannis Karakasiliotis
2,*
1
Department of Environmental Engineering, Democritus University of Thrace, 67100 Xanthi, Greece
2
Laboratory of Biology, Department of Medicine, Democritus University of Thrace, 68100 Alexandroupolis, Greece
*
Authors to whom correspondence should be addressed.
Sustainability 2021, 13(14), 7655; https://doi.org/10.3390/su13147655
Submission received: 9 June 2021 / Revised: 2 July 2021 / Accepted: 4 July 2021 / Published: 8 July 2021
(This article belongs to the Special Issue Challenges in Environmental Geology and Hydrology)

Abstract

:
Vector borne diseases have been related to various environmental parameters and environmental changes like climate change, which impact their propagation in time and space. Remote sensing data have been used widely for monitoring environmental conditions and changes. We hypothesized that changes in various environmental parameters may be reflected in changes in mosquito population size, thus impacting the temporal and spatial patterns of vector diseases. The aim of this study is to analyze the effect of environmental variables on mosquito populations using the remotely sensed Normalized Difference Vegetation Index (NDVI) and Land Surface Temperature (LST) obtained from Landsat 8, along with other factors, such as altitude and water covered areas surrounding the examined locations. Therefore, a Multilayer Perceptron (MLP) Artificial Neural Network (ANN) model was developed and tested for its ability to predict mosquito populations. The model was applied in NE Greece using mosquito population data from 17 locations where mosquito traps were placed from June to October 2019. All performance metrics indicated a high predictive ability of the model. LST was proved to be the factor with the highest relative importance in the prediction of mosquito populations, whereas the developed model can predict mosquito populations 13 days ahead to allow a substantial window for appropriate control measures.

1. Introduction

Mosquito control programs have been applied widely in many countries with the aim of reducing the incidence and prevalence of infections and diseases. Those programs focus on the vectors to reduce their longevity, population density, human contact, and the intensity of local malaria disease transmission at a community level. Changes in environmental conditions are strongly linked to the distribution, transmission, intensity, and seasonality of cases of mosquito vectored diseases such as malaria [1]. Land use changes, including deforestation, agriculture, road construction, mining, and anthropogenic landscape fragmentation affect the features of the environment, such as water quality and vegetation coverage, factors that can in their turn affect the existence of mosquitoes. Moreover, anthropogenic landscape changes can decrease mosquito biodiversity and drive the proliferation of vectors of diseases, such as malaria [2].
Previous works have incorporated Geographical Information Systems (GIS) and satellite remote sensing products to investigate environmental changes in relation to malaria epidemiology in many areas around the world. For example, Trájer [3] developed a model that predicts the most prominent increases in areas suitable for malaria in Greece. Parselia et al. [4] used satellite-derived Earth observation data in the epidemiological modeling of malaria, Dengue and West Nile Virus. Kazansky et al. [5] described use of a satellite-based environmental model to predict malaria risk and examine the barriers and opportunities for implementing Malaria Early Warning Systems enabled by satellite remote sensing. Dantur et al. [6] examined how satellite NDVI and LST indices and other climatic factors impact the abundance of mosquitoes in a former malaria-affected area in northwest Argentina.
Chuang et al. [7] demonstrate that environmental metrics derived from satellite passive microwave radiometry are suitable for predicting mosquito population dynamics, and that can improve the effectiveness of mosquito-borne-disease early warning systems. Moreover, Pergantas et al. [8] mentioned that malaria constitutes an important cause of human mortality and that even in countries like Greece where malaria had disappeared, a resurgence after 2009 is observed. In that work, a model was developed that integrates entomological, geographical, social and environmental evidence in order to guide mosquito control efforts and apply this framework to data from an entomological survey done in Central Greece. Their results indicated that malaria transmission risk in Greece is potentially substantial and that specific districts such as seaside areas, lakesides and rice field regions appear to represent potential malaria hotspots in central Greece.
In relation to the mosquitoes, it is well known that factors such as rainfall, temperature, and humidity influence malaria transmission because they affect the development and survival of both the mosquitoes and the parasites that they harbor [9]. Moreover, Richardson et al. [10] underlined that natural water sources, such as ponds or water-holding containers, are preferred as larval developmental sites and are potential mosquito breeding areas. Although there are some attempts to apply remote sensing and machine learning techniques to model mosquito distribution and abundance, recent works indicate the scarcity of works related to the application of remote sensing and machine learning in epidemiologic studies [11]. In their work, Scavuzzo et al. [11] used Moderate Resolution Imaging Spectroradiometer (MODIS)-derived NDVI, LST and Normalized Difference Water Index (NDWI) data along with TRMM precipitation to model mosquito populations in northwest Argentina using machine learning techniques. In the present work, high resolution remotely sensed LST and NDVI data were used to develop a predictive model for the spatial and temporal distribution of mosquito populations. Therefore, NDVI and LST remotely sensed data acquired from Landsat 8 at a spatial resolution of 30 m and at 16-day temporal resolution were used to develop and test an MLP ANN for the prediction of mosquito populations. The model was trained and tested with a data set comprising mosquito populations in the prefectures of Xanthi and Drama (NE Greece) from July to October 2019.

2. Materials and Methods

2.1. Study Area Description

The study area is located in NE Greece and focuses on the prefectures of Xanthi and Drama. The region has diverse topography, including coastal, mountainous and lowland areas. The broader area is mainly occupied by agricultural fields, with main crops being cotton, wheat, sunflower, horticulture (tomato, corn, squashes, etc.) and tobacco.
Monitoring of mosquito populations was carried out at seventeen locations in Xanthi and Drama (Figure 1).
Different land cover types are observed within the study area. For example, the coastal sites of Ah Giannh Beach and Porto Lagos are located within a coastal wetland system. Erasmio, Maggana and Abdhra are locations close to the coastal zone, and they demonstrate intense agricultural activity. Paranesti corresponds to a riparian area, whereas Kimmeria, Mavrobatos and Evmoiro are found in semi-mountainous suburban areas. Built-up areas are the city of Drama and the industrial area of Drama. Kokkinogeia, Kalampaki, Agios Athanasios, Diomhdeia, Kipseli and Evripedo are typical rural settlements surrounded by agricultural land. Moreover, due to their mountainous terrain, some locations exhibited sparse patches of agriculture.
According to Climate Atlas of the Hellenic National Meteorological Service [12], Greece is characterized by a diverse terrain which divides the country into different climatic zones. Thus, the main climatic zones of the study area range from hot-summer Mediterranean climate in the coastal zones, transforming to more temperate climate types in the north.

2.2. Description of the Dataset

2.2.1. Experimental Setting

Mosquito Sampling and Identification

Adult mosquitoes were collected from the sample stations using Centers for Disease Control (CDC) light traps baited with CO2 [13]. Traps were placed overnight and the next morning the samples were transported immediately to the laboratory over a bed of dry ice. Mosquito samples were stored at −80 °C for preservation and prior to any DNA extraction. Samples were examined over a bed of crushed ice at all times to maintain their condition, both during sample sorting and in making species identifications. Female mosquitoes were identified using external morphological features with a combination of the keys of [14,15] and the online resource MosKeyTool [16]. Representatives of the Anopheles maculipennis group cannot be distinguished morphologically among adult females [16], and specimens were identified with Cytochrome oxidase subunit I (COI) barcoding from an excised leg. Species nomenclature follows [17] and generic abbreviations follow [18].

Mosquito DNA Barcoding

Where appropriate, DNA barcoding was done using standard COI PCR and Sanger Sequencing. Mosquitoes were homogenized and total DNA was extracted as described previously [19]. Universal primers COI_F (5 GGATTTGGAAATTGATTAGTTCCTT 3) and COI_R (5 AAAAATTTTAATTCCAGTTGGAACAGC 3) were used to amplify a 600 bp PCR product. The PCR reaction mixture contained 0.25x GC buffer, 1.5 mM MgCl2, 1 mM dNTPs mix, 0.2 μM of each primer and 1.5 U KAPA Taq DNA polymerase (Kapa Biosystems). The thermal profile of the PCR included 40 cycles of denaturation at 95 °C for 30 s, annealing at 50 °C for 45 s and elongation at 65 °C for 1 min, and a final elongation step at 65 °C for 7 min. PCR products were purified using the NucleoSpin Gel and PCR Clean-up purification kit (Macherey-Nagel). Sanger Sequencing was performed on the PCR product and analyzed using the Barcode of Life Data System V4 platform [20], by our group in NCBI GenBank Database (https://www.ncbi.nlm.nih.gov/nucleotide/) with accession numbers: MT993476, MT993477, MT993478, MW008765, MT993491, MT993482, MT993495, MT993497, MT993484, MT993490, MT993496, MW008764, MT993487, MT993488, MT993498, MT993480, MT993486, MT993483, MT993492, MT993493, MT993494, MT993481, MT993489, MT993485, MT993479, MT993499 (accessed on 28 May 2021)

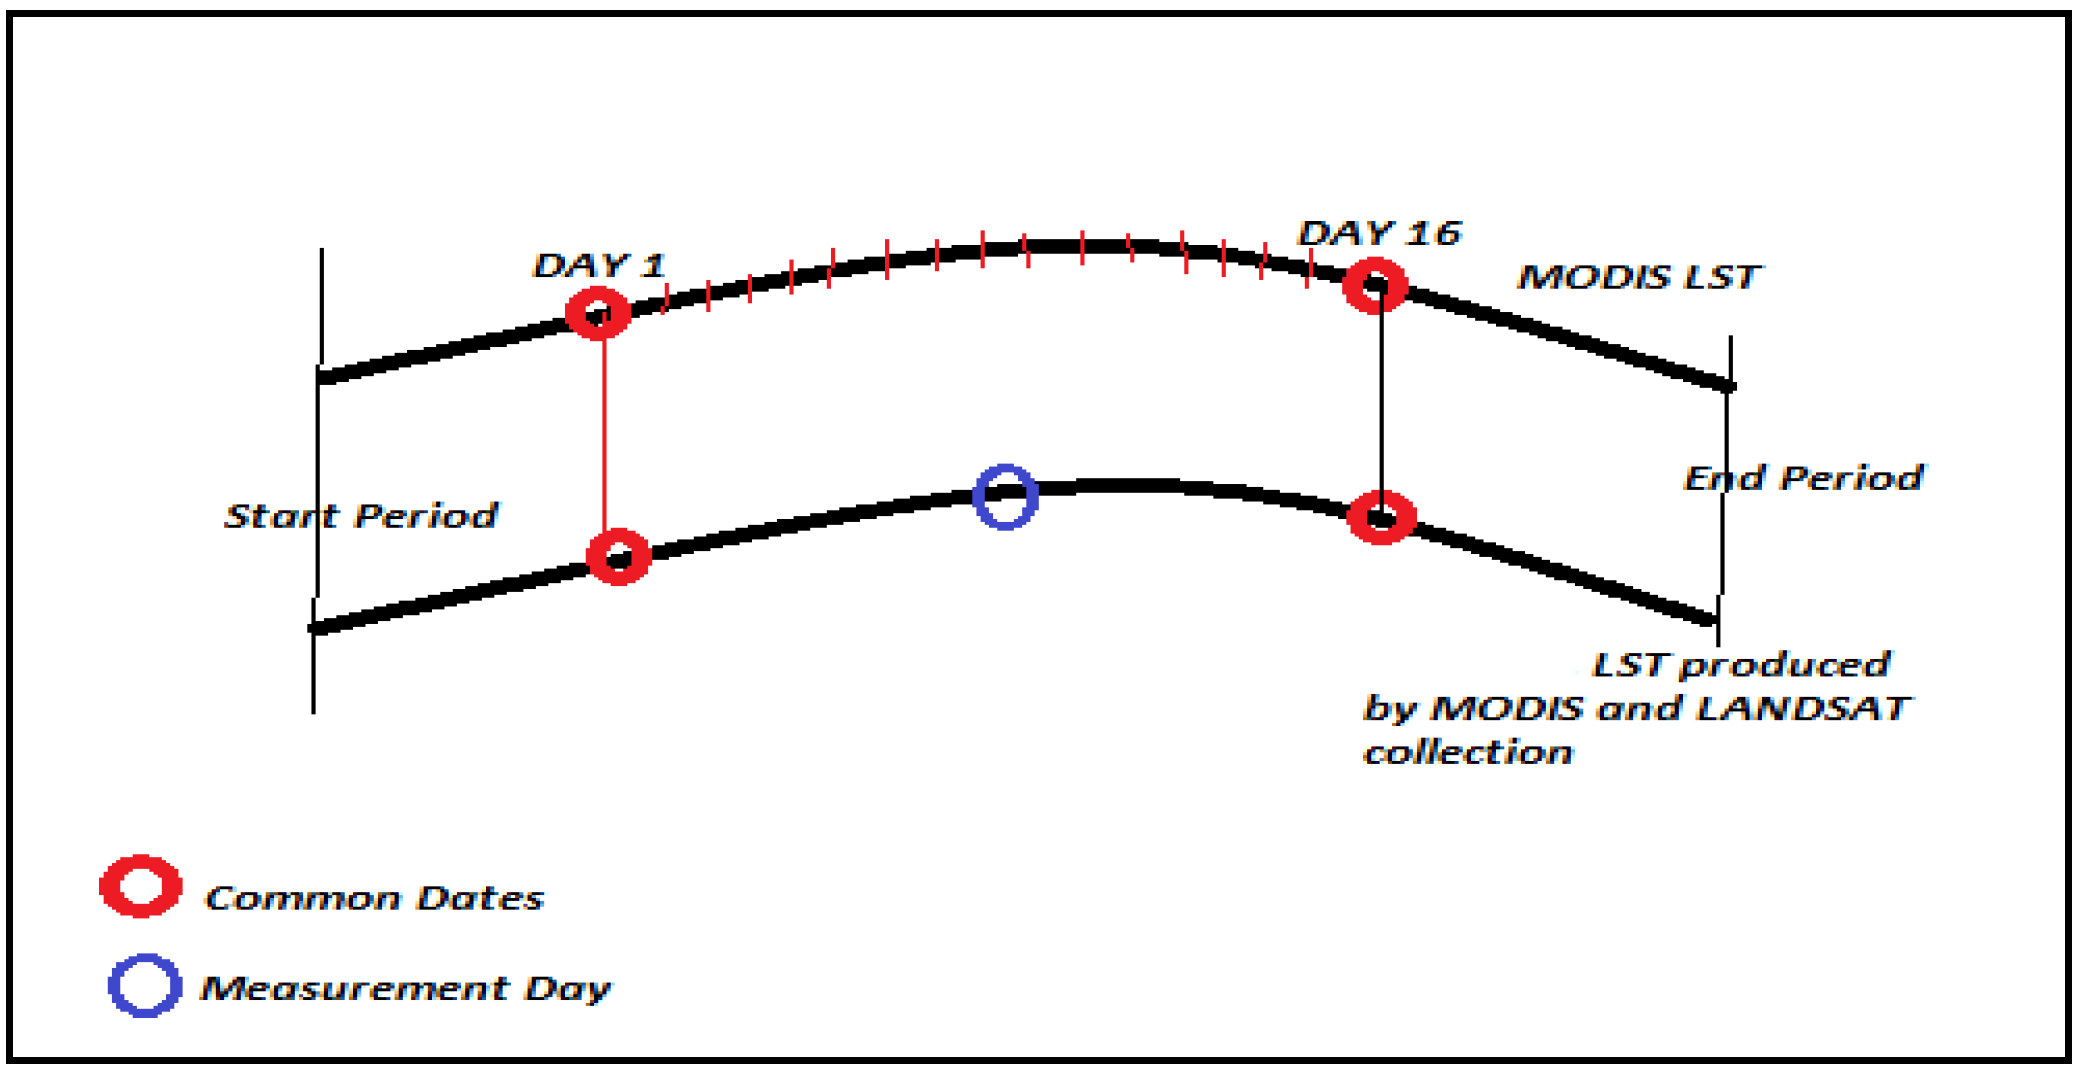
2.2.2. Remotely Sensed Data and Environmental Datasets

NDVI is an indicator of the photosynthetic activity of plants. NDVI is used as a proxy for suitable conditions of mosquito development because it refers to spatial and temporal dynamics of different vegetation types that occur naturally around the areas where immature stages are found [1].
Moreover, LST is an important climate variable for many environmental studies because it is related to the surface energy balance and integrated thermal state of the atmosphere. It is widely used in a variety of scientific studies, such as in the estimation of evapotranspiration and soil moisture, the assessment of the impact of climate change, the hydrological conditions and cycle, among many other applications [21].
According to [22], mosquitoes can develop in freshwater, polluted water, household waste, etc. In that work it was shown that rainwater is the most preferred medium for mosquitoes where their eggs hatched in an average time of 6 days. The second most preferable place for egg-laying is regional water bodies (preferred over domestic waste water), with an average hatching rate of 9 days, whereas in household waste-water, the eggs hatch in an average of 14 days. Moreover, in water contaminated with oil, the eggs hatch in 10–13 days. Additionally, according to [23] the mean larval development time varies among several species of mosquitoes. For example, the larval developmental time for An. coluzzii is 11.1 ± 0.02 days, and for An. gambiae it is 10.6 ± 0.02 days. According to the Department of Epidemiological Surveillance and Intervention, Center for Disease Control and Prevention of Greece (KEELPNO) [24], the life cycle of a larva varies from 7 to 14 days in the water until it becomes a mosquito. Therefore, in our work we evaluated the time series of NDVI and LST in various lags between 9–14 days to find the time lags with the highest correlation to observed mosquito data.
To develop a model that can predict the effects of remotely sensed environmental variables on the abundance of mosquitoes, NDVI and LST indices where obtained from satellite collections for period of 29 June 2019 to 29 September 2019. Unlike previous works, such as [1,25,26], that mainly use moderate resolution satellite products (e.g., MODIS products), we used high resolution remotely sensed LST and NDVI from Landsat 8 OLI collection. This product has a spatial resolution of 30 m, and is available every 16 days.
To obtain daily values of LST and NDVI two approaches were adopted. It was assumed that NDVI does not change dramatically during the gaps between observational periods (e.g., 16 days) because vegetation grows gradually. Within the study period (June–October), NDVI was produced with a linear interpolation between observational dates, and therefore NDVI values were retrieved specifically for those dates when mosquito samples were taken and counted. Concerning Landsat 8 LST, no ready-to-use product exists; therefore, it was computed using the methodology described in [27,28]. Due to the fact that the Landsat 8 acquisitions were not available for the desirable days, MODIS daytime LST (MOD11A1v006 product) at 1 km spatial resolution was used to obtain information on the temporal trend of LST between the Landsat 8 acquisition dates (Figure 2). Then, the computed trends from the MODIS LST time series were transferred into the Landsat 8 derived LST. In that way, the daily temporal resolution of MODIS LST was incorporated within the Landsat 8 derived LST, while the spatial resolution of 30 m of the Landsat 8 LST was preserved.
The altitude of each location is another environmental factor that was used in this study. The altitude of each trap-location was measured by using a TOPCON double frequency GPS. The maximum altitude is 153 m and the minimum is 2 m.
The influence of the amount of area covered by water surrounding each sample was incorporated in the study area by computing the water covered area around mosquito monitoring points. Specific districts such as the seaside, lake sides and regions with rice fields represent potential hotspots for mosquito vectors of diseases, such as malaria, in central Greece, making an index of water area a significant metric for this study. The aim is to find the total area of water around each location of interest. Here, we computed the area of water within each 5 km × 5 km window surrounding the sampling locations. The Morawitz et al. in [29] supported that NDVI values <0 represent surfaces that contain no chlorophyll, and Jeevalakshmi et al. [30] showed that the NDVI value ranging from −0.0175 to −0.328 represent water bodies, the areas with water in this study were distinguished from the land area using NDVI values ≤ 0. The study area is mainly covered by cultivated land, there is no snow during summertime, and therefore, using this specific NDVI threshold to distinguish water covered areas is a reasonable approach. However, if a longer time period is to be used for model development, the dynamic character of water-covered areas should be considered, and water areas should be introduced in the model as a time series. Additionally, in snow-covered or areas with significant portions of barren or bare soils, screening water areas using a simple NDVI threshold may introduce a source of uncertainty. In such cases, it is recommended to apply mapping techniques to screen water areas, like those described in [31,32]. After a water mask layer was prepared, the water area surrounding the monitoring point was computed.
Finally, as mosquito populations are known to change over time, the Julian Date was also used as a predictive parameter in our model. Summary statistics of the data set can be found Table 1. The whole data set is provided in the Supplementary Material S1 accompanying the present work.

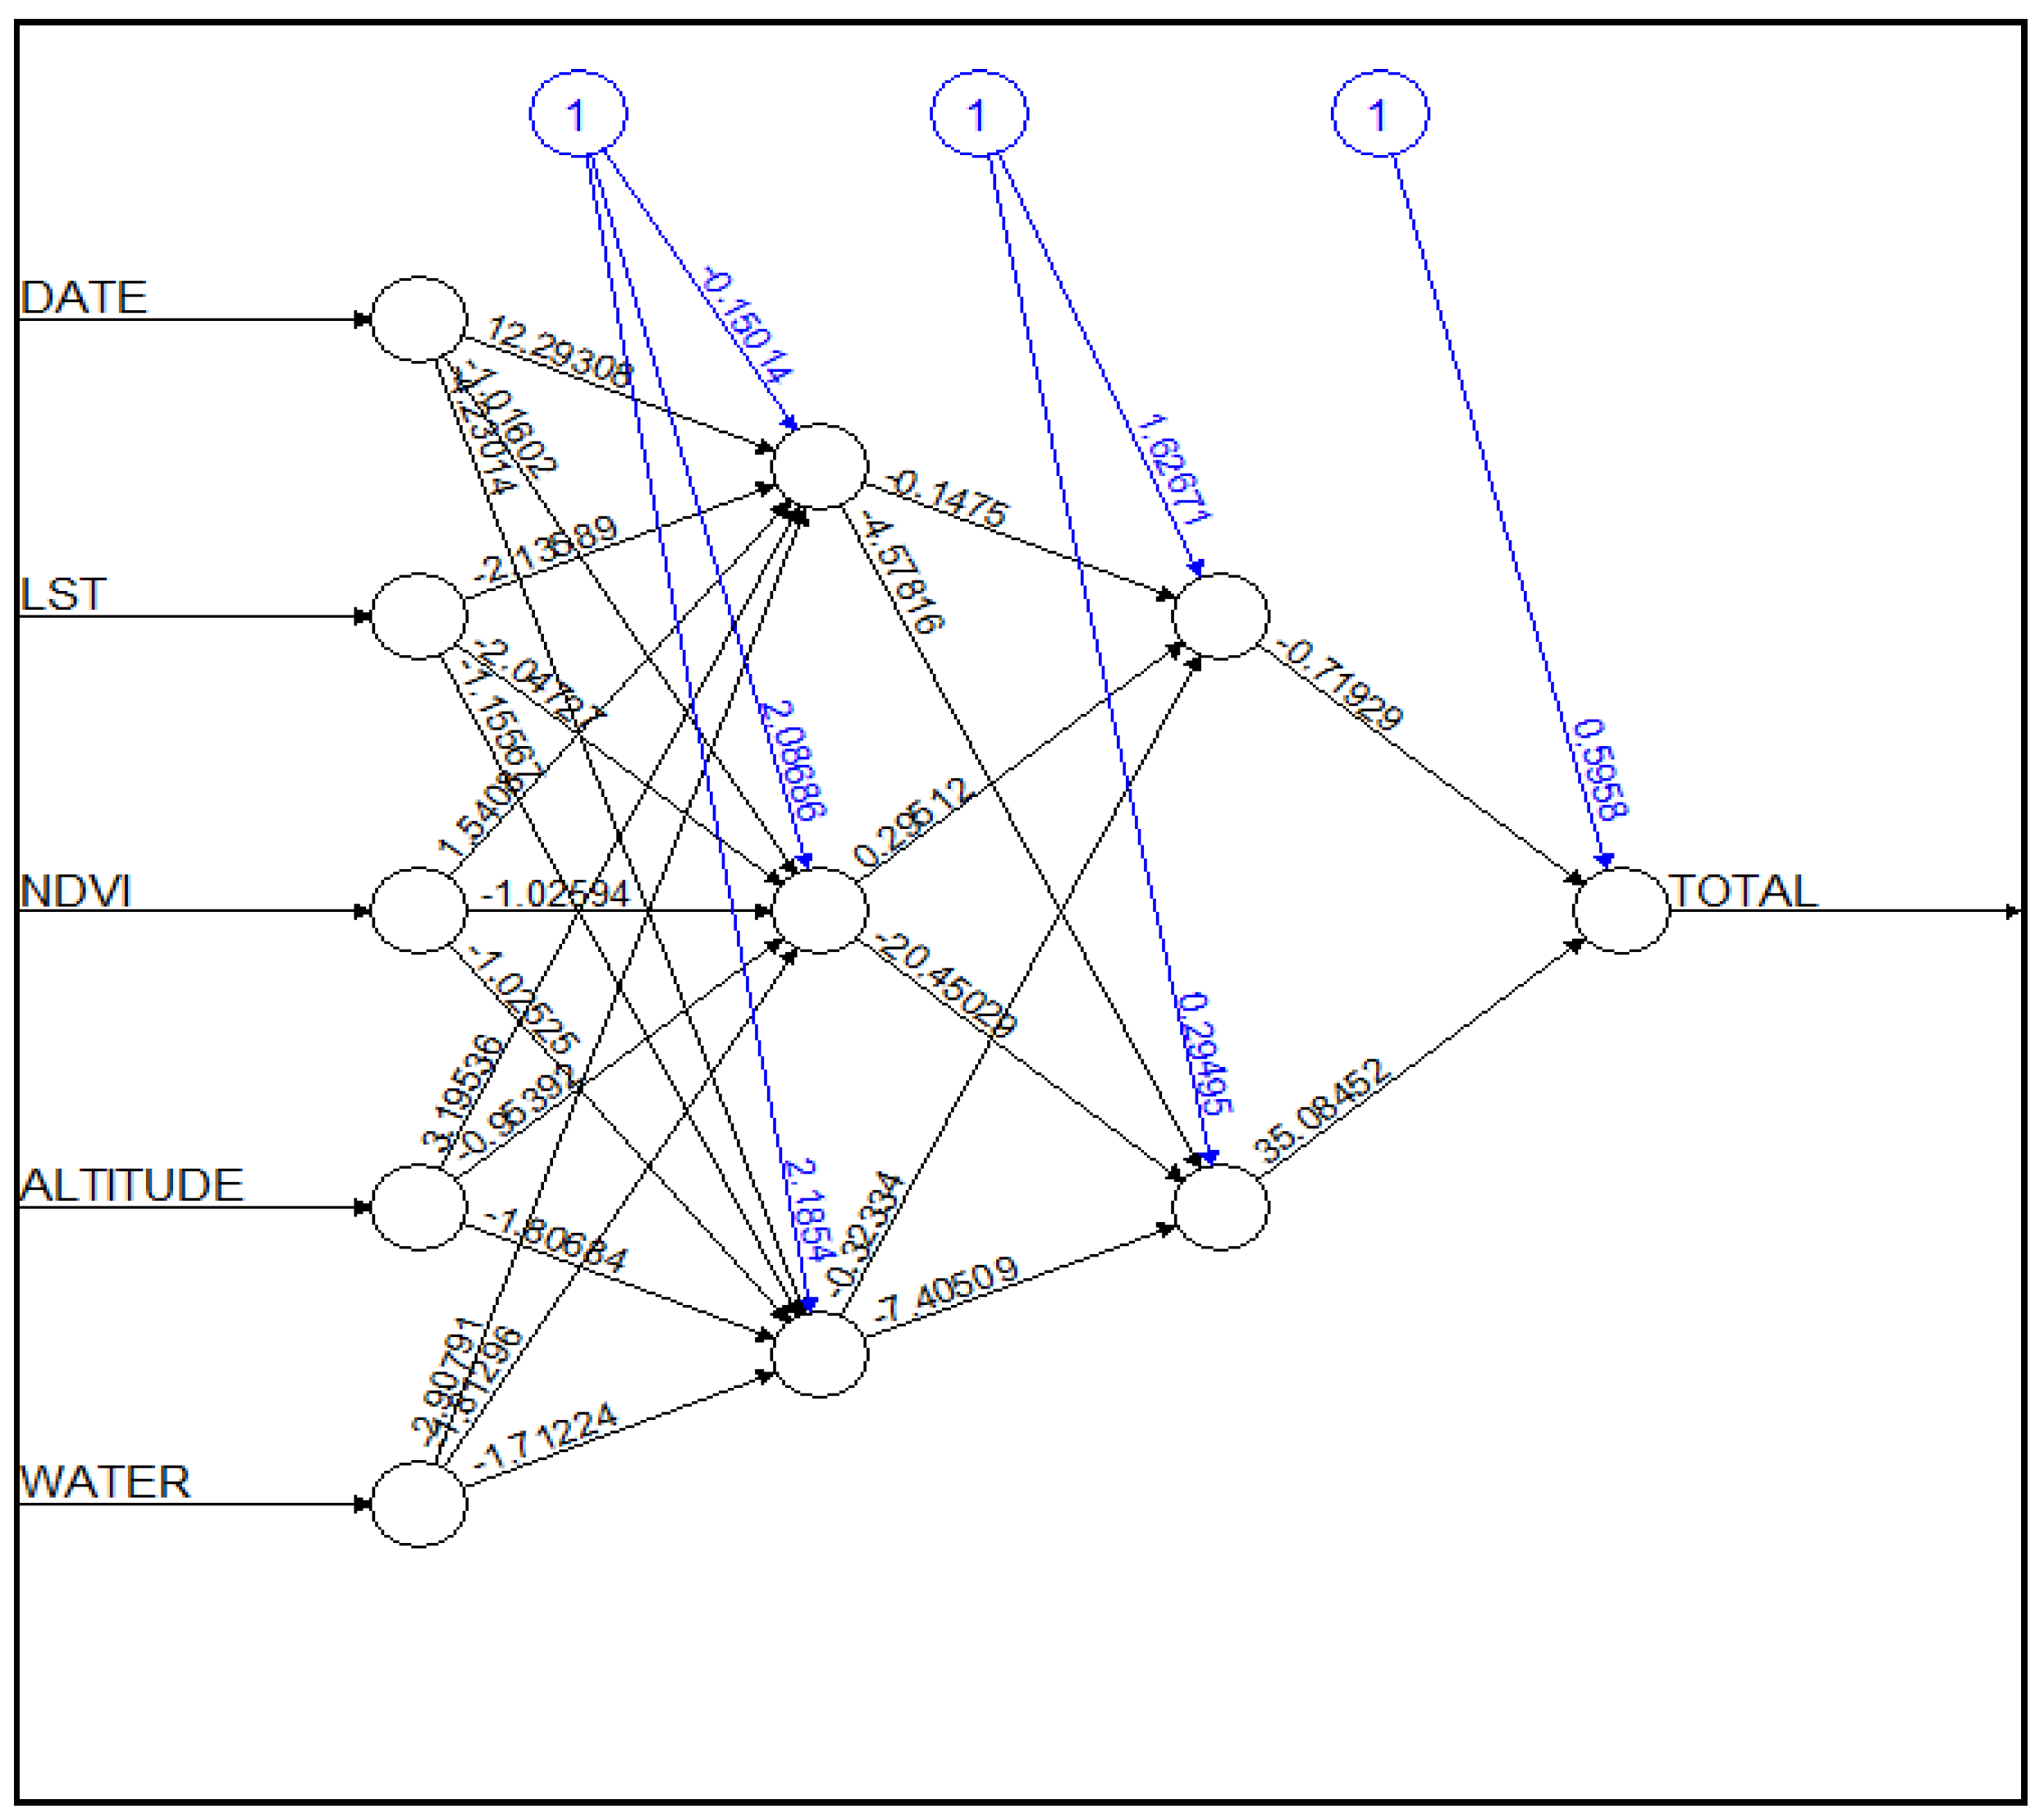
2.3. Model Development

Artificial neural networks (ANNs) models belong to the broader category of machine learning models. They try to mimic how neurons transmit signals within the human brain, aiming to enable computers to learn to perform certain tasks by analyzing training data sets. ANNs are also referred to as deep learning models, a term which is used to describe it as an approach to artificial intelligence. ANNs have been widely used in speech and image recognition [33,34] but also in various environmental and health studies [11,35,36,37,38,39].
In our work, we developed, trained and applied a Multi-Layer Perceptron (MLP) ANN to forecast mosquito populations. The data set used comprised the 17 test sites in NE Greece (Figure 1) described in Section 2.2. A usual problem encountered in modeling and prediction studies is the case of grouped data. In the present work there are 17 different groups of mosquito populations corresponding to specific sites. Analysis of such data sets often requires the examination of the correlation within each distinct group.
The complexity of the data set, with no clear overall correlation of mosquito populations with the NDVI and LST parameters, combined with the nonlinearity of the relationship between mosquito populations and altitude or water area, makes any attempt to model the data quite challenging. In such cases, where complex environmental problems are concerned, ANNs have proved to be robust modeling tools [11,38,39]. An ANN computes a target variable using a set of input parameters x and a complex nonlinear mathematical function f together with the associated noise ε:
y = f(x) + ε
In the present work, the MLP ANN architecture was initially evaluated by altering the number of hidden layers and the hidden layers nodes (or neurons) to define the optimum architecture that results in the best performance metrics [40].
Let M be the number of input variables, then each node in the hidden layer receives as input a weighted sum of the input variables signals (ak). In the case of K nodes in the hidden layer, the input signal to each hidden layer node is defined by the following equation [39]:
a k = i = 1 M w k i ( 1 ) x i + w k 0 ( 1 ) ,   k = 1 , ,   K
In Equation (2), w k i ( 1 ) stands for the unknown weight between the Kth node in the hidden layer and the ith input variable, in the first layer (superscript), and w k 0 ( 1 ) is the unknown bias term.
A linear transfer function is then applied to transmit hidden layer signals to the next layer [35]:
y j = k = 1 K w j k ( 2 ) o k + w j 0 ( 2 )
In Equation (3), the term   y j is the node of the receiving layer, and w j k ( 2 ) and w j 0 ( 2 ) the weights and the bias term respectively. The number of output nodes will be either one in the case when the network is used as a regression process, or more than one when the ANN is used as a classifier.
The process for developing and testing the MLP ANN is distinguished in two phases. The first one is the testing phase where the ANN is exposed to a portion, usually 50% to 75% of the data set to determine an error factor. During testing the ANN learns the underlying patterns within the training data set. The MLP ANN then back propagates the error and adjusts the synapse weights so as to achieve a predefined accuracy. The performance of the model is then evaluated using the testing data set through the following performance metrics [35,39]:
Mean Squared Error (MSE) which measures the distance between observed O i and predicted values P i in the testing data set of size N:
M S E = 1 N i = 1 N ( P i O i ) 2
MSE measures the global performance of a predictive model.
Scaled Root Mean Squared Error ( R * ):
R * = R M S E σ ο =       1 N i = 1 N ( P i O i ) 2 σ o
In the above equation σ o is the standard deviation of observed values.
Nash–Sutcliffe model efficiency (NSE) which ranges from −∞ to 1, [41] which measures the predictive ability of a model relative to the mean of observations:
N S E = 1 i = 1 N ( O i P i ) 2 i = 1 N ( O i O ¯ ) 2
where O ¯ stands for the mean value of observations. In the present work the training data set was fixed to 75% of the whole data set and was randomly selected. The testing data set comprises the remaining 25% of the data set. According to previous work [39,42] a very good performance of a predictive model is found when NSE > 0.75 and R* < 0.50. To improve the speed of convergence in the model, the input data set was scaled linearly, to standardize the range from 0–1, prior to use in the MLP ANN [35].
Over-training of the ANN models can result in a very high performance in the training data set and a very low performance in the testing phase, usually attributed to the complexity and heterogeneity of the data set [43]. To generalize our ANN model, we performed a k-fold cross validation exercise with k set to 100, thus repeating the training, testing and calculation of the predicted error by 100 times. Then, the performance metrics were reported in terms of mean of the 100 values resulted from the cross validation. The computational process was performed using R, an open platform for statistical computing [44] and its Neural net tool [45].
To investigate the relative importance of various input variables in the model, a methodology known as the connection weight technique was applied [39,46]. Therefore, the connection or synapse weights in the input-hidden and hidden-output layers of the ANN are used. If M is the number of input variables and K is the number of hidden layer nodes, then IH, a K × M matrix is calculated with the input-hidden layer weights. Then, HO, a vector of K length is computed with the hidden-output layers weights. Each column of the IH matrix is multiplied element-wise with HO, giving a product matrix PK×M. The importance vector IV of length K is then calculated by summing across the rows of P. The relative importance of each input variable is evaluated from IV as follows:
  r e l i = | I V i | i = 1 K | I V i |

3. Results

3.1. Parameter Estimation
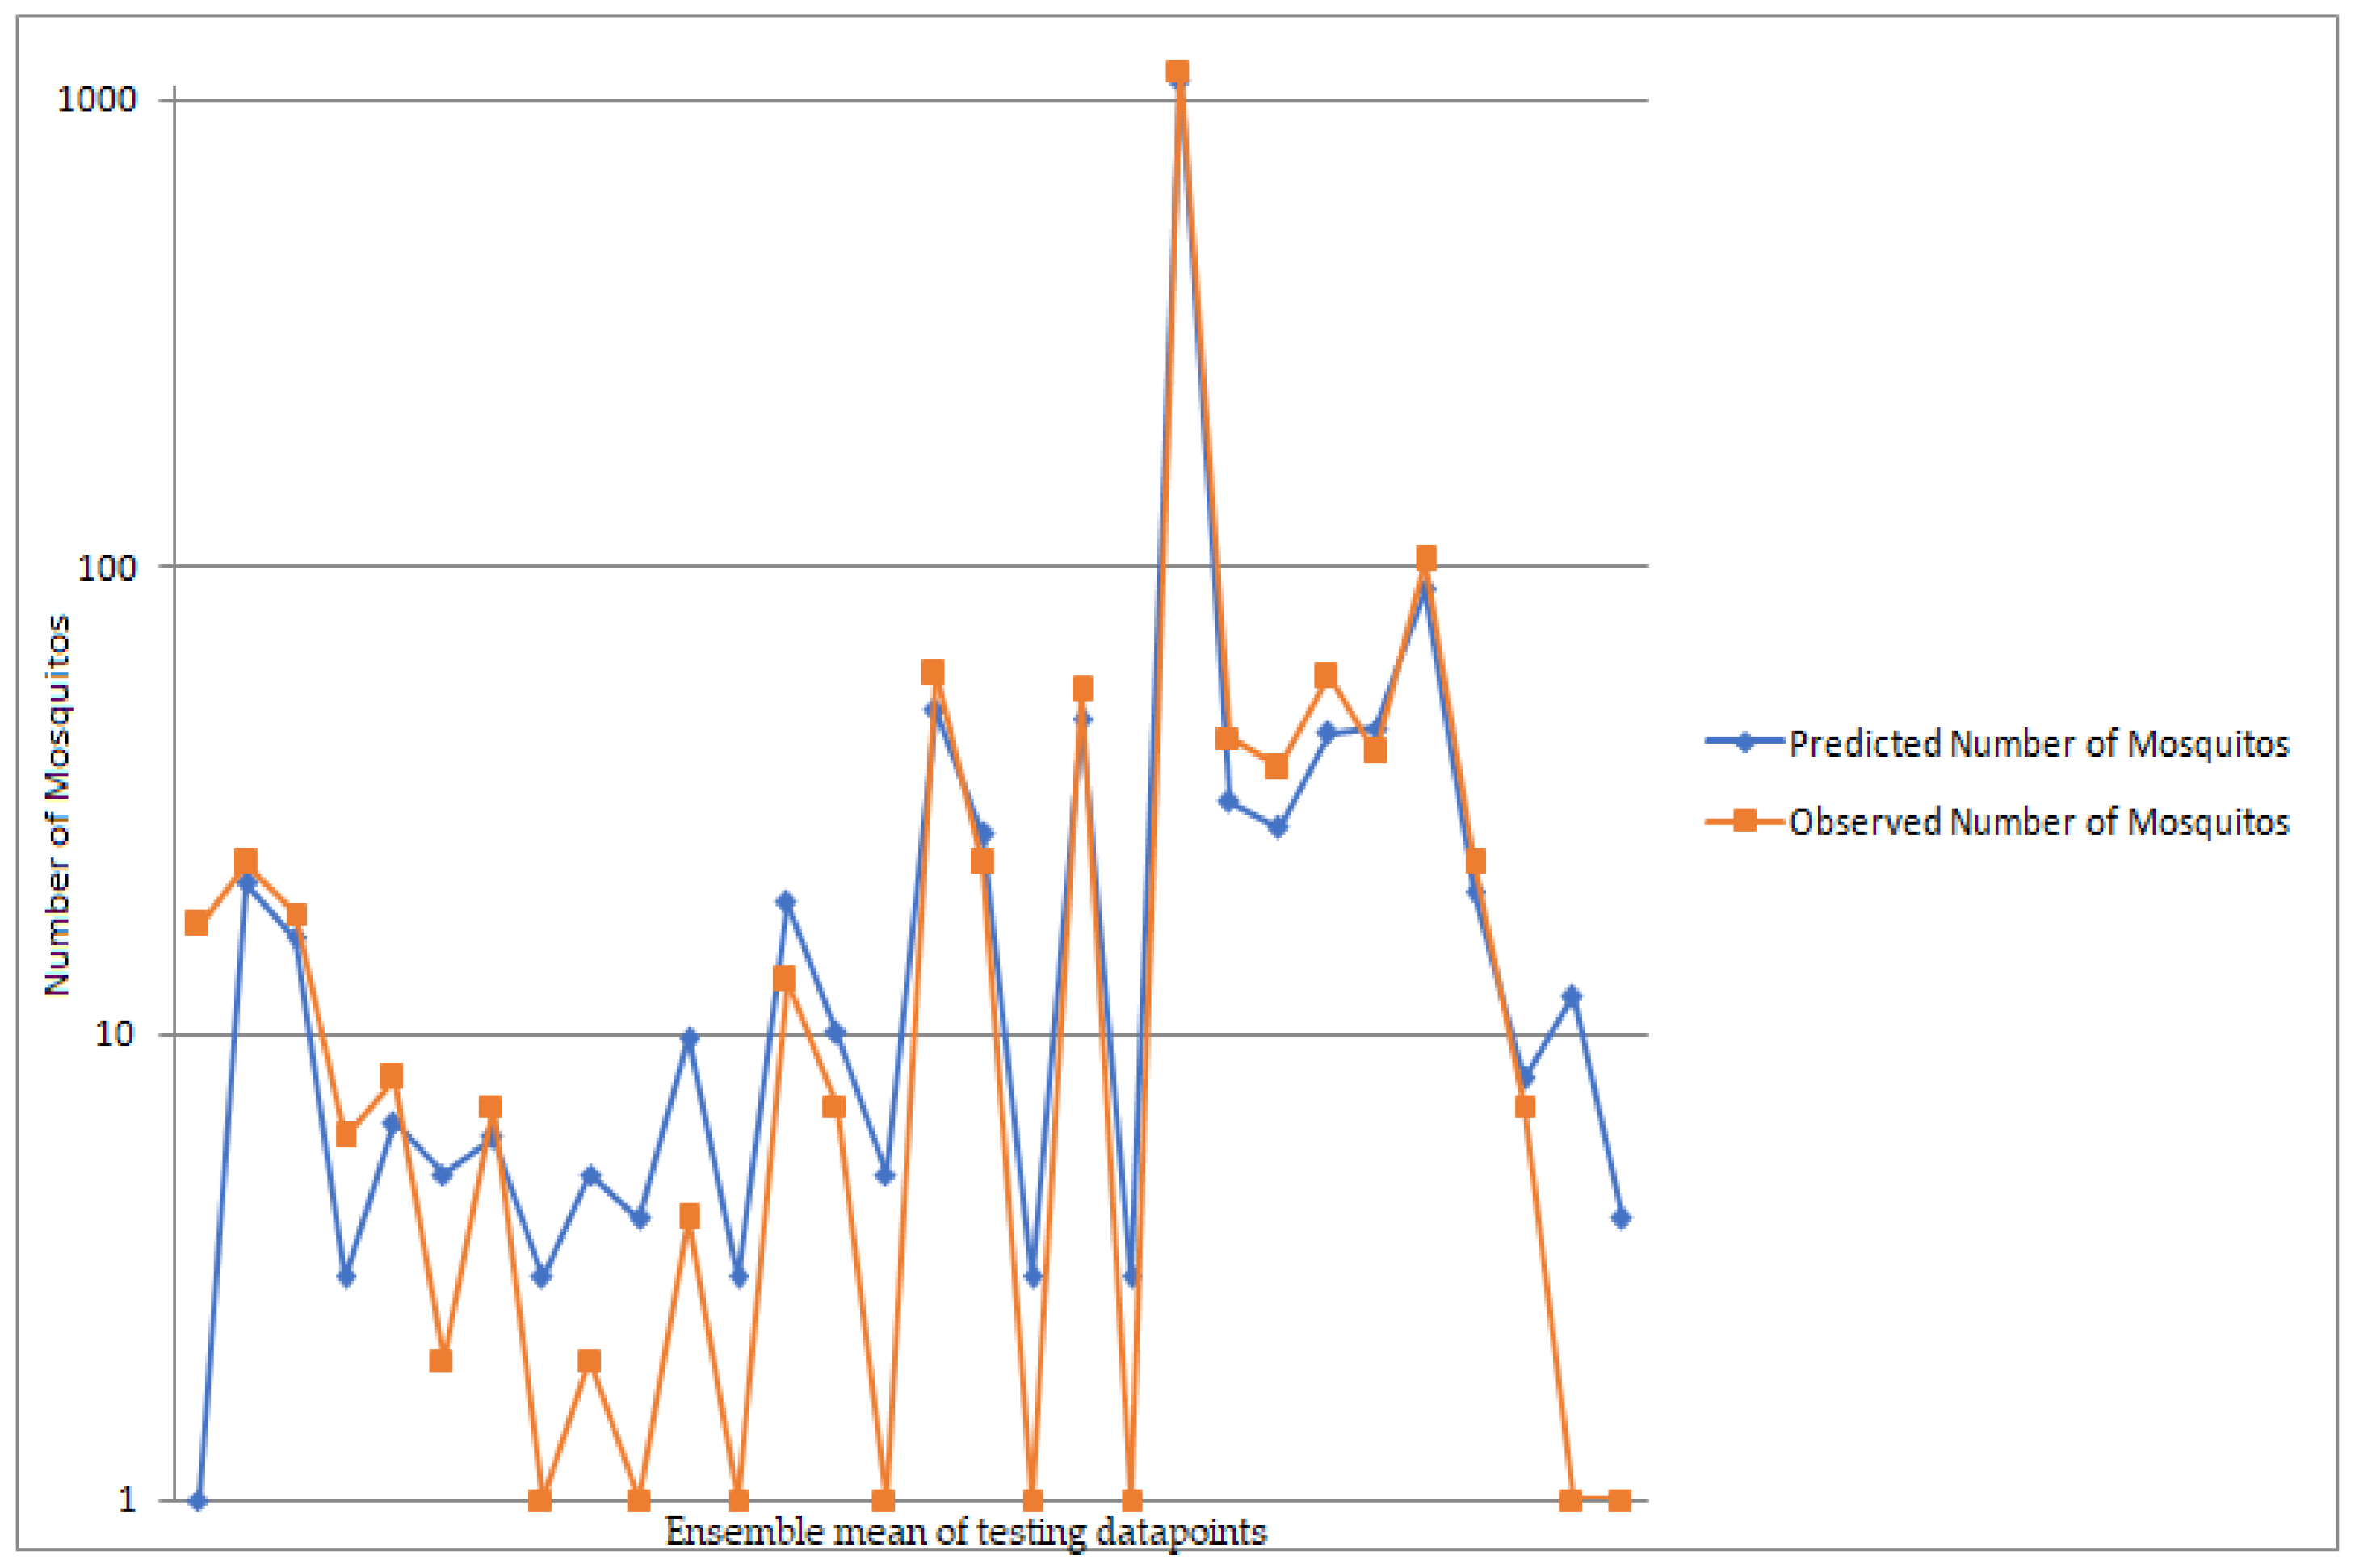
A total number of 7653 mosquitoes were collected from all traps. Mosquitoes were identified morphologically using established keys, while in cases where species share the same morphological features, DNA barcoding identification was applied. COI barcodes of the mosquitoes identified in this study were the same as those previously deposited by our group in NCBI GenBank Database. Porto Lagos, Ah Giannh and Maggana in Prefecture of Xanthi were the sites with most mosquitoes corresponding to 62.17% of the mosquitoes in the data set, indicating the high spatial variability of mosquito populations in various examined locations. Figure 3 shows the distribution of mosquitoes in the monitoring stations of the study area.
To highlight specific environmental features that impact mosquito populations in time and space, different environmental parameters were evaluated against mosquito populations. Time lags from 9 to 14 days prior to observation date were evaluated for LST and NDVI time series data, and a time lag of 13 days was found to demonstrate the highest correlation to the mosquito populations subsequently, graphs of all input variables with the mean mosquito populations in the various classes of the independent variables were developed. Classes provided on the x-axis of Figure 4a–e are based on the quartiles of each independent variable. In can be seen from Figure 4a that there is an abrupt increase in mean number of mosquitoes with an increase in the water bodies areas surrounding observation points. The opposite is observed in Figure 4b, where an abrupt drop in the number of observed mosquitoes is found with an increase in altitude. Furthermore, an increase in mosquitoes is observed with an increase in LST (Figure 4c), whereas the NDVI class of 0.27–0.39 seems to favor the development of mosquito abundance (Figure 4d). Concerning development of mosquito populations over time, the highest values are observed during June, decreasing then until late August, followed by a slight increase thereafter (Figure 4e)
A correlation analysis was done to examine the relationships between the mosquito time series data and the time-variant environmental variable of LST and NDVI. Table 2 presents the overall and the within-group correlations coefficients of mosquito observations with LST and NDVI. The overall correlation coefficients are weak for both examined variables, implying the absence of a clear relationship. Because the data sets are comprised of group observations corresponding to different locations, the within-group correlation coefficients were computed and are presented on Table 2. Within-group correlation coefficients of LST and NDVI in various time lags are provided as Supplementary Material S2. The analysis of within group correlation indicated high correlation coefficients (but not always statistically significant at the level of p < 0.05) between mosquito populations and both LST and NDVI with highest values at a lag of 13 days. This phenomenon is well known and has been described previously in works related to group data [47,48], so it is important to decompose the overall correlation into components that measure the correlation within the groups. This is a special case where the overall correlation coefficient can lead to misleading conclusions regarding the nature of the underlying relationship between two variables. Considering the complex and the heterogeneous nature of the data set shown in Figure 3 and the underlying nonlinear relationships apparent in the data shown in Figure 4, a machine learning model in the form of an MLP Neural Network model seems to offer a viable alternative to traditional regression models.

3.2. Model Results

The optimum model architecture was found to be that with two hidden layers with three and two hidden nodes in the first and second hidden layer respectively. The architecture of the developed model and synapse weights can be seen in Figure 5.
Model performance was reported as the distribution of the performance metrics in the 100-fold cross-validation exercise and also the mean values of the cross-validation. Figure 6a–c illustrates the distribution of the error in the cross-validation process in the form of Box plots. Mean MSE is equal to 739. Figure 6a illustrates the distribution of MSE in the 100-fold cross-validation exercise. Accordingly, the distribution of the scaled RMSE (R*) is found on Figure 6b, with a mean R* of 0.162. Distribution of the NSE is found on Figure 6c, with a mean NSE of 0.83 in the cross-validation process.
The model output is visualized on Figure 7, where the mean output of the 100-fold validation is presented versus the observed values, indicating a satisfactory performance in accordance with the performance metrics demonstrated in Figure 6.
Concerning the analysis of the relative importance of input variables, Figure 8 shows that the parameter with the highest importance in the model is LST with a relative weight of 0.768, with water area being the second most important parameter in the developed model with a relative importance of 0.131. The three remaining variables, Altitude, Julian Date and NDVI share the remaining relative importance and seem to be far less important in the model.
To demonstrate the usefulness of our model, we tested the distribution of West Nile Virus (WNV) incidents in various municipalities within and neighboring the study area, in relation to mean Landsat 8 derived LST in each specified municipality from 1 July to 5 September 5 2019. The reported WNV incidents were both for West Nile Neuro-invasive Disease (WNND) and for non-WNND cases as shown on Figure 9. According to [23,24,49] manifestations of WNV (West Nile Virus) infection range from asymptomatic infection, WNV fever or a West Nile Neuro-invasive Disease (WNND).
The correlation of LST and WNV incidents shown Figure 9 is 0.96 for the WNF with WNND cases and 0.77 for the WNF without WNND cases.

4. Discussion

While in situ observations are scarce and costly to implement, remotely sensed environmental information can be used as an alternative to predict the spatial and temporal patterns for mosquito abundance not only as an environmental indicator, but also because it is related to mosquito vector-borne disease transmission and prevalence. The current analysis produced satisfactory results as evidenced by the performance metrics of the developed model. A demonstration of the usefulness of such an approach is illustrated by comparing WNV disease incidents with the spatial distribution of LST in various municipalities in northeast Greece. Using the developed model, the mosquito populations can be predicted 13 days ahead of present, thus enabling a substantial window where preventative measures for disease outbreaks can be enforced. Our methodology employs freely accessible and open source data and tools. An additional advantage of our methodology is the use of NN models which are nonparametric and are capable of simulating nonlinear relationships, even for highly heterogeneous data sets.
Studies using remote sensing techniques have been conducted previously to link detected larval habitats, or map vector densities and associating climate and environmental parameters, directly to the prevalence of mosquito-borne diseases, such as malaria [26]. In our work, we used environmental information from Landsat 8, also taking advantage of the MODIS high temporal resolution, to predict populations of mosquitoes. Analysis of relative importance of various parameters in the NN model, indicated that LST is by far the parameter with the highest relative importance. In a previous work on the use of a combination of remotely sensed environmental data to model malaria vector densities in West Africa, a negative correlation with MODIS LST was reported [26], which does not agree with the findings of the present work. Other works in northwest Argentina report a positive correlation between LST and specific mosquito species to explain seasonal variation in malaria outbreaks [6]. It is possible that the predictive ability of each environmental variable is site specific but may also depend on the mosquito species found is each study. The fact that LST proves to be the parameter with the highest relative importance does not mean that the rest of parameters are neglected. It simply means that for mosquito populations to grow, LST should be high enough, irrespective of the presence of other favorable conditions. This is also proved by the strong seasonality of the phenomenon in the study area. Climate change has been associated with the changing risk patterns of mosquito vector-borne diseases such as malaria [3]. A recent review investigating the impact of climate change on mosquito borne diseases concluded that 69% of the studies predicted an increase in mosquito related diseases with increasing temperatures [50]. It is thus evident that mosquito populations and the related diseases are associated with environmental/climate factors. Most of the previous work relied on moderate resolution remotely sensed data [6,11], whereas in the present work, we exploited the high resolution of Landsat 8 derived LST and NDVI and the high temporal resolution of MODIS LST. Overall, the main assumptions of the paper are that the distribution of an abundance of mosquitoes depends directly on environmental and climatic conditions and that LST, NDVI, altitude and water area could be used to predict when peaks of mosquito-related disease incidences, such as malaria, may occur. Further studies focusing on the effects of environmental variables on the instances of malaria could help to predict future malaria occurrence along the border of Argentina and Bolivia. These studies are relevant considering that Argentina is included in the malaria pre-elimination phase. The results that will be obtained from future studies about the prediction of malaria occurrences can be used to indicate whether vector Anopheles species are likely to alter their geographical range, thus also indicating where new cases of malaria are likely to occur.
Future research efforts should focus on the abundance of specific mosquito species and their relationship to environmental factors for longer time periods. Data availability restricted our work to only one summer period, that of 2019, which is certainly a limitation of the present work. However, a clear outcome is that although environmental parameters certainly impact the development of mosquito populations, their actual population development can be predicted in a timely manner by using time series of remotely sensed information. This time window offers a substantial advantage in effecting appropriate control measures. In general, anthropogenic variables and different land use might also play significant roles in the development and variability of mosquito populations. Factors involved in farming methods, such as the crop type, method of irrigation and other factors, may alter local mosquito population densities. Moreover, changes in land uses at a local scale, such as where sample sites are situated, can increase the number of suitable larval habitats. These issues represent a significant field of interest for future work.

5. Conclusions

In this study, we examined how mosquito population abundance is impacted by satellite-derived NDVI and LST time series data along with other environmental factors such as the water area surrounding the observation points and altitude. A predictive model was created by applying a machine learning technique in the form of an MLP NN model. The model was applied to a full set of mosquito data, for 17 locations in northeastern Greece during the summer of 2019, and it provided a satisfactory output, indicating a strong predictive ability. Among the examined environmental parameters, LST demonstrated the highest relative importance and in water area the second higher importance, indicating the strong seasonality of mosquito abundance and their relation to the presence of surface waters. As mosquito populations are directly connected to outbreaks of diseases such as West Nile virus and malaria, a predictive model for the spatial and temporal distribution of mosquito populations that uses freely available environmental information is quite attractive because it enables local authorities to adopt preventive measures to combat the spread of vector borne diseases in a timely manner.

Supplementary Materials

The following are available online at https://www.mdpi.com/article/10.3390/su13147655/s1, Supplementary Material S1: Table S1: Time series data of mosquito populations in the study area along with environmental factors examined (LST, NDVI, Altitude, Water area), Supplementary Material S2: Table S2_1: Correlation coefficients of LST at various time lags, Table S2_2: Correlation coefficients of NDVI at various time lags.

Author Contributions

A.G. and I.K. designed the study. I.K. obtained funding for the project. A.N. conducted fieldwork and collected samples. M.d.C.W. did the morphological species identification. S.V. reviewed the draft manuscript. M.K., A.G. and I.K. performed the analysis. M.K. and A.G. wrote the manuscript with input from all authors. M.K. and A.G. collected and processed the satellite data and ran the model. All authors have read and agreed to the published version of the manuscript.

Funding

This research was co-financed by the European Union and Greek national funds through the Operational Program Competitiveness, Entrepreneurship and Innovation, under the call RESEARCH—CREATE—INNOVATE (project code: T1EDK-5000).

Institutional Review Board Statement

Not applicable.

Data Availability Statement

Landsat 8 remotely sensed information used in the present are freely available from the Earth Resources Observation and Science (EROS) Center (https://www.usgs.gov/centers/eros accessed on 15/02/2021). The mosquito data set is available as Supplementary Materials accompanying the present article.

Acknowledgments

Analysis of mosquito data has been conducted as part of the M.Sc. thesis of Maria Kofidou within the frames of the M.Sc. course “Environmental Engineering and Science” of the Department of Environmental Engineering of Democritus University of Thrace.

Conflicts of Interest

The authors declare no conflict of interest.

References

  1. Lourenço, P.M.; Sousa, C.A.; Seixas, J.; Lopes, P.; Novo, M.T.; Paulo, A.; Almeida, G. Anopheles atroparvus density modeling using MODIS NDVI in a former malarious area in Portugal. J. Vector Ecol. 2011, 36, 279–291. [Google Scholar] [CrossRef] [PubMed]
  2. Chaves, L.S.M.; Bergo, E.S.; Conn, J.E.; Laporta, G.Z.; Prist, P.R.; Sallum, M.A.M. Anthropogenic landscape decreases mosquito biodiversity and drives malaria vector proliferation in the Amazon rainforest. PLoS ONE 2021, 16, e0245087. [Google Scholar] [CrossRef]
  3. Trájer, A.J. The changing risk patterns of Plasmodium vivax malaria in Greece due to climate change. Int. J. Environ. Health Res. 2020, 1–26. [Google Scholar] [CrossRef] [PubMed]
  4. Parselia, E.; Kontoes, C.; Tsouni, A.; Hadjichristodoulou, C.; Kioutsioukis, I.; Magiorkinis, G.; Stilianakis, N.I. Satellite Earth Observation data in epidemiological modeling of malaria, dengue and West Nile Virus: A scoping review. Remote Sens. 2019, 11, 1862. [Google Scholar] [CrossRef] [Green Version]
  5. Kazansky, Y.; Wood, D.; Sutherlun, J. The current and potential role of satellite remote sensing in the campaign against malaria. Acta Astronaut. 2016, 121, 292–305. [Google Scholar] [CrossRef] [Green Version]
  6. Dantur Juri, M.J.; Estallo, E.; Almirón, W.; Santana, M.; Sartor, P.; Lamfri, M.; Zaidenberg, M. Satellite-derived NDVI, LST, and climatic factors driving the distribution and abundance of Anopheles mosquitoes in a former malarious area in northwest Argentina. J. Vector Ecol. 2015, 40, 36–45. [Google Scholar] [CrossRef]
  7. Chuang, T.W.; Henebry, G.M.; Kimball, J.S.; VanRoekel-Patton, D.L.; Hildreth, M.B.; Wimberly, M.C. Satellite microwave remote sensing for environmental modeling of mosquito population dynamics. Remote Sens. Environ. 2012, 125, 147–156. [Google Scholar] [CrossRef] [Green Version]
  8. Pergantas, P.; Tsatsaris, A.; Malesios, C.; Kriparakou, G.; Demiris, N.; Tselentis, Y. A spatial predictive model for malaria resurgence in central Greece integrating entomological, environmental and social data. PLoS ONE 2017, 12, e0178836. [Google Scholar] [CrossRef] [Green Version]
  9. Rodrigues, A.; Schellenberg, J.A.; Kofoed, P.E.; Aaby, P.; Greenwood, B. Changing pattern of malaria in Bissau, Guinea Bissau. Trop. Med. Int. Health 2008, 13, 410–417. [Google Scholar] [CrossRef] [PubMed]
  10. Richardson, E.A.; Abruzzo, N.O.; Taylor, C.E.; Stevens, B.R.; Cuda, J.P.; Weeks, E.N.I. Methionine as an Effective Mosquito Larvicide in Natural Water Sources. Florida Entomol. 2020, 103, 479–483. [Google Scholar] [CrossRef]
  11. Scavuzzo, J.M.; Trucco, F.; Espinosa, M.; Tauro, C.B.; Abril, M.; Scavuzzo, C.M.; Frery, A.C. Modeling Dengue vector population using remotely sensed data and machine learning. Acta Trop. 2018, 185, 167–175. [Google Scholar] [CrossRef] [Green Version]
  12. Climate Atlas of Greece, Hellenic National Meteorological Service. Available online: https://web.archive.org/web/20170921184739/http://www.hnms.gr:80/hnms/greek/pdf/Climate_Atlas_Of_Greece.pdf (accessed on 20 February 2021).
  13. McNelly, J.R. The CDC Trap As a special monitoring tool. In Proceedings of the Seventy-Sixth Annual Meeting of the New Jersey Mosquito Control Association; 1989; pp. 26–33. Available online: http://vectorbio.rutgers.edu/outreach/cdctrap.htm (accessed on 19 May 2021).
  14. Darsie, R.F.; Samanidou-Voyadjoglou, A. Keys for the identification of the mosquitoes of Greece. J. Am. Mosq. Control Assoc. 1997, 13, 247–254. [Google Scholar]
  15. Samanidou-Voyadjoglou, A.; Harbach, R.E. Keys to the adult female mosquitoes (Culicidae) of Greece. Eur. Mosq. Bull. 2001, 10, 13–20. [Google Scholar]
  16. Gunay, F.; Picard, M.; Robert, V. Interactive Identification Key for Female Mosquitoes (Diptera: Culicidae) of Euro-Mediterranean and Black Sea Regions. Int. J. Infect. Dis. 2016, 53, 110–111. [Google Scholar] [CrossRef] [Green Version]
  17. Harbach, R.E. Culicipedia: Species-Group, Genus-Group and Family-Group Names in Culicidae (Diptera); Cabi: Wallingford, UK, 2018; ISBN 9781786399052. [Google Scholar]
  18. Wilkerson, R.C.; Linton, Y.M.; Fonseca, D.M.; Schultz, T.R.; Price, D.C.; Strickman, D.A. Making mosquito taxonomy useful: A stable classification of tribe Aedini that balances utility with current knowledge of evolutionary relationships. PLoS ONE 2015, 10, 1–26. [Google Scholar] [CrossRef] [PubMed]
  19. Lee, Y.; Nieman, C.C.; Yamasaki, Y.; Collier, T.C. A DNA extraction protocol for improved DNA yield from individual mosquitoes. F1000Research 2015, 4. [Google Scholar] [CrossRef] [Green Version]
  20. Ratnasingham, S.; Hebert, P.D.N. BOLD: The Barcode of Life Data System: Barcoding. Mol. Ecol. Notes 2007, 7, 355–364. [Google Scholar] [CrossRef] [Green Version]
  21. Li, Z.L.; Tang, B.H.; Wu, H.; Ren, H.; Yan, G.; Wan, Z.; Trigo, I.F.; Sobrino, J.A. Satellite-derived land surface temperature: Current status and perspectives. Remote Sens. Environ. 2013, 131, 14–37. [Google Scholar] [CrossRef] [Green Version]
  22. Fahri, S.; Ariyani, S.; Yamistada, G.; Manulang, E.S. Hatchability of the Eggs Aedesspp in Clean and Polluted Water. KnE Life Sci. 2019, 2019, 134–140. [Google Scholar] [CrossRef]
  23. Roux, O.; Renault, D.; Mouline, K.; Diabaté, A.; Simard, F. Living with predators at the larval stage has differential long-lasting effects on adult life history and physiological traits in two anopheline mosquito species. J. Insect Physiol. 2021, 131, 104234. [Google Scholar] [CrossRef]
  24. Department of Epidemiological Surveillance and Intervention, Center for Disease Control and Prevention of Greece (KEELPNO). Available online: https://eody.gov.gr/ (accessed on 19 March 2021).
  25. Dantur Juri, M.J.; Galante, G.B.; Zaidenberg, M.; Almirón, W.R.; Claps, G.L.; Santana, M. Longitudinal study of the species composition and spatio-temporal abundance of Anopheles larvae in a malaria risk area in Argentina. Fla. Entomol. 2014, 97, 1167–1181. [Google Scholar] [CrossRef]
  26. Dambach, P.; Machault, V.; Lacaux, J.P.; Vignolles, C.; Sié, A.; Sauerborn, R. Utilization of combined remote sensing techniques to detect environmental variables influencing malaria vector densities in rural West Africa. Int. J. Health Geogr. 2012, 11, 1–12. [Google Scholar] [CrossRef] [Green Version]
  27. Avdan, U.; Jovanovska, G. Algorithm for automated mapping of land surface temperature using LANDSAT 8 satellite data. J. Sensors 2016, 2016, 1480307. [Google Scholar] [CrossRef] [Green Version]
  28. Gemitzi, A.; Dalampakis, P.; Falalakis, G. Detecting geothermal anomalies using Landsat 8 thermal infrared remotely sensed data. Int. J. Appl. Earth Obs. Geoinf. 2021, 96, 102283. [Google Scholar] [CrossRef]
  29. Morawitz, D.F.; Blewett, T.M.; Cohen, A.; Alberti, M. Using NDVI to assess vegetative land cover change in Central Puget Sound. Environ. Monit. Assess. 2006, 114, 85–106. [Google Scholar] [CrossRef]
  30. Jeevalakshmi, D.; Reddy, S.N.; Manikiam, B. Land cover classification based on NDVI using LANDSAT8 time series: A case study Tirupati region. Int. Conf. Commun. Signal Process. ICCSP 2016 2016, 560056, 1332–1335. [Google Scholar] [CrossRef]
  31. Pekel, J.F.; Cottam, A.; Gorelick, N.; Belward, A.S. High-resolution mapping of global surface water and its long-term changes. Nature 2016, 540, 418–422. [Google Scholar] [CrossRef] [PubMed]
  32. Du, J.; Kimball, J.S.; Jones, L.A.; Kim, Y.; Glassy, J.; Watts, J.D. A global satellite environmental data record derived from AMSR-E and AMSR2 microwave Earth observations. Earth Syst. Sci. Data 2017, 9, 791–808. [Google Scholar] [CrossRef] [Green Version]
  33. Ambikairajah, E.; Lennon, S. Neural Networks for Speech Recognition. In Proceedings of the AI and Cognitive Science ’90, University of Ulster, Jordanstown, UK, 20–21 September 1990; McTear, M.F., Creaney, N., Eds.; Springer: London, UK, 1990; pp. 163–177. [Google Scholar]
  34. Cristea, P.D. Application of Neural Networks In Image Processing and Visualization. In Proceedings of the GeoSpatial Visual Analytics; Amicis, R.D., Stojanovic, R., Conti, G., Eds.; Springer: Dordrecht, The Netherlands, 2009; pp. 59–71. [Google Scholar]
  35. Gemitzi, A.; Lakshmi, V. Estimating Groundwater Abstractions at the Aquifer Scale Using GRACE Observations. Geosciences 2018, 8, 419. [Google Scholar] [CrossRef] [Green Version]
  36. Keller, P.E.; Kangas, L.J.; Hashem, S.; Kouzes, R.T. Applications of Neural Networks in Environment, Energy and Health; World Scientific: Singapore, 1996; Volume 5, ISBN 978-981-02-2758-6. [Google Scholar]
  37. Nguyen, T.A.; Ly, H.B.; Pham, B.T. Backpropagation Neural Network-Based Machine Learning Model for Prediction of Soil Friction Angle. Math. Probl. Eng. 2020, 2020, 8845768. [Google Scholar] [CrossRef]
  38. Spitz, F.; Sovan, L. Environmental impact prediction using neural network modelling. An example in wildlife damage. J. Appl. Ecol. 1999, 36, 317–326. [Google Scholar] [CrossRef]
  39. Sun, A.Y. Predicting groundwater level changes using GRACE data. Water Resour. Res. 2013, 49, 5900–5912. [Google Scholar] [CrossRef]
  40. Sheela, K.G.; Deepa, S.N. Selection of number of hidden neurons in neural networks in renewable energy systems. J. Sci. Ind. Res. 2014, 73, 686–688. [Google Scholar]
  41. Nash, J.E.; Sutcliffe, J.V. River Flow Forecasting Through Conceptual Models Part I—A Discussion of Principles. J. Hydrol. 1970, 10, 282–290. [Google Scholar] [CrossRef]
  42. Moriasi, D.N.; Arnold, J.G.; Van Liew, M.W.; Bingner, R.L.; Harmel, R.D.; Veith, T.L. Model evaluation guidelines for systematic quantification of accuracy in watershed simulations. Trans. ASABE 2007, 50, 885–900. [Google Scholar] [CrossRef]
  43. Tachi, S.E.; Ouerdachi, L.; Remaoun, M.; Derdous, O.; Boutaghane, H. Forecasting suspended sediment load using regularized neural network: Case study of the Isser River (Algeria). J. Water L. Dev. 2016, 29, 75–81. [Google Scholar] [CrossRef] [Green Version]
  44. The R Project for Statistical Computing. Available online: https://www.r-project.org/ (accessed on 12 February 2021).
  45. Fritsch, S.; Guenther, F.; Suling, M.; Mueller, S.M. Package ‘Neuralnet’ 2016. Available online: https://github.com/bips-hb/neuralnet (accessed on 12 February 2021).
  46. Olden, J.D.; Joy, M.K.; Death, R.G. An accurate comparison of methods for quantifying variable importance in artificial neural networks using simulated data. Ecol. Modell. 2004, 178, 389–397. [Google Scholar] [CrossRef]
  47. Marzban, C.; Illian, P.R.; Morison, D.; Mourad, P.D. Within-Group and between-Group Correlation: Illustration on Non-Invasive Estimation of Intracranial Pressure. 2013. Available online: http://faculty.washington.edu/marzban/within_between_simple.pdf (accessed on 15 March 2021).
  48. Wagner, C.H. Simpson’s paradox in real life. Am. Stat. 1982, 36, 46–48. [Google Scholar]
  49. Jani, C.; Walker, A.; Al Omari, O.; Patel, D.; Heffess, A.; Wolpow, E.; Page, S.; Bourque, D. Acute transverse myelitis in West Nile Virus, a rare neurological presentation. IDCases 2021, 24, e01104. [Google Scholar] [CrossRef]
  50. Giesen, C.; Roche, J.; Redondo-Bravo, L.; Ruiz-Huerta, C.; Gomez-Barroso, D.; Benito, A.; Herrador, Z. The impact of climate change on mosquito-borne diseases in Africa. Pathog. Glob. Health 2020, 114, 1–15. [Google Scholar] [CrossRef]
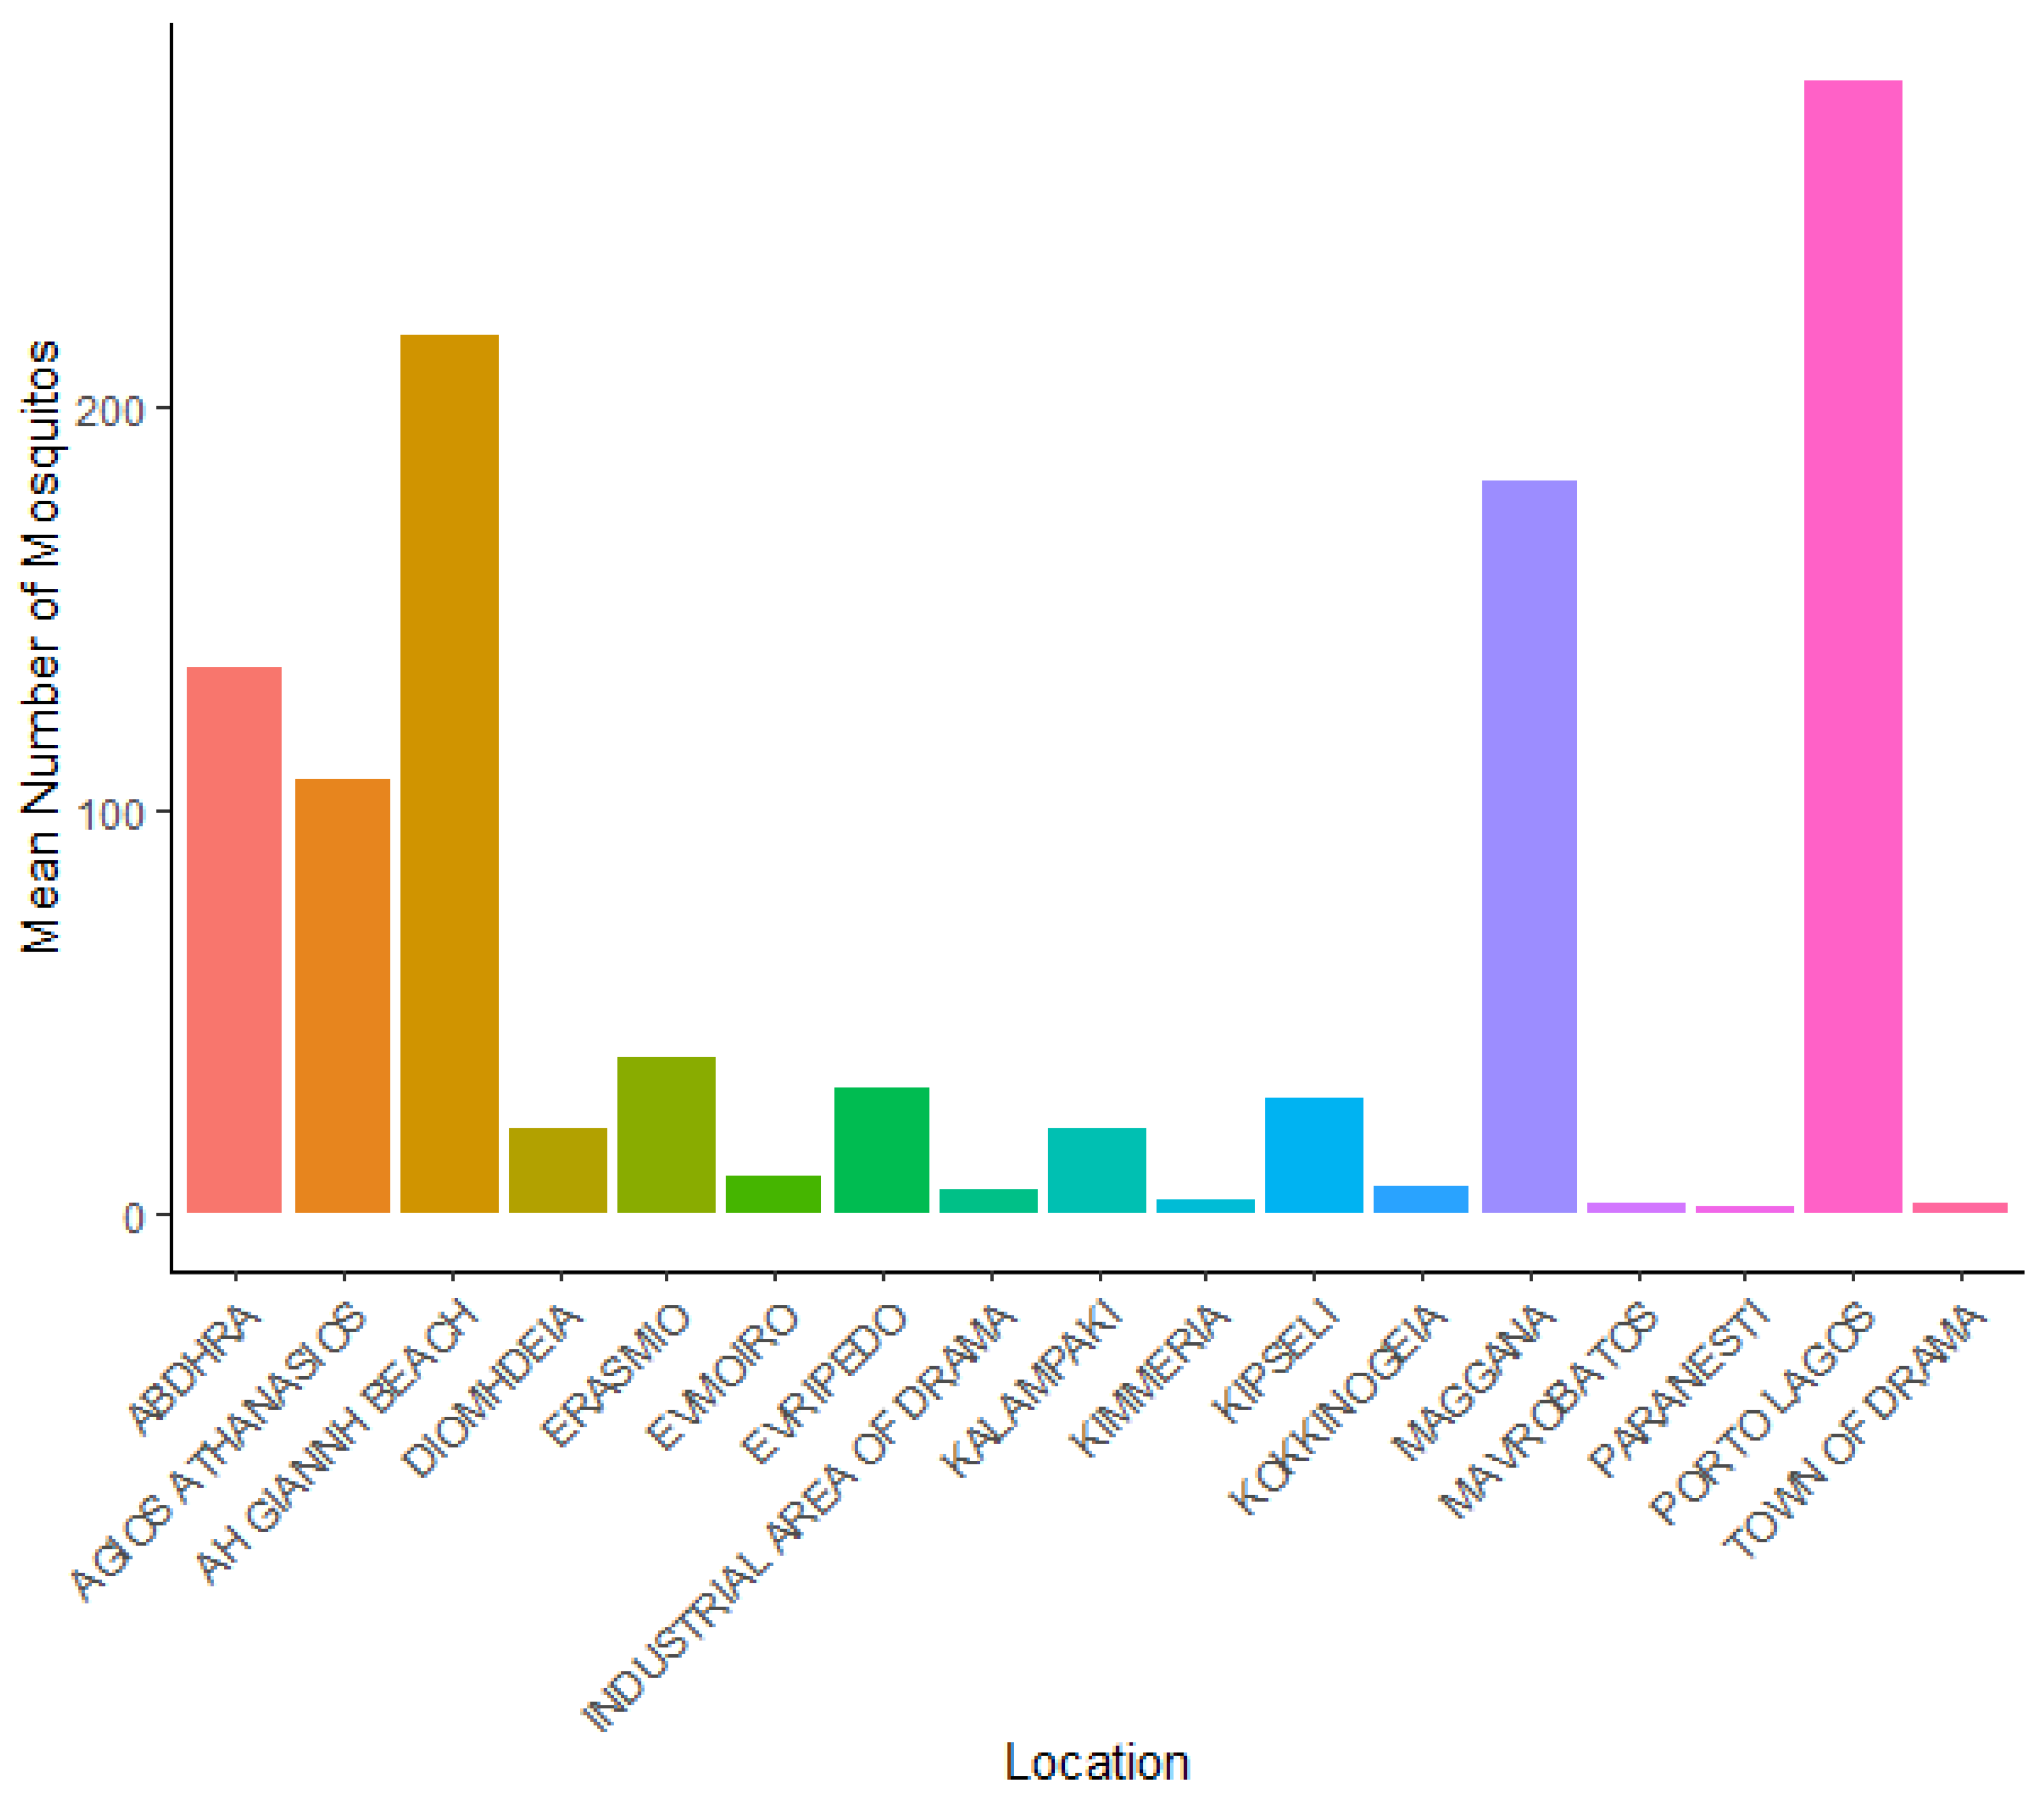
Figure 1. Study area and monitoring locations.
Sustainability 13 07655 g001
Figure 2. Transferring scheme of MODIS LST temporal resolution into the Landsat 8 derived LST.
Sustainability 13 07655 g002
Figure 3. Mean number of mosquitoes in each location throughout the study period.
Sustainability 13 07655 g003
Figure 4. Mean number of mosquitoes per (a) Water area, (b) Altitude, (c) LST, (d) NDVI, (e) Julian Date.
Sustainability 13 07655 g004
Figure 5. Architecture of the neural network.
Sustainability 13 07655 g005
Figure 6. Distribution of error metrics of the MLP NN model in the 100-fold cross-validation exercise: (a) MSE, (b) Scaled RMSE and (c) NSE.
Sustainability 13 07655 g006
Figure 7. Observed and predicted mosquito population from the MLP ANN, as an ensemble mean of the 100-fold cross validation exercise.
Sustainability 13 07655 g007
Figure 8. Relative importance for each input variable in the MLP NN.
Sustainability 13 07655 g008
Figure 9. Number of reported cases with laboratory diagnosed WNV disease (WNF with WNND and without WNND) with mean LST at municipalities within and close to the study area. Data are retrieved from the National Organization of Public Health of Greece (EODY) and are reported per suspected municipality of exposure.
Sustainability 13 07655 g009
Table 1. Summary statistics of the mosquito data set and the environmental variables examined.
LocationTotal Mosquito NumberMean LSTMean NDVIAltitude (m)Water Area km2
Kalampaki148302.20.68656.02
Evripedo216305.00.451337.01
Kokkinogeia47304.00.571013.02
Town of Drama19304.70.62921.99
Paranesti14306.30.751181.70
Mavrobatos15308.90.30791.85
Industrial area of Drama39308.80.531532.50
Evmoiro62308.20.31954.03
Kipseli199309.80.26626.89
Erasmio271309.70.2787.32
Maggana1268312.20.3179.88
Abdhra947311.90.21429.02
Ah Giannh Beach1523309.60.56410.01
Porto Lagos1967310.50.23211.56
Diomhdeia145309.20.42365.96
Agios Athanasios751308.50.39338.46
Kimmeria22307.80.24882.10
Table 2. Correlation coefficient of LST and NDVI with number of mosquitoes in each location.
LocationsLSTNDVI
Overall0.347 ***−0.036
Within-group correlation coefficients
Abdhra0.6550.976 ***
Agios Athanasios0.773 *0.991 ***
Ah Giannh Beach0.843 *0.729
Diomhdeia0.6040.139
Erasmio0.3320.358
Evmoiro0.5310.647
Evripedo0.5710.581
Industrial area of Drama0.830 *0.804 *
Kalampaki0.921 **0.973 ***
Kimmeria0.943 **0.871 *
Kipseli0.7440.839 *
Kokkinogeia0.950 **0.946 **
Maggana0.866 *0.967 ***
Mavrobatos0.937 **0.906 **
Paranesti0.837 *0.990 ***
Porto Lagos0.7040.899 **
Town of Drama0.787 *0.901 **
Significance codes: <0.001 *** 0.001 ** 0.01 *.
Publisher’s Note: MDPI stays neutral with regard to jurisdictional claims in published maps and institutional affiliations.

