System-Dynamics Modeling for Exploring the Impact of Industrial-Structure Adjustment on the Water Quality of the River Network in the Yangtze Delta Area
Abstract
:1. Introduction
2. Application of SD in Water-Quality Modeling
3. Methodology
4. SD Model of Water Quality
4.1. Research Scope and Research Goal
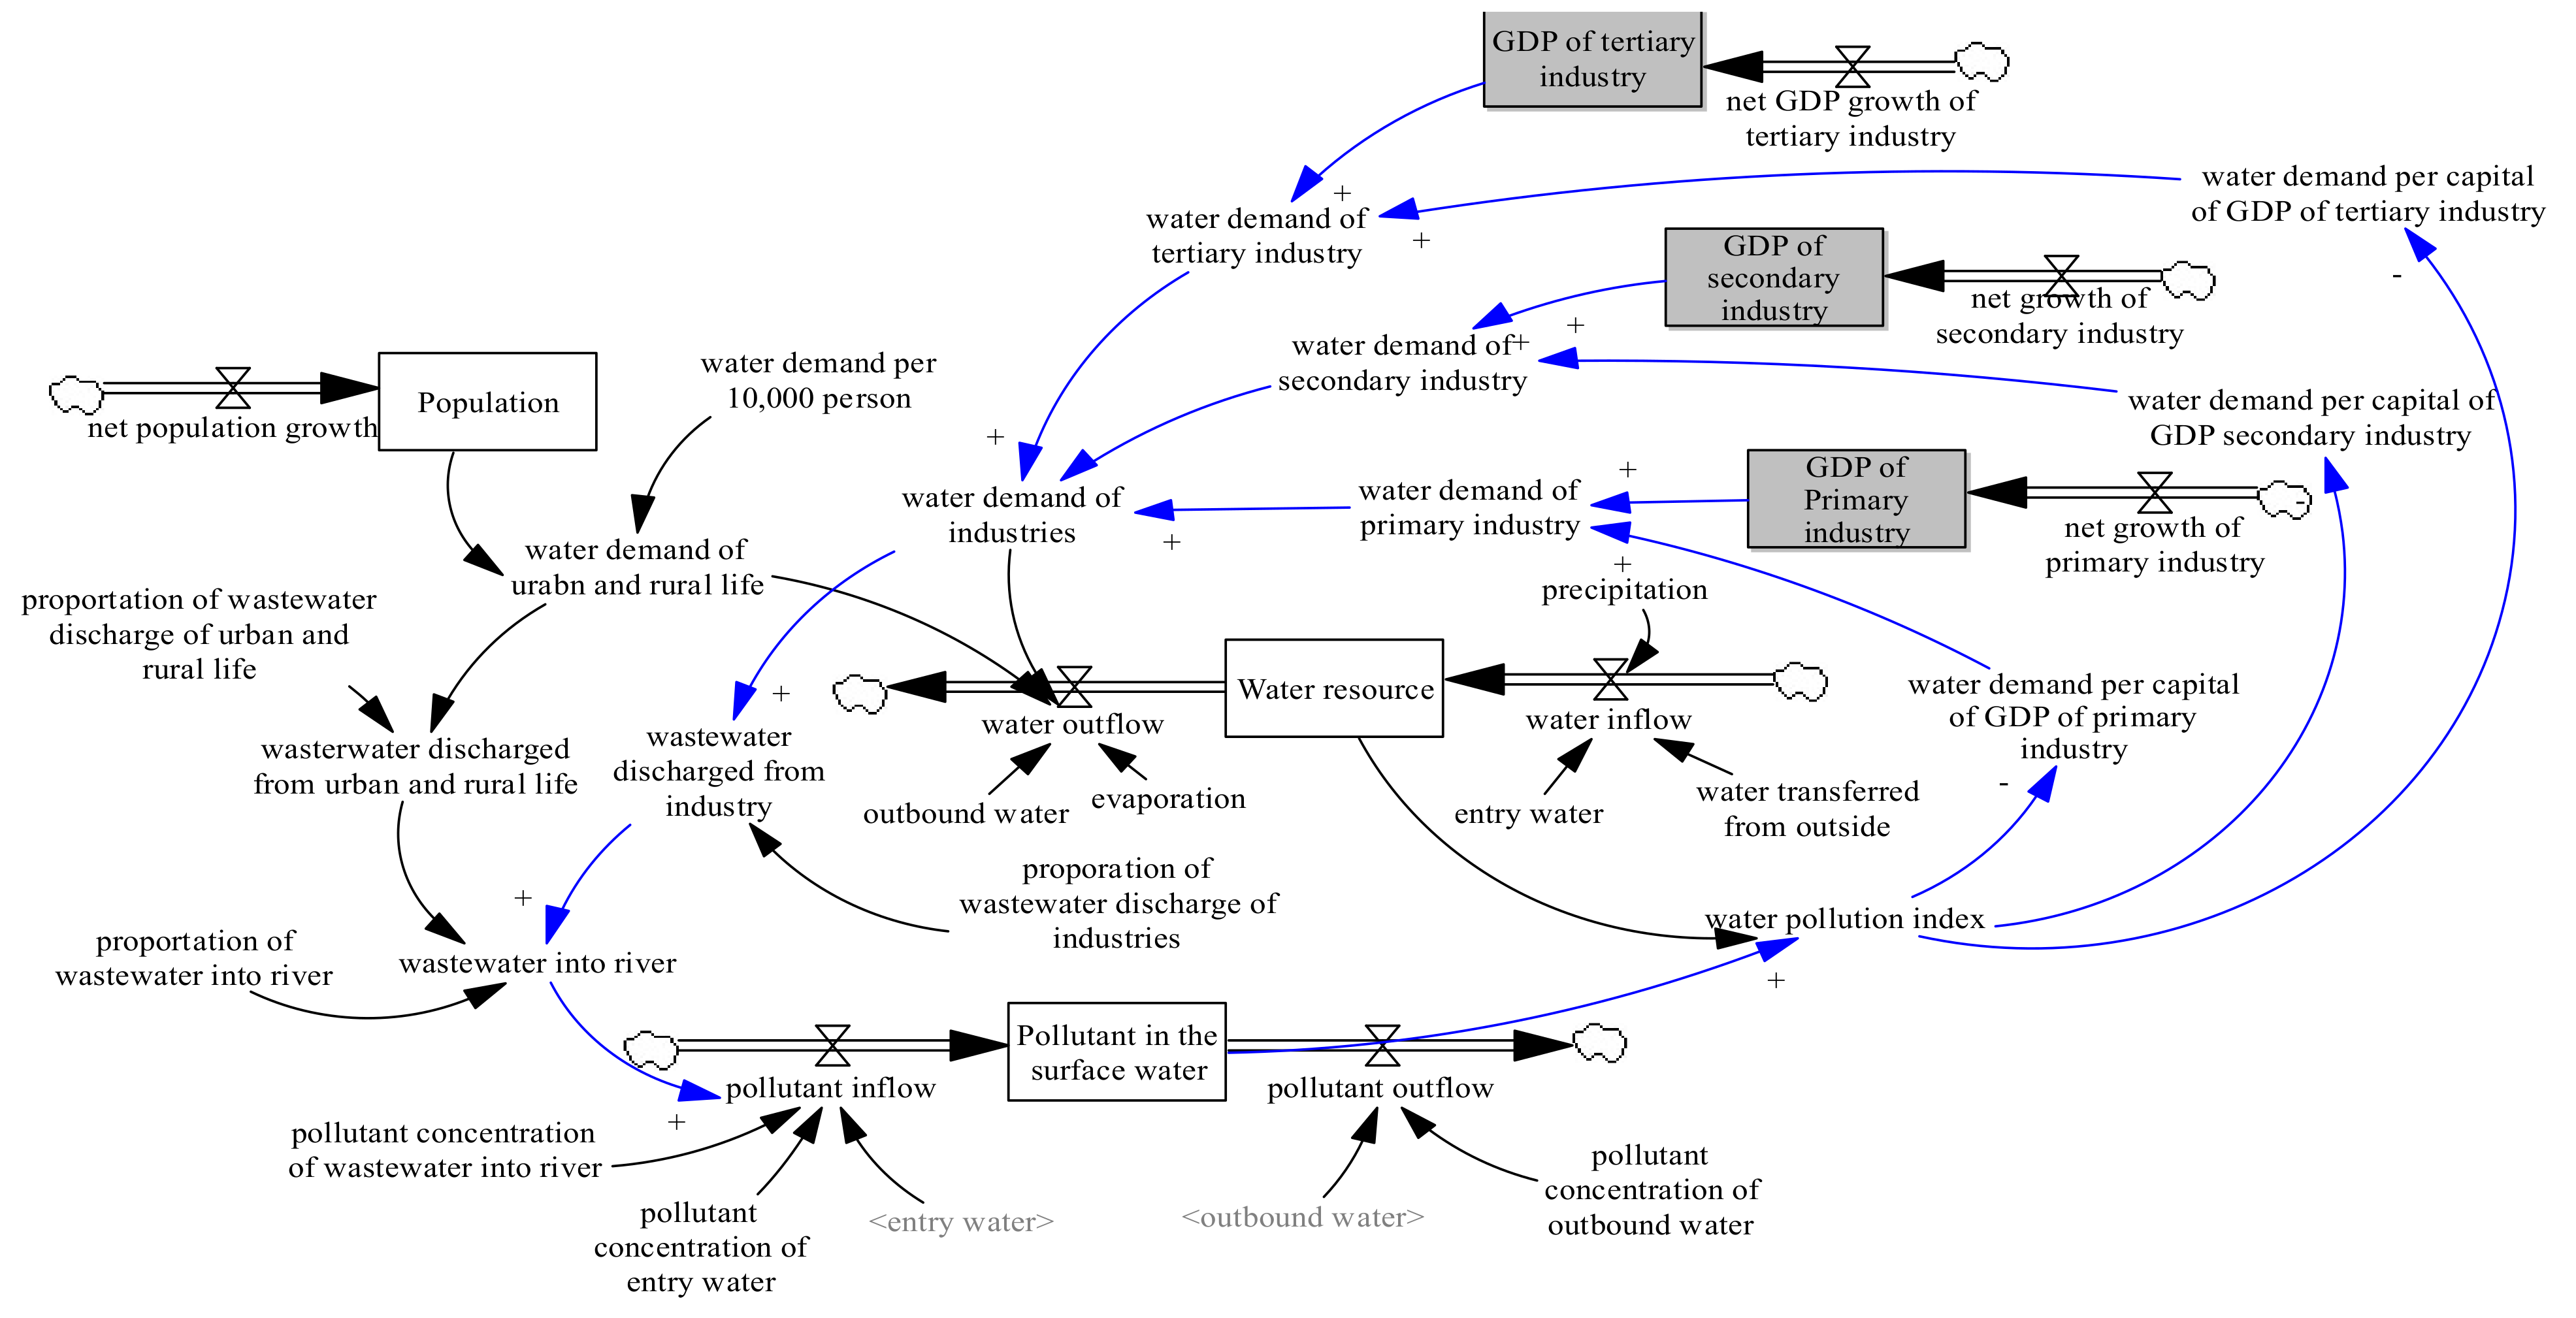
4.2. System Structure of Water Quality
- (1)
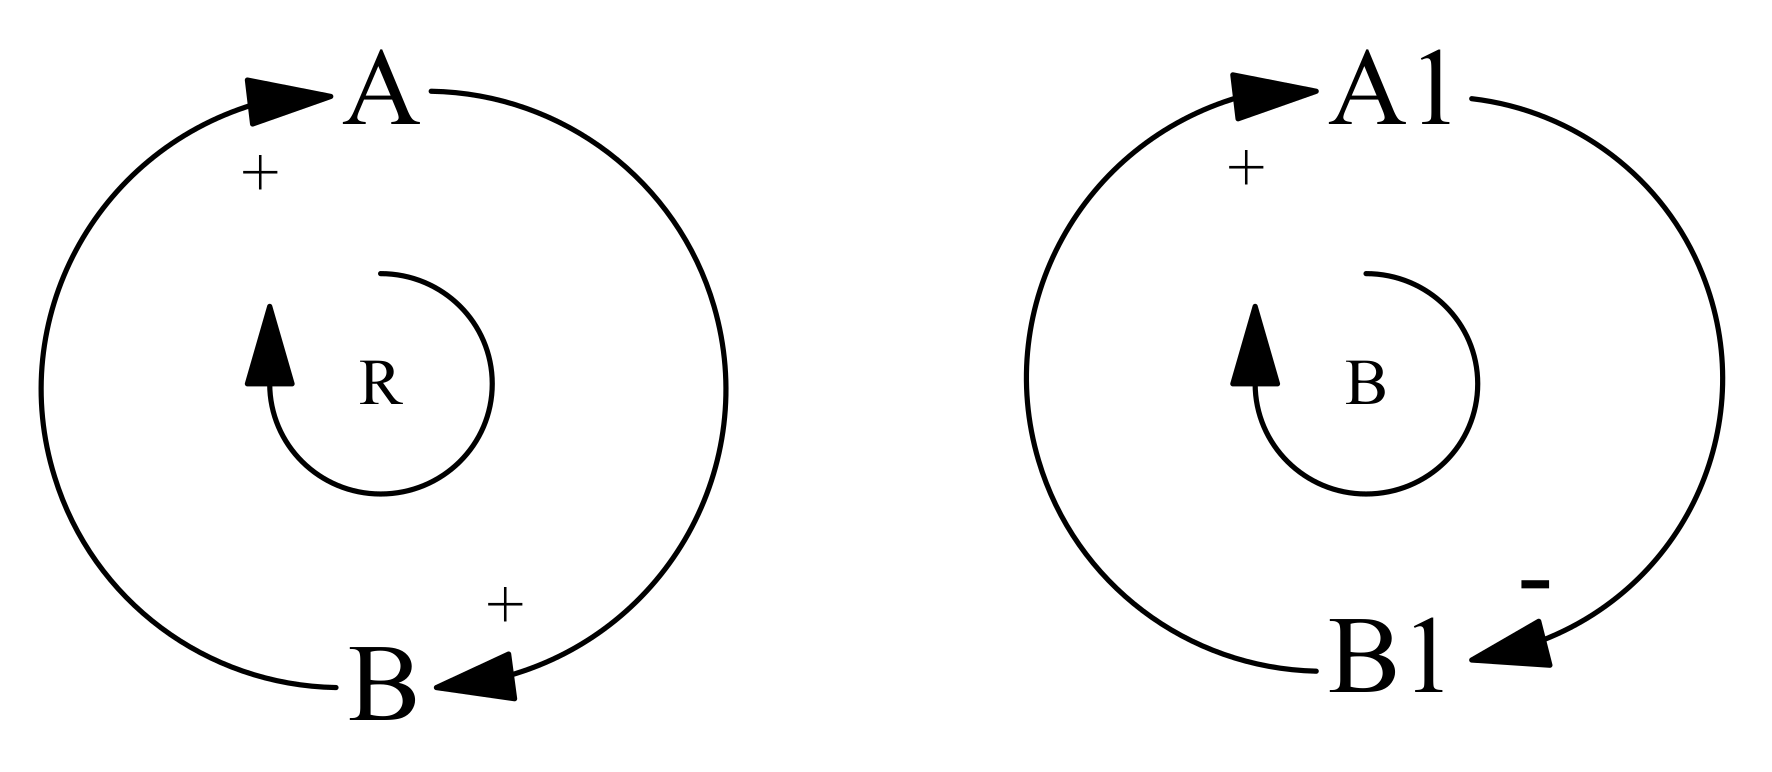
- The increase of population will increase the water demand, which will have a positive effect on wastewater discharge. More wastewater discharged will bring more pollutant into rivers and lead to the decline of water quality. The deterioration of the water quality has a negative effect on the increase of population.Loop B1: population → +water demand → +wastewater discharge → +pollutant load → –water quality → +population (balancing loop)
- (2)
- The development of economy will increase the water demand, which will have a positive effect on wastewater discharge. More wastewater discharged will bring more pollutant into rivers and lead to the decline of water quality. The deterioration of the water quality has a negative effect on the growth of the economy.Loop B2: economic development → +water demand → +wastewater discharge → +pollutant load → –water quality→ +economic development (balancing loop)
- (3)
- The growth of the economy will lead to an increase in the local GDP, and the increase in local GDP will increase the investment in water infrastructure. This will positively affect the amount of wastewater treated. More wastewater treatment will contribute to amount of water that can be reused. More water reused will positively affect the water supply. Therefore, the gap between water supply and demand will decrease. The reduction of water shortage will promote economic development.Loop R1: economic development → +GDP → +water infrastructure investment → +wastewater treatment → +wastewater reuse → +water supply→ –water shortage → –economic development (reinforcing loop)
- (4)
- The growth of the economy will lead to an increase in the local GDP, and the increase in local GDP will increase the investment in water infrastructure. This will positively affect the amount of wastewater treated. More wastewater treatment will contribute to the amount of water that can be reused, which means the wastewater discharged into the river will decrease. Therefore, the pollutant load will decrease and water quality will improve. High water quality adversely affects water-environment pressure. Less water-environment pressure will positively affect the economic development.Loop R2: economic development → +GDP→ +water infrastructure investment → +wastewater treatment → +wastewater reuse→ –wastewater discharge → +pollutant load → –water quality → –water environment pressure→ –economic development (reinforcing loop)
- (5)
- The growth of the economy will lead to an increase in the local GDP, and the increase in local GDP will increase the investment of water infrastructure. This will positively affect the amount of wastewater treated. More wastewater treatment will reduce the pollutant content in wastewater, which means the pollutant load discharged for the river will decrease. Therefore, water quality will increase and water-environment pressure will decrease. Less water-environment pressure will positively affect the economic development.Loop R3: economic development → +GDP → +water infrastructure investment → +wastewater treatment → +pollutant treatment → –pollutant load → –water quality → –water environment pressure → –economic development (reinforcing loop)
- (6)
- The higher the water quality, the higher the self-purification capacity of a water body.Loop R4: water quality → +self-purification capacity → +water quality (reinforcing loop)
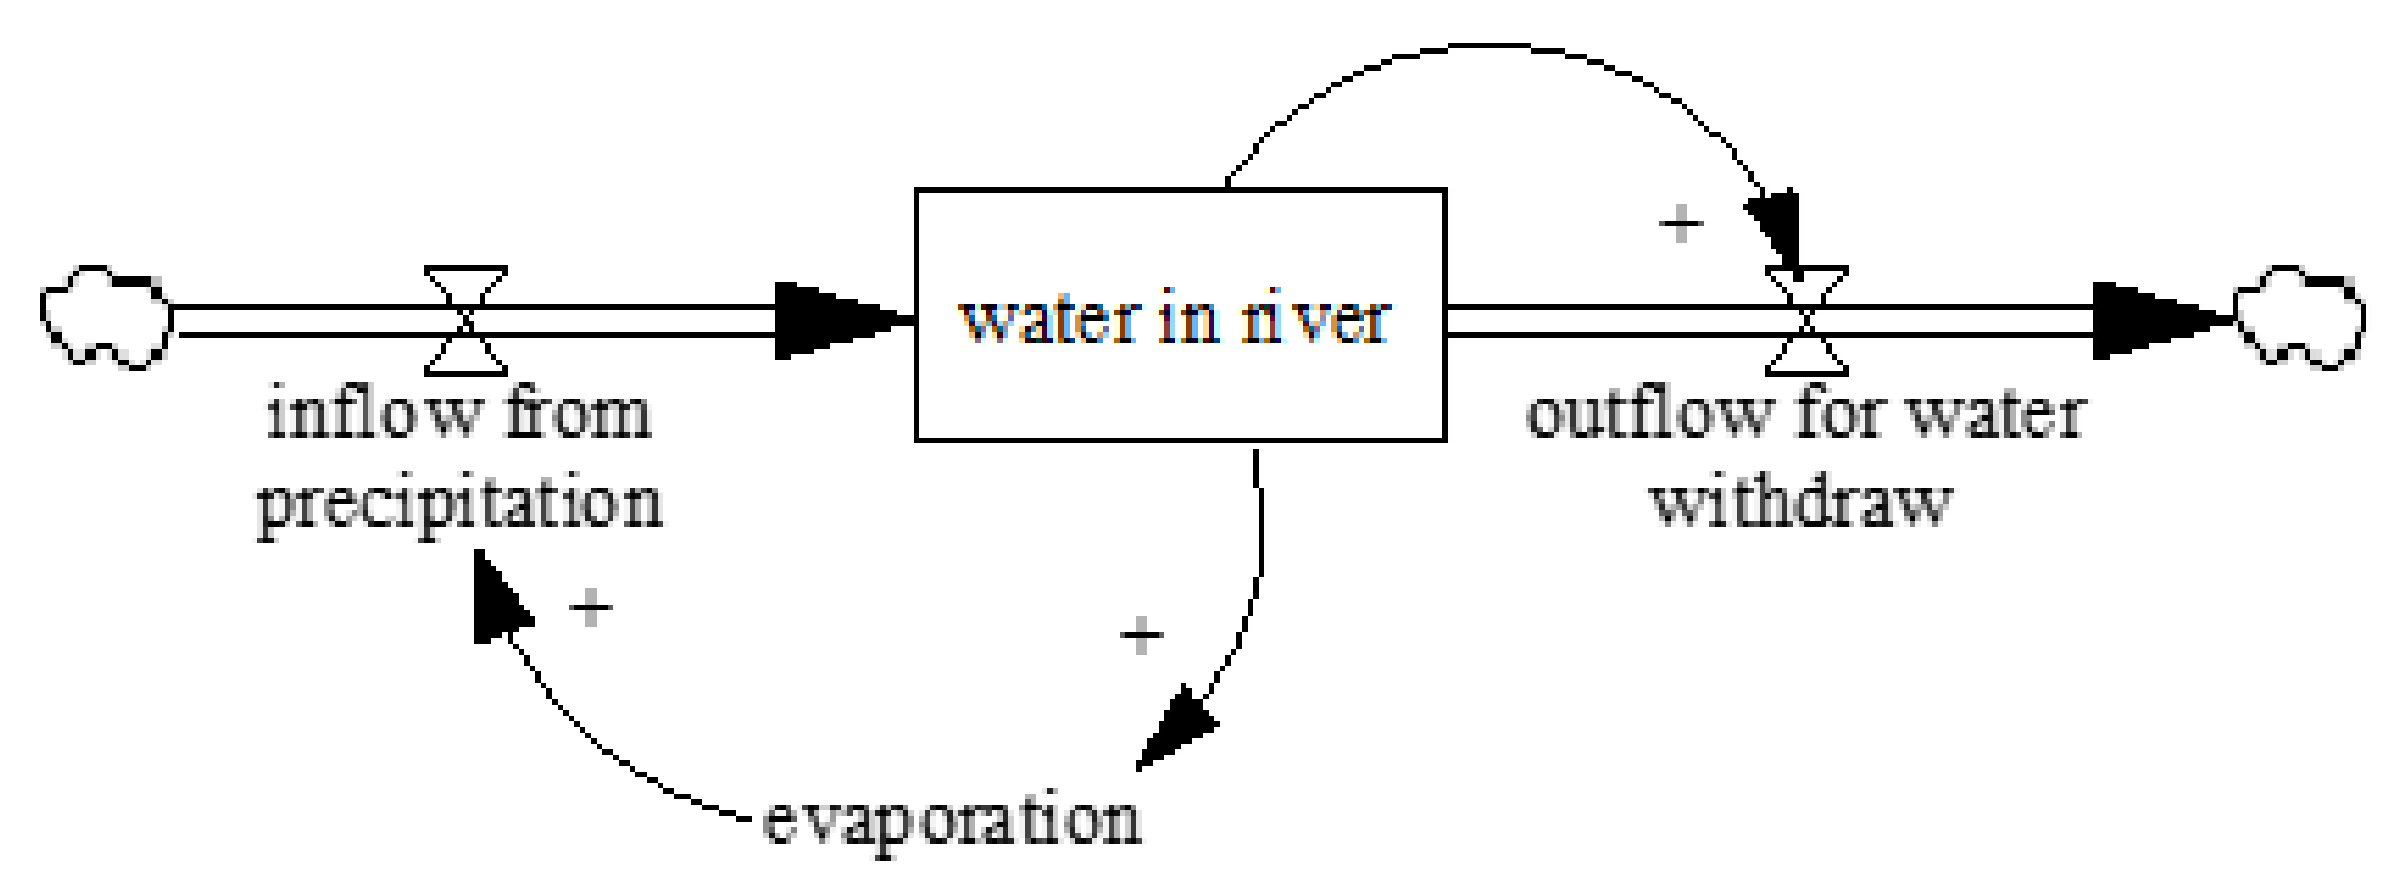
4.3. Stock-and-Flow Diagram of Water Quality
5. Model Adaption to Jiaxing Water Quality
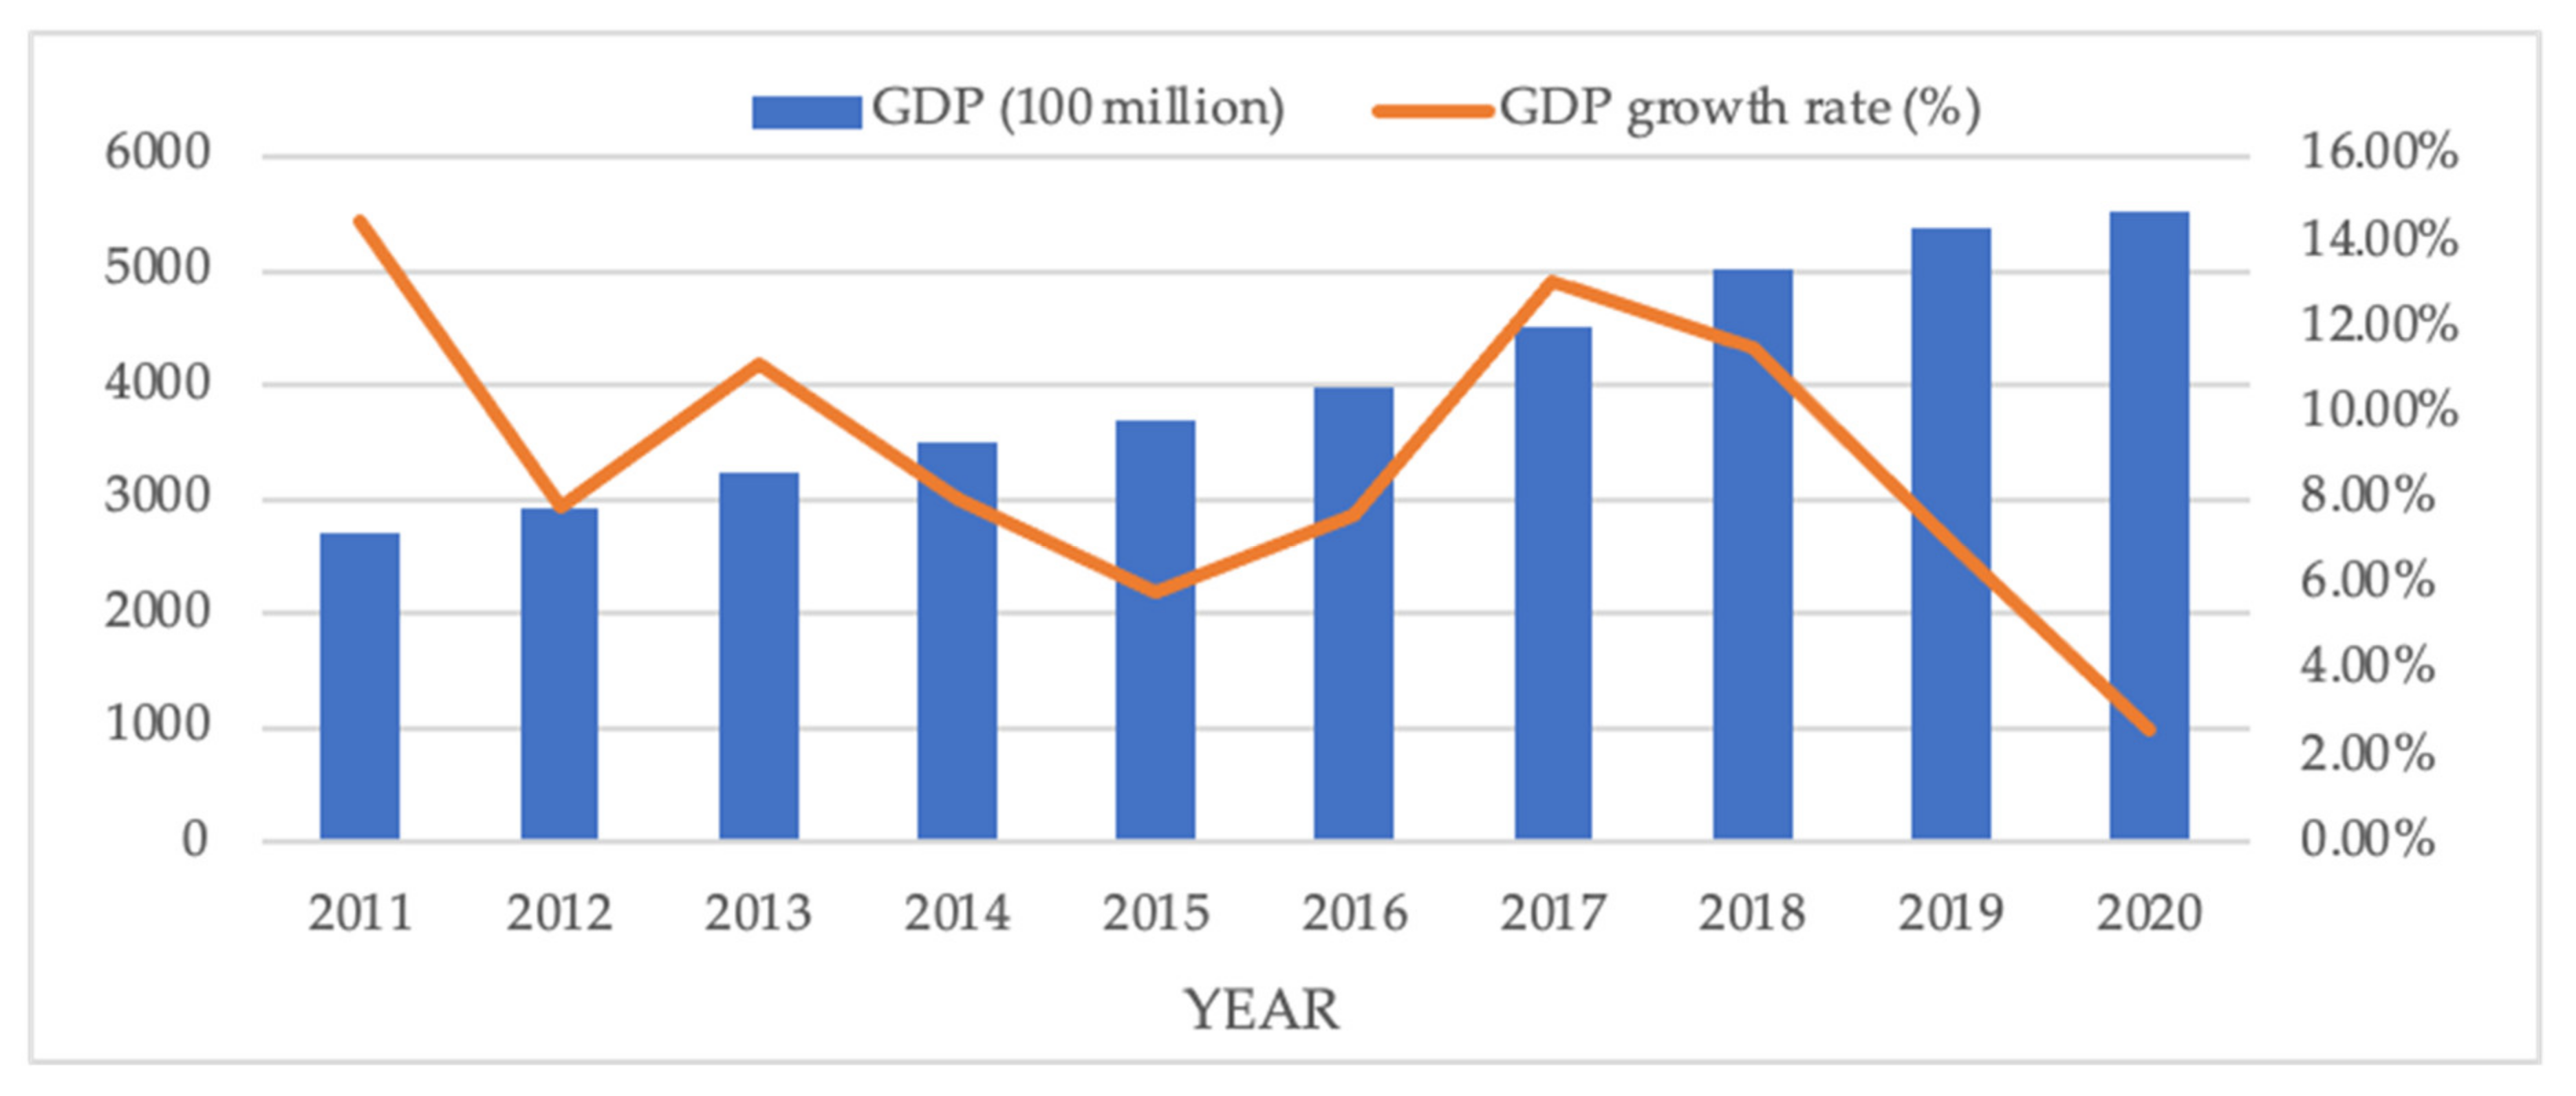
5.1. Overview of the Study Area
5.2. Detailed Setting of the Jiaxing Model
5.2.1. Construction of the Jiaxing Model
5.2.2. Main System Equations
- (1)
- Pollutant load of COD into the river = pollutant load of COD from urban and rural life + pollutant load of COD from primary industry + pollutant load of COD from secondar industry + pollutant load of COD from tertiary industry
- (2)
- Pollutant load of COD from primary industry = pollutant load of COD from farming + pollutant load of COD from livestock and poultry + pollutant load of COD from aquaculture
- (3)
- Pollutant load of COD from farming = wastewater discharged from farming into the river × COD concentration of wastewater discharged from farming
- (4)
- Wastewater discharged from farming into the river = wastewater discharged from farming × (1 – ecological interception rate of irrigation tail water in farming)
- (5)
- Wastewater discharged from farming = water demand of farming × proportion of wastewater discharged from farming
- (6)
- Water demand of farming = GDP of farming × water consumption per capita GDP of farming
- (7)
- GDP of farming = farming area × average output value per unit area of farming
- (8)
- Farming area = INTEG (growth rate of farming area – declining rate of farming area, initial value)
5.3. Model Validation and Sensitivity Analysis
5.3.1. Model Validation
5.3.2. Sensitivity Analysis
5.4. Model Simulation and Analysis
5.4.1. Simulation of Water Quality
5.4.2. Simulation of Pollution Load
5.5. Suggestions for Improving Water Quality of Jiaxing
6. Conclusions
Author Contributions
Funding
Data Availability Statement
Acknowledgments
Conflicts of Interest
References
- Gu, X.; Liao, Z.; Zhang, G.; Xie, J.; Zhang, J. Modelling the effects of water diversion and combined sewer overflow on urban inland river quality. Environ. Sci. Pollut. Res. 2017, 24, 21038–21049. [Google Scholar] [CrossRef]
- Yang, W.; Li, L. Efficiency evaluation and policy analysis of industrial wastewater control in China. Energies 2017, 10, 1201. [Google Scholar] [CrossRef]
- Yang, N.; Zhang, Z.; Xue, B.; Ma, J.; Chen, X.; Lu, C. Economic Growth and Pollution Emission in China: Structural Path Analysis. Sustainability 2018, 10, 2569. [Google Scholar] [CrossRef] [Green Version]
- Li, T.; Yang, S.; Tan, M. Simulation and optimization of water supply and demand balance in Shenzhen: A system dynamics approach. J. Clean. Prod. 2019, 207, 882–893. [Google Scholar] [CrossRef]
- Naderi, M.M.; Mirchi, A.; Bavani, A.R.M.; Goharian, E.; Madani, K. System dynamics simulation of regional water supply and demand using a food-energy-water nexus approach: Application to Qazvin Plain, Iran. J. Environ. Manag. 2021, 280, 111843. [Google Scholar] [CrossRef] [PubMed]
- Li, K.; Ma, T.; Wei, G.; Zhang, Y.; Feng, X. Urban Industrial Water Supply and Demand: System Dynamic Model and Simulation Based on Cobb–Douglas Function. Sustainability 2019, 11, 5893. [Google Scholar] [CrossRef] [Green Version]
- Ma, W.; Meng, L.; Wei, F.; Opp, C.; Yang, D. Sensitive Factors Identification and Scenario Simulation of Water Demand in the Arid Agricultural Area Based on the Socio-Economic-Environment Nexus. Sustainability 2020, 12, 3996. [Google Scholar] [CrossRef]
- Wang, X.; Zhang, J.; Shamsuddin, S.; He, R.; Xia, X.; Mou, X. Potential impact of climate change on future water demand in Yulin city, Northwest China. Mitig. Adapt. Strateg. Glob. Chang. 2015, 20, 1–19. [Google Scholar]
- Liu, H.; Benoit, G.; Liu, T.; Liu, Y.; Guo, H. An integrated system dynamics model developed for managing lake water quality at the watershed scale. J. Environ. Manag. 2015, 155, 11–23. [Google Scholar] [CrossRef]
- Zeilhofer, P.; Lima, E.B.N.R.; Lima, G.A.R. Land use effects on water quality in the urban agglomeration of Cuiabá and Várzea Grande, Mato Grosso State, central Brazil. Urban Water J. 2010, 7, 173–186. [Google Scholar] [CrossRef]
- Juma, D.W.; Wang, H.; Li, F. Impacts of population growth and economic development on water quality of a lake: Case study of Lake Victoria Kenya water. Environ. Sci. Pollut. Res. 2014, 21, 5737–5746. [Google Scholar] [CrossRef] [PubMed]
- Liu, Y.; Engel, B.A.; Flanagan, D.C.; Gitau, M.W.; McMillan, S.K.; Chaubey, I. A review on effectiveness of best management practices in improving hydrology and water quality: Needs and opportunities. Sci. Total Environ. 2017, 601, 580–593. [Google Scholar] [CrossRef] [PubMed]
- Whitehead, P.G.; Wilby, R.L.; Battarbee, R.W.; Kernan, M.; Wade, A.J. A review of the potential impacts of climate change on surface water quality. Hydrol. Sci. J. 2009, 54, 101–123. [Google Scholar] [CrossRef]
- Dhote, S.; Dixit, S. Water quality improvement through macrophytes—A review. Environ. Monit. Assess. 2009, 152, 149–153. [Google Scholar] [CrossRef]
- Chen, Z.; Wei, S. Application of system dynamics to water security research. Water Resour. Manag. 2014, 28, 287–300. [Google Scholar] [CrossRef]
- Karamouz, M.; Akhbari, M.; Moridi, A.; Kerachian, R. A system dynamics-based conflict resolution model for river water quality management. Iran. J. Environ. Health Sci. Eng. 2006, 3, 147–160. [Google Scholar]
- Duran-Encalada, J.A.; Paucar-Caceres, A.; Bandala, E.R.; Wright, G.H. The impact of global climate change on water quantity and quality: A system dynamics approach to the US–Mexican transborder region. Eur. J. Oper. Res. 2017, 256, 567–581. [Google Scholar] [CrossRef] [Green Version]
- Nozari, H.; Liaghat, A. Simulation of drainage water quantity and quality using system dynamics. J. Irrig. Drain. Eng. 2014, 140, 05014007. [Google Scholar] [CrossRef]
- Park, S.; Kim, B.J.; Jung, S.Y. Simulation methods of a system dynamics model for efficient operations and planning of capacity expansion of activated-sludge wastewater treatment plants. Procedia Eng. 2014, 70, 1289–1295. [Google Scholar] [CrossRef] [Green Version]
- Wang, G.; Wang, S.; Kang, Q.; Duan, H.; Wang, X.E. An integrated model for simulating and diagnosing the water quality based on the system dynamics and Bayesian network. Water Sci. Technol. 2016, 74, 2639–2655. [Google Scholar] [CrossRef]
- Debele, B.; Srinivasan, R.; Parlange, J.Y. Coupling upland watershed and downstream waterbody hydrodynamic and water quality models (SWAT and CE-QUAL-W2) for better water resources management in complex river basins. Environ. Model. Assess. 2008, 13, 135–153. [Google Scholar] [CrossRef]
- Li, K.; He, J.; Li, J.; Guo, Q.; Liang, S.; Li, Y.; Wang, X. Linking water quality with the total pollutant load control management for nitrogen in Jiaozhou Bay, China. Ecol. Indic. 2018, 85, 57–66. [Google Scholar] [CrossRef]
- Forrester, J.W. Industrial Dynamics; MIT Press: Cambridge, MA, USA, 1961. [Google Scholar]
- Doyle, J.C.; Francis, B.A.; Tannenbaum, A.R. Feedback Control Theory; Courier Corporation: North Chelmsford, MA, USA, 2013. [Google Scholar]
- Richmond, B. Systems thinking: Critical thinking skills for the 1990s and beyond. Syst. Dynam. Rev. 1993, 9, 113–133. [Google Scholar] [CrossRef] [Green Version]
- Barlas, Y. System dynamics: Systemic feedback modeling for policy analysis. System 2007, 1, 1–29. [Google Scholar]
- Senge, P.M.; Sterman, J.D. Systems thinking and organizational learning: Acting locally and thinking globally in the organization of the future. Eur. J. Oper. Res. 1992, 59, 137–150. [Google Scholar] [CrossRef]
- Sterman, J.D. Business Dynamics: Systems Thinking and Modeling for a Complex World; McGraw-Hill: New York, NY, USA, 2000. [Google Scholar]
- Ford, F.A. Modeling the Environment: An Introduction to System Dynamics Models of Environmental Systems; Island Press: Washington, DC, USA, 1999. [Google Scholar]
- Mulligan, M.; Wainwright, J. Modelling and model building. In Environmental Modelling: Finding Simplicity in Complexity; John Wiley & Sons: Hoboken, NJ, USA, 2004; pp. 7–73. [Google Scholar]
- Yang, C.C.; Chang, L.C.; Ho, C.C. Application of system dynamics with impact analysis to solve the problem of water shortages in Taiwan. Water Resour. Manag. 2008, 22, 1561–1577. [Google Scholar] [CrossRef]
- Fang, Y.; Lim, K.; Qian, Y.; Feng, B. System dynamics modeling for information systems research theory development and practical application. MIS Q. 2018, 24, 1303–1329. [Google Scholar]
- Zhao, J.; Jia, J.; Qian, Y.; Zhong, L.; Wang, J.; Cai, Y. COVID-19 in Shanghai: IPC policy exploration in support of work resumption through system dynamics modeling. Risk Manag. Healthc. Policy 2020, 13, 1951. [Google Scholar] [CrossRef]
- Mirchi, A.; Madani, K.; Watkins, D.; Ahmad, S. Synthesis of system dynamics tools for holistic conceptualization of water resources problems. Water Resour. Manag. 2012, 26, 2421–2442. [Google Scholar] [CrossRef]
- Simonovic, S.P. Managing Water Resources: Methods and Tools for a Systems Approach; Routledge: London, UK, 2012. [Google Scholar]
- Shao, W. Effectiveness of water protection policy in China: A case study of Jiaxing. Sci. Total Environ. 2010, 408, 690–701. [Google Scholar] [CrossRef]
- Tao, T.; Yujia, Z.; Huang, K. Water quality analysis and Recommendations through comprehensive pollution index method. Manag. Sci. Eng. 2011, 5, 95–100. [Google Scholar]
- Barisa, A.; Rosa, M. A system dynamics model for CO2 emission mitigation policy design in road transport sector. Energy Procedia 2018, 147, 419–427. [Google Scholar] [CrossRef]
- Forrester, J.W.; Senge, P.M. Tests for building confidence in system dynamics models. In TIMS Studies in the Management Science; North Holland Press: Amsterdam, The Netherlands, 1980. [Google Scholar]
- Li, K.B.; Ma, T.Y.; Wei, G. Multiple Urban Domestic Water Systems: Method for Simultaneously Stabilized Robust Control Decision. Sustainability 2018, 10, 4092. [Google Scholar] [CrossRef] [Green Version]
- Kelly, R.A.; Jakeman, A.J.; Barreteau, O.; Borsuk, M.E.; ElSawah, S.; Hamilton, S.H.; Henriksen, H.J.; Kuikka, S.; Maier, H.R.; Rizzoli, A.E.; et al. Selecting among five common modelling approaches for integrated environmental assessment and management. Environ. Model. Softw. 2013, 47, 159–181. [Google Scholar] [CrossRef]




| Subsystem | Specific Key Parameters | Unit |
|---|---|---|
| Population subsystem | Urban population | 10,000 persons |
| Rural population | 10,000 persons | |
| Natural growth rate of urban population | 1/year | |
| Mechanical growth rate of urban population | 1/year | |
| Primary industry subsystem | Farming area | 10,000 ha |
| Growth rate of farming area | 1/year | |
| Water consumption per RMB 10,000 output value | 10,000 t/RMB 10,000 | |
| Proportion of wastewater generated | Dimensionless | |
| Proportion of wastewater discharged into river | Dimensionless | |
| Secondary industry subsystem | GDP | RMB 10,000 |
| Growth rate of GDP | 1/year | |
| Water consumption for per RMB 10,000 output value | 10,000 t/RMB 10,000 | |
| Proportion of wastewater generated | Dimensionless | |
| Reuse rate of treated wastewater | Dimensionless | |
| Proportion of wastewater discharged into river | Dimensionless | |
| Tertiary industry subsystem | GDP | RMB 10,000 |
| Growth rate of GDP | 1/year | |
| Water consumption for per RMB 10,000 output value | 10,000 tons/ RMB 10,000 | |
| Proportion of wastewater generated | Dimensionless | |
| Proportion of wastewater discharged into river | Dimensionless | |
| Water resource subsystem | Water resources | 10,000 t |
| Domestic water consumption | 10,000 t | |
| Production water consumption | 10,000 t | |
| Ecological water consumption | 10,000 t | |
| Precipitation | 10,000 t | |
| Evaporation | 10,000 t | |
| Water environment subsystem | COD (chemical oxygen demand) pollutant load | t |
| NH3-N (ammoniacal nitrogen) pollutant load | t | |
| TN (total nitrogen) pollutant load | t | |
| TP (total phosphorus) pollutant load | t |
| Sector | Key Industries | Proportion of Wastewater Discharged |
|---|---|---|
| Primary industry | Farming | - |
| Livestock and poultry breeding (LPB) | - | |
| (Freshwater) aquaculture | - | |
| Secondary industry | Textile industry (TI) | 53.63% |
| Paper and paper products (PPP) | 16.74% | |
| Raw chemical materials and chemical products (RCMCP) | 8.01% | |
| Tertiary industry | Wholesale and retail sale (WRS) | 32.02% |
| Accommodation and catering services (ACS) | 22.71% | |
| Culture, sports, and entertainment (CSE) | 26.36% |
| Comprehensive Pollution Index | Level | Classification Basis |
|---|---|---|
| ≤0.2 | Cleanness | Most of the items were not detected, and some items were detected but within the standard. |
| 0.21~0.40 | Subcleanness | The detection value was within the standard, and individual items were close to or exceeded the standard. |
| 0.41~0.7 | Slight pollution | Individual items were detected and exceeded the standard. |
| 0.71~1.00 | Moderate pollution | Two of the detected values exceeded the standard. |
| 1.01~2.0 | Heavy pollution | A considerable part of the detected values exceeded the standard. |
| ≥2.01 | Severe pollution | A considerable part of the detected values exceeded the standard several times or dozens of times. |
| Year | 2018 | 2019 | 2020 | |
|---|---|---|---|---|
| Population | Real value | 472.6 | 480 | 540.1 |
| Simulated value | 472.6 | 480.13 | 540.41 | |
| Error rate | 0% | 0.03% | 0.06% | |
| GDP of primary industry | Real value | 195.14 | 201.7 | - |
| Simulated value | 195.14 | 199.01 | - | |
| Error rate | 0% | 1.33% | - | |
| Added value of secondary industry | Real value | 2755.69 | 2892.55 | 2861.09 |
| Simulated value | 2755.69 | 2863.96 | 2888.03 | |
| Error rate | 0% | 1% | 0.94% | |
| Added value of tertiary industry | Real value | 2146.76 | 2356.88 | 2524.25 |
| Simulated value | 2146.76 | 2346.14 | 2502.64 | |
| Error rate | 0% | 0.46% | 0.86% |
| Year | 2018 | 2019 | 2020 | |
|---|---|---|---|---|
| Domestic water consumption | Real value | 2.29 | 2.32 | 2.41 |
| Simulated value | 2.29 | 2.32 | 2.62 | |
| Error rate | 0% | 0% | 8.71% | |
| Primary industry water consumption | Real value | 10.27 | 9.62 | 9.36 |
| Simulated value | 10.27 | 9.62 | 9.45 | |
| Error rate | 0% | 0% | 1% | |
| Secondary industry water consumption | Real value | 4.32 | 4.60 | 4.53 |
| Simulated value | 4.32 | 4.58 | 4.55 | |
| Error rate | 0% | 0.43% | 0.44% | |
| Tertiary industry water consumption | Real value | 1.28 | 1.29 | 1.35 |
| Simulated value | 1.28 | 1.33 | 1.35 | |
| Error rate | 0% | 3.1% | 0% |
| Parameter | COD Concentration (mg/L) | NH3-N Concentration (mg/L) | TN Concentration (mg/L) | TP Concentration (mg/L) | WQCPI | |||||
|---|---|---|---|---|---|---|---|---|---|---|
| 2025 | 2035 | 2025 | 2035 | 2025 | 2035 | 2025 | 2035 | 2025 | 2035 | |
| Change rate of farming area | 0.055 | 0.238 | 0.000 | 0.007 | 0.006 | 0.026 | 0.000 | 0.004 | 0.004 | 0.022 |
| Change rate of LPB GDP | 0.042 | 0.095 | 0.004 | 0.009 | 0.008 | 0.017 | 0.003 | 0.007 | 0.008 | 0.018 |
| Change rate of aquaculture GDP | 0.009 | 0.024 | 0.006 | 0.016 | 0.004 | 0.011 | 0.000 | 0.001 | 0.004 | 0.011 |
| Change rate of TI added value | 0.001 | 0.004 | 0.000 | 0.000 | 0.000 | 0.001 | 0.000 | 0.000 | 0.000 | 0.000 |
| Change rate of PPP added value | 0.015 | 0.064 | 0.001 | 0.029 | 0.004 | 0.011 | 0.000 | 0.001 | 0.002 | 0.020 |
| Change rate of RCMCP added value | 0.008 | 0.123 | 0.000 | 0.003 | 0.002 | 0.003 | 0.000 | 0.000 | 0.001 | 0.002 |
| Change rate of WRS added value | 0.005 | 0.027 | 0.000 | 0.005 | 0.001 | 0.008 | 0.000 | 0.000 | 0.001 | 0.004 |
| Change rate of ACS added value | 0.000 | 0.004 | 0.000 | 0.002 | 0.000 | 0.001 | 0.000 | 0.000 | 0.000 | 0.002 |
| Change rate of CSE added value | 0.001 | 0.003 | 0.000 | 0.001 | 0.000 | 0.000 | 0.000 | 0.000 | 0.000 | 0.001 |
| Parameter | S1 | S2 | S3 | S4 | S5 |
|---|---|---|---|---|---|
| Change rate of farming area | Constant | −10% | Constant | Constant | −10% |
| Change rate of LPB GDP | Constant | −10% | Constant | Constant | −10% |
| Change rate of aquaculture GDP | Constant | +10% | Constant | Constant | +10% |
| Change rate of TI added value | Constant | Constant | −10% | Constant | −10% |
| Change rate of PPP added value | Constant | Constant | −10% | Constant | −10% |
| Change rate of RCMCP added value | Constant | Constant | −10% | Constant | −10% |
| Change rate of WRS added value | Constant | Constant | Constant | −10% | −10% |
| Change rate of ACS added value | Constant | Constant | Constant | −10% | −10% |
| Change rate of CSE added value | Constant | Constant | Constant | −10% | −10% |
Publisher’s Note: MDPI stays neutral with regard to jurisdictional claims in published maps and institutional affiliations. |
© 2021 by the authors. Licensee MDPI, Basel, Switzerland. This article is an open access article distributed under the terms and conditions of the Creative Commons Attribution (CC BY) license (https://creativecommons.org/licenses/by/4.0/).
Share and Cite
Wang, L.; Wang, R.; Yan, H. System-Dynamics Modeling for Exploring the Impact of Industrial-Structure Adjustment on the Water Quality of the River Network in the Yangtze Delta Area. Sustainability 2021, 13, 7696. https://doi.org/10.3390/su13147696
Wang L, Wang R, Yan H. System-Dynamics Modeling for Exploring the Impact of Industrial-Structure Adjustment on the Water Quality of the River Network in the Yangtze Delta Area. Sustainability. 2021; 13(14):7696. https://doi.org/10.3390/su13147696
Chicago/Turabian StyleWang, Linlin, Rongchang Wang, and Haiyan Yan. 2021. "System-Dynamics Modeling for Exploring the Impact of Industrial-Structure Adjustment on the Water Quality of the River Network in the Yangtze Delta Area" Sustainability 13, no. 14: 7696. https://doi.org/10.3390/su13147696
APA StyleWang, L., Wang, R., & Yan, H. (2021). System-Dynamics Modeling for Exploring the Impact of Industrial-Structure Adjustment on the Water Quality of the River Network in the Yangtze Delta Area. Sustainability, 13(14), 7696. https://doi.org/10.3390/su13147696


