Article

Accelerating Green Innovation Performance from the Relations of Network Potential, Absorptive Capacity, and Environmental Turbulence

1
School of Management and Economics, University of Electronic Science and Technology of China, Chengdu 611731, China
2
School of Automation, University of Electronic Science and Technology of China, Chengdu 611731, China
3
Business School, Sichuan University, Chengdu 610065, China
*
Author to whom correspondence should be addressed.
Sustainability 2021, 13(14), 7765; https://doi.org/10.3390/su13147765
Submission received: 18 June 2021 / Revised: 5 July 2021 / Accepted: 8 July 2021 / Published: 12 July 2021
(This article belongs to the Section Sustainable Management)

Abstract

:
The demand for sustainable development and the advantages of industries are expediting over time with the triggering of green innovation performance (GIP). Improving a firm’s GIP, especially in manufacturing industries, can accelerate green development and mitigate the global-concerned environmental issues. Thus, to investigate GIP from its antecedent factors, we delineate the relationship between network potential, absorptive capacity, environmental turbulence, and GIP based on social network theory, organizational learning theory, and contingency theory. We tested our hypotheses based on 233 sets of questionnaire surveys from high-tech manufacturing firms in China through deploying the hierarchical regression and bootstrap method. Our empirical findings reveal that the network potential dimensions, including network position centrality (NPC), network structure richness (NSR), and network relationship closeness (NRC), significantly positively impacted the GIP. The absorptive capacity (AC) partially mediated the relationship between the network potential dimensions and GIP. Environmental turbulence (ET) as an essential mechanism not only positively moderated the relationship between AC and GIP but also enhanced the AC mediation effect. These findings indicate that manufacturing firms should continue to improve network potential and AC and respond rapidly to changes in the external environment to enhance GIP, consequently contributing to the sustainable development of the economy.

1. Introduction

As the main component of the national economy, the manufacturing industry plays an important role in the rapid growth of China’s economy. Nonetheless, it faces problems, such as high resource consumption, high pollutant emissions, and weak independent innovation capabilities [1]. To promote sustainable development, China not only joined the “Paris Climate Agreement” but also implemented the National Action Program “Made in China 2025”. In “Made in China 2025”, the Chinese government implemented the basic policy of innovation-driven and green development, striving to build a green manufacturing system that is efficient, clean, low-carbon, and circular. In innovation-driven development, innovation is the focal driving force for the development. Innovation is the prime factor for green development, especially in manufacturing industries for increasing resource productivity and recycling and mitigating carbon emission, air pollution, and environmental risk. Through green development, economic growth and sustainable development can be cultivated while ensuring the protection of environmental resources, pollution, and biodiversity loss. Thus, as a combination of “innovation-driven” and “green development”, green innovation is essential for firms to maintain their core competitiveness while improving innovation competencies and achieving sustainable development [2]. However, systematic research into methods to realize green innovation of manufacturing firms and improve their green innovation performance (GIP) is lacking [3,4].
Social network theory states that all economic activities are embedded in the social network [5]. Due to continuous changes in the external environment, such as in markets and technologies, it is difficult for a single firm to survive and develop independently. Therefore, to enhance the competitiveness of firms, an increasing number have chosen to form strategic alliances with partners to realize the collaborative integration of their own internal and external resources [6]. When a focal firm participates in the formation of multiple alliances simultaneously, it has an alliance portfolio. Hoffmann [7] proposed that an alliance portfolio is a network organization composed of all of the alliances formed with the focal firm’s participation. For example, an alliance network formed by the focal firm and the upstream and downstream firms in the supply chain is a type of alliance portfolio. At present, most studies analyze network characteristics of the entire alliance portfolio rather than the network characteristics of a single firm [8,9,10]. The network characteristics of the firms mentioned here relate to the network potential, which mainly refers to the position and potential energy of the firm in the network [11] and mainly includes three dimensions: network position centrality (NPC), network structure richness (NSR), and network relationship closeness (NRC) [12,13,14,15]. However, in networks that are formed by an alliance portfolio, there is a lack of knowledge about how to use network potential to improve the GIP of the manufacturing firm as the focal firm.
Organizational learning theory states that a firm should earn knowledge in the competitive environment by changing its goals and actions to achieve these goals [16,17,18]. This knowledge may come from other organizations, where firms may find a large amount of valuable knowledge [19]. Therefore, learning from other organizations has become an essential means for firms to acquire and absorb new external knowledge. Additionally, green innovation is a systematic project with a high cost [20,21], which requires the combination of cutting-edge knowledge and technologies from different sources [22,23]. Therefore, a series of process capabilities of acquiring, digesting, transforming, and applying knowledge, namely, absorptive capacity (AC), play a momentous role in the process of influencing firm innovation performance [24]. However, from the perspective of the focal firm in the alliance portfolio, there is a lack of research on how AC can improve the GIP of manufacturing firms.
Contingency theory states that an organization is an open subsystem in the social system and is affected by the environment [25]. Therefore, all aspects of the organization’s activities must adapt to the requirements of the external environment. Studies have found that changes in technology and markets will lead to uncertainty and unpredictability in the organization’s external environment [26]. Dess and Davis [27] called the rate and unpredictability of changes in the external environment of a firm “environmental turbulence (ET)”, which is mainly divided into two dimensions: technological turbulence and market turbulence [28]. A review of the relevant literature found that ET is a necessary situational factor that affects a firm’s innovation performance [29,30]. However, based on the perspective of the focal firm in the alliance portfolio, there is a lack of in-depth research on the moderating effect of ET between AC and the GIP of manufacturing firms.
Improvement of GIP can promote environmental protection and sustainable socio-economic development. By investigating and cultivating the potential and capacity of manufacturing firms, as the focal part of this ecology, GIP can be improved to have sustainable development. Thus, deploying social network theory, organizational learning theory, and contingency theory, we endeavor to disentangle the accentuating factors of a firm’s GIP.
To summarize, from the perspective of the focal firm in the alliance portfolio, focusing on the theme of “how to improve the GIP of manufacturing firms”, we draw on social network theory, organizational learning theory, and contingency theory to address the following questions: How does network potential directly affect GIP? How does AC directly affect GIP? Does AC play a mediating role between network potential and GIP? What is the moderating effect of ET on the relationship between AC and GIP? Therefore, we constructed a relational model between network potential, AC, ET, and GIP. To verify the relational model, we conducted a questionnaire survey and empirical analysis of 233 Chinese high-tech manufacturing firms to provide a relevant theoretical basis and practical insights for improving the GIP of manufacturing firms and the sustainable development of the economy and society.

2. Theory Background and Hypotheses

2.1. Definition of Key Concepts

2.1.1. Network Potential

Although the concept of network potential, which is a network characteristic of a single organization, has been proposed by many scholars, no unified definition has been presented to date [11]. The concept of potential originated in the book “The Mathematical Principles of Natural Philosophy” published by British physicist Newton in 1697, who first proposed the law of universal gravitation [31]. Newton’s research found that in the context of the same frame of reference, when one object is higher than another or becomes more elastic, it has relative potential energy [31]. The British statistician Ravenstein [32] first applied the potential theory in physics to the social sciences. Cai and Zhang [33] applied the potential theory to the field of firm management, where they defined firm potential as the potential energy formed by the aggregation of various resources and through appropriate integration and improvement. Based on the research of Zhang et al. [11], this study defined network potential as the position and potential energy of a firm in the network due to its capabilities and resources. The concrete manifestation of this potential is the network position occupied by the firm, the constructed network structure, and the network relationship controlled by the firm.
According to this definition, this study divided the network potential into three dimensions: NPC, NSR, and NRC [12,13,14,15]. Among these, NPC refers to the centrality of the firm’s position or status in the network [12]; NSR refers to the large number of partners and the diversity of types that a firm has in its network [13], in addition to the richness of the direct connections with partners [13,14]; and NRC refers to the closeness of the relationship between the firm and the partners in the network [15].

2.1.2. Green Innovation Performance (GIP)

As a component of innovation performance, the concept of GIP has also not yet been uniformly defined in academia. The concept of innovation performance originated from the “technical efficiency” proposed by Farrell [34]. Drucker [35] defines innovation performance as a comprehensive evaluation of a firm’s technological innovation level, emphasizing the combination of all innovative elements. Jantunen [36] found that innovation performance improves a firm’s performance resulting from product innovation or process innovation. In contrast to traditional innovation, green innovation aims to realize the coordinated development of the economy, resources, and environment, with the help of new ideas and new technologies to reduce resource consumption and environmental pollution while obtaining the corresponding economic benefits of application activities [37]. Schiederig [38] believes that although the concepts of green and environmental innovation, ecological innovation, and sustainable innovation differ in name, they describe the same concept and can be used interchangeably. Chen et al. [39] asserted that green innovation is software or hardware innovation related to green products or processes. This innovation involves technological innovation in energy conservation, pollution prevention, waste recycling, green product design, and environmental management.
Based on the research of Drucker [35] and Chen et al. [39], this study defines GIP from the perspective of a firm as a comprehensive evaluation of the level of corporate green technology innovation, including energy conservation, pollution prevention, waste recycling, green product design, and environmental management. GIP includes two main aspects: green product innovation performance and green process innovation performance [39].

2.1.3. Absorptive Capacity (AC)

The concept of AC was first proposed by Cohen and Levinthal [40] when analyzing the role of a firm’s R&D. They define AC as a firm’s ability to identify, evaluate, and digest new external knowledge and ultimately apply it to business. Additionally, they divide it into three dimensions: recognition ability, digestion ability, and application ability. The definition of AC by Zahra and George [41] has been widely recognized; the authors define AC as a dynamic ability to obtain and maintain competitive advantage through knowledge creation and the use of knowledge. It is divided into two main dimensions: potential AC and real AC. Lane et al. [42] posit that AC is a firm’s ability to identify, internalize, and apply new external knowledge through a series of processes, such as exploratory learning, transformational learning, and developmental learning.
Based on the research of Zahra and George [41], this study defines AC as a firm’s ability to utilize its dynamic capacity process to acquire, digest, and transform new external technologies and knowledge and finally integrate and apply them to commercial output. It consists of four process capabilities: knowledge acquisition, digestion, conversion, and application.
In the field of knowledge transfer, knowledge attributes contribute to the process of the firm’s AC on firm’s performance and in obtaining sustainable competitive advantages [40]. In this phenomenon, technological knowledge spillovers are identified in the process of AC as its important driver. Aldieri et al. [43] found that technological knowledge is diffused from the firms and absorbed by other firms that operate in similar technology frontier.

2.1.4. Environmental Turbulence (ET)

Daft et al. [44] proposed that the environment is the sum of all of the elements that exist outside the boundaries of the organization and have a potential influence on the organization. Cukrowski and Fischer [45] noted that there is a large number of unpredictable factors in the environment, and the uncertainty of these factors will inevitably affect the management and decision-making of firms. The view of environmental uncertainty has led scholars to define the concept of ET. Duncan [46] divided environmental uncertainty into complexity and turbulence and first proposed the concept of ET, noting that ET is the degree of change in the environment of firms and other organizations within a certain period. Miller and Friesen [47] defined ET as the rate and degree of changes in technology and market demand in the industry in which the company is located. Dess and Davis [27] defined ET as the rate and unpredictability of changes in the external environment of a company. Wheelwright and Clark [28] divided ET into two dimensions: technological turbulence and market turbulence.
In summary, based on the research of Miller and Friesen [47], this study defined ET as the degree of change in technology, customer demand, and market competition intensity in the industry. Based on this definition, this study divided ET into two dimensions: technological turbulence and market turbulence [28]. Technological turbulence refers to companies’ perception of the technological environment, reflecting the degree of technological change [48], while market turbulence refers to the perceptible instability in the market, reflecting the degree of change in customer demand and the intensity of market competition [49].

2.2. Network Potential and GIP

This study used social network theory to explain the relationship between the network potential of the focal firm in the alliance portfolio and the GIP. The core content of social network theory includes two major analysis elements and three core theories. First, social network theory is based on the study of the interaction mode of actors in the network [50]. The two major analysis elements of social network theory are the relationship and structural elements [51]. The relationship element focuses on analyzing the social connection between actors in the network, and the structural element focuses on the analysis of the position of the actors in the network and the social structural characteristics formed by the connection. When applying social network theory to alliance portfolios, this study regarded the NRC of the focal firm as a relationship element and considered the NPC and the NSR as structural elements. The three core social network theories are embeddedness theory, social capital theory, and structural hole theory. The embeddedness theory states that all economic activities are embedded in the social network [5]. Capaldo [52] found that the frequent and continuous interaction and cooperation between the focal firm and the partners in the alliance portfolio are conducive to the two-way transfer and utilization of in-depth knowledge and tacit knowledge between partners through reducing mutual conflicts and opportunistic behavior. Put differently, it indirectly affects the firm’s innovation performance; that is, NRC can affect the GIP of focal firms. The social capital theory states that, through the construction of an alliance portfolio, the focal firm can establish a large number of social relationships, expand the network structure of the focal firm, increase the social capital of the mutual trust, and then improve the innovation performance [53]; that is, NSR can affect the GIP of the focus firm. The structural hole theory states that the position of an individual in the network is more important than the strength of the relationship [54], because the network position determines the ability of an individual to obtain resources and information. When a subject has more structural holes, it is more important in the network and has more social capital; that is, NPC can affect the GIP of the focal firm. In summary, the three network potential dimensions (NPC, NRC, and NSR) can all affect the GIP of focal firms.
The following further explains the impact of the three dimensions of the network potential on GIP.
(1)
NPC and GIP
NPC refers to the centrality of the firm’s position or status in the network [12]. Coccia [55] noted that firms occupying a central position in the network are more likely to obtain strategic resources to promote their innovation strategies. Additionally, Owen-Smith and Powell [12] found that firms occupying a central position in the network aid them in benefitting from innovation. Tsai and Ghoshal [56] stated that NPC can enhance a firm’s reputation, status, and trust between partners, thereby improving the firm’s innovation level. Bell [57] found that NPC has a significant positive impact on firm innovation performance through the study of cluster firms. Therefore, this study contends that NPC helps focal firms to gather green innovation knowledge, find innovative solutions to environmental challenges, and improve GIP. Based on the above analysis, this study proposed the following hypothesis:
Hypothesis 1a (H1a).
NPC has a positive effect onGIP.
(2)
NSR and GIP
NSR refers to the large number of partners and the diversity of partner types owned by a firm in a network [13], in addition to the richness of establishing direct links with partners [14]. Such structures mainly possess a diversity of actors with heterogeneous information, which is supportive for firms carrying out innovation activities [58]. Gnyawali and Madhavan [59] contended that a large-scale network structure can support the acceleration of firms’ knowledge flow and improve innovation performance. Baum et al. [60] found a positive relationship between NSR and firms’ innovation levels. Obstfeld [61] stated that a high-density innovation network can promote knowledge transfer to enhance firm innovation. Gilsing and Nooteboom [15] found that NSR helps to enhance the connection density between firms and partners, thus improving firms’ innovation abilities. Therefore, this study contends that a focal firm’s NSR enhances its access to greater and broader green innovation knowledge, thus improving the GIP. Based on the above analysis, this study proposed the following hypothesis:
Hypothesis 1b (H1b).
NSR has a positive effect onGIP.
(3)
NRC and GIP
NRC refers to the closeness of a firm’s relationship with its partners in the network [15]. This close relationship between a firm and its partners can be established through trust, loyalty, and commitment. It is an essential source of firm social capital to achieve strategic goals. Therefore, through a close relationship, a firm can obtain the various resources needed to implement innovative activities. For example, Morgan and Hunt [62] stated that relationship resources (characterized by trust, loyalty, and commitment) are enduring and play a vital role in a firm’s sustainable competitive advantage. Powell et al. [63] conducted a longitudinal study of American biotech firms and found that long-lasting network relationships are conducive to firms achieving product innovation. Tsai [64] pointed out that high-frequency interactive network relationships facilitate the flow of knowledge between firms and partners, thereby promoting innovation capabilities. Bengtsson and Sölvell [65] conducted an empirical analysis of 144 Swedish manufacturing firms and found that close and stable supplier relationships and customer relationships are positively correlated with a firm’s innovation performance. Dhanasai and Parkhe [66] noted that a stable network helps to strengthen the relationship between partners and motivates firms to acquire knowledge and increase innovation output. Therefore, this study contends that NRC can help to improve the sharing of green knowledge among organizations, promote the in-depth development and effective use of green technologies by focal firms, and thereby enhance the GIP of focal firms. Based on the above analysis, this study proposed the following hypothesis:
Hypothesis 1c (H1c).
NRC has a positive effect onGIP.

2.3. The Mediating Role of AC

2.3.1. Network Potential and AC

This study mainly used organizational learning theory to explain the relationship between the network potential and AC of the focal firm in the alliance portfolio. Organizational learning theory was divided into two dimensions of time and space by Chen [67]. This paper mainly discusses the spatial dimension of organizational learning theory. The spatial dimension includes two main research perspectives of network embedding and the overall framework [68]. Research that is based on the perspective of network embeddedness notes that the concept of “embeddedness” in social network theory further emphasizes the restrictive effect of the social network structure on organizational behavior [50]. Inkpen and Tsang [69] noted that organizations could better realize organizational learning and knowledge transfer between organizations by establishing an external relationship network. Hansen [70] believes that the network can promote knowledge sharing between organizations and encourage organizations to use network relationships to acquire and develop knowledge, thereby improving the firm’s performance and productivity. Additionally, the strength of the network connections, the density of the network, and the position of the organization in the network have different effects on the effectiveness of organizational learning [71]. Thus, in the sense of alliance portfolio, the network potential dimensions (NRC, NSR, and NPC) can affect the focal firm’s AC.
The following further explains the impact of the three dimensions of network potential on AC.
(1)
NPC and AC
As a network characteristic at the position level, a firm’s NPC reflects the centrality of the position or status occupied in the network [12]. Powell et al. [62] stated that NPC enhances the reputation of the firm. Greve [72] found that improving a firm’s reputation and status is conducive to the firm’s acquisition and use of important information, thereby enhancing its AC of knowledge. Salman and Saives [73] stated that the firm’s network position can be regarded as an intangible strategic resource, and a firm’s network position is positively related to the acquisition of complementary knowledge. Bell [56] found that firms occupying a central position access new knowledge to enhance their AC. Based on the above analysis, this study proposed the following hypothesis:
Hypothesis 2a (H2a).
NPC has a positive effect on AC.
(2)
NSR and AC
As a network characteristic at the structural level, the NSR reflects the high number of partners, the diversity of types that the firm has in the network [13], and the richness of the direct connections with partners [14]. Scholars regard NSR as an intangible resource of a firm, in which heterogeneous information and knowledge can be gathered from a large number of partners and a wide diversity of types to enhance the firm’s AC [57]. Cummings [74] noted that focal firms can tap into a diversified network structure encompassing diverse organizational attributes for unique knowledge sources, which can improve AC. Ahuja [75,76] found that establishing a direct connection between the firm and its partners can help to promote knowledge sharing in the network, which in turn encourages the firm to acquire and use more knowledge and complementary technologies from its partners. Obstfeld [60] stated that a high-density interconnected innovation network can promote a firm’s understanding and assimilation of knowledge, thereby promoting the firm’s AC. Based on the above analysis, this study proposed the following hypothesis:
Hypothesis 2b (H2b).
NSR has a positive effect on AC.
(3)
NRC and AC
As a network characteristic at the relationship level, NRC reflects the closeness of the firm’s relationship with its partners in the network [15]. Levin and Cross [77] noted that the trust generated by NRC helps firms to obtain useful knowledge from their partners, thereby enhancing the firm’s AC. Yli-Renko et al. [78] found that strong relationships ensure the quality and efficiency of information acquisition between partners and increase the breadth and depth of information exchange. This process is conducive to the firm’s acquisition and digestion of external knowledge, thereby enhancing the firm’s potential AC. Katila and Ahuja [79] stated that NRC helps to enhance the understanding and trust between partners, reduces conflicts and misunderstandings in communication, and motivates partners to discuss the technical problems encountered in the product development process. This process is conducive to a firm’s transformation and uses external knowledge to improve the firm’s real AC. Dhanasai and Parkhe [65] found that a stable network helps to strengthen the relationship between partners and promotes a firm’s acquisition and use of external knowledge, thereby enhancing the firm’s AC. Based on the above analysis, this study proposed the following hypothesis:
Hypothesis 2c (H2c).
NRC has a positive effect on AC.

2.3.2. AC and GIP

The current study used organizational learning theory to elucidate the correlation between the AC and the performance of the green innovation of the focal firm in the alliance portfolio. We mainly discuss the spatial dimension of organizational learning theory. The spatial dimension includes the two main research perspectives of network embedding and the overall framework [67]. Research that is based on the overall framework perspective found that, compared to a single organization, the learning network between organizations is more likely to produce innovative ideas [80]. For this study, a network formed by an alliance portfolio can more easily achieve innovation than a single organization. Studies have found that the higher the AC of an organization, the more easily it can use external knowledge internally, thereby enhancing learning effectiveness and innovation ability [40]; that is, in the context of alliance portfolio, AC can affect the GIP of the focal firm.
AC comprises four main process capabilities: knowledge acquisition capacity, knowledge digestion capacity, knowledge conversion capacity, and knowledge application capacity [41]. Stock et al. [81] proposed that knowledge acquisition capabilities help firms to better understand customer needs, make more targeted product improvements, and develop new products. Atuahene-Gima [82] stated that knowledge digestion capacities can help firms in the following two aspects: one is helping firms to accelerate the rate of problem-solving in new product development; the other is helping them update their knowledge-base promptly, avoid repetitive work, and overcome the “capacity trap” problem. Todorova and Durisin [83] believe that knowledge conversion capabilities can help firms restructure their cognitive structure to adapt to new external situations, and Niggard [84] proposed that knowledge application capacity is a necessary step to transform knowledge into practical application. It can truly transform information and resources into new products or new ideas of firms. Additionally, the research of Albort-Morant [85] and Xue [86] shows a positive correlation between the AC and green innovation of a firm. Therefore, this study argued that AC can promote the acquisition of green innovation knowledge by focal firms, promote the exchange and learning of green innovation technologies, cultivate green innovation capabilities, and improve GIP. Based on the above analysis, this study proposed the following hypothesis:
Hypothesis 3 (H3).
AC has a positive effect on GIP.
Combining Hypothesis 1: “network potential and GIP” Hypothesis 2: “network potential and AC”, and Hypothesis 3: “AC and GIP”, this study contends that AC has a partial mediating role between network potential and GIP and proposes the following hypotheses:
Hypothesis 4a (H4a).
AC plays a partial mediating role between NPC and GIP.
Hypothesis 4b (H4b).
AC plays a partial mediating role between NSR and GIP.
Hypothesis 4c (H4c).
AC plays a partial mediating role between NRC and GIP.

2.4. The Moderating Role of ET

We expected ET to moderate a focal firm’s AC and GIP. Contingency theory suggests an organization is an open subsystem in the social system and is affected by the environment [87]. Thus, the organization must take corresponding organizational and management measures to maintain the best adaptation to the environment. As an open system, organizational activities need to interact with the external environment in which the system is located. As one of the most important contingency factors for firm strategy and behavior, the external environment affects the implementation and results of the firm strategy [88]. Research from contingency theory found that organizational performance advantage comes from matching internal organizational design variables and external contextual variables [89,90]. Simsek [91] found that external environmental factors influence the impact of organizational learning on firm performance; therefore, the external environment is regarded as a key moderator that can change the relationship between organizational learning and firm performance. Thus, ET influences the effect of AC on the GIP of focal firms.
ET refers to the degree of changes in the firm’s technology, customer demand, and market competition intensity in the industry [46]. Hitt et al. [92] found that ET has increased the intensity of knowledge in a firm’s business process, and the importance and attention of knowledge have been continuously improved. Zhu et al. [93] asserted that firms’ product development teams require external knowledge for their activities in a highly volatile environment. Jansen et al. [94] found that in a rapidly changing turbulent environment, firms expand their internal knowledge base by introducing external knowledge; promote the understanding, integration, and application of knowledge in the new cognitive framework; and then promote the development of new products. Cassiman and Veugelers [95] proposed that the greater the ET, the more firms need to acquire and absorb various external resources, information, and knowledge in time to improve their innovation performance. Based on the above analysis, this study proposed the following hypothesis:
Hypothesis 5 (H5).
ET positively moderates the relationship between AC and GIP; that is, the higher the ET, the more significant the positive effect of AC on GIP.

2.5. The Moderated Mediation Effect

Hypotheses H4a, H4b, and H4c elaborate upon the mediating role of AC between network potential and GIP, and Hypothesis 5 elaborates upon the moderating effect of ET on the relationship between AC and innovation performance. This study further contends that ET may positively moderate the mediating role of AC. When ET is significant, AC has a greater impact on the GIP of the focal firm, and AC plays a stronger mediating role between the network potential and GIP. Conversely, when ET is low, AC may not impact the GIP of the focal firm. Based on the above analysis, this study proposed the following hypotheses:
Hypothesis 6a (H6a).
The mediating effect of AC on the relationship between NPC and GIP is moderated by ET; that is, the higher the ET, the stronger the mediating effect of AC.
Hypothesis 6b (H6b).
The mediating effect of AC on the relationship between NSR and GIP is moderated by ET; that is, the higher the ET, the stronger the mediating effect of AC.
Hypothesis 6c (H6c).
The mediating effect of AC on the relationship between NRC and GIP is moderated by ET; that is, the higher the ET, the stronger the mediating effect of AC.

2.6. The Theoretical Model

Based on the above research hypotheses, we constructed a theoretical model with network potential as the independent variable, GIP as the dependent variable, AC as the mediating variable, and ET as the moderating variable, as shown in Figure 1.

3. Research Design

3.1. Sample Selection and Data Collection

Before the final questionnaire design, we conducted a pretest of the preliminary version of the survey instrument to assess its suitability. Next, the study engaged ten executives and four scholars with domain expertise for their comments and suggestions regarding the questions and measures. Additionally, we invited 30 MBA students who were industry players to assess the suitability of the questions. Finally, we incorporated all of the feedback from these executives into a revised version of the survey instrument.
For the hypotheses testing, we drew our sample from Chinese high-tech manufacturing industries, namely, pharmaceutical manufacturing; aviation, spacecraft, and equipment manufacturing; manufacturing of electronic and communication equipment; computer and office equipment manufacturing; manufacturing of medical equipment and instruments; manufacturing of information chemicals. Therefore, the sample firms had strong innovation capabilities. The entire survey collection period lasted for 5 months (July 2019 to November 2019). To enhance the representativeness of the survey sample, we collected the survey data from four places in China: Zhejiang (East China), Guangdong (South China), Sichuan (West China), and Beijing (North China). Considering the stability of firm development, we mainly selected firms that had been established for at least 3 years as the research objects. Furthermore, the study adopted two approaches (i.e., online and offline) for data collection due to the range of geographic locations. First, we contacted firms in Sichuan via an offline approach (i.e., paper questionnaires). Second, we contacted firms in the other three places via an extensive online approach (i.e., sending emails or forwarding links to online questionnaires).
We invited middle- and high-level management personnel, who have a better understanding of the firm’s overall situation and the alliance status, to complete this survey. We used a purposive sampling method to select 700 (100 offline, 600 online) managers to respond to the survey, and 355 questionnaires were returned (76 offline, 279 online). The study deleted the missing answers, multiple choices, and questionnaire items that failed to meet the screening conditions. Overall, the study obtained 233 valid and unique questionnaires (65 offline, 168 online) of high-tech manufacturing firms across China, with a recovery rate of 33.29%. The statistical description of the samples is shown in Table 1. The sample selected in this study was widely distributed and had good representativeness.

3.2. Variable Measurement

The study adopted widely tested and validated scales from existing research to assess the relationships between the variables (see Appendix A, Table A1). Except for the control variables, we measured all the variables via a five-point Likert scale: 1 = strongly disagree, 2 = relatively disagree, 3 = neutral, 4 = relatively agree, and 5 = strongly agree. Additionally, we adopted the translation and the back-translation technique to authenticate the survey in Chinese and English.

3.2.1. Independent Variable: Network Potential

Network potential (NP) mainly refers to the research of Zhang et al. [11], Möller and Halinen [13], and Singh [14] and was measured using the three dimensions of NPC, NSR, and NRC, with a total of 12 measurement items.

3.2.2. Dependent Variable: Green Innovation Performance (GIP)

GIP refers to the research of Chen et al. [39] and Chang and Chen [96] and was measured using five items from the two aspects of green product innovation performance and green process innovation performance.

3.2.3. Mediating Variable: Absorptive Capacity (AC)

AC mainly refers to the research of Zahra and George [41] and Flatten et al. [97] and was measured using four items from four aspects: knowledge acquisition capacity, knowledge digestion capacity, knowledge transformation capacity, and knowledge application capacity.

3.2.4. Moderating Variable: ET

ET mainly refers to the research of Miller and Friesen [46] and Wheelwright and Clark [28] and was measured using five items from two aspects: technological turbulence and market turbulence.

3.2.5. Control Variable: Firm Age and Firm Scale

To focus on the relationship between the above-mentioned main variables, this study listed two control variables (i.e., firm age and firm scale) that may affect GIP. Table 1 displays a specific classification of the firm characteristics. Firm age was measured using the year of questionnaire recovery minus the year of establishment of the firm, and firm scale was measured using the natural logarithm of the number of employees.

4. Empirical Analysis

We used statistical software SPSS22.0 (IBM, Amunk, USA) and SPSS plug-in PROCESS v3.3 for the empirical analysis. This analysis was divided into four parts: common method bias testing, reliability testing, validity testing, correlation analysis, and hypothesis testing.

4.1. Common Method Bias (CMB) Testing

In this study, all items on the same questionnaire were completed by the same participant. This may result in CMB (i.e., homology errors). We used Harman’s single factor test to assess the data for potential CMB. According to the judgment method provided by Zhou and Long [98], all variables were combined for exploratory factor analysis. The analysis result of the factor without rotation showed no common factor in the factor structure. The first factor only explained 24.79% of the variation, which was less than the critical standard of 40%. Therefore, the common method bias of this study was not significant.

4.2. Reliability and Validity Testing

The purpose of reliability analysis is to check whether the scale data are authentic and credible; see Appendix A, Table A1 for the specific scale. We used Cronbach’s α coefficient and composite reliability (CR) to determine the reliability of the scale. As shown in Table 2, the factor loadings of all variables were above 0.5, and the Cronbach’s α coefficient and composite reliability of each variable were above 0.7, indicating that the scale had good internal consistency and stability. Thus, the scale had good reliability.
The purpose of validity analysis is to test whether the scale data are accurate and valid [99]. Validity analysis is mainly divided into content validity, convergent validity, and discriminant validity.
  • Content validity tests whether the subordinate items of each variable are reasonable. The scale of this study was modified regarding renowned mature scales and was pre-investigated and revised by experts; therefore, this scale had good content validity.
  • Convergent validity tests the correlation between the subordinate items of each variable and the variable. It is tested using factor loading and average variance extracted (AVE); the closer the factor loading is to 1, the higher the convergent validity of the scale. It can be seen from Table 2 that the factor loadings of the three dimensions of network potential (NPC, NSR, and NRC), AC, ET, and GIP all exceeded 0.7, and all AVE values exceeded 0.5. Therefore, the variables in this scale had good convergent validity.
  • Discriminant validity tests the degree of correlation between the subordinate items of each variable and other variables. Fornell and Larcker [100] proposed comparing the “average variance extracted (AVE) of each latent variable” with “the square of the correlation coefficient between the latent variable and other latent variables” to test the discriminant validity, namely, comparing the relative size of “the square root of a variable’s AVE” and “the correlation coefficient of this variable and other variables”. The data in parentheses are the square roots of AVE, and “other values” are the correlation coefficients between these variables and other variables. Because the square roots of AVE were all greater than “other values”, the variables of this scale had good discriminant validity (see Table 3).

4.3. Correlation Analysis

Table 3 shows the correlation coefficient matrix between the variables. The results show that the correlation coefficients between the variables were all less than 0.7, indicating no potential collinearity problem between the variables. It can be seen from Table 3 that the three dimensions of the network potential had significant positive correlations with AC, ET, and GIP, respectively; at the same time, AC had a significant positive correlation with GIP. The above results provide preliminary evidence for the study’s hypothesis testing.

4.4. Hypotheses Testing

To test the research hypothesis, we conducted a hierarchical regression analysis and bootstrap on the dataset. We followed Aiken and West [101], and standardized all independent, mediating, moderating, and dependent variables in the hierarchical regression models (see Table 4). The data in parentheses represent the t-value, and M1 to M8 represent the eight linear regression models. The baseline model (M1) contained the control variables of the study.

4.4.1. Direct Effect Testing

To test the research hypothesis, we conducted a hierarchical regression analysis on the sample data. Table 4 shows the results of the regression analysis. The coefficients shown in the table are all standardized coefficients. The data in parentheses represent the t-value, and M1 to M8 represent eight linear regression models.
As shown in Table 4, after introducing the three dimensions of network potential (NPC, NSR, and NRC) into M2, M2′s explanatory power was significantly improved compared to M1, the explanatory power of M2 was significantly higher than that of M1, and the R2 value increased from 0 to 0.235 and showed significance (from insignificant to the 0.001 significance level). This shows that the network position had a certain explanatory power for the GIP of firms. As can be seen from M2, the regression coefficient of NPC on GIP was β = 0.211 (p < 0.01), the regression coefficient of NSR on GIP was β = 0.199 (p < 0.01), and the regression coefficient of NRC to GIP was β = 0.235 (p < 0.001). These findings demonstrate that the three dimensions of network potential had a significant positive impact on GIP. Therefore, the research hypotheses H1a, H1b, and H1c were all verified.
It can be seen from Table 4 that, after introducing the three dimensions of network potential (NPC, NSR, and NRC) into M8, the explanatory power of M8 was significantly higher than that of M7. The R2 value increased from 0.018 to 0.395 and showed significance (increased from insignificant to the 0.001 significance level). This result shows that network potential had a certain explanatory power for AC. As can be seen from M8, the regression coefficient of NPC to AC was β = 0.135 (p < 0.05), the regression coefficient of NSR to AC was β = 0.174 (p < 0.01), and the regression coefficient of NRC to AC was β = 0.467 (p < 0.001). These findings demonstrate that the three dimensions of network potential had a significant positive impact on AC. Thus, the research hypotheses H2a, H2b, and H2c were all verified.
As shown in Table 4, after introducing AC into M4, the explanatory power of M4 was significantly improved compared to M1, and the R2 value increased from 0 to 0.149, which was significant (from insignificant to the 0.001 significance level). This result shows that AC had a certain explanatory power for GIP. Furthermore, as can be seen from M4, the regression coefficient of AC to GIP was β = 0.389 (p < 0.001). This result indicates that AC had a significant positive impact on GIP. Therefore, the research hypothesis H3 was verified.

4.4.2. Mediating Effect Testing

We used two methods to test the mediating effect. First, we drew on the step-by-step analysis method proposed by Baron and Kenny [102] to test the mediating role of AC in three steps. The first step was to test the significance of the regression coefficients between the independent variable (network potential) and the dependent variable (GIP). From Section 4.4.1, the three dimensions of the network potential (NPC, NSR, and NRC) had a significant positive impact on GIP; thus, the research hypotheses H1a, H1b, and H1c were all supported. The second step was to test the significance of the regression coefficient between the independent variable (network potential) and the mediating variable (AC). From Section 4.4.1, it can be seen that the three dimensions of the network potential had a significant positive impact on the AC; thus, the research hypotheses H2a, H2b, and H2c were all supported. The third step was to test the significance of the regression coefficient between the mediating variable (AC) and the dependent variable (GIP). From Section 4.4.1, it can be seen that AC had a significant positive impact on GIP; thus, the research hypothesis H3 was supported. From the above three-step regression analysis results, it can be seen that AC played a partially mediating role between the three dimensions of network potential and GIP. Therefore, the research hypotheses H4a, H4b, and H4c were all verified.
Additionally, to further verify the mediating effect of AC, we followed the recommendation of Edwards and Lambert [103] and adopted the bootstrap method and used the SPSS plug-in PROCESS v3.3 [104] to analyze the mediating role of AC between network potential and GIP. We selected Model 4 during this operation, set the bootstrap sample size to 5000, and set the confidence interval to 95%. All variables were standardized. Because the independent variable (network potential) contained three dimensions (NPC, NSR, and NRC), we divided it into three paths to analyze the mediating effect. At the same time, the other two dimensions of the independent variable that were not included in the respective mediating effect paths were placed in covariates for control. The running results are shown in Table 5. Table 5 shows that the total effect value, direct effect value, and indirect effect value of the three dimensions of network potential on GIP were all greater than 0, and no 95% confidence intervals contained 0. Put differently, the total, direct, and indirect effects of the three dimensions of network potential on GIP were significant. Hence, AC played a partial mediating role between the three dimensions of network potential and GIP. The research hypotheses H4a, H4b, and H4c were all further verified.

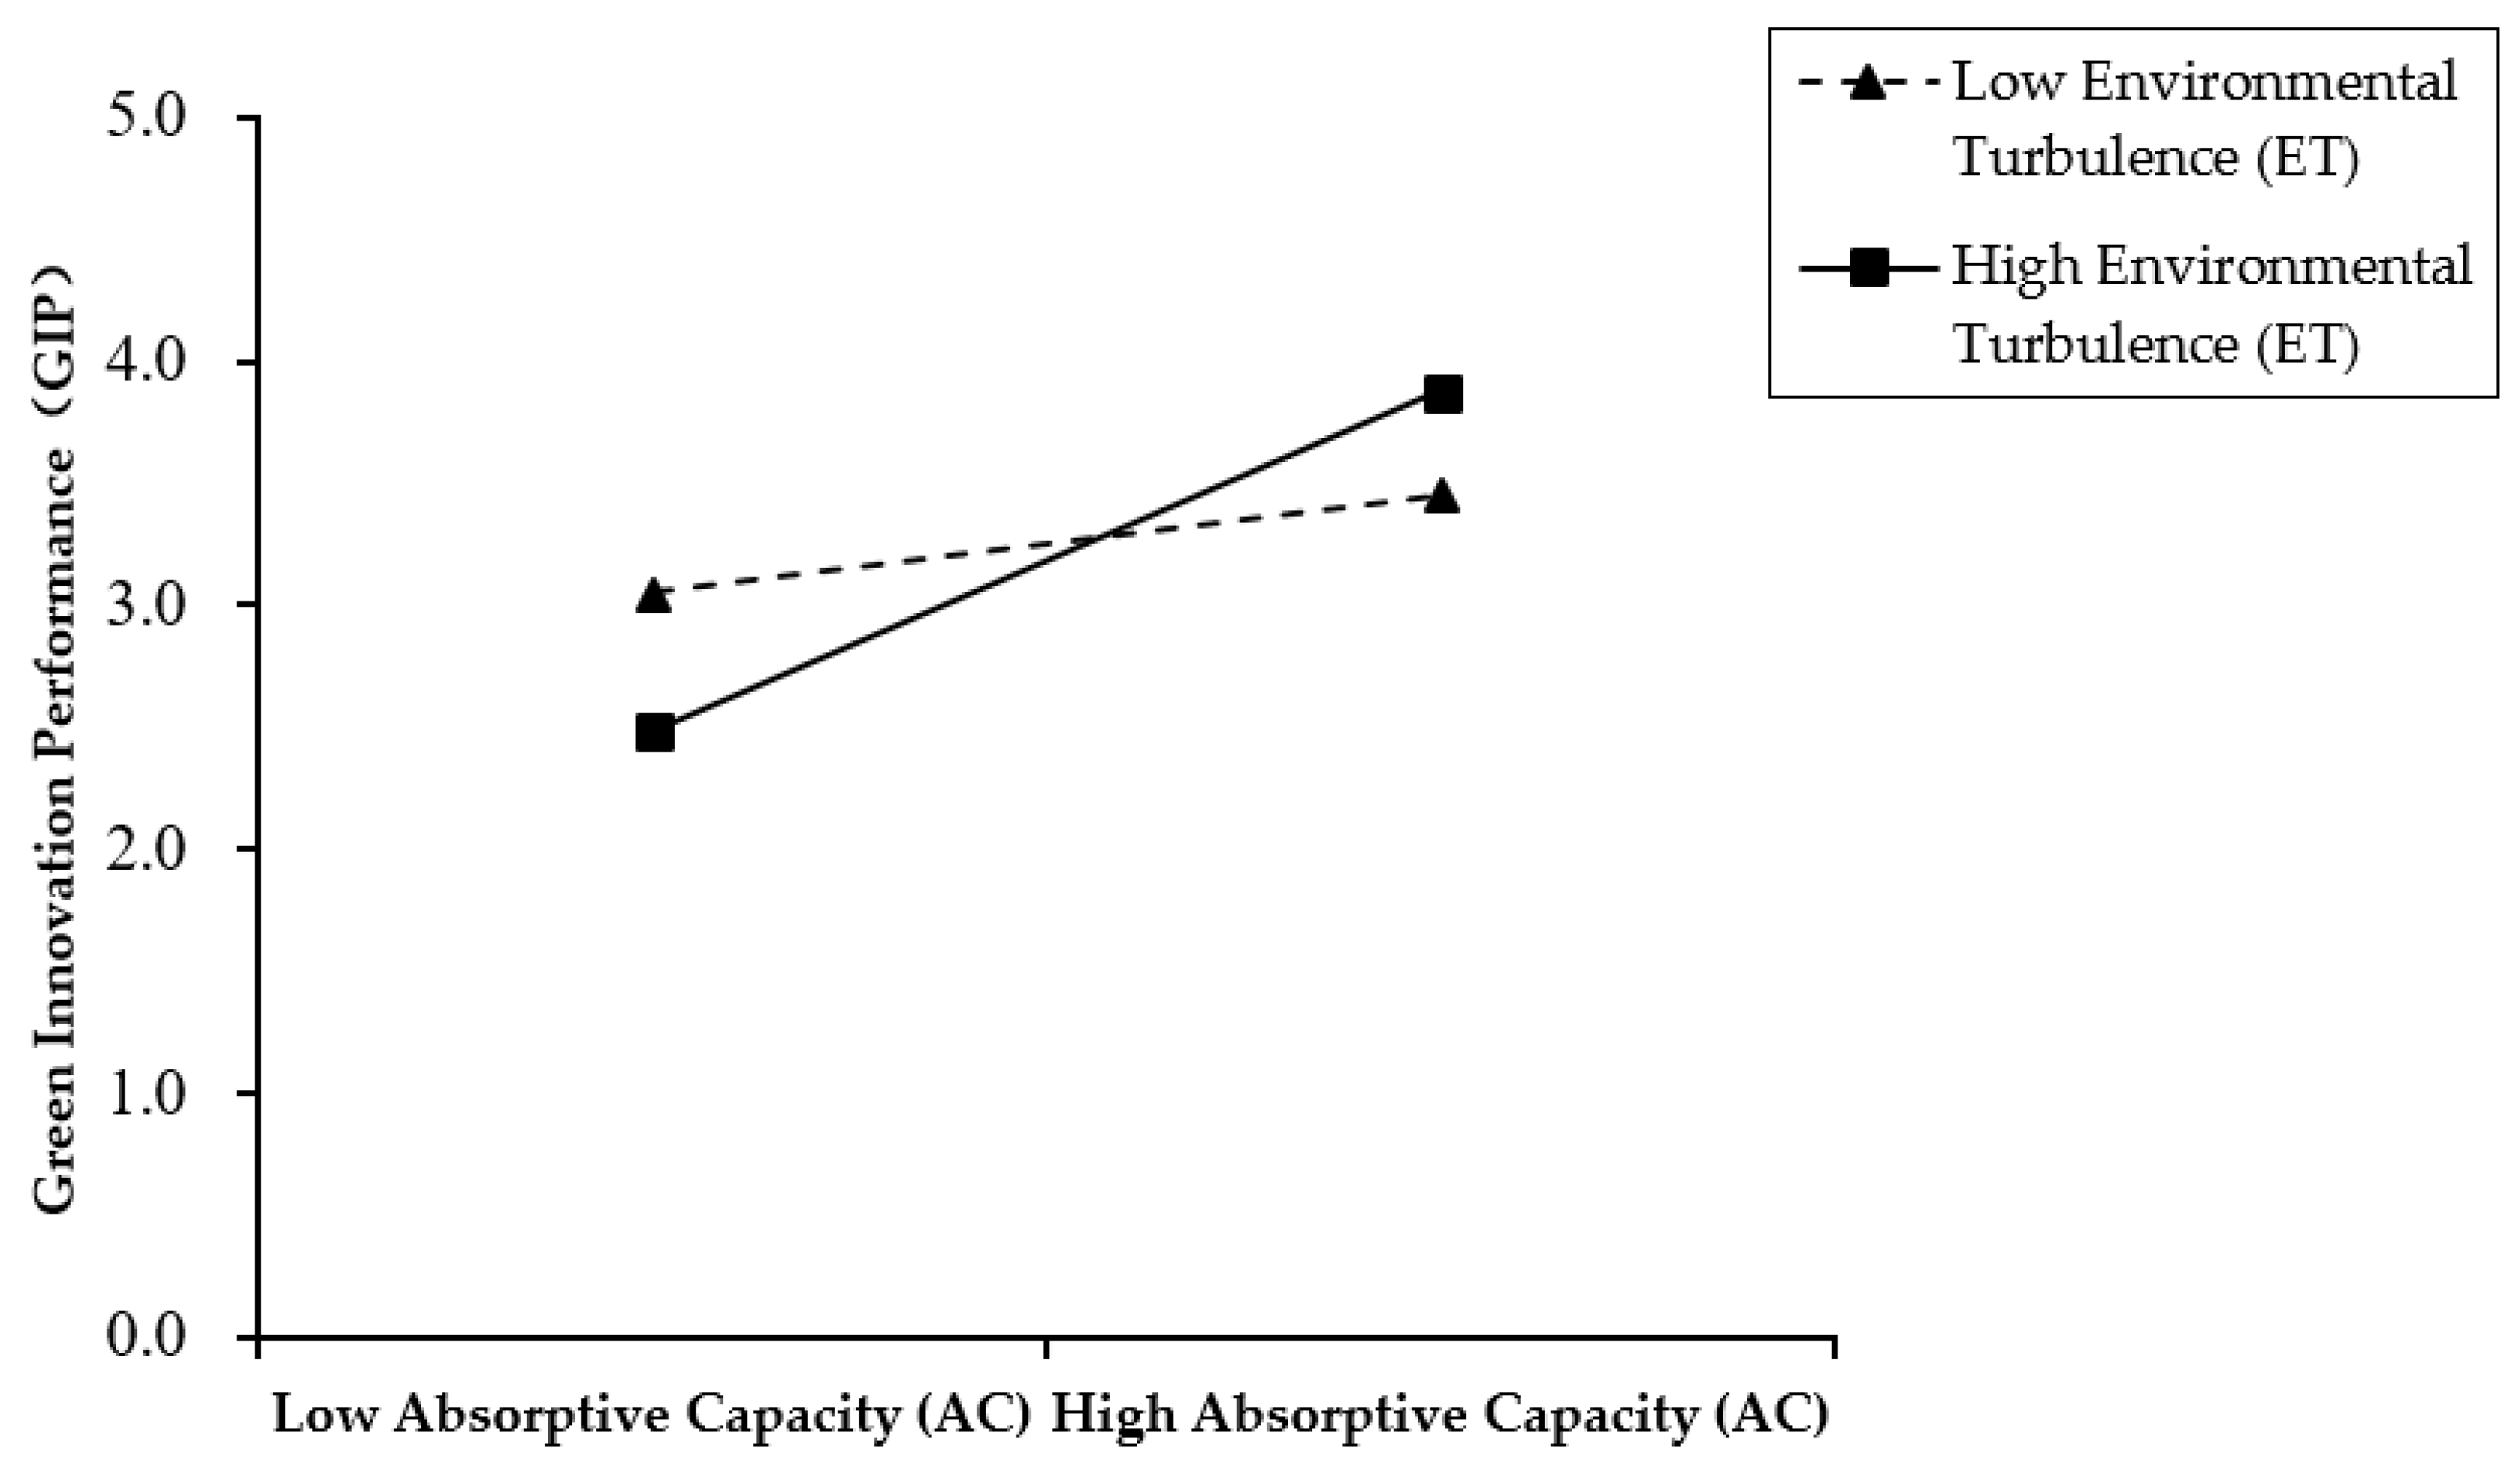
4.4.3. Moderating Effect Testing

We also used two methods to test the moderating effect. First, the hierarchical regression method was used to test the moderating effect of ET. As shown in Table 4, based on model M4, AC and the interaction term between AC and ET were added in sequence to construct models M5 and M6. To reduce the problem of multicollinearity, we handled the AC and ET centrally before constructing the interaction term. The R2 value of M4 was 0.149, and the R2 values of M5 and M6, respectively, were 0.153 and 0.200, indicating that the introduction of the moderating variable and interaction term enhanced the explanatory power of the model. As shown by M6, the regression coefficient of the interaction term on GIP was β = 0.221 (p < 0.001). Notably, the interaction between AC and ET had a significant positive impact on GIP; that is, ET positively moderated the relationship between AC and GIP. Therefore, the research hypothesis H5 was verified.
Additionally, to further verify the moderating effect of ET, according to the recommendations of Hayes [105], we used the SPSS plug-in PROCESS v3.3 to test the moderating effect, selecting Model 1 during this operation, setting the bootstrap sample size to 5000, and setting the confidence interval to 95%. At the same time, all variables were standardized, and the control variables and independent variables were put into covariates for control. We drew on the method of Aiken and West [101], adding one standard deviation to, and subtracting one standard deviation from, the mean value of the moderating variable (ET) to obtain two values of “high ET” and “low ET”, and produced a simple slope diagram of the moderating effect (see Figure 2). Figure 2 shows that, under different ET conditions, the impact of AC on GIP had different slopes. The slope of high ET was greater than the slope of low ET. Notably, the higher the ET, the more significant the positive impact of AC on GIP; that is, ET positively moderated the relationship between AC and GIP. Therefore, the research hypothesis H5 was further verified.

4.4.4. Moderated Mediation Effect Testing

Through Section 4.4.3, this study confirmed that ET positively moderated the relationship between AC and GIP, which is the premise of moderated mediation effect analysis [106]. According to the suggestion of Edwards and Lambert [103], this study adopted the bootstrap method and used the SPSS plug-in PROCESS v3.3 [105] to conduct moderated mediation effect testing. Model 14 was selected during this operation, the bootstrap sample size was set to 5000, and the confidence interval was set to 95%. All variables were standardized. Because the independent variable (network potential) contained three dimensions (NPC, NSR, and NRC), we divided it into three paths to analyze the moderated mediation effect. At the same time, the independent variable dimensions that were not included in the respective paths were put into covariates for control. PROCESS automatically generates the low value, mean value, and high value of the adjusted variable. The low and high values here refer, respectively, to the values derived by subtracting one standard deviation from the mean value of the moderating variable and adding one standard deviation to the mean. Through the PROCESS calculation, we obtained the conditional indirect effects of the three dimensions of the network potential in the case of different values (low, mean, and high) of the moderating variable (ET). Table 6 displays the specific results.
The left part of Table 6 shows that, when the moderating variable (ET) took a low value, the indirect effect of NPC on GIP through AC was 0.004, and the confidence interval [−0.026, 0.033] contained 0, indicating that the mediating effect corresponding to NPC was not significant in this case. When the ET took the mean value, the indirect effect of NPC on GIP through AC rose to 0.026, and the confidence interval [0.001, 0.059] did not contain 0, indicating that the mediating effect corresponding to NPC was significant in this case. When the ET took the high value, the indirect effect of NPC on GIP through AC rose to 0.048, and the confidence interval [0.005, 0.102] did not contain 0, indicating that the mediating effect corresponding to NPC was also significant in this case. The above analysis shows that ET moderated the mediating role of AC between NPC and GIP. The higher the ET, the stronger the mediating role of AC. In addition, from the right part of Table 6, the INDEX value representing the judgment index of the moderated mediation effect corresponding to NPC was equal to 0.022, and the confidence interval [0.001, 0.054] did not contain 0; therefore, the moderated mediation effect was significant. Thus, the research hypothesis H6a was verified. According to the above method, the moderated mediation effect corresponding to the other two dimensions of network potential (NSR and NRC) and the obtained two results were also significant. Therefore, the research hypotheses H6b and H6c were also verified.
Hayes [105] found that the moderated mediation effect of the second stage moderated mediation model, such as that used in this study, in mathematical terms, was a linear function of the moderating variable. Previous test methods (such as subgroup analysis and difference analysis method) can only show the indirect effects under several different values of the moderating variable [107]. However, it cannot fully reflect the full view of the indirect effects of the moderating variable (the moderating variable in this study was a continuous variable). We drew on the Johnson–Neyman method used by Preacher et al. [106] to address this shortcoming. By running the SPSS language program developed by Preacher et al. [106], we calculated specific values of the 95% confidence band and the significance region. Finally, we showed the indirect effect of the moderating variable (ET) as a continuous value in the form of a graph. The straight lines in the three graphs of Figure 3, Figure 4 and Figure 5, respectively, represent the mediating mediation effect corresponding to the three dimensions of the independent variable (NPC, NSR, and NRC), which were all linear functions of the moderating variable (ET); the dotted lines in the three graphs represent confidence bands.
As Figure 3 shows, when the value of ET was less than 4.199 (from a full score of 5 points), the indirect effect from NPC to GIP through AC was significant.
As Figure 4 shows, when the value of ET was less than 4.095 (from a full score of five points), the indirect effect from NSR to GIP through AC was significant.
As Figure 5 shows, when the value of ET was less than 4.306 (from a full score of five points), the indirect effect from NRC to GIP through AC was significant.

5. Conclusions and Discussion

5.1. Conclusions

Our study aims to advance the extant literature firm’s network characteristics as a performance driver of GIP, which, in turn, enhances their strategic goals and sustainable development. Specifically, we focus on network potential as a network locus based on manufacturing industries, which plays a substantial role in firms’ GIP. We further focus on the influencing role of AC as mediating and ET as moderated mediation in the network potential–GIP relations. Through the hypothetical relational model and empirical investigation, our study reveals that: (1) the dimensions of network potential (NPC, NSR, and NRC) had a significant positive effect on GIP and AC; (2) AC had a significant positive effect on GIP; (3) absorptive capability mediated the link between dimensions of network potential and GIP; (4) ET not only positively moderated the relationship between AC and GIP but also enhanced the mediating role of AC and results in a moderated mediation effect.

5.2. Theoretical Implications

This study contributes to the extant literature in several ways: First, this study empirically explored the impact of network potential (i.e., NPC, NSR, and NRC) on GIP in the Chinese high-tech manufacturing industry, while previous studies have investigated the association between network potential and innovation performance [12,61]. However, our empirical results from the regression and bootstrap analyses indicate that network potential influenced GIP. Thus, firms can enhance their GIP by promoting network potential. The findings indicate that network potential was a critical determinant of GIP. Hence, our study enriches the GIP literature from the perspective of network social theory.
Second, this study provides new insights into how a firm’s AC plays a mediating role in the network potential–GIP link. Our empirical results from the hierarchical regression and bootstrap analysis show that AC partially mediated the relationship between network potential and GIP. Collaborating with external allies can help firms to gather resources (i.e., knowledge and information) to influence organizational activities and compete with others. These findings provide an empirical basis for determining the mechanism of the association with AC. Additionally, our findings extend the antecedents and consequences of AC and offer a comprehensive picture of how AC promotes a firm’s GIP. Thus, our study contributes to organizational learning theory.
Third, scholars have widely examined the influence of ET on innovation performance [86], but little information is available on how ET in emerging economies affects the relationship between AC and GIP. Our findings indicate that ET positively moderated the link between AC and GIP. The results suggest that firms need external resources or knowledge to resolve ecological challenges and achieve GIP in a highly volatile environment. Thus, our study contributes to organizational contingency theory.
Fourth, our study makes a significant contribution to the research of testing methods. Previous testing methods (such as the subgroup analysis and difference analysis method) can only show the indirect effects under several different values of the moderating variable [107]. However, it cannot fully reflect the full view of the indirect effects of the moderating variable (the moderating variable in this study was a continuous variable). To address this shortcoming, we drew on the Johnson–Neyman method used by Preacher et al. [106] to calculate specific values of the 95% confidence band and the significance region and showed the indirect effect of the moderating variable (ET) as a continuous value in the form of a graph. This graphical approach has a unique advantage in that it can display the entire mediating effect.

5.3. Practical Implications

Besides the theoretical implications, we further point out the following three practical implications to practitioners. First, manufacturing firms should cultivate and improve their network potential. At the position level, firms should cultivate and enhance the centrality of their position or status in the network. At the structural level, firms should cultivate and strengthen the diversity of partners and the richness of direct connections in the network. At the relationship level, firms should develop and improve the closeness of their relationships with their partners in the network. By cultivating and enhancing the three dimensions of network potential, the GIP of the firm can be improved.
Second, manufacturing firms should pay attention to and enhance AC. Firms should pay attention to the acquisition and digestion of new knowledge to improve their innovation capabilities and levels. Furthermore, firms should focus on the application of new knowledge and its conversion into GIP. Thus, they can promote internal and external knowledge and transform it into GIP.
Third, manufacturing firms should quickly respond to the changes in the external environment. Because changes in the external environment are challenging to predict, firms should improve their capacity to cope with changes in the external environment. They should attach significant importance to changes in the external environment, such as changes in technology, customer demand, and market competition in the industry. Furthermore, they should promptly obtain and digest external resources, information, and knowledge to promote the development of new products, thereby enhancing the GIP of the firm.
Through insights of our investigated results, our study can further guide in setting the prerequisite scale for the GIP as the important indicator of green development in manufacturing-based industries. Thus, relevant managers can find enough knowledge about GIP to fine-tune their capability to utilize both internal and external knowledge for its enduring advantages. Setting this scale and policy by utilizing these antecedent factors and knowledge, the concerned department can regulate the manufacturing-based industries as an essential part of the ecology and promote its green development.

6. Limitations and Future Research Direction

Like other studies, this study is not without limitations. Based on the limitations, we thus pointed out some potential future research directions in improving the relevant literature. Among them, (1) the survey sample of this study was mainly selected from high-tech manufacturing industries. Therefore, these study results need to be further verified and discussed. Future research may consider expanding the scope of the examined industries to enhance the universality of the research conclusions. (2) This study only used horizontal cross-sectional data to conduct empirical research, which may be biased. Future research can consider using more precise and objective data and longitudinal research methods. (3) This study only examined the mediating effect of AC and the moderating effect of ET. Future research can consider identifying other mediating or moderating factors to reveal the mechanism of the effect of a focal firm’s network potential on GIP in more detail.

Author Contributions

In this study, S.S. and M.A.H. are responsible for conceptualization, data curation, data analysis, methodology, and manuscript preparation. S.S. is responsible for the literature review, funding acquisition, and formatting the manuscript. X.Y. is responsible for funding acquisition, resources, investigation, resources, Visualization, and Writing—review & editing. M.S.H. is responsible for Visualization, Validation, Writing—review & editing. All authors have read and agreed to the published version of the manuscript.

Funding

This study was funded by the National Natural Science Fund of China (Grant number 71572028; 71872027), and Major Projects of the National Social Science Fund (Grant number 17ZDA051).

Institutional Review Board Statement

Not applicable.

Informed Consent Statement

Not applicable.

Data Availability Statement

Data are available on request from the author S.S.

Conflicts of Interest

The authors declare no conflict of interest.

Appendix A

Table A1. Measurement items.
Variable ItemSpecific Expression
Network position centrality (NPC)NPC1 Our firm has a high reputation in the alliance network.
NPC2Many firms are willing to cooperate with our firm.
NPC3The contact between partners is often through our firm.
NPC4When technical advice or technical support is needed, partners often seek help from our firm.
Network structure richness (NSR)NSR1 Our firm has more partners.
NSR2The types of partners of our firm are relatively diverse.
NSR3The proportion of direct connections between our firm and its partners is relatively high.
NSR4More information and knowledge are flowing in the cooperation network of our firm.
Network relationship closeness (NRC)NRC1 The relationship between our firm and its partners is stable and involves mutual trust.
NRC2Our firm has frequent exchanges with partners.
NRC3Partners will not take advantage of our firm’s weaknesses for profit.
NRC4Partners and our firm often solve problems together.
Green innovation performance (GIP)GIP 1 Our firm selects product materials that produce the least pollution for product development or design.
GIP2Our firm chooses product materials that consume the least energy and resources for product development or design.
GIP 3When conventional methods fail, our firm will adopt new environmental management practices.
GIP 4During the production process, our firm can effectively reduce the discharge of harmful substances or waste.
GIP 5During the production process, our firm will recycle waste and emissions to process and reuse them.
Absorptive capacity (AC)AC1 Our firm can quickly and effectively obtain useful knowledge and information from the outside world.
AC2Our firm can quickly analyze and understand newly acquired technologies and knowledge.
AC3Our firm can effectively integrate its existing relevant knowledge and technology with newly digested technology and knowledge.
AC4Our firm can quickly apply the new technologies and knowledge that it has mastered to actual research and development or production.
Environmental turbulence (ET)ET1 In the industry where our firm is located, the speed of technology change is very fast.
ET2In the industry where our firm is located, it is difficult to predict the direction of technological development five years ahead.
ET3In the industry where our firm is located, products or services are updated quickly.
ET4In the industry where our firm is located, the needs and preferences of customers often change.
ET5In the industry where our firm is located, market competition is very fierce and the price is the main means of competition.

References

  1. Xing, X.P.; Liu, T.S.; Wang, J.H. The Impact of Green Organizational Identity on Green Innovation Performance in Manufacturing Firms—A Chain-Mediating Role of Environmental Commitment and Sustainable Exploration/ Exploitation Practices. Sci. Technol. Prog. Policy 2020, 37, 91–99. [Google Scholar]
  2. Anderson, N.; Potočnik, K.; Zhou, J. Innovation and Creativity in Organizations: A State-of-the-Science Review, Prospective Commentary, and Guiding Framework. J. Manag. 2014, 40, 1297–1333. [Google Scholar] [CrossRef] [Green Version]
  3. Zhang, D.; Rong, Z.; Ji, Q. Green innovation and firm performance: Evidence from listed companies in China. Resour. Conserv. Recycl. 2019, 144, 48–55. [Google Scholar] [CrossRef]
  4. Wang, C.-H. How organizational green culture influences green performance and competitive advantage: The mediating role of green innovation. J. Manuf. Technol. Manag. 2019, 30, 666–683. [Google Scholar] [CrossRef]
  5. Granovetter, M. Economic Action and Social Structure: The Problem of Embeddedness. Am. J. Soc. 1985, 91, 481–510. [Google Scholar] [CrossRef]
  6. Dyer, J.H.; Kale, P.; Singh, H. How to Make Strategic Alliances Work. MIT Sloan Manag. Rev. 2001, 42, 37–43. [Google Scholar]
  7. Hoffmann, W.H. Strategies for managing a portfolio of alliances. Strateg. Manag. J. 2007, 28, 827–856. [Google Scholar] [CrossRef]
  8. Faems, D.; Janssens, M.; Neyens, I. Alliance Portfolios and Innovation Performance: Connecting Structural and Managerial Perspectives. Group Organ. Manag. 2012, 37, 241–268. [Google Scholar] [CrossRef]
  9. Andrevski, G.; Brass, D.J.; Ferrier, W.J. Alliance portfolio configurations and competitive action frequency. J. Manag. 2016, 42, 811–837. [Google Scholar] [CrossRef]
  10. Asgari, N.; Singh, K.; Mitchell, W. Alliance portfolio reconfiguration following a technological discontinuity. Strateg. Manag. J. 2017, 38, 1062–1081. [Google Scholar] [CrossRef]
  11. Zhang, H.; Wang, H.C.; Yu, S.T. The Influence of network potential on innovation performance of cluster enterprises: The mediating role of organizational learning. Sci. Technol. Prog. Policy 2015, 32, 81–85. [Google Scholar]
  12. Owen-Smith, J.; Powell, W.W. Knowledge Networks as Channels and Conduits: The Effects of Spillovers in the Boston Biotechnology Community. Organ. Sci. 2004, 15, 5–21. [Google Scholar] [CrossRef] [Green Version]
  13. Möller, K.K.; Halinen, A. Business Relationships and Networks: Managerial Challenges of Network Era. Ind. Mark. Manag. 1999, 28, 413–427. [Google Scholar] [CrossRef]
  14. Singh, J. Collaborative Networks as Determinants of Knowledge Diffusion Patterns. Manag. Sci. 2005, 51, 756–770. [Google Scholar] [CrossRef] [Green Version]
  15. Gilsing, V.; Nooteboom, B. Density and strength of ties in innovation networks: An analysis of multimedia and biotechnology. Eur. Manag. Rev. 2005, 2, 179–197. [Google Scholar] [CrossRef] [Green Version]
  16. Liao, Z.J.; Long, S.Y. Can interfirm trust improve firms’ cooperation on environmental innovation? The moderating role of environmental hostility. Bus. Strategy Environ. 2019, 28, 198–205. [Google Scholar] [CrossRef] [Green Version]
  17. Albort-Morant, G.; Leal-Millán, A.; Cepeda-Carrión, G. The antecedents of green innovation performance: A model of learning and capabilities. J. Bus. Res. 2016, 69, 4912–4917. [Google Scholar] [CrossRef]
  18. Zhao, Y.H.; Feng, T.W.; Shi, H.B. External involvement and green product innovation: The moderating role of environmental uncertainty. Bus. Strategy Environ. 2018, 27, 1167–1180. [Google Scholar] [CrossRef]
  19. Mohr, J.J.; Sengupta, S. Managing the paradox of inter-firm learning: The role of governance mechanisms. J. Bus. Ind. Mark. 2002, 17, 282–301. [Google Scholar] [CrossRef]
  20. Tang, M.F.; Walsh, G.; Lerner, D.; Fitza, M.A.; Li, Q.H. Green Innovation, Managerial Concern and Firm Performance: An Empirical Study. Bus. Strategy Environ. 2017, 27, 39–51. [Google Scholar] [CrossRef]
  21. De Marchi, V. Environmental innovation and R&D cooperation: Empirical evidence from Spanish manufacturing firms. Res. Policy 2012, 41, 614–623. [Google Scholar]
  22. Martínez-Ros, E.; Kunapatarawong, R. Green innovation and knowledge: The role of size. Bus. Strategy Environ. 2019, 28, 1045–1059. [Google Scholar] [CrossRef]
  23. Mousavi, S.; Bossink, B.; Van Vliet, M. Microfoundations of companies’ dynamic capabilities for environmentally sustainable innovation: Case study insights from high-tech innovation in science-based companies. Bus. Strategy Environ. 2019, 28, 366–387. [Google Scholar] [CrossRef]
  24. Westerlund, M.; Rajala, R. Learning and innovation in inter-organizational network collaboration. J. Bus. Ind. Mark. 2010, 25, 435–442. [Google Scholar] [CrossRef]
  25. Pavlou, P.A.; Sawy, O.A.E. From IT Leveraging Competence to Competitive Advantage in Turbulent Environments: The Case of New Product Development. Inf. Syst. Res. 2006, 17, 198–229. [Google Scholar] [CrossRef]
  26. Bourgeois, L.J. Strategy and Environment: A Conceptual Integration. Acad. Manag. Rev. 1980, 5, 25–39. [Google Scholar] [CrossRef]
  27. Dess, G.G.; Davis, P.S. Porter’s generic strategies as determinants of strategic group membership and organizational performance. Acad. Manag. J. 1984, 27, 467–488. [Google Scholar]
  28. Wheelwright, S.C.; Clark, K.B. Creating project plans to focus product development. Harvard Bus. Rev. 1992, 70, 70–82. [Google Scholar]
  29. Wang, L.W.; Yeung, J.H.Y.; Zhang, M. The impact of trust and contract on innovation performance: The moderating role of environmental uncertainty. Int. J. Prod. Econ. 2011, 134, 114–123. [Google Scholar] [CrossRef]
  30. Hung, K.-P.; Chou, C. The impact of open innovation on firm performance: The moderating effects of internal R&D and environmental turbulence. Technovation 2013, 33, 368–380. [Google Scholar]
  31. Newton, I. The Mathematical Principles of Natural Philosophy; Motte, A., Translator; Daniel Adee: New York, NY, USA, 1846. [Google Scholar]
  32. Ravenstein, E.G. The Laws of Migration. J. Stat. Soc. Lond. 1885, 48, 167–235. [Google Scholar] [CrossRef]
  33. Cai, X.Y.; Zhang, W.J. Research on Enterprise Potential Theory. China Bus. Mark. 2008, 08, 53–55. [Google Scholar]
  34. Farrell, M.J. The measurement of productive efficiency. J. R. Stat. Soc. 1957, 120, 253–290. [Google Scholar] [CrossRef]
  35. Drucker, P.F. Post-Capitalist Society; Butterworth-Heinemann Elsevier Ltd.: Oxford, UK, 1993. [Google Scholar]
  36. Jantunen, A. Knowledge-processing capabilities and innovation performance: An empirical study. Eur. J. Innov. Manag. 2005, 8, 336–349. [Google Scholar] [CrossRef]
  37. Wu, C.; Yang, S.W.; Tang, P.C.; Wu, T.; Fu, S.K. Construction of the efficiency promotion model of green innovation in China’s heavy polluted industries. China Popul. Resour. Environ. 2018, 28, 40–48. [Google Scholar]
  38. Schiederig, T.; Tietze, F.; Herstatt, C. Green innovation in technology and innovation management—An exploratory literature Review. RD Manag. 2012, 42, 180–192. [Google Scholar]
  39. Chen, Y.-S.; Lai, S.-B.; Wen, C.-T. The Influence of Green Innovation Performance on Corporate Advantage in Taiwan. J. Bus. Ethics 2006, 67, 331–339. [Google Scholar] [CrossRef]
  40. Cohen, W.M.; Levinthal, D.A. Absorptive capacity: A new perspective on learning and innovation. Adm. Sci. Q. 1990, 35, 128–152. [Google Scholar] [CrossRef]
  41. Zahra, S.A.; George, G. Absorptive Capacity: A Review, Reconceptualization, and Extension. Acad. Manag. Rev. 2002, 27, 185–203. [Google Scholar] [CrossRef] [Green Version]
  42. Lane, P.J.; Koka, B.R.; Pathak, S. The reification of absorptive capacity: A critical review and rejuvenation of the construct. Acad. Manag. Rev. 2006, 31, 833–863. [Google Scholar] [CrossRef]
  43. Aldieri, L.; Sena, V.; Vinci, C.P. Domestic R&D spillovers and absorptive capacity: Some evidence for US. Europe and Japan. Int. J. Prod. Econ. 2018, 198, 38–49. [Google Scholar]
  44. Daft, R.L.; Sormunen, J.; Parks, D. Chief Executive Scanning, Environmental Characteristics, and Company Performance: An Empirical Study. Strateg. Manag. J. 1988, 9, 123–139. [Google Scholar] [CrossRef]
  45. Cukrowski, J.; Fischer, M.M. Information-Processing, technological progress and retail markets dynamics. Inf. Econ. Policy 2002, 14, 1–20. [Google Scholar] [CrossRef] [Green Version]
  46. Duncan, R.B. Characteristics of Organizational Environments and Perceived Environmental Uncertainty. Adm. Sci. Q. 1972, 17, 313–327. [Google Scholar] [CrossRef] [Green Version]
  47. Miller, D.; Friesen, P.H. Strategy-making and environment: The third link. Strateg. Manag. J. 1983, 4, 221–235. [Google Scholar] [CrossRef]
  48. Jaworski, B.J.; Kohli, A.K. Market orientation: Antecedents and consequences. J. Mark. 1993, 57, 53–70. [Google Scholar] [CrossRef]
  49. Keats, B.W.; Hitt, M.A. A Causal Model of Linkages among Environmental Dimensions, Macro Organizational Characteristics, and Performance. Acad. Manag. J. 1988, 31, 570–598. [Google Scholar]
  50. Cook, K.S.; Whitmeyer, J.M. Two Approaches to Social Structure: Exchange Theory and Network Analysis. Annu. Rev. Soc. 1992, 18, 109–127. [Google Scholar] [CrossRef]
  51. Tutić, A.; Wiese, H. Reconstructing Granovetter’s network theory. Soc. Netw. 2015, 43, 136–148. [Google Scholar] [CrossRef]
  52. Capaldo, A. Network structure and innovation: The leveraging of a dual network as a distinctive relational capability. Strateg. Manag. J. 2007, 28, 585–608. [Google Scholar] [CrossRef] [Green Version]
  53. Lavie, D. Alliance portfolios and firm performance: A study of value creation and appropriation in the U.S. software industry. Strateg. Manag. J. 2007, 28, 1187–1212. [Google Scholar] [CrossRef]
  54. Burt, R. Structural Holes: The Social Structure of Competition; Harvard University Press: Cambridge, MA, USA, 1992. [Google Scholar]
  55. Coccia, M. Sources of technological innovation: Radical and incremental innovation problem-driven to support competitive advantage of firms. Technol. Anal. Strateg. Manag. 2017, 29, 1048–1061. [Google Scholar] [CrossRef]
  56. Tsai, W.; Ghoshal, S. Social Capital and, Value Creation: The Role of Intrafirm Networks. Acad. Manag. J. 1998, 41, 464–476. [Google Scholar]
  57. Bell, G.G. Clusters, Networks, and Firm Innovativeness. Strateg. Manag. J. 2005, 26, 287–295. [Google Scholar] [CrossRef]
  58. Uzzi, B. Social structure and competition in inter firm networks: The paradox of embeddedness. Adm. Sci. Q. 1997, 42, 35–67. [Google Scholar] [CrossRef]
  59. Gnyawali, D.R.; Madhavan, R. Cooperative Networks and Competitive Dynamics: A Structural Embeddedness Perspective. Acad. Manag. Rev. 2001, 26, 431–445. [Google Scholar] [CrossRef]
  60. Baum, A.C.J.; Cowan, R.; Jonard, N. Network-independent partner selection and the evolution of innovation networks. Manag. Sci. 2010, 56, 2094–2110. [Google Scholar] [CrossRef] [Green Version]
  61. Obstfeld, D. Knowledge Creation, Social Networks and Innovation: An Integrative Study. Acad. Manag. Proc. 2002, H1–H6. [Google Scholar] [CrossRef]
  62. Morgan, R.M.; Hunt, S. Relationship-Based Competitive Advantage: The Role of Relationship Marketing in Marketing Strategy. J. Bus. Res. 1999, 46, 281–290. [Google Scholar] [CrossRef]
  63. Powell, W.W.; Koput, K.W.; Smith-Doerr, L. Interorganizational Collaboration and the Locus of Innovation: Networks of Learning in Biotechnology. Adm. Sci. Q. 1996, 41, 116–145. [Google Scholar] [CrossRef] [Green Version]
  64. Tsai, W. Knowledge Transfer in Intra-organizational Networks: Effects of Network Position and Absorptive Capacity on Business Unit Innovation and Performance. Acad. Manag. J. 2001, 44, 996–1004. [Google Scholar]
  65. Bengtsson, M.; Sölvell, Ö. Climate of competition, clusters and innovative performance. Scand. J. Manag. 2004, 20, 225–244. [Google Scholar] [CrossRef]
  66. Dhanasai, C.; Parkhe, A. Orchestrating Innovation Networks. Acad. Manag. Rev. 2006, 31, 659–669. [Google Scholar]
  67. Chen, G.Q. Time-Space Theory of Organizational Learning. Technol. Econ. 2016, 35, 15–23. [Google Scholar]
  68. Chen, G.Q.; Xiang, S.T. Organizational Learning Theory Based on Space Dimension: A Model of Organizational learning from External Entity. Technol. Econ. 2017, 36, 1–13. [Google Scholar]
  69. Inkpen, A.C.; Tsang, E.W.K. Social Capital, Networks, and Knowledge Transfer. Acad. Manag. 2005, 30, 146–165. [Google Scholar] [CrossRef] [Green Version]
  70. Hansen, M.T. Knowledge Networks: Explaining Effective Knowledge Sharing in Multiunit Companies. Organ. Sci. 2002, 13, 232–248. [Google Scholar] [CrossRef]
  71. Baum, J.A.C.; Ingram, P. Survival-Enhancing Learning in the Manhattan Hotel Industry, 1898–1980. Manag. Sci. 1998, 44, 996–1016. [Google Scholar] [CrossRef]
  72. Greve, H.R. Interorganizational Learning and Heterogeneous Social Structure. Organ. Stud. 2005, 26, 1025–1047. [Google Scholar] [CrossRef]
  73. Salman, N.; Saives, A.-L. Indirect networks: An intangible resource for biotechnology innovation. R D Manag. 2005, 35, 203–215. [Google Scholar] [CrossRef]
  74. Cummings, J.N. Work Groups, Structural Diversity, and Knowledge Sharing in a Global Organization. Manag. Sci. 2004, 50, 352–364. [Google Scholar] [CrossRef] [Green Version]
  75. Ahuja, G. Collaboration Networks, Structural Holes, and Innovation: A Longitudinal Study. Adm. Sci. Q. 2000, 45, 425–455. [Google Scholar] [CrossRef] [Green Version]
  76. Ahuja, G. The duality of collaboration: Inducements and opportunities in the formation of interfirm linkages. Strateg. Manag. J. 2000, 21, 317–343. [Google Scholar] [CrossRef]
  77. Levin, D.Z.; Cross, R. The Strength of Weak Ties You Can Trust: The Mediating Role of Trust in Effective Knowledge Transfer. Manag. Sci. 2004, 50, 1477–1490. [Google Scholar] [CrossRef] [Green Version]
  78. Yli-Renko, H.; Autio, E.; Tontti, V. Social capital, knowledge, and the international growth of technology-based new firms. Int. Bus. Rev. 2002, 11, 279–304. [Google Scholar] [CrossRef]
  79. Katila, R.; Ahuja, G. Something Old, Something New: A Longitudinal Study of Search Behavior and New Product Introduction. Acad. Manag. J. 2002, 45, 1183–1194. [Google Scholar]
  80. Powell, T.C. Organizational alignment as competitive advantage. Strateg. Manag. J. 1992, 13, 119–134. [Google Scholar] [CrossRef]
  81. Stock, G.N.; Greis, N.P.; Fischer, W.A. Absorptive capacity and new product development. J. High Technol. Manag. Res. 2001, 12, 77–91. [Google Scholar] [CrossRef]
  82. Atuahene-Gima, K. The effects of centrifugal and centripetal forces on product development speed and quality: How does problem solving matter? Acad. Manag. J. 2003, 46, 359–373. [Google Scholar] [CrossRef]
  83. Todorova, G.; Durisin, B. Absorptive capacity: Valuing a reconceptualization. Acad. Manag. Rev. 2007, 32, 774–786. [Google Scholar] [CrossRef]
  84. Niggard, H. Networking Activities in Technology-based Entrepreneurial Teams. Int. Small Bus. J. 2005, 23, 257–278. [Google Scholar]
  85. Albort-Morant, G.; Leal-Rodríguez, A.L.; De Marchi, V. Absorptive capacity and relationship learning mechanisms as complementary drivers of green innovation performance. J. Knowl. Manag. 2018, 22, 432–452. [Google Scholar] [CrossRef]
  86. Xue, M.; Boadu, F.; Xie, Y. The Penetration of Green Innovation on Firm Performance: Effects of Absorptive Capacity and Managerial Environmental Concern. Sustainability 2019, 11, 2455. [Google Scholar] [CrossRef] [Green Version]
  87. Luthans, F. The contingency theory of management: A path out of the jungle. Bus. Horiz. 1973, 16, 67–72. [Google Scholar] [CrossRef]
  88. Boyd, B.K.; Haynes, K.T.; Hitt, M.A.; Bergh, D.D.; Ketchen, D.J. Contingency Hypotheses in Strategic Manag. Research: Use, Disuse, or Misuse? J. Manag. 2012, 38, 278–313. [Google Scholar]
  89. Aragon-Correa, J.A.; Sharma, S. A Contingent Resource-Based View of Proactive Corporate Environmental Strategy. Acad. Manag. Rev. 2003, 28, 71–88. [Google Scholar] [CrossRef] [Green Version]
  90. Martinez-del-Rio, J.; Antolin-Lopez, R.; Cespedes-Lorente, J.J. Being Green Against the Wind? The Moderating Effect of Munificence on Acquiring Environmental Competitive Advantages. Organ. Environ. 2015, 28, 181–203. [Google Scholar] [CrossRef]
  91. Simsek, Z. Organizational Ambidexterity: Towards a Multilevel Understanding. J. Manag. Stud. 2009, 46, 597–624. [Google Scholar] [CrossRef]
  92. Hitt, M.A.; Keats, B.W.; DeMarie, S.M. Navigating in the New Competitive Landscape: Building Strategic Flexibility and Competitive Advantage in the 21st Century. Acad. Manag. Exec. 1998, 12, 22–42. [Google Scholar] [CrossRef]
  93. Zhu, X.M.; Jiang, Y.; Du, Z.W.; Lu, Q.W. A Study on the Impact of KM Processes on New Product Development Performance. J. Ind. Eng. Eng. Manag. 2011, 25, 113–122. [Google Scholar]
  94. Jansen, J.J.P.; Van Den Bosch, F.A.J.; Volberda, H.W. Managing Potential and Realized Absorptive Capacity: How Do Organizational Antecedents Matter? Acad. Manag. J. 2005, 48, 999–1015. [Google Scholar] [CrossRef] [Green Version]
  95. Cassiman, B.; Veugelers, R. In Search of Complementarity in Innovation Strategy: Internal R&D and External Knowledge Acquisition. Manag. Sci. 2006, 52, 68–82. [Google Scholar]
  96. Chang, C.-H.; Chen, Y.-S. Green organizational identity and green innovation. Manag. Decis. 2013, 51, 1056–1070. [Google Scholar] [CrossRef]
  97. Flatten, T.C.; Engelen, A.; Zahra, S.A.; Brettel, M. A measure of absorptive capacity: Scale development and validation. Eur. Manag. J. 2011, 29, 98–116. [Google Scholar] [CrossRef]
  98. Zhou, H.; Long, L.R. Statistical Remedies for Common Method Biases. Adv. Psychol. Sci. 2004, 12, 942–950. [Google Scholar]
  99. Ren, Z.; Zhan, K.; Francis, B.; Liu, Y. The Effects of Boundary-Spanning Search, Network Ties, and Absorptive Capacity for Innovation: A Moderated Mediation Examination. Sustainability 2018, 10, 3980. [Google Scholar]
  100. Fornell, C.; Larcker, D.F. Evaluating Structural Equation Models with Unobservable Variables and Measurement Error. J. Mark. Res. 1981, 18, 39–50. [Google Scholar] [CrossRef]
  101. Aiken, L.S.; West, S.G. Multiple Regression: Testing and Interpreting Interactions; Sage Publications: Los Angeles, CA, USA, 1991. [Google Scholar]
  102. Baron, R.M.; Kenny, D.A. The moderator–mediator variable distinction in social psychological research: Conceptual, strategic, and statistical considerations. J. Personal. Soc. Psychol. 1986, 51, 1173–1182. [Google Scholar] [CrossRef]
  103. Edwards, J.R.; Lambert, L.S. Methods for integrating moderation and mediation: A general analytical framework using moderated path analysis. Psychol. Methods 2007, 12, 1–22. [Google Scholar] [CrossRef] [PubMed] [Green Version]
  104. Hayes, A.F. Beyond Baron and Kenny: Statistical Mediation Analysis in the New Millennium. Commun. Monogr. 2009, 76, 408–420. [Google Scholar] [CrossRef]
  105. Hayes, A.F. An Index and Test of Linear Moderated Mediation. Multivar. Behav. Res. 2015, 50, 1–22. [Google Scholar] [CrossRef]
  106. Preacher, K.J.; Rucker, D.D.; Hayes, A.F. Addressing Moderated Mediation Hypotheses: Theory, Methods, and Prescriptions. Multivar. Behav. Res. 2007, 42, 185–227. [Google Scholar] [CrossRef]
  107. Fang, J.; Zhang, M.Q.; Gu, H.L.; Liang, D.M. Moderated Mediation Model Analysis Based on Asymmetric Interval. Adv. Psychol. Sci. 2014, 22, 1660–1668. [Google Scholar] [CrossRef]
Figure 1. The theoretical model.
Sustainability 13 07765 g001
Figure 2. The moderating effect of ET.
Sustainability 13 07765 g002
Figure 3. The moderated mediation effect from NPC to GIP.
Sustainability 13 07765 g003
Figure 4. The moderated mediation effect from NSR to GIP.
Sustainability 13 07765 g004
Figure 5. The moderated mediation effect from NRC to GIP.
Sustainability 13 07765 g005
Table 1. Descriptive statistics of the sample.
CharacteristicCategoryFrequencyPercentage
Firm age3 to 5 years177.30%
6 to 9 years3515.02%
10 to 19 years10545.06%
20 years and above7632.62%
IndustryPharmaceutical manufacturing4619.74%
Aviation, spacecraft, and equipment manufacturing3213.73%
Manufacturing of electronic and communication equipment6126.18%
Computer and office equipment manufacturing5322.75%
Manufacturing of medical equipment and instruments2912.45%
Manufacturing of information chemicals125.15%
Firm size99 people and below219.01%
100 to 299 people7130.47%
300 to 999 people8436.05%
1000 to 2999 people3113.30%
3000 people and above2611.16%
R&D investmentLess than 3%2611.16%
3% (inclusive) to 5%8837.77%
5% (inclusive) to 10%7933.91%
10% and above4017.17%
Number of alliances2 to 56226.61%
6 to 99440.34%
10 to 195121.89%
20 to 49156.44%
50 and above114.72%
AreaZhejiang (East China)5624.03%
Guangdong (South China)6126.18%
Sichuan (West China)6527.90%
Beijing (North China)5121.89%
Note: n = 233, R&D—research and development.
Table 2. Properties of the measurement model.
VariableItemFactor LoadingCronbach’s αCRAVE
NPCNPC10.8550.8840.8870.662
NPC20.816
NPC30.806
NPC40.775
NSRNSR10.7580.8310.8610.607
NSR20.794
NSR30.765
NSR40.799
NRCNRC10.7950.8770.8730.632
NRC20.830
NRC30.809
NRC40.742
ACAC10.8290.8820.9190.739
AC20.861
AC30.884
AC40.864
ETET10.7800.8490.8940.628
ET20.784
ET30.808
ET40.793
ET50.797
GIPGIP10.8010.8730.9090.668
GIP20.829
GIP30.830
GIP40.854
GIP50.769
Note: n = 233. NPC—network position centrality, NSR—network structure richness, NRC—network relationship closeness, AC—absorptive capacity, ET—environmental turbulence, GIP—green innovation performance, CR—composite reliability, AVE—average variance extracted.
Table 3. Correlation matrix.
VariableMSD12345678
1. Firm age16.6749.491
2. Firm size2.9701.0900.446 **
3. NPC3.6000.8870.0990.128(0.814)
4. NSR3.8460.7330.0900.0080.360 **(0.779)
5. NRC3.7620.7730.0860.1020.445 **0.269 **(0.795)
6. AC3.8450.7650.1110.1170.413 **0.350 **0.580 **(0.860)
7. ET3.7860.754−0.061−0.022−0.145 *−0.045−0.0110.082(0.792)
8. GIP3.7990.793−0.0030.0090.379 **0.333 **0.376 **0.382 **0.104(0.817)
Note: n = 233; * p < 0.05, ** p < 0.01. Data in parentheses are the square roots of the average variance extracted (AVE). M—mean, SD—standard deviation. NPC—network position centrality, NSR—network structure richness, NRC—network relationship closeness, AC—absorptive capacity, ET—environmental turbulence, GIP—green innovation performance.
Table 4. Hierarchical regression results.
VariableGIP (M1→M6)AC (M7→M8)
M1M2M3M4M5M6M7M8
Control variableFirm age−0.009
(−0.123)
−0.053
(−0.820)
−0.057
(−0.887)
−0.038
(−0.553)
−0.033
(−0.481)
−0.031
(−0.463)
0.074
(1.012)
0.024
(0.420)
Firm size0.013
(0.179)
−0.020
(−0.301)
−0.026
(−0.402)
−0.020
(−0.286)
−0.019
(−0.284)
−0.020
(−0.299)
0.084
(1.153)
0.040
(0.683)
Independent variableNPC 0.211 **
(3.107)
0.189 **
(2.780)
0.135 *
(2.237)
NSR 0.199 **
(3.153)
0.171 **
(2.677)
0.174 **
(3.096)
NRC 0.235 ***
(3.594)
0.160 *
(2.179)
0.467 ***
(8.023)
Mediating variableAC 161 *
(2.168)
0.389 ***
(6.317)
0.382 ***
(6.194)
0.432 ***
(6.998)
Moderating variableET 0.070
(1.136)
0.052
(0.874)
InteractionAC*ET 0.221 ***
(3.621)
Model summaryR200.2350.2500.1490.1530.2000.0180.395
F0.01713.931 ***12.582 ***13.317 ***10.323 ***11.319 ***2.11629.656 ***
Note: n = 233; * p < 0.05, ** p < 0.01, *** p < 0.001. Coefficients in table are the standardized coefficients (β’s) and the data in parentheses are the t-values. NPC—network position centrality, NSR—network structure richness, NRC—network relationship closeness, AC—absorptive capacity, ET—environmental turbulence GIP—green innovation performance.
Table 5. The mediation analysis results of bootstrapping.
PathEffect TypeEffect ValueBootSEBootstrap 95% CI
LLUL
NPC→AC→GIPTotal effect0.211 0.068 0.077 0.345
Direct effect0.189 0.068 0.055 0.323
Indirect effect0.022 0.008 0.011 0.035
NSR→AC→GIPTotal effect0.199 0.063 0.075 0.323
Direct effect0.171 0.064 0.045 0.297
Indirect effect0.028 0.011 0.014 0.045
NRC→AC→GIPTotal effect0.236 0.066 0.106 0.365
Direct effect0.1610.074 0.015 0.306
Indirect effect0.075 0.037 0.031 0.126
Notes: Bootstrap sample size = 5000. SE—standard error, CI—confidence interval, LL—lower limit, UL—upper limit. NPC—network position centrality, NSR—network structure richness, NRC—network relationship closeness, AC—absorptive capacity, GIP—green innovation performance.
Table 6. The moderated mediation analysis results of bootstrapping.
Independent VariableConditional Indirect EffectModerated Mediation Effect
Moderating VariableEffectBootSEBootLLCIBootULCIINDEXBootSEBootLLCIBootULCI
NPCLow0.004 0.014 −0.026 0.033 0.0220.0140.0010.054
Mean0.026 0.015 0.001 0.059
High0.048 0.025 0.005 0.102
NSRLow0.005 0.018 −0.030 0.044 0.0280.0180.0020.070
Mean0.033 0.021 0.004 0.082
High0.062 0.034 0.011 0.143
NRCLow0.013 0.047 −0.067 0.118 0.0770.0320.0140.139
Mean0.090 0.043 0.018 0.185
High0.166 0.059 0.065 0.297
Notes: Bootstrap sample size = 5000. SE—standard error, CI—confidence interval, LL—lower limit, UL—upper limit. NPC—network position centrality, NSR—network structure richness, NRC—network relationship closeness, AC—absorptive capacity, GIP—green innovation performance.
Publisher’s Note: MDPI stays neutral with regard to jurisdictional claims in published maps and institutional affiliations.

