
Monitoring and Assessment of Groundwater Quality at Landfill Sites: Selected Case Studies of Poland and the Czech Republic


Abstract
:1. Introduction
2. Materials and Methods
2.1. Characteristics of the Study Sites
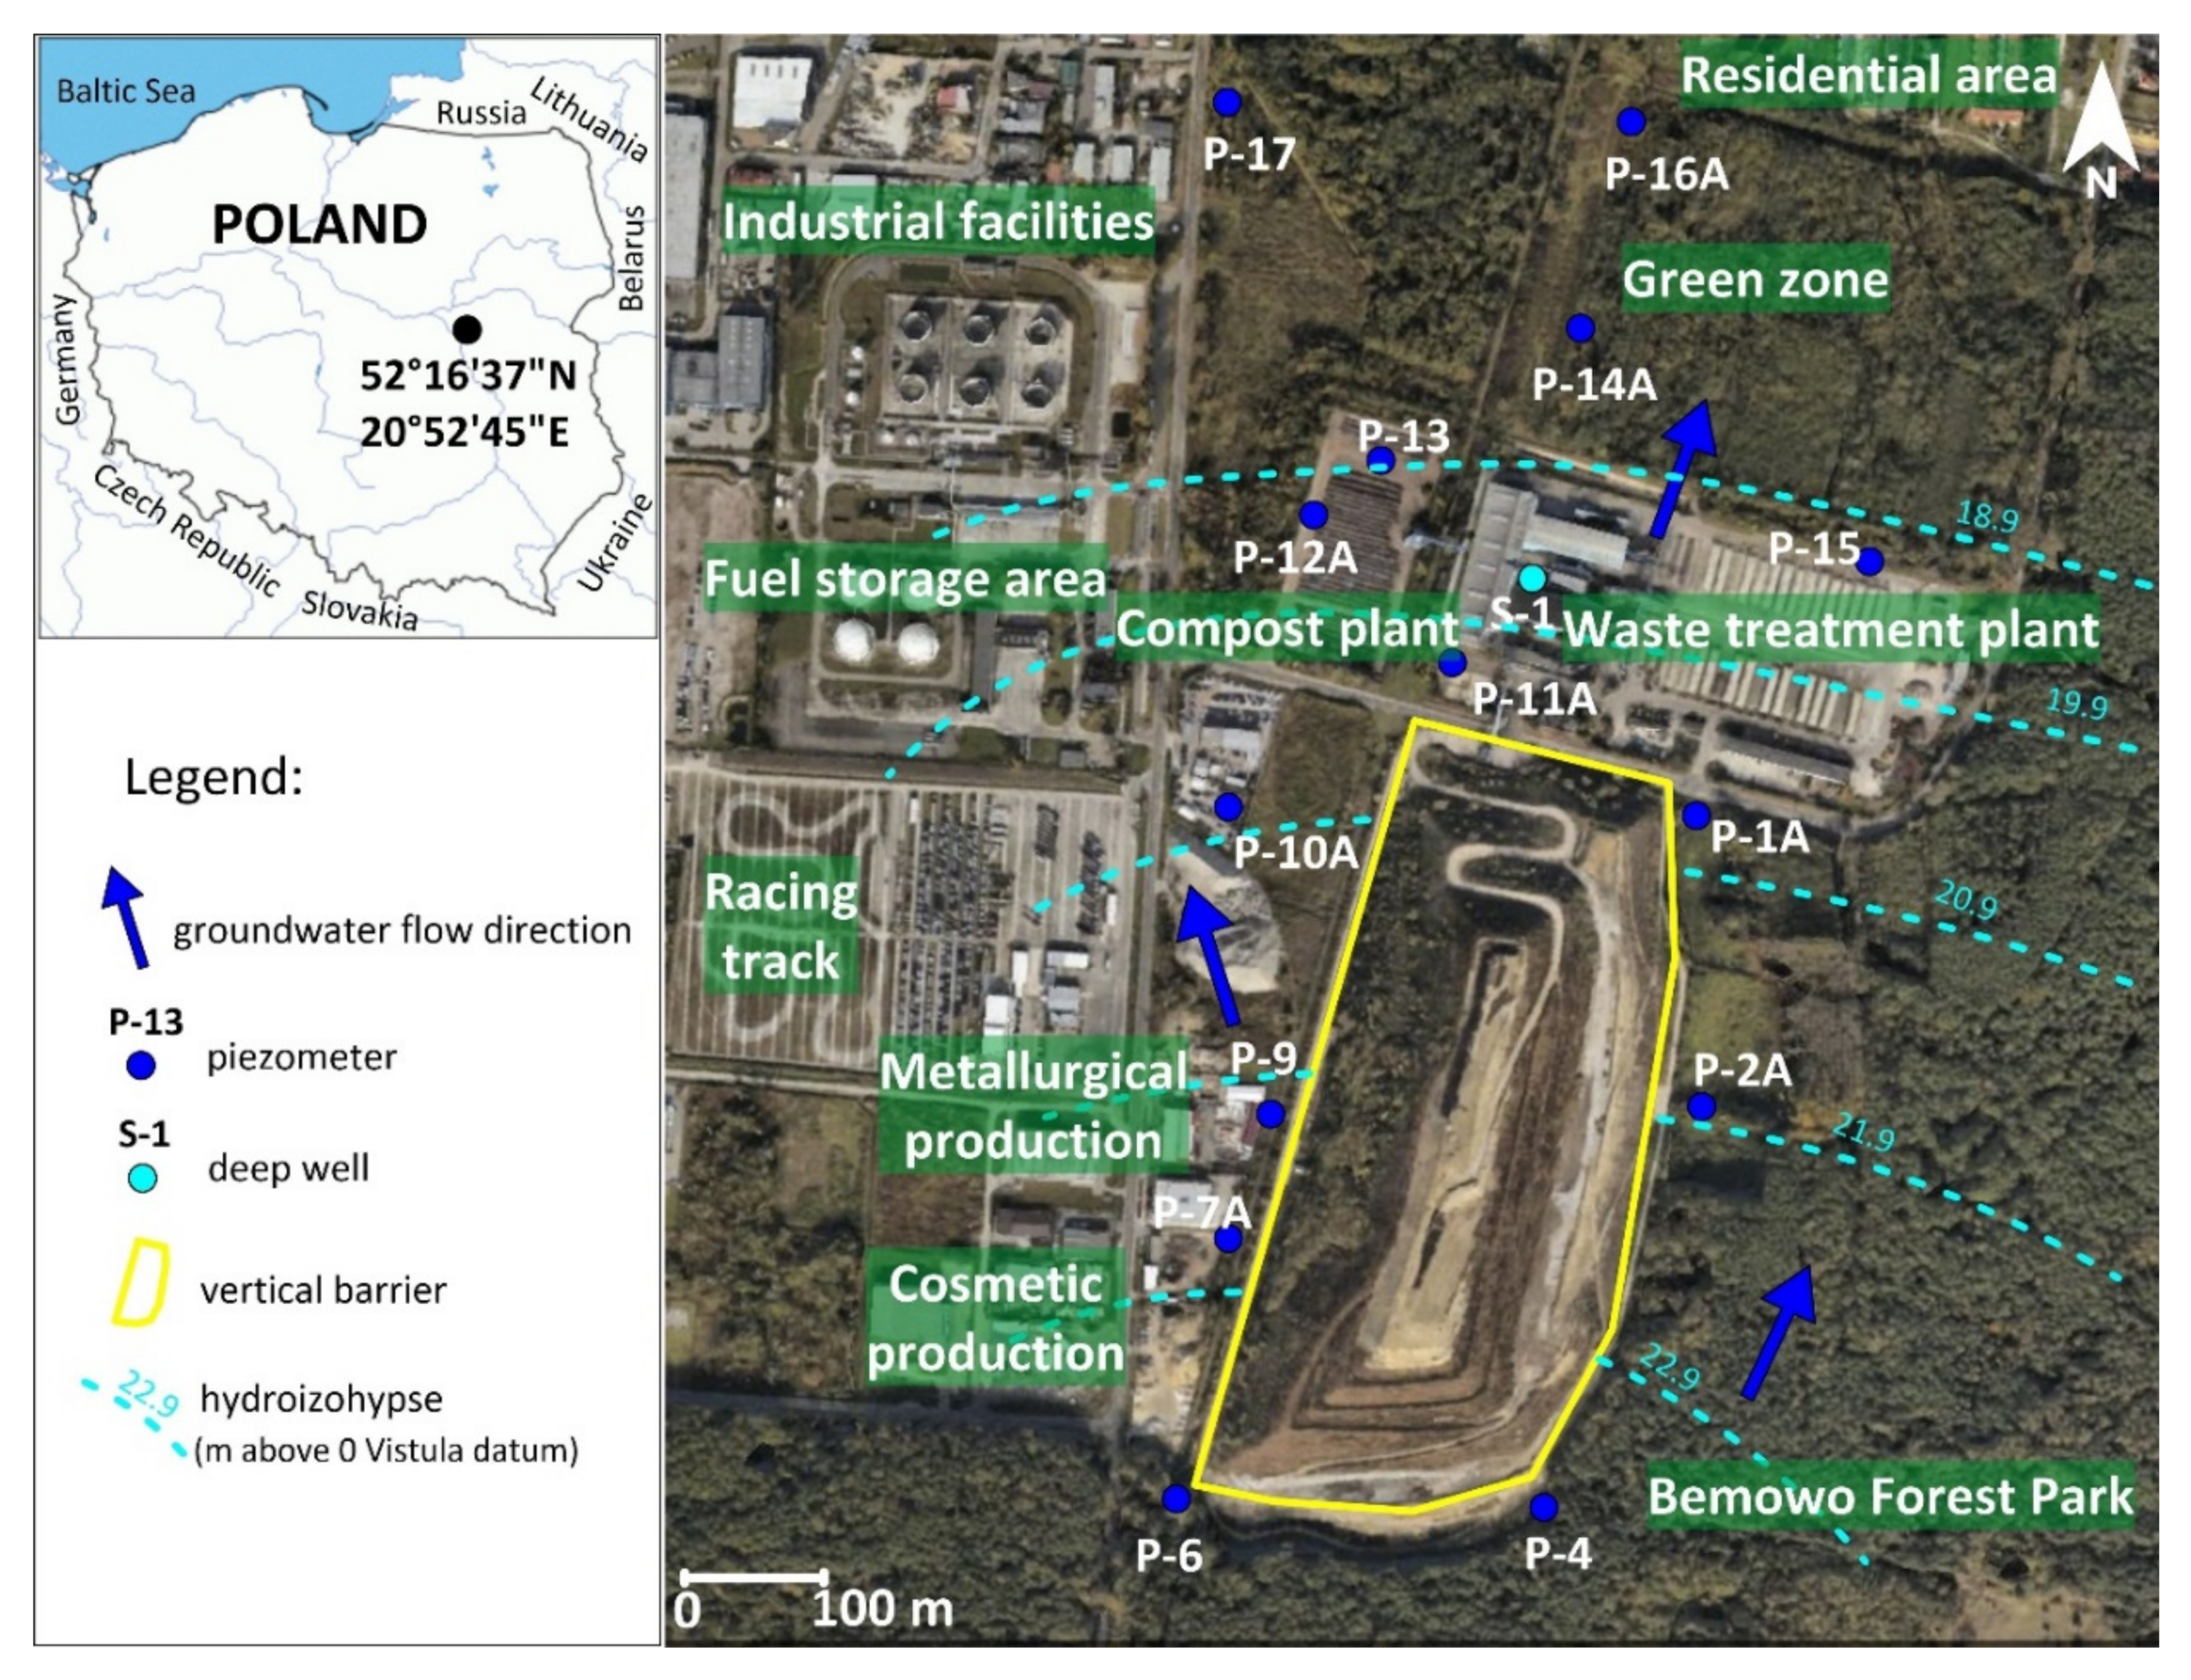
2.1.1. Radiowo Landfill
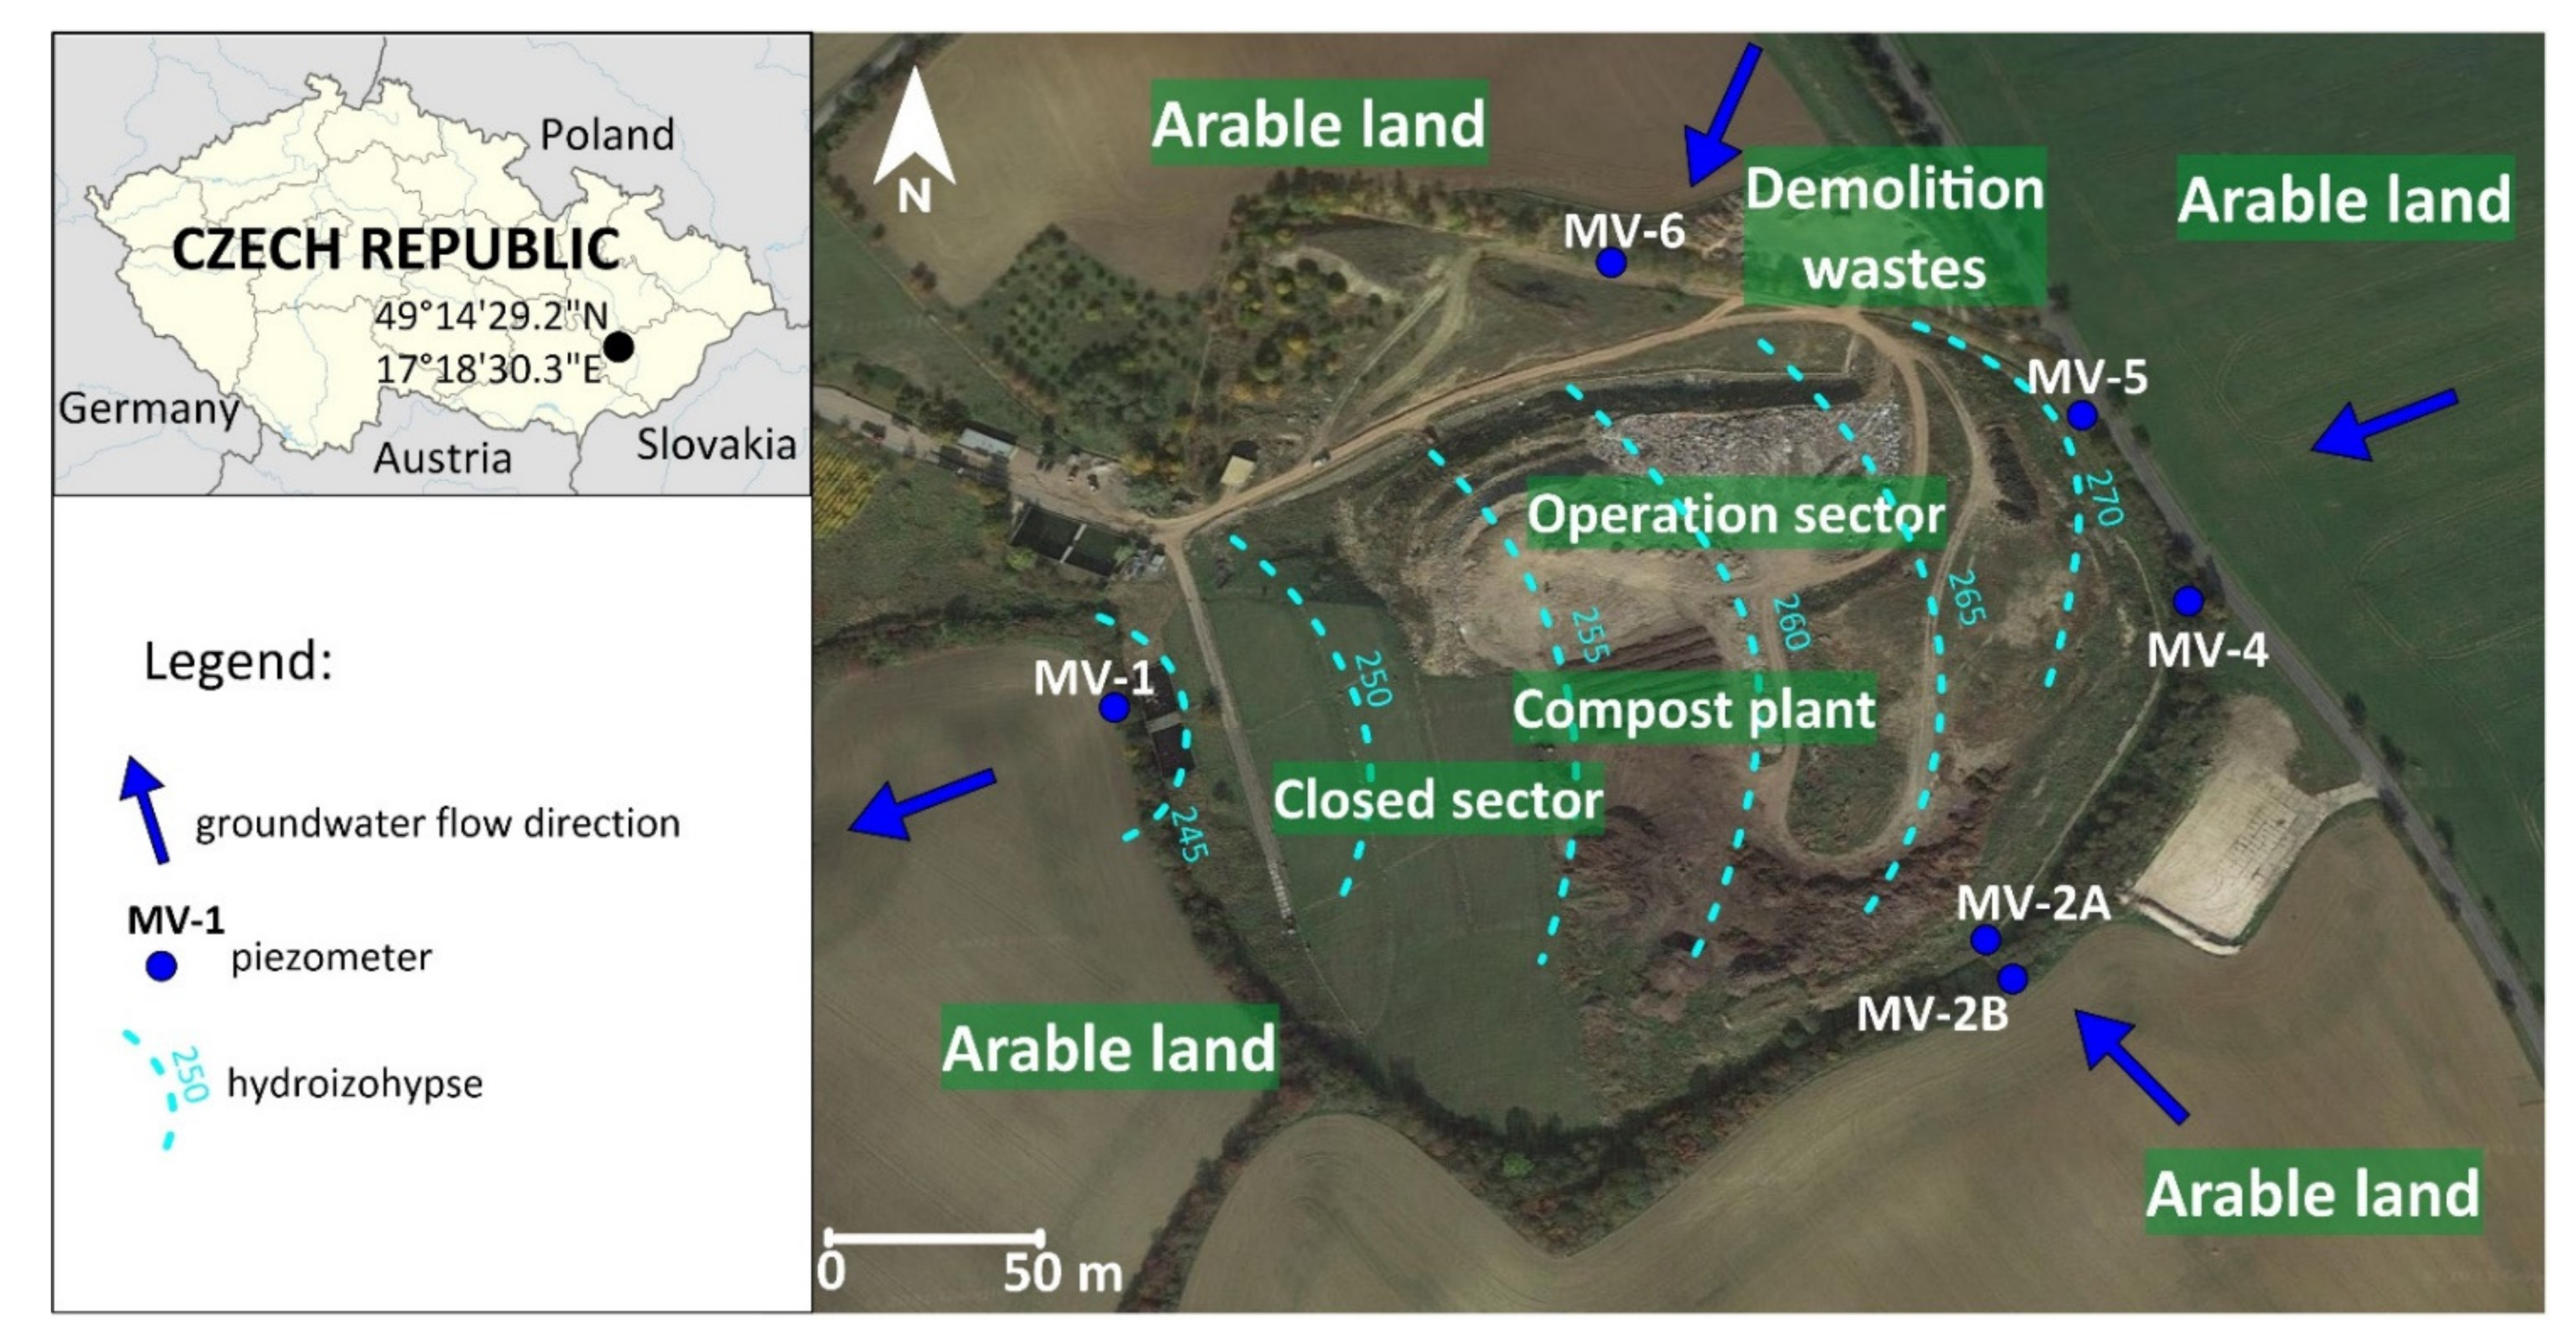
2.1.2. Zdounky Landfill
2.2. Sampling and Experimental Analysis
2.3. Assessment of the HM Pollution Level
3. Results
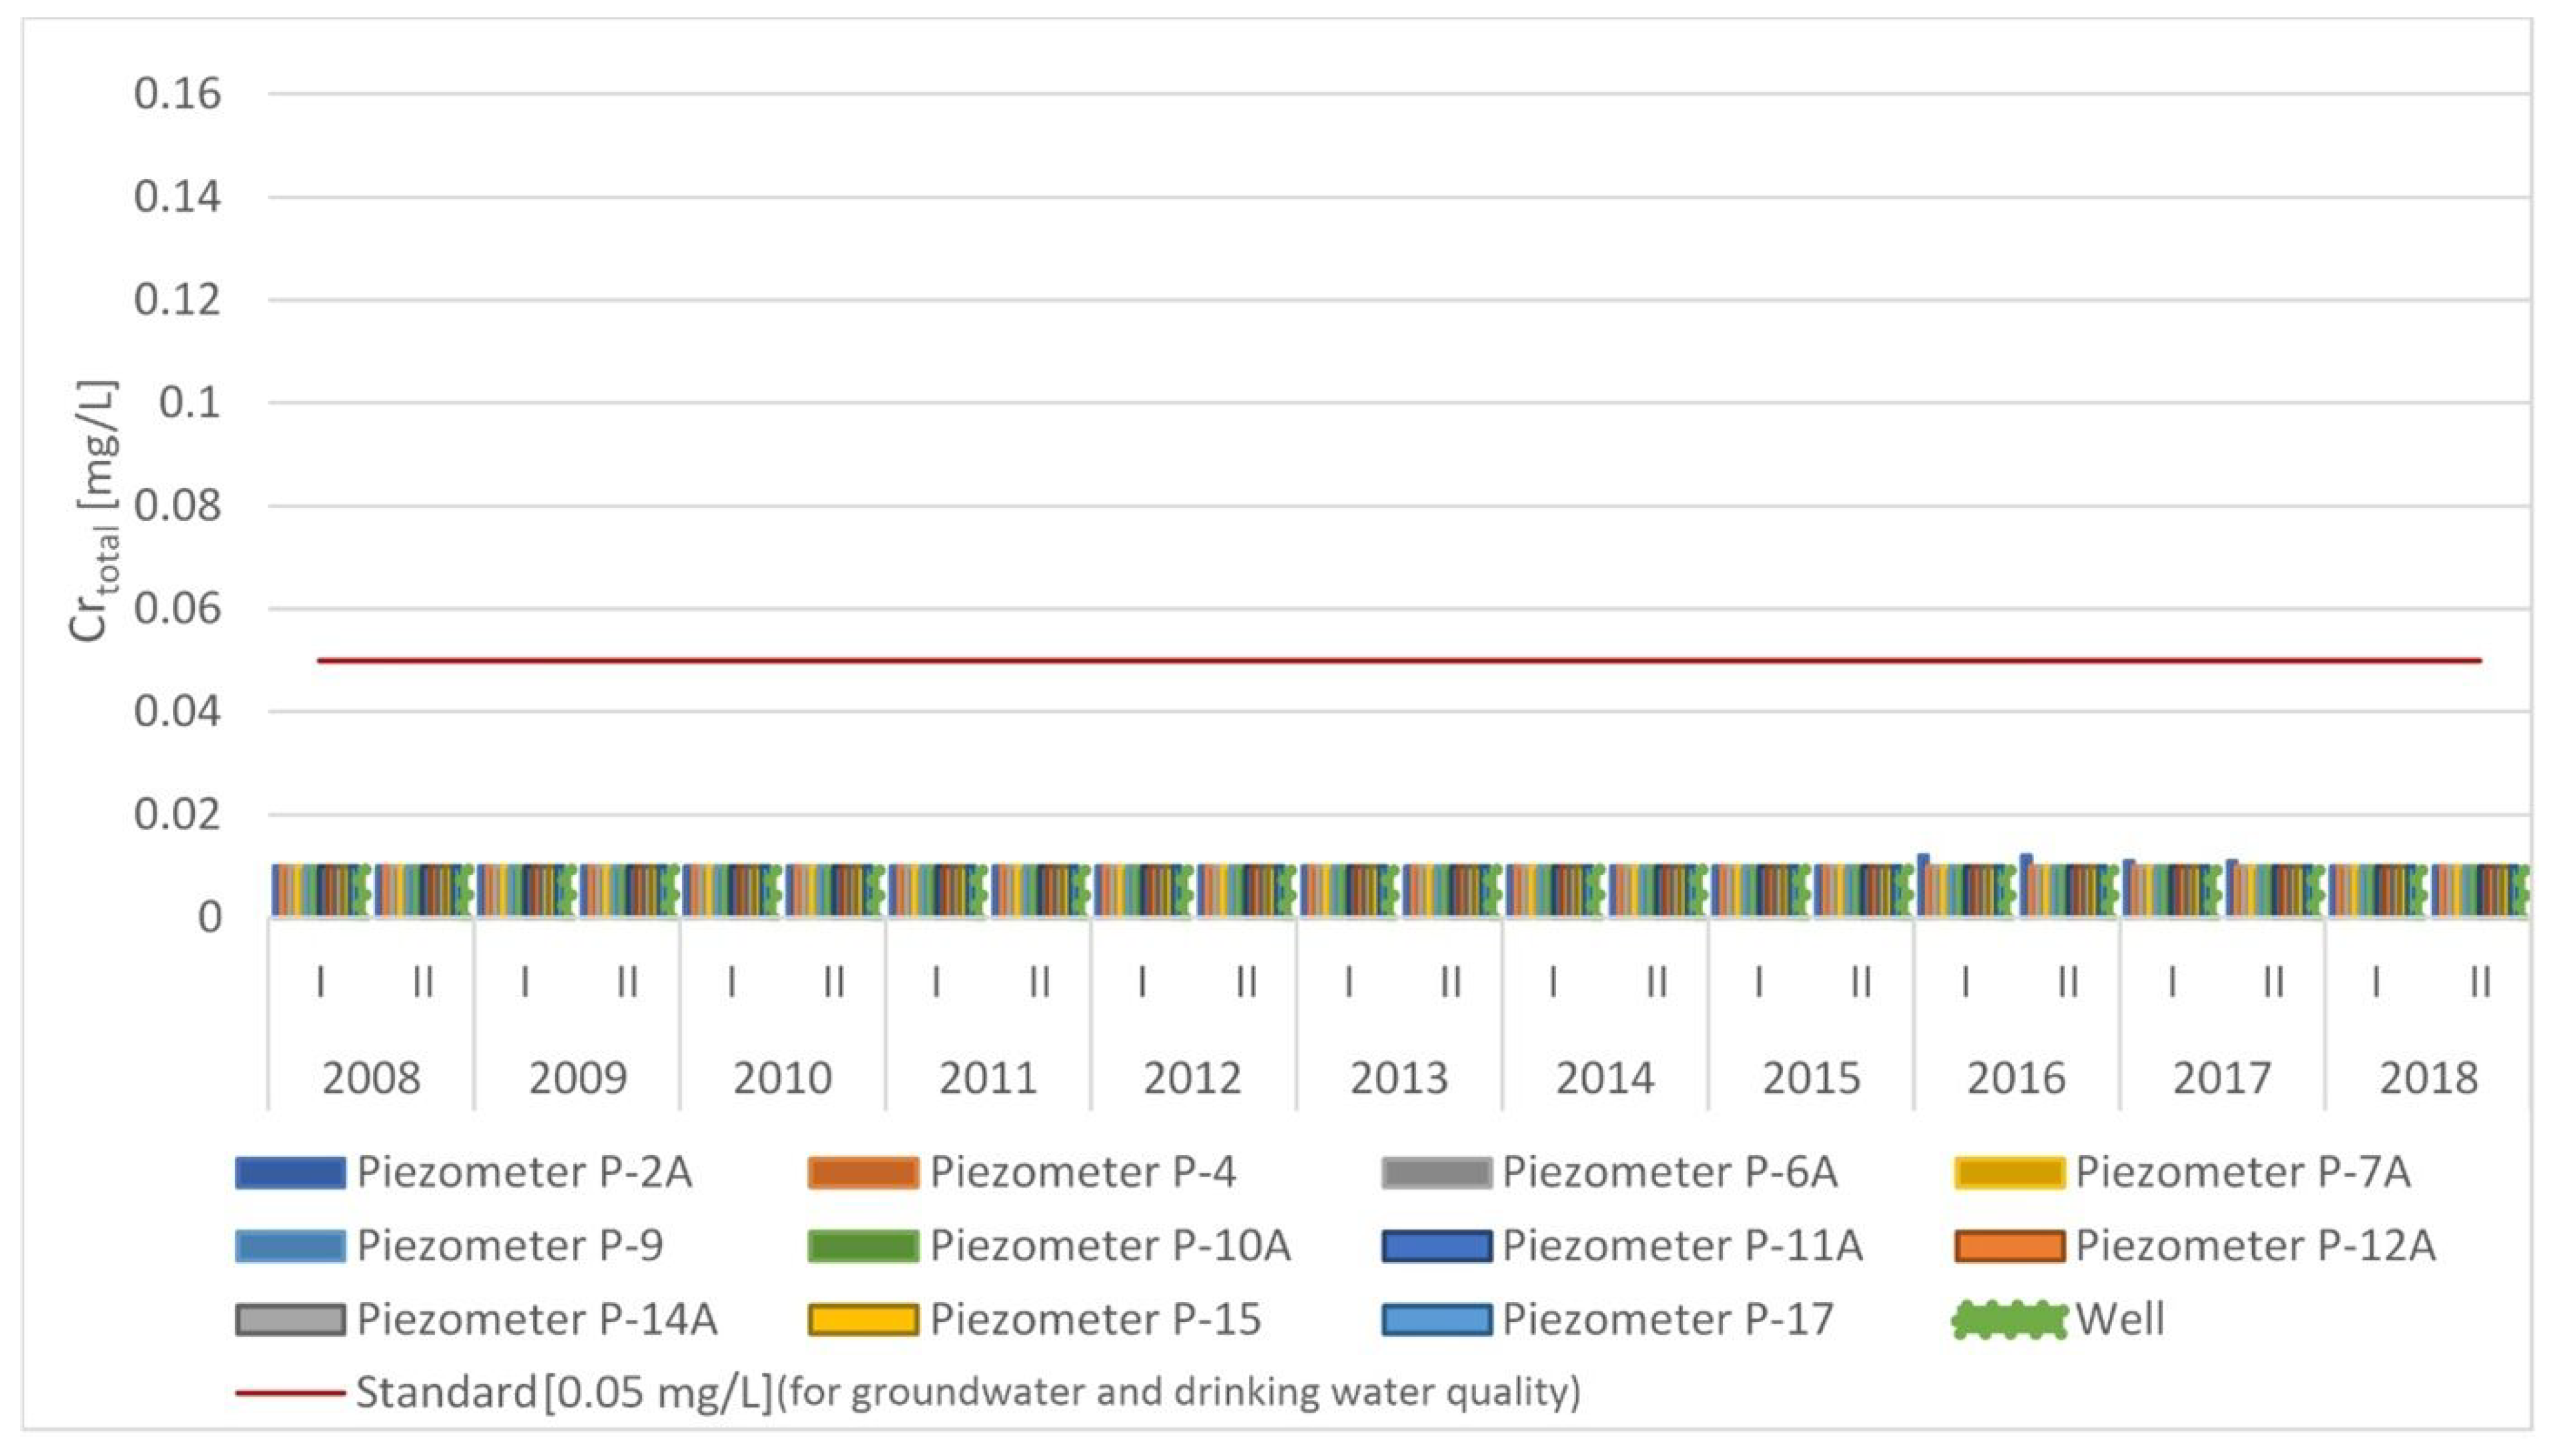
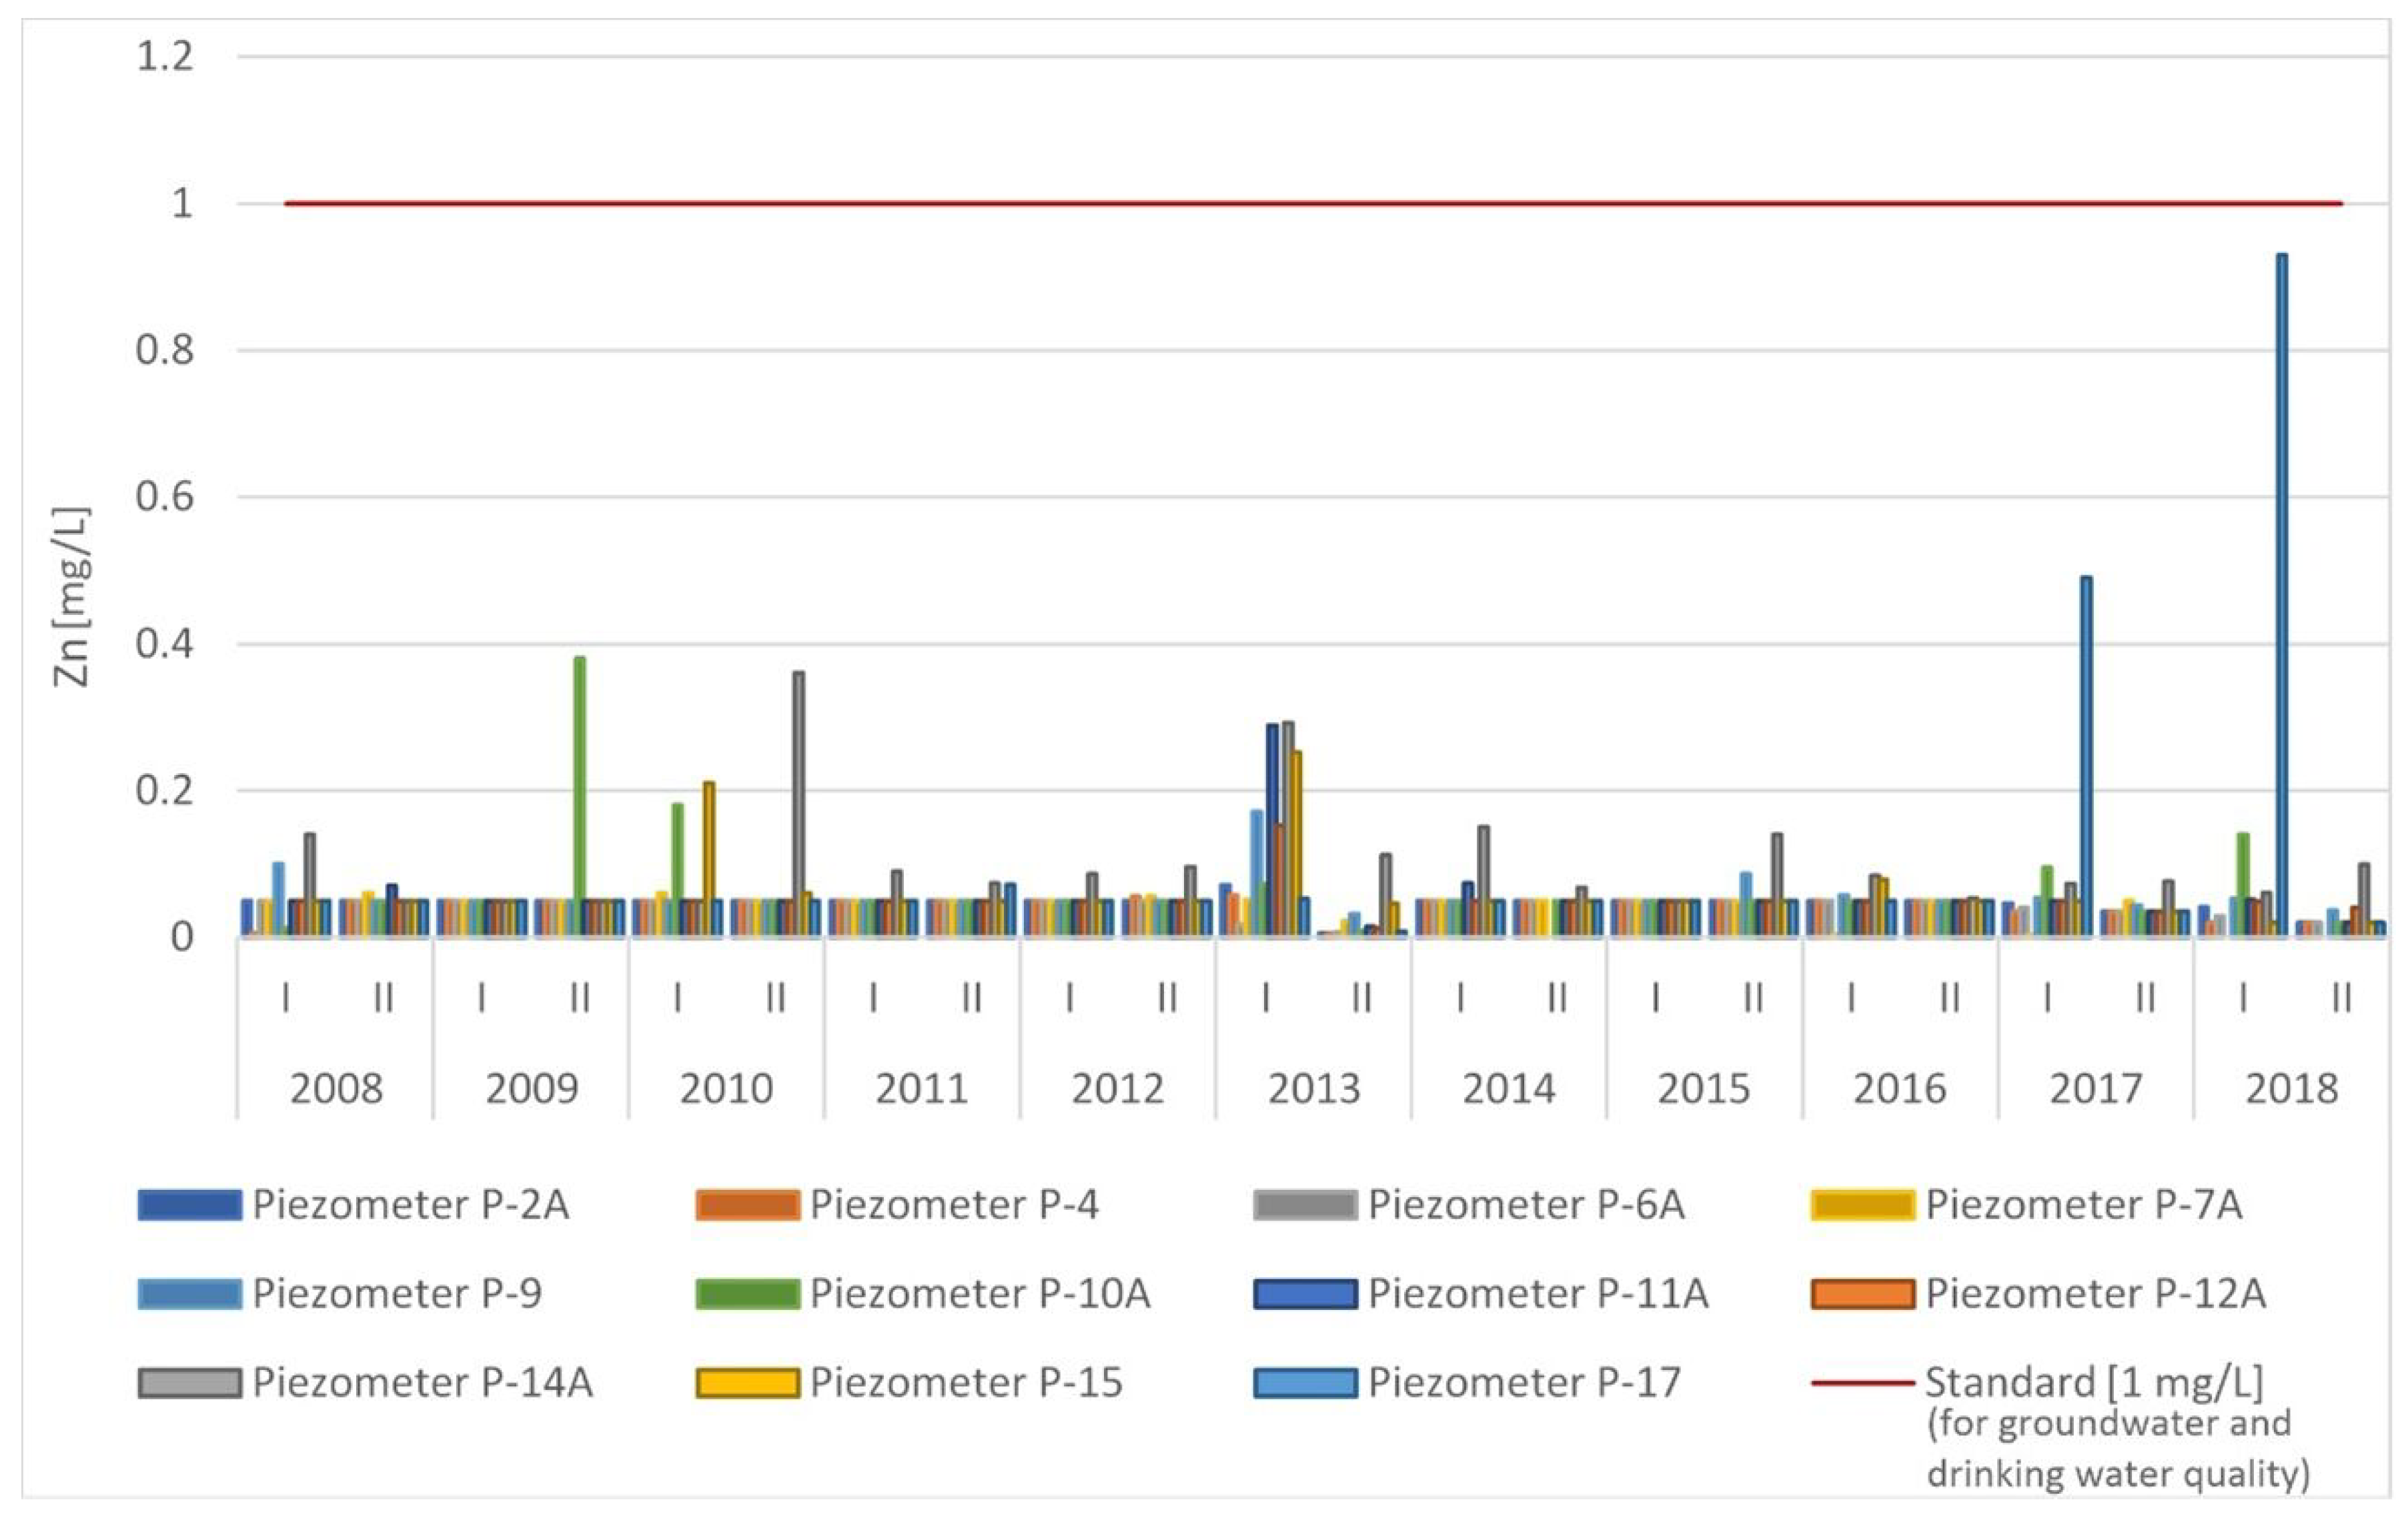
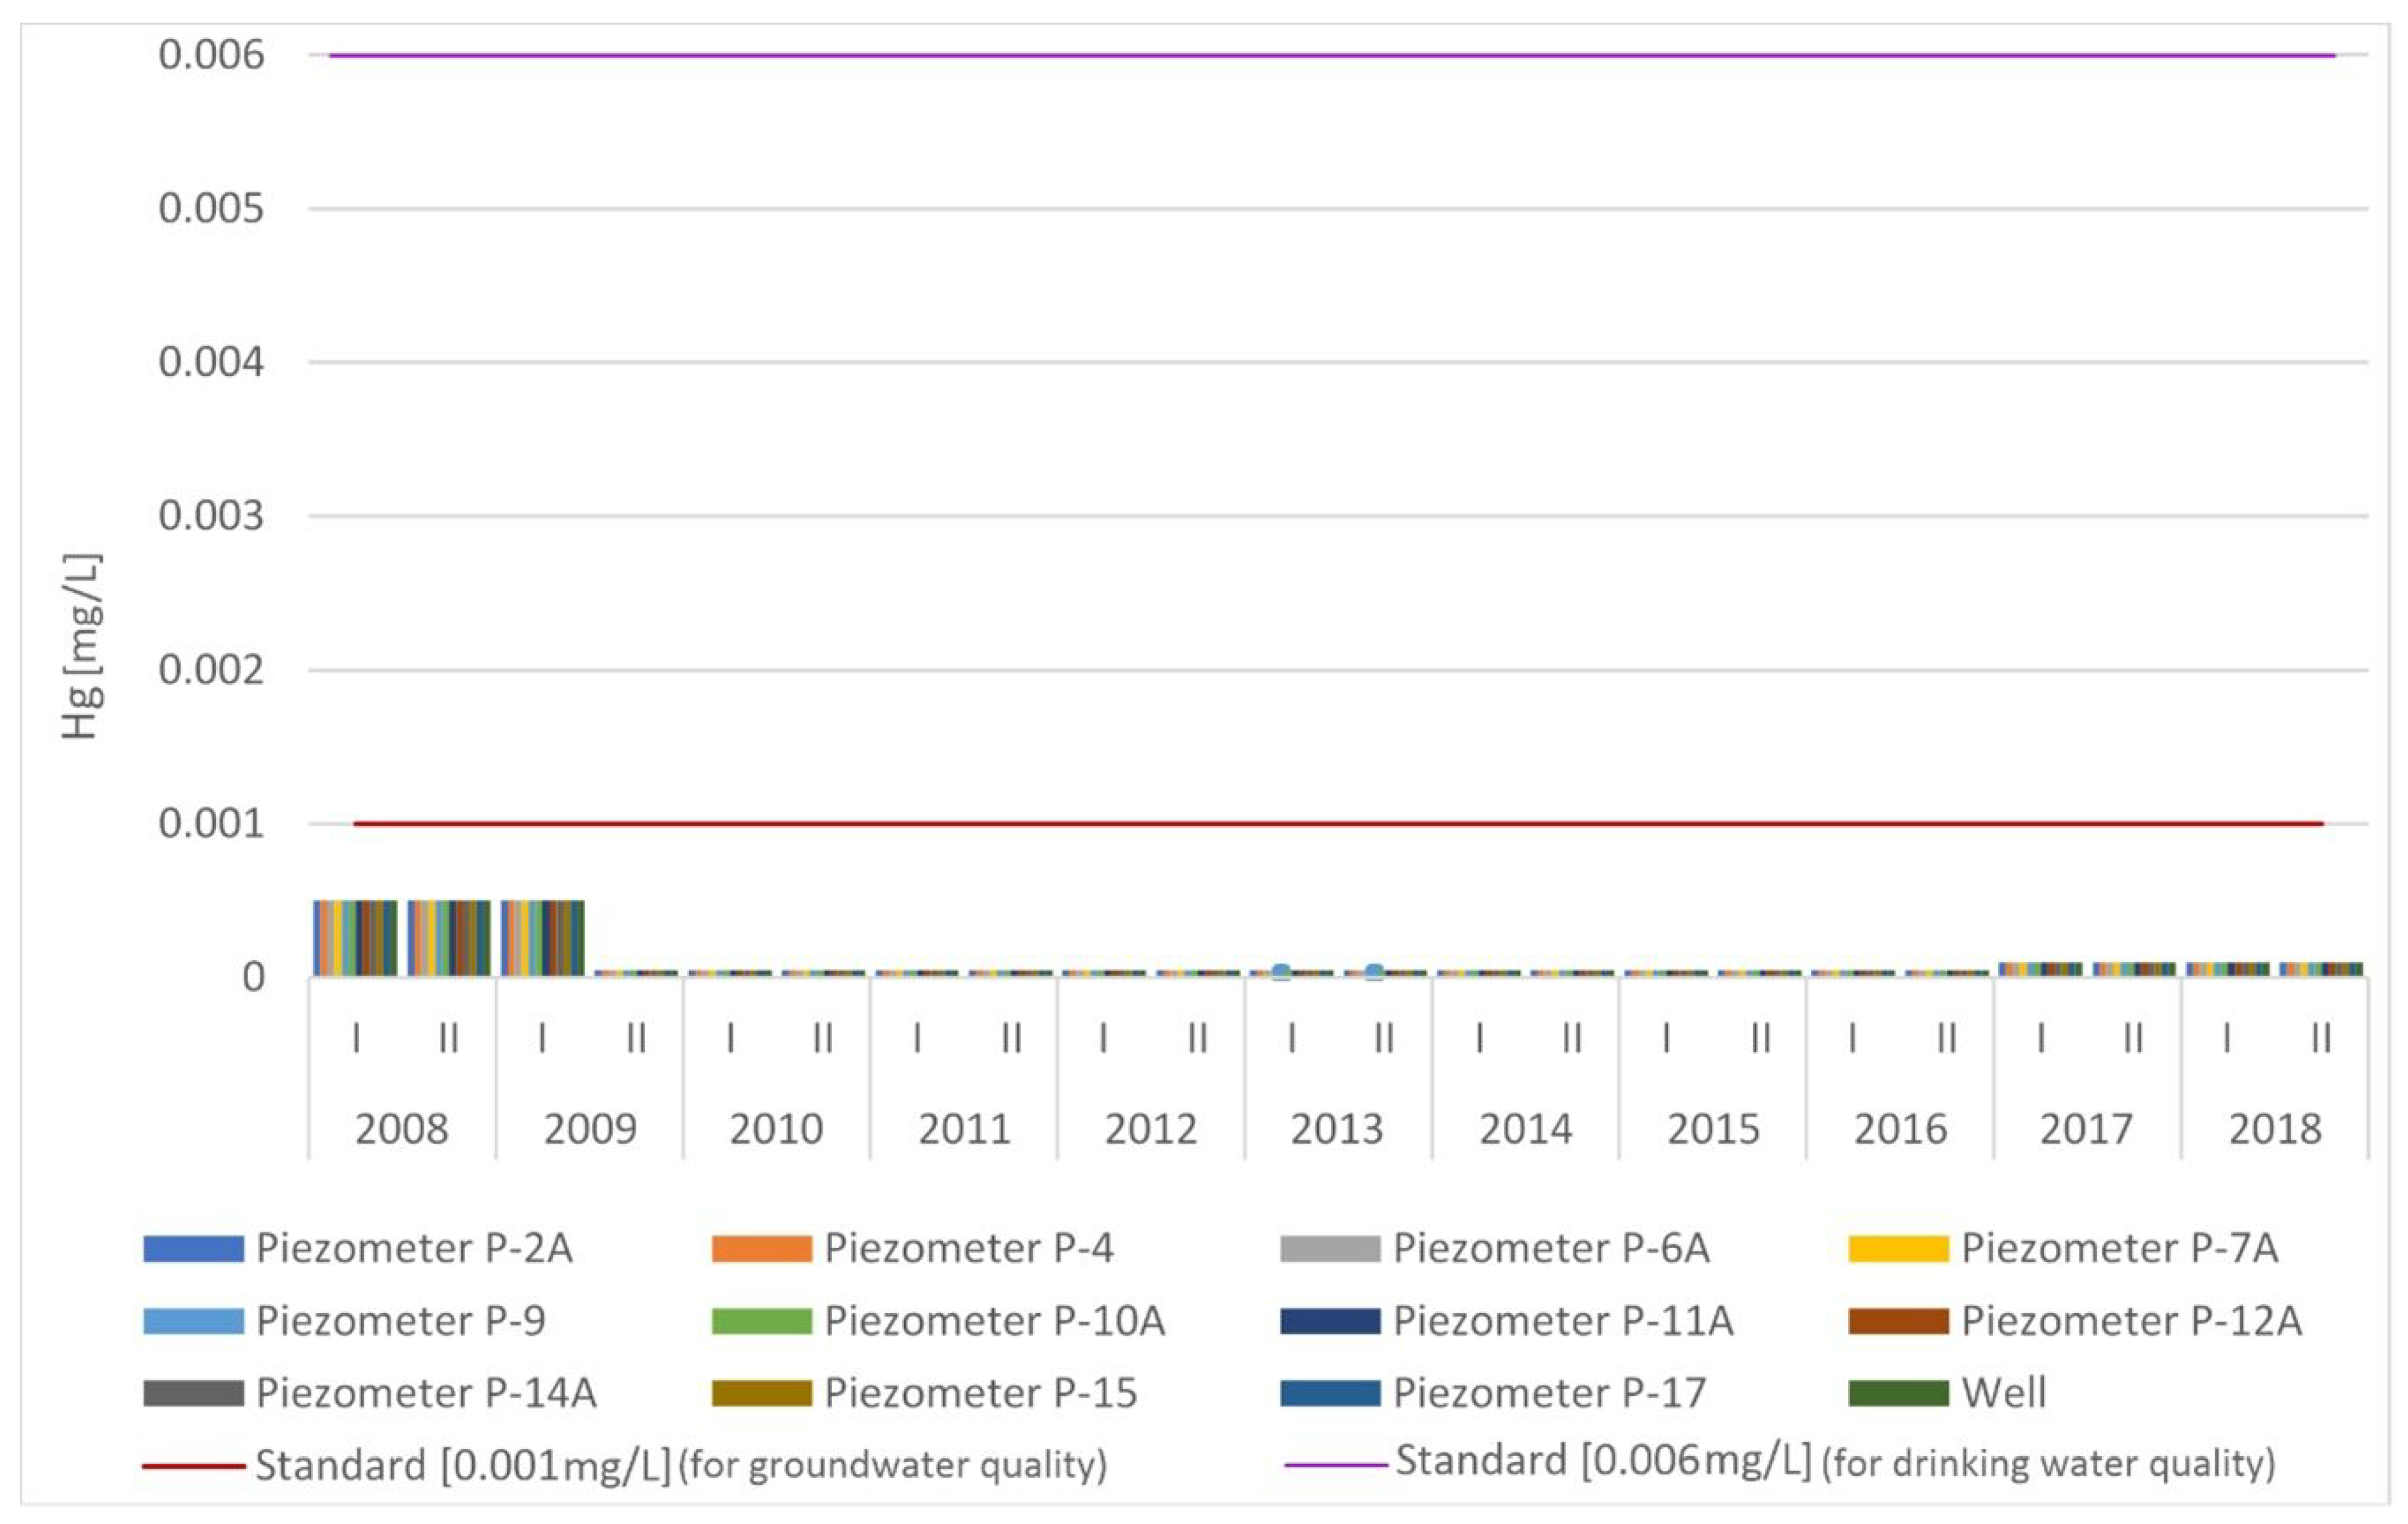
3.1. Temporal Distribution of HMs in Groundwater
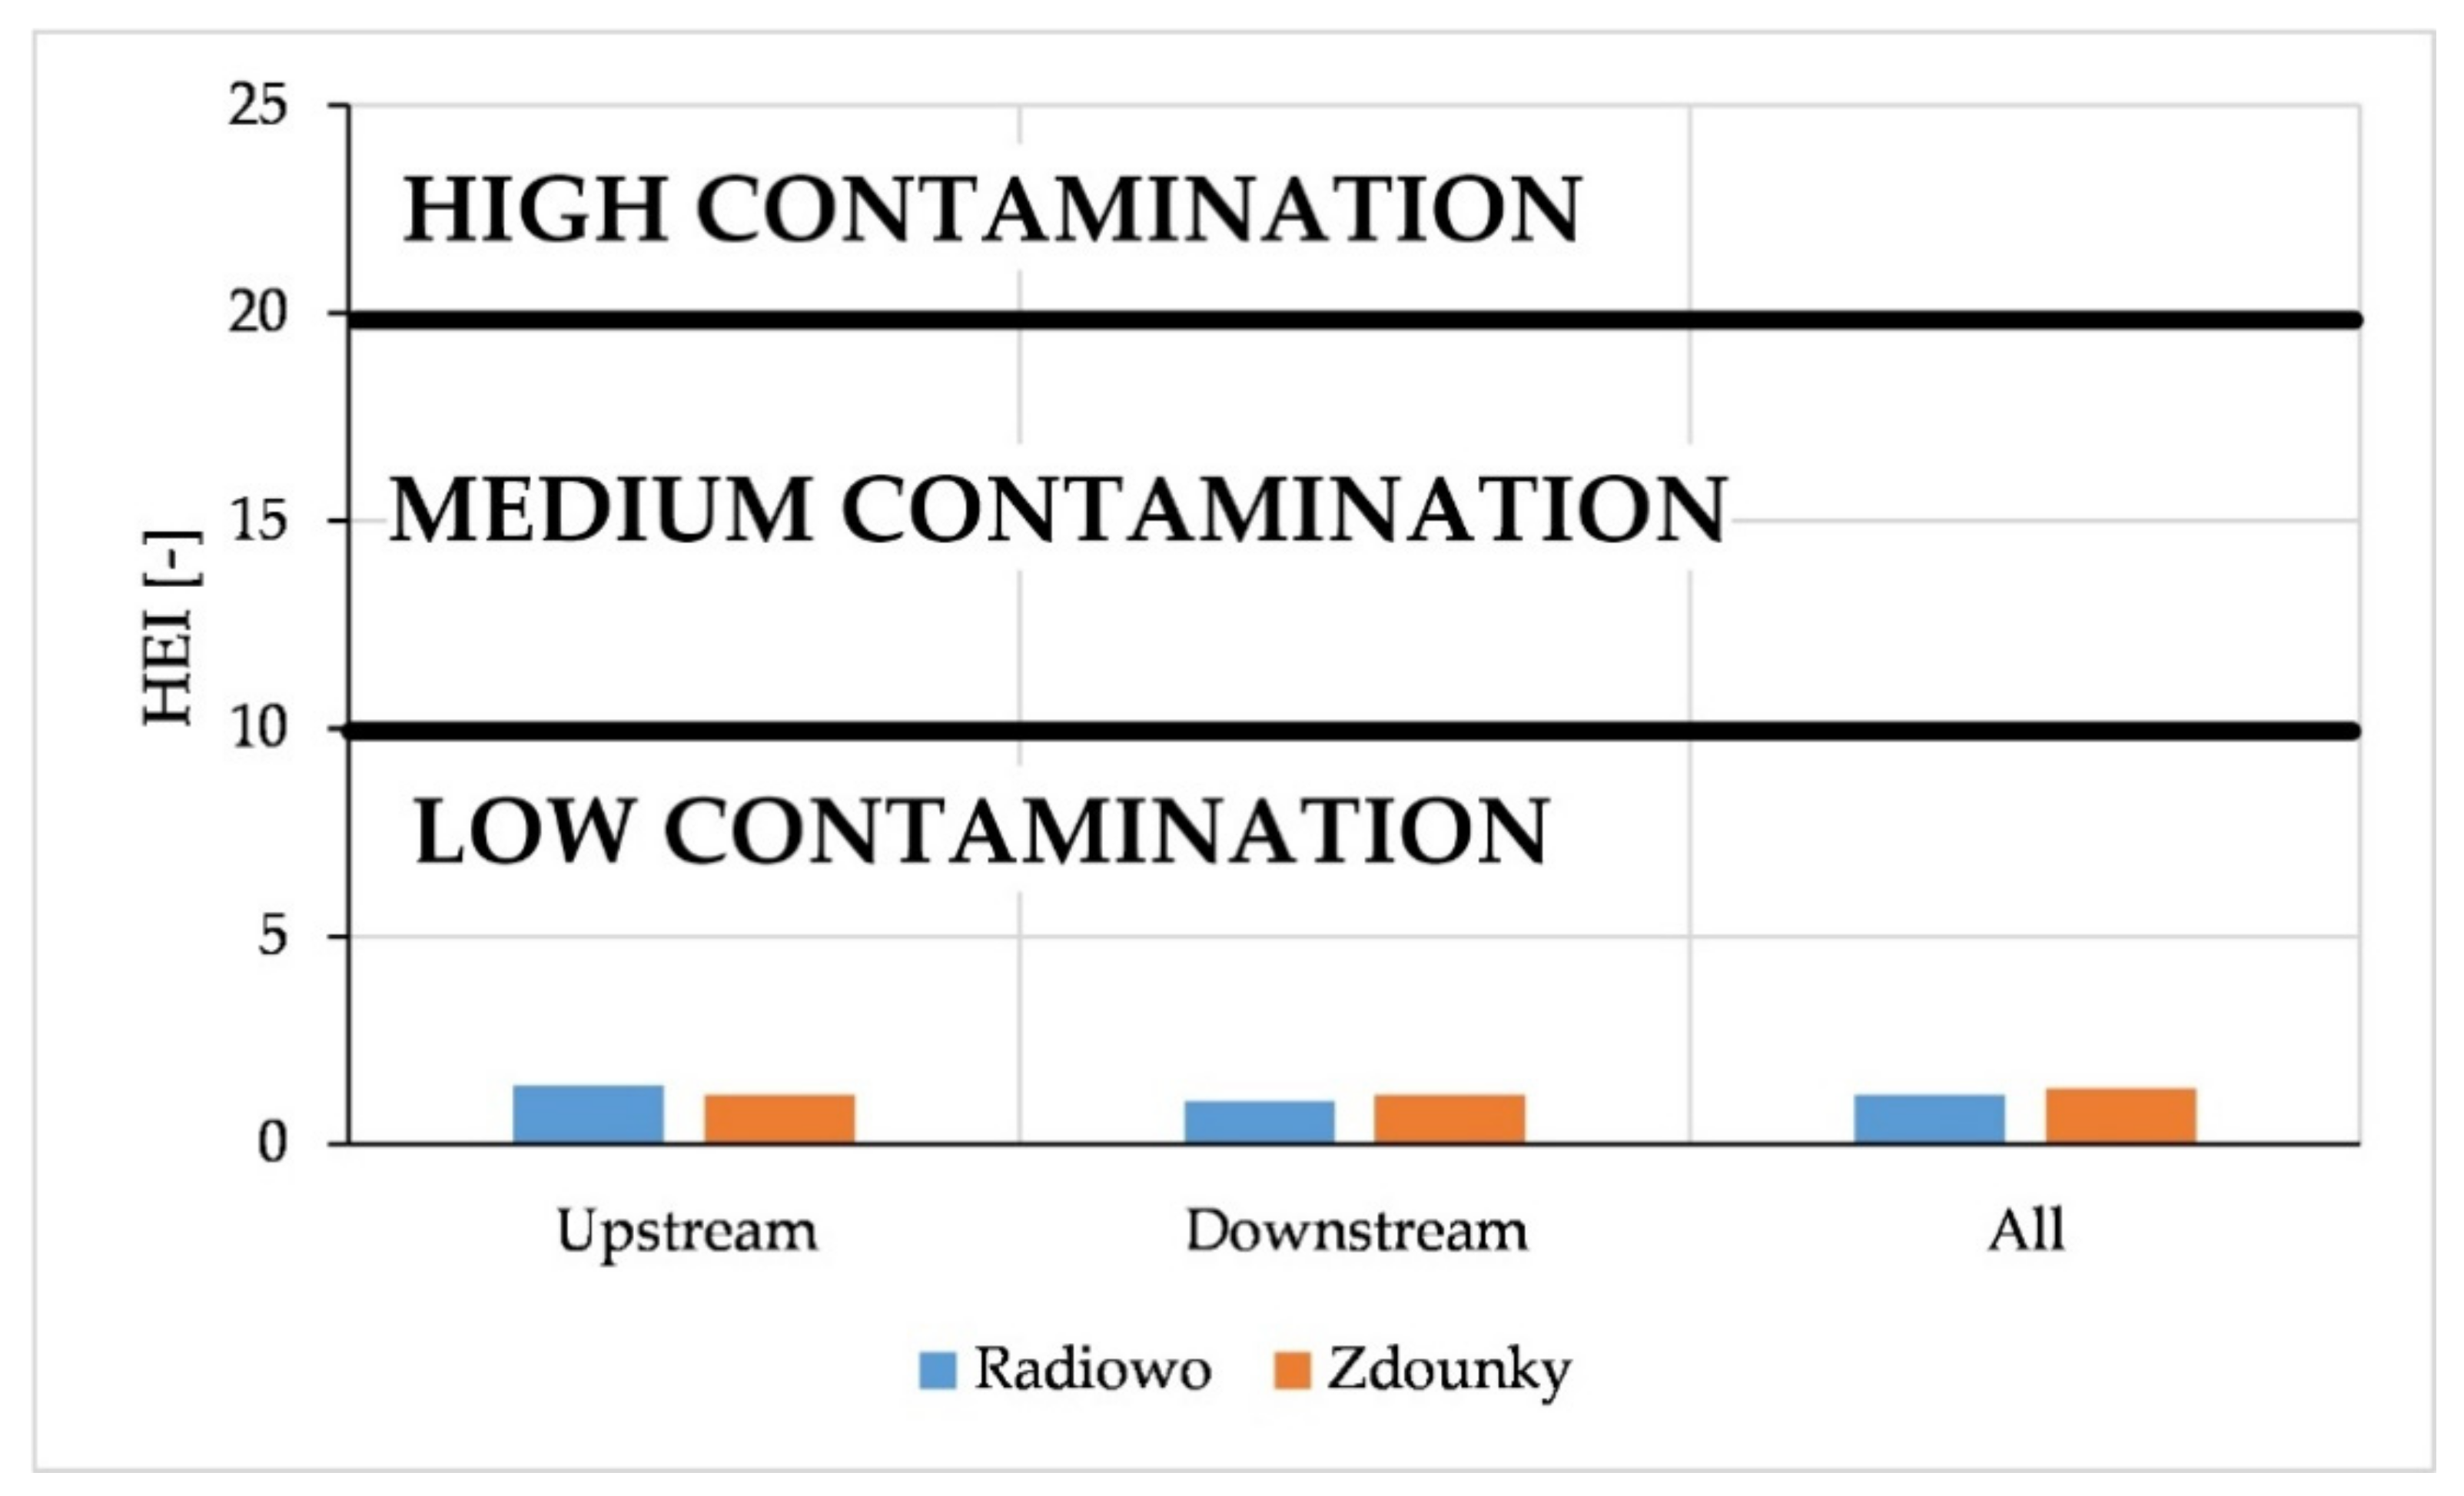
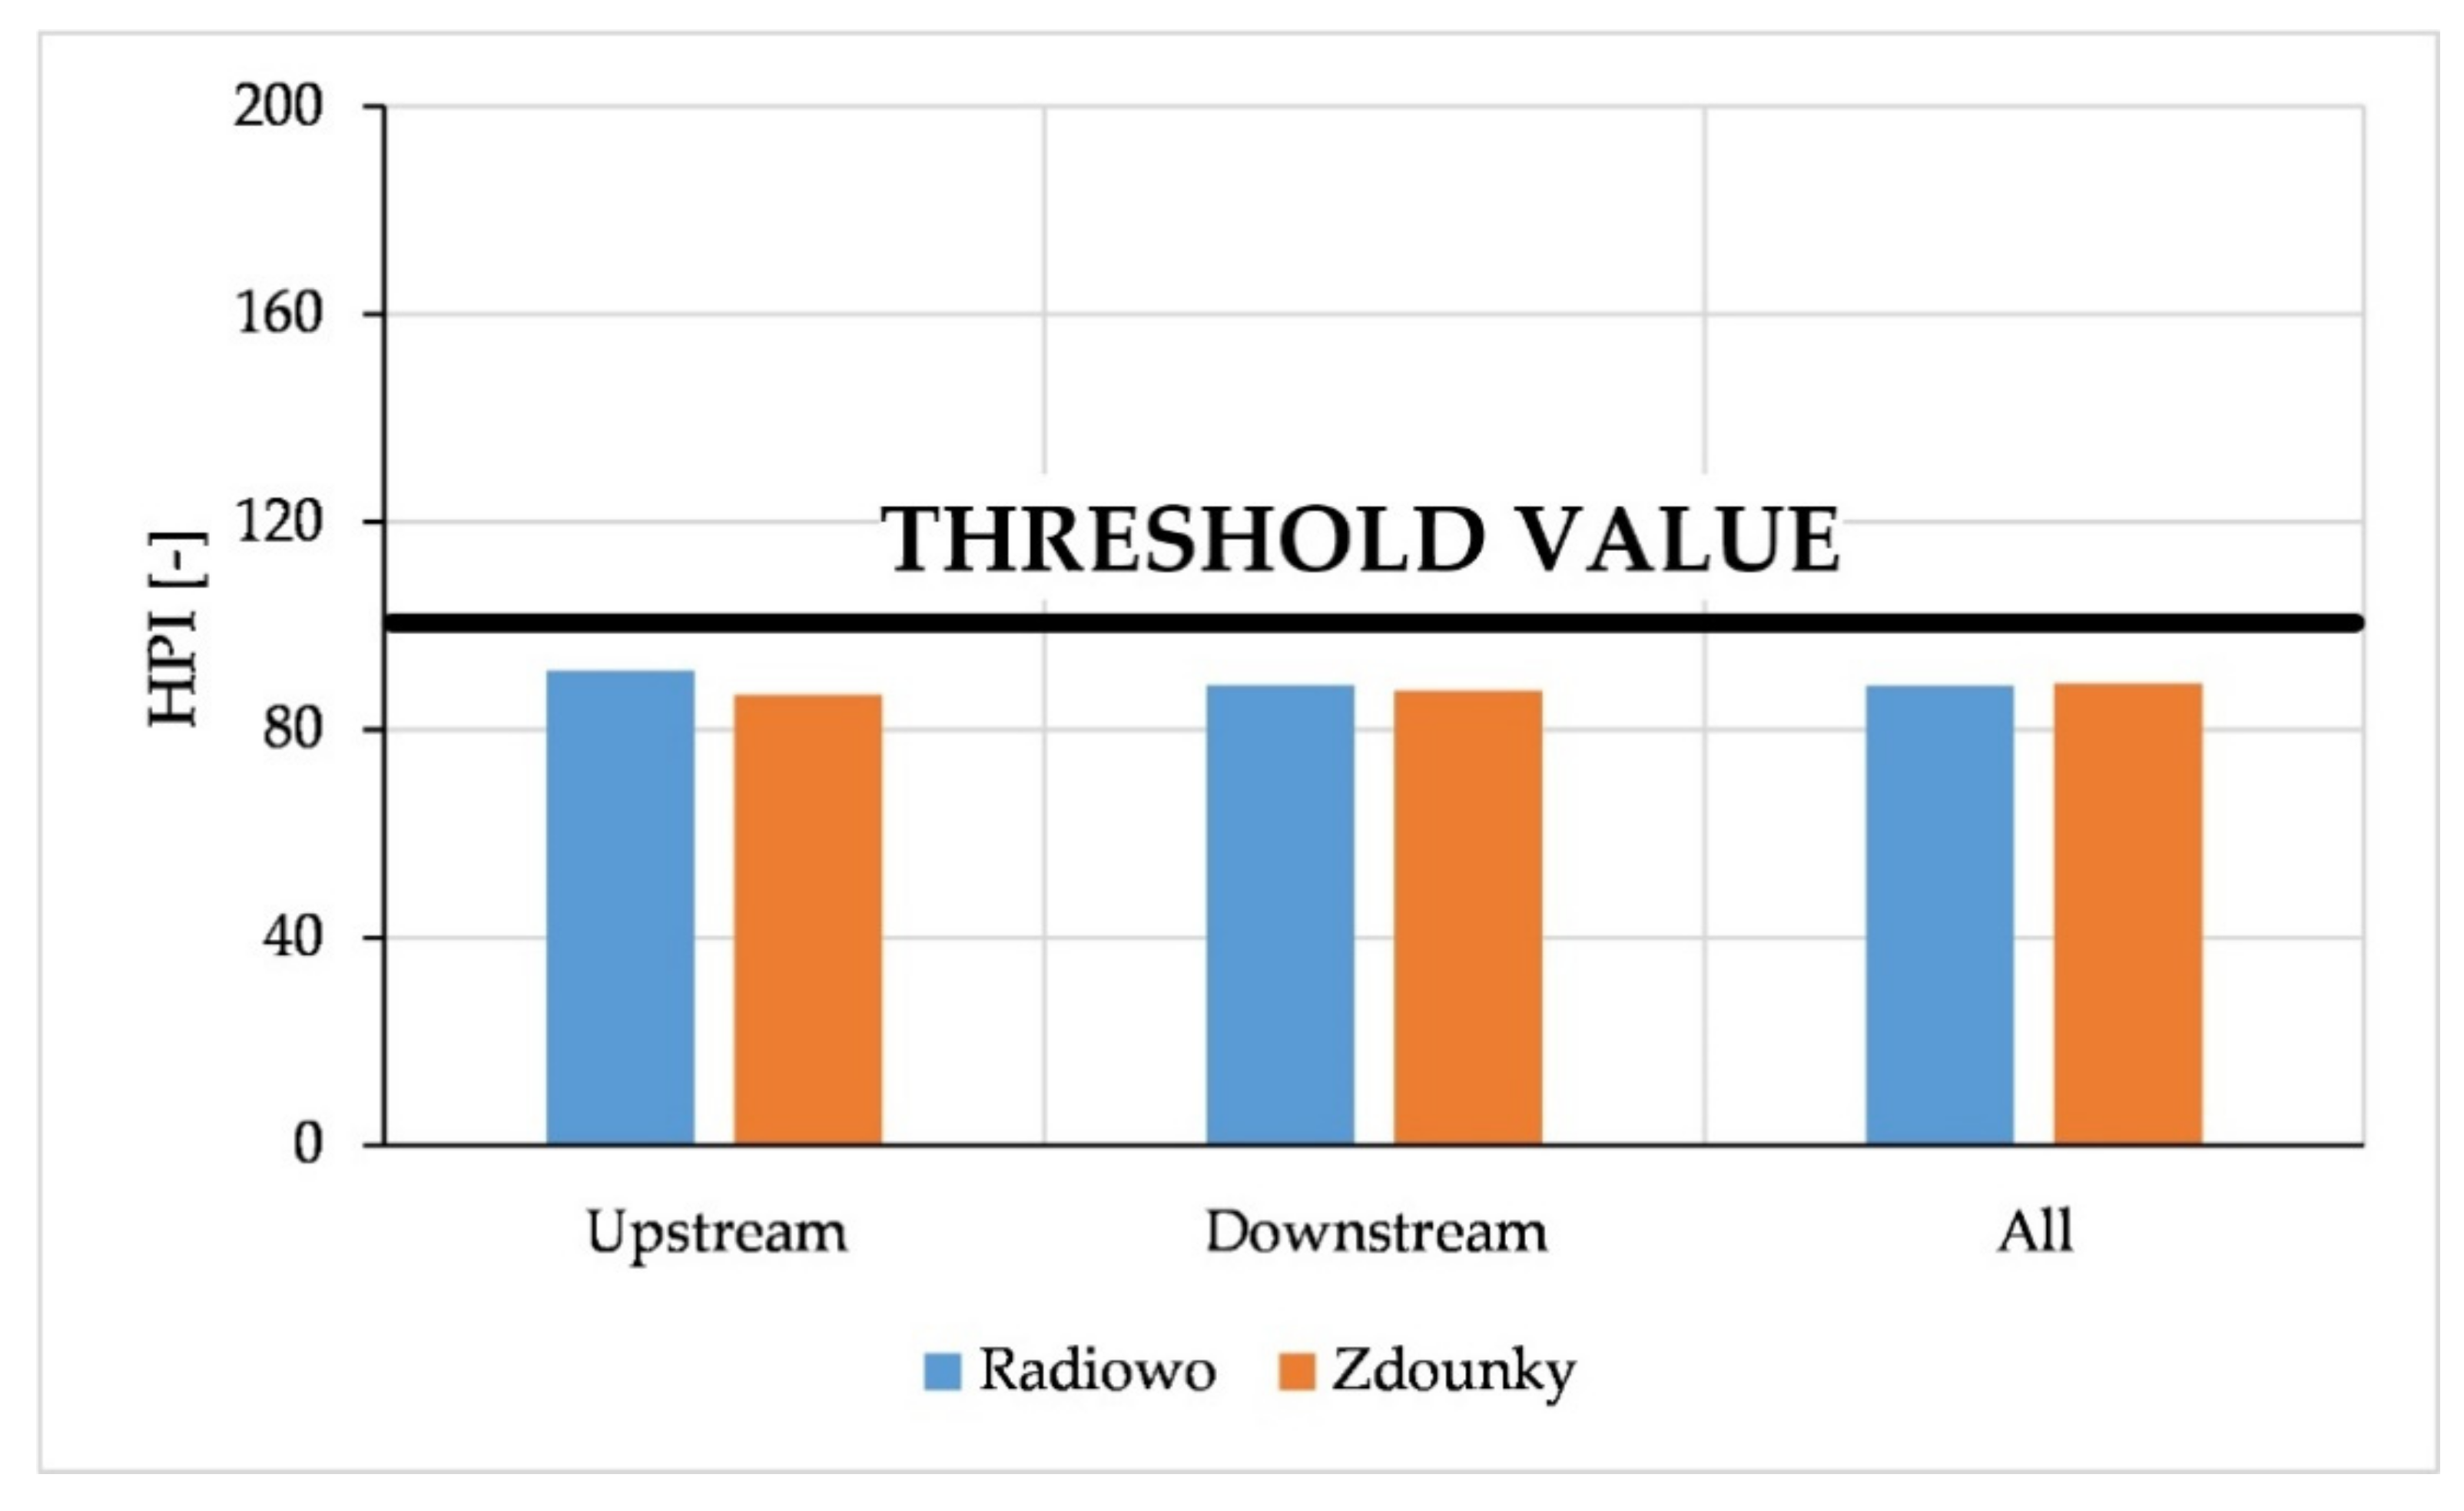
3.2. Assessment of Groundwater Contamination by HMs Using Indices
4. Discussion
5. Conclusions
Author Contributions
Funding
Institutional Review Board Statement
Informed Consent Statement
Data Availability Statement
Conflicts of Interest
Appendix A

| Piezometer | Mean | Median | Minimum | Maximum | Variance | Standard Deviation | Skewness | Kurtosis |
|---|---|---|---|---|---|---|---|---|
| Radiowo landfill | ||||||||
| P2-A | 0.010 | 0.010 | 0.010 | 0.012 | 0.000 | 0.001 | 2.232 | 3.898 |
| P-4 | 0.010 | 0.010 | 0.010 | 0.010 | 0.000 | 0.000 | n.d. | n.d. |
| P-6A | 0.010 | 0.010 | 0.010 | 0.010 | 0.000 | 0.000 | n.d. | n.d. |
| P-7A | 0.010 | 0.010 | 0.010 | 0.011 | 0.000 | 0.000 | 4.690 | 22.000 |
| P-9 | 0.012 | 0.010 | 0.010 | 0.030 | 0.000 | 0.005 | 3.352 | 12.267 |
| P-10A | 0.011 | 0.010 | 0.010 | 0.018 | 0.000 | 0.002 | 3.877 | 15.730 |
| P-11A | 0.011 | 0.010 | 0.010 | 0.018 | 0.000 | 0.002 | 3.954 | 16.185 |
| P-12A | 0.010 | 0.010 | 0.010 | 0.010 | 0.000 | 0.000 | n.d. | n.d. |
| P-14A | 0.010 | 0.010 | 0.010 | 0.010 | 0.000 | 0.000 | n.d. | n.d. |
| P-15 | 0.010 | 0.010 | 0.000 | 0.018 | 0.000 | 0.003 | −1.043 | 11.007 |
| P-17 | 0.010 | 0.010 | 0.010 | 0.010 | 0.000 | 0.000 | n.d. | n.d. |
| Zdounky landfill | ||||||||
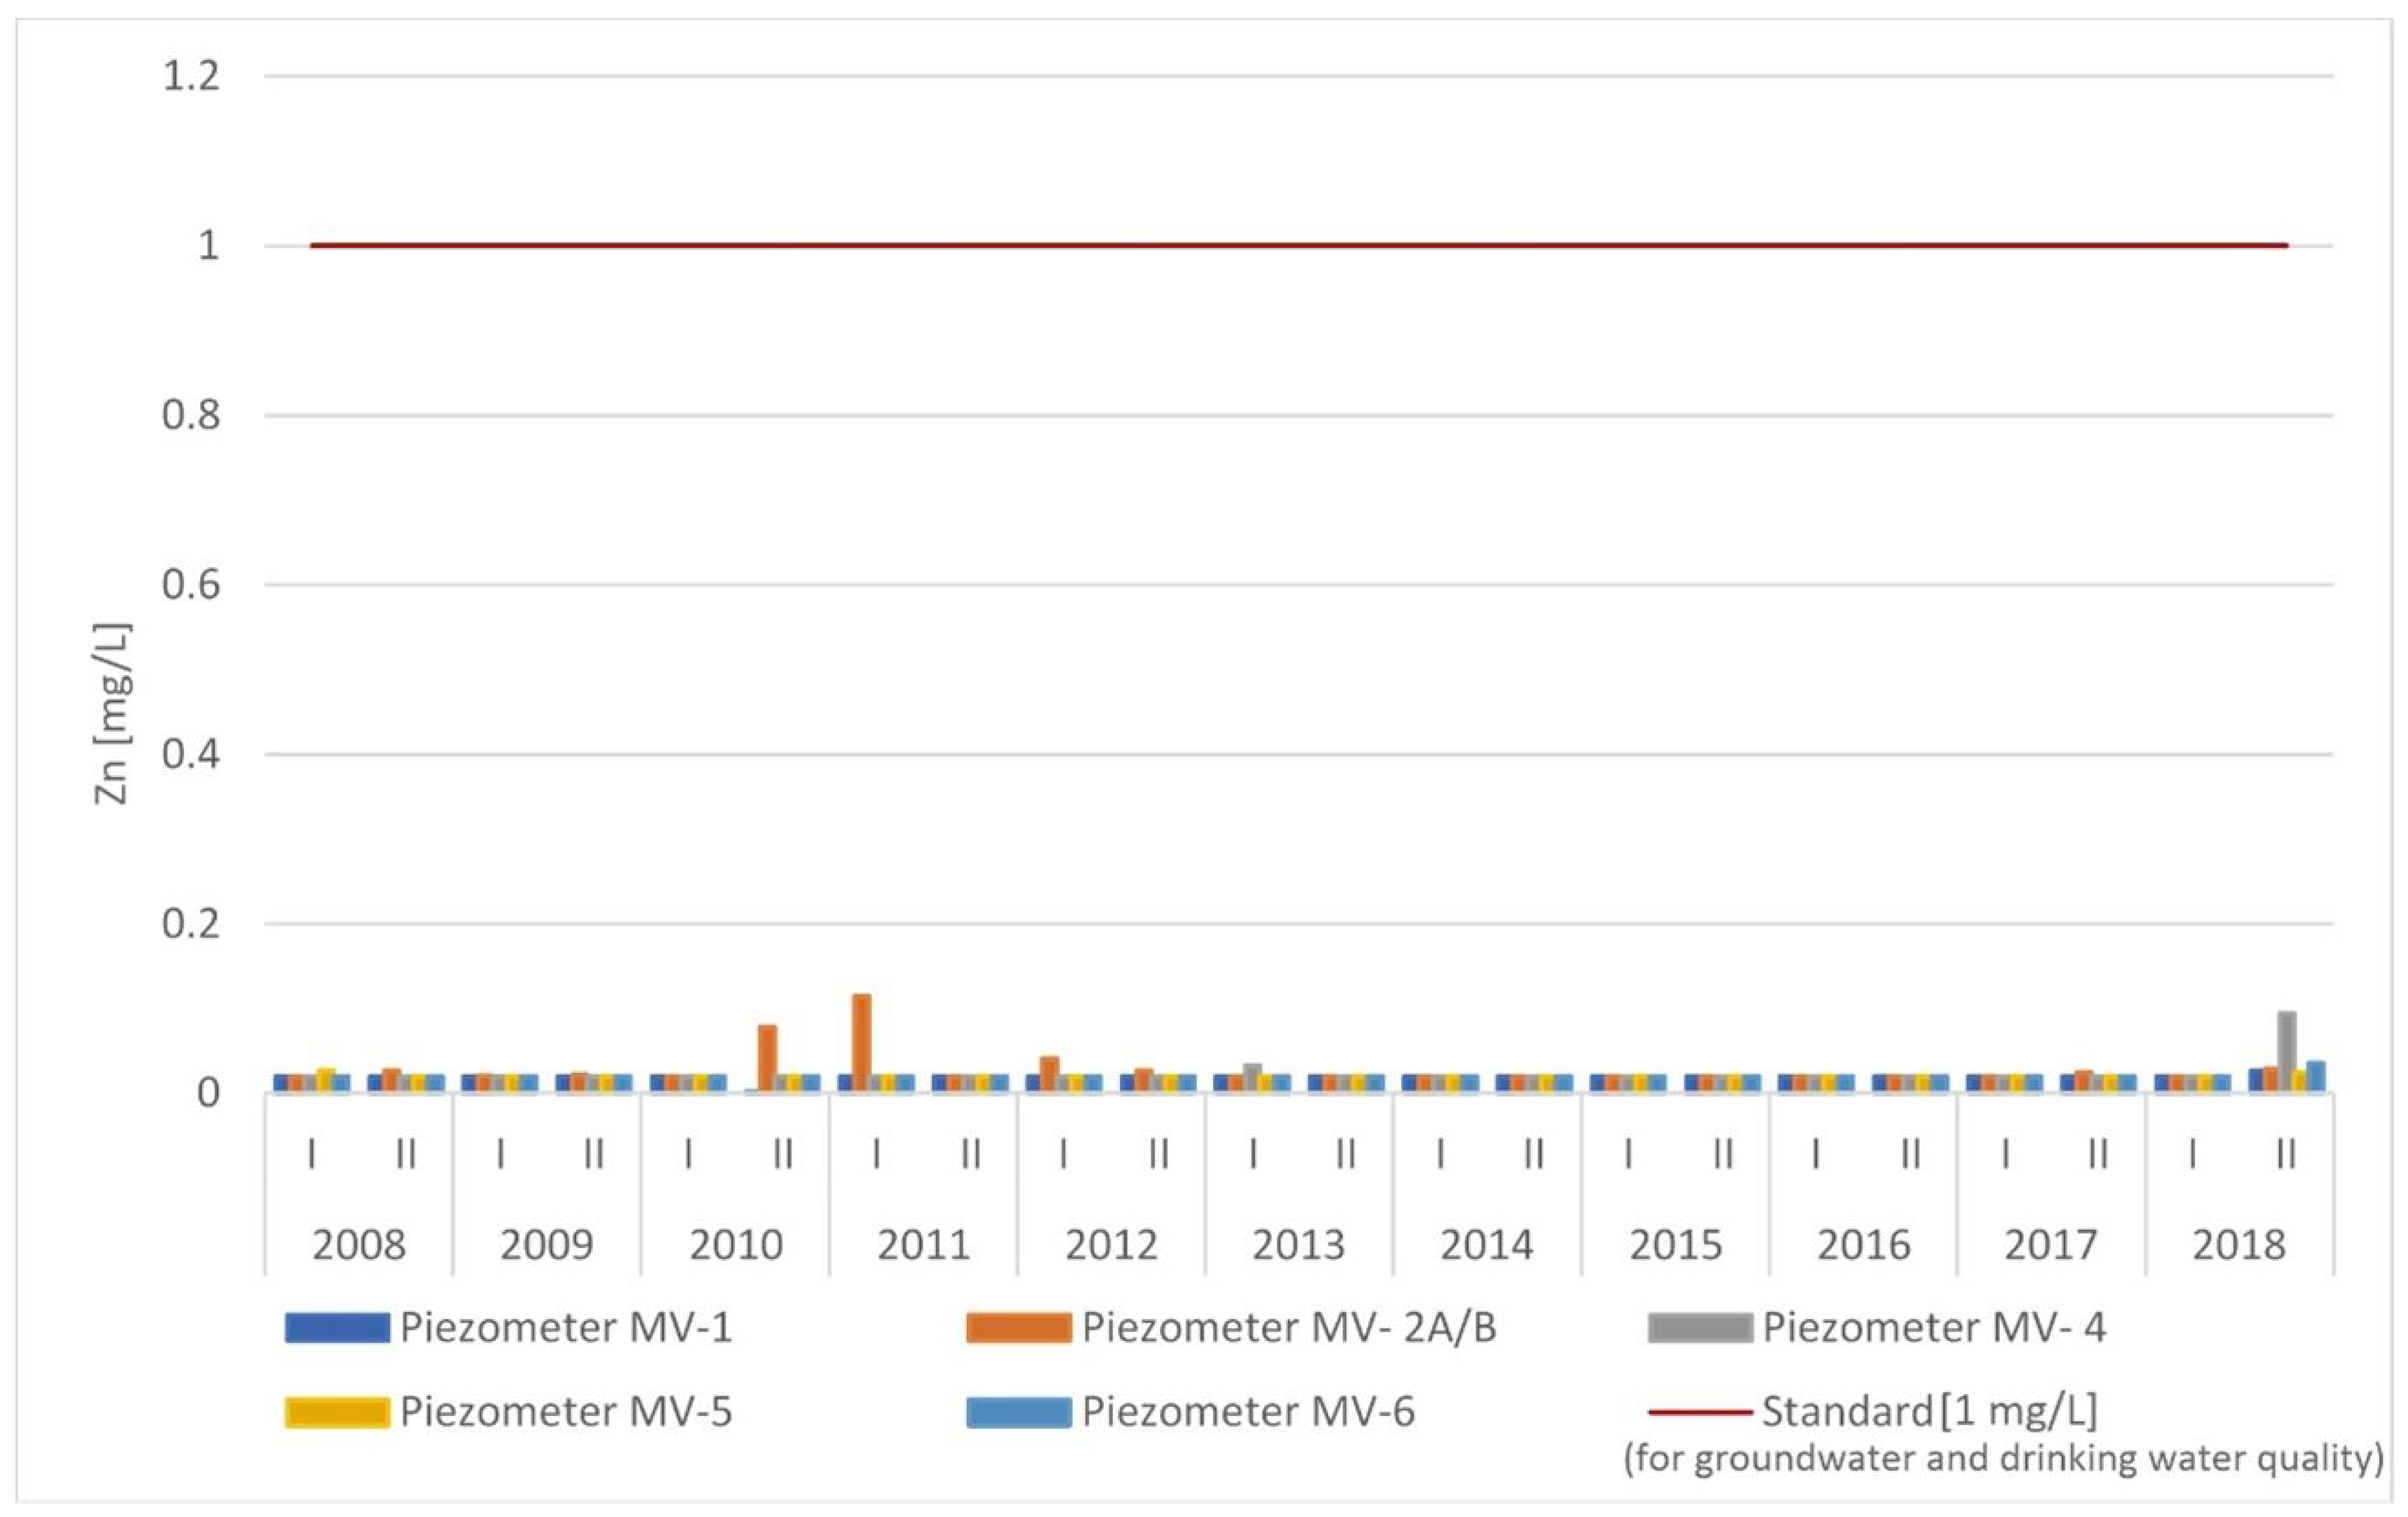
| MV-1 | 0.04 | 0.04 | 0.00 | 0.12 | 0.00 | 0.03 | 0.25 | −0.15 |
| MV-2 A/B | 0.04 | 0.04 | 0.00 | 0.10 | 0.00 | 0.03 | 0.12 | −0.96 |
| MV-4 | 0.04 | 0.04 | 0.00 | 0.09 | 0.00 | 0.03 | −0.12 | −1.11 |
| MV-5 | 0.05 | 0.05 | 0.00 | 0.15 | 0.00 | 0.04 | 0.49 | −0.33 |
| MV-6 | 0.04 | 0.04 | 0.00 | 0.12 | 0.00 | 0.03 | 0.34 | −0.31 |
| Piezometer | Mean | Median | Minimum | Maximum | Variance | Standard Deviation | Skewness | Kurtosis |
|---|---|---|---|---|---|---|---|---|
| Radiowo landfill | ||||||||
| P2-A | 0.046 | 0.050 | 0.005 | 0.071 | 0.000 | 0.013 | −1.898 | 5.738 |
| P-4 | 0.042 | 0.050 | 0.005 | 0.057 | 0.000 | 0.016 | −1.601 | 1.380 |
| P-6A | 0.043 | 0.050 | 0.007 | 0.050 | 0.000 | 0.013 | −1.788 | 2.108 |
| P-7A | 0.045 | 0.050 | 0.004 | 0.060 | 0.000 | 0.016 | −2.100 | 3.482 |
| P-9 | 0.059 | 0.050 | 0.032 | 0.171 | 0.001 | 0.030 | 3.143 | 10.982 |
| P-10A | 0.072 | 0.050 | 0.009 | 0.380 | 0.006 | 0.079 | 3.223 | 11.738 |
| P-11A | 0.059 | 0.050 | 0.015 | 0.289 | 0.003 | 0.053 | 4.253 | 19.287 |
| P-12A | 0.052 | 0.050 | 0.012 | 0.152 | 0.001 | 0.024 | 3.553 | 16.294 |
| P-14A | 0.105 | 0.080 | 0.050 | 0.360 | 0.006 | 0.079 | 2.397 | 5.745 |
| P-15 | 0.065 | 0.050 | 0.020 | 0.252 | 0.003 | 0.056 | 2.881 | 7.807 |
| P-17 | 0.107 | 0.050 | 0.008 | 0.930 | 0.043 | 0.207 | 3.594 | 13.116 |
| Zdounky landfill | ||||||||
| MV-1 | 0.016 | 0.020 | 0.000 | 0.027 | 0.000 | 0.009 | −1.271 | −0.111 |
| MV-2 A/B | 0.025 | 0.020 | 0.000 | 0.114 | 0.001 | 0.026 | 2.316 | 6.489 |
| MV-4 | 0.019 | 0.020 | 0.000 | 0.094 | 0.000 | 0.019 | 2.877 | 11.715 |
| MV-5 | 0.016 | 0.020 | 0.000 | 0.027 | 0.000 | 0.009 | −1.232 | −0.155 |
| MV-6 | 0.016 | 0.020 | 0.000 | 0.036 | 0.000 | 0.010 | −0.741 | 0.255 |
| Piezometer | Mean | Median | Minimum | Maximum | Variance | Standard Deviation | Skewness | Kurtosis |
|---|---|---|---|---|---|---|---|---|
| Radiowo landfill | ||||||||
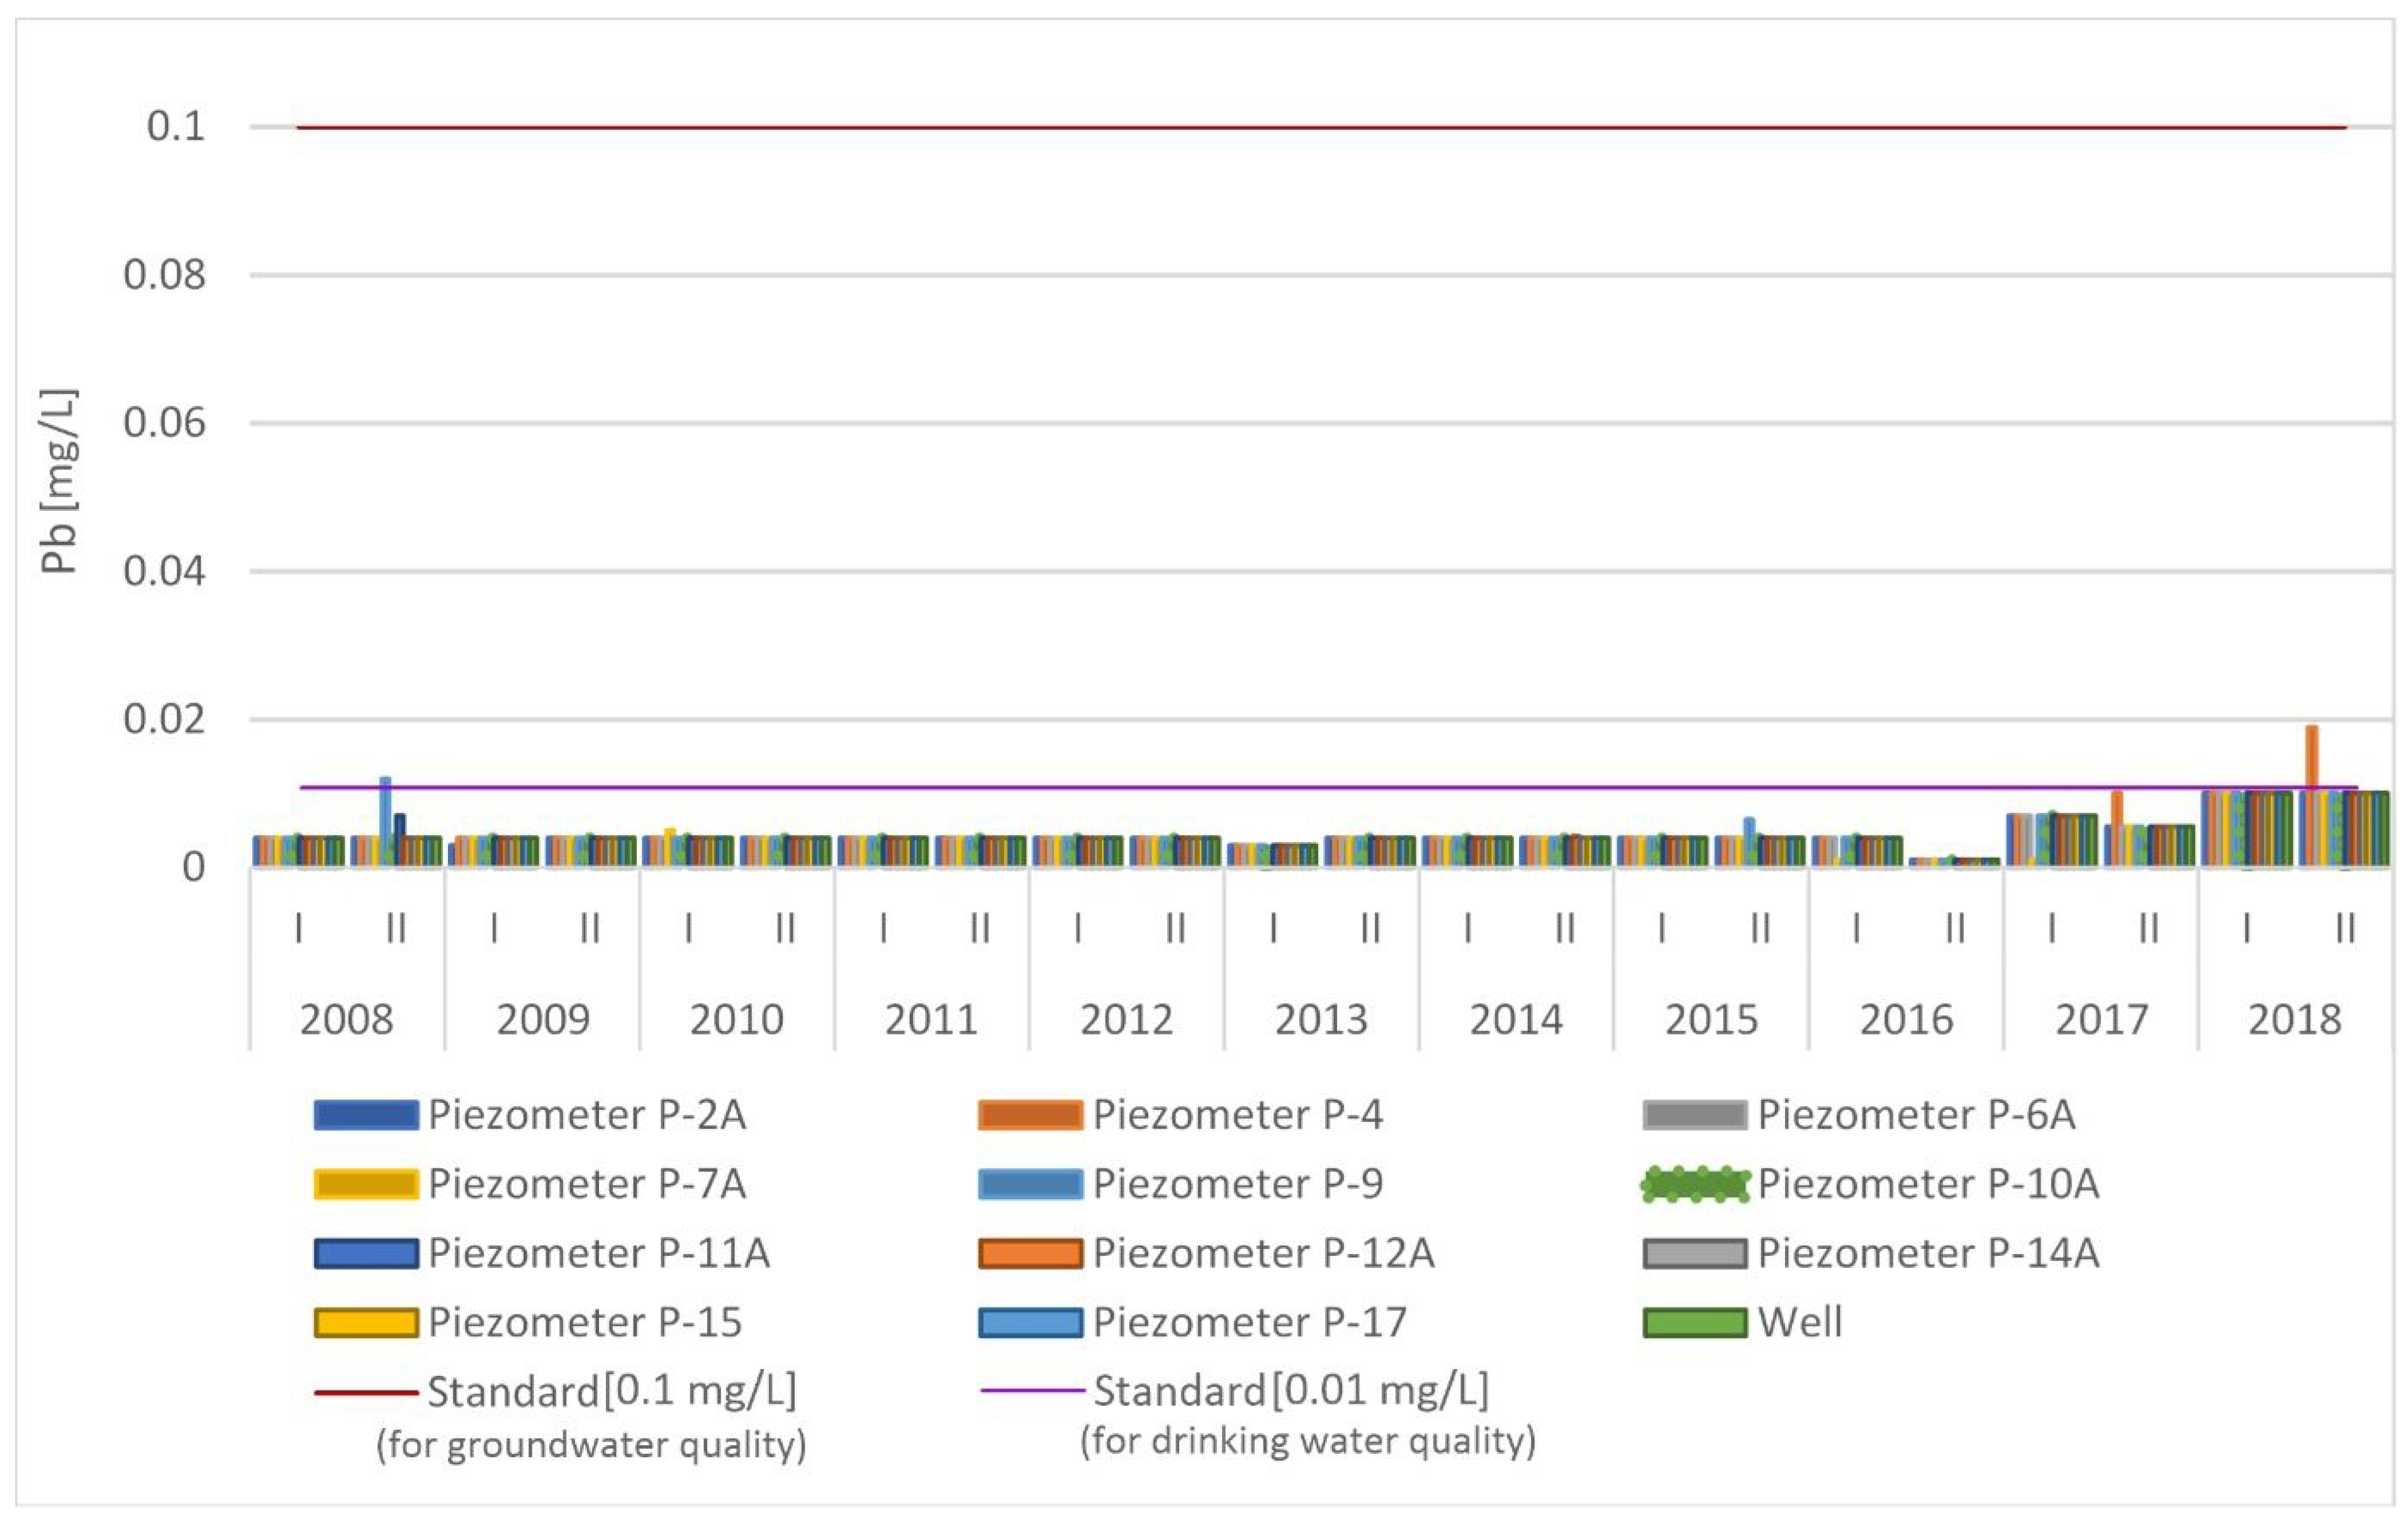
| P2-A | 0.005 | 0.004 | 0.001 | 0.010 | 0.000 | 0.002 | 1.775 | 3.717 |
| P-4 | 0.005 | 0.004 | 0.001 | 0.019 | 0.000 | 0.004 | 2.886 | 9.544 |
| P-6A | 0.005 | 0.004 | 0.001 | 0.010 | 0.000 | 0.002 | 1.787 | 3.853 |
| P-7A | 0.004 | 0.004 | 0.001 | 0.010 | 0.000 | 0.002 | 1.419 | 3.403 |
| P-9 | 0.005 | 0.004 | 0.001 | 0.012 | 0.000 | 0.003 | 1.529 | 2.077 |
| P-10A | 0.005 | 0.004 | 0.001 | 0.010 | 0.000 | 0.002 | 1.787 | 3.853 |
| P-11A | 0.005 | 0.004 | 0.001 | 0.010 | 0.000 | 0.002 | 1.505 | 2.650 |
| P-12A | 0.005 | 0.004 | 0.001 | 0.010 | 0.000 | 0.002 | 1.779 | 3.846 |
| P-14A | 0.005 | 0.004 | 0.001 | 0.010 | 0.000 | 0.002 | 1.787 | 3.853 |
| P-15 | 0.005 | 0.004 | 0.001 | 0.010 | 0.000 | 0.002 | 1.787 | 3.853 |
| P-17 | 0.005 | 0.004 | 0.001 | 0.010 | 0.000 | 0.002 | 1.787 | 3.853 |
| Zdounky landfill | ||||||||
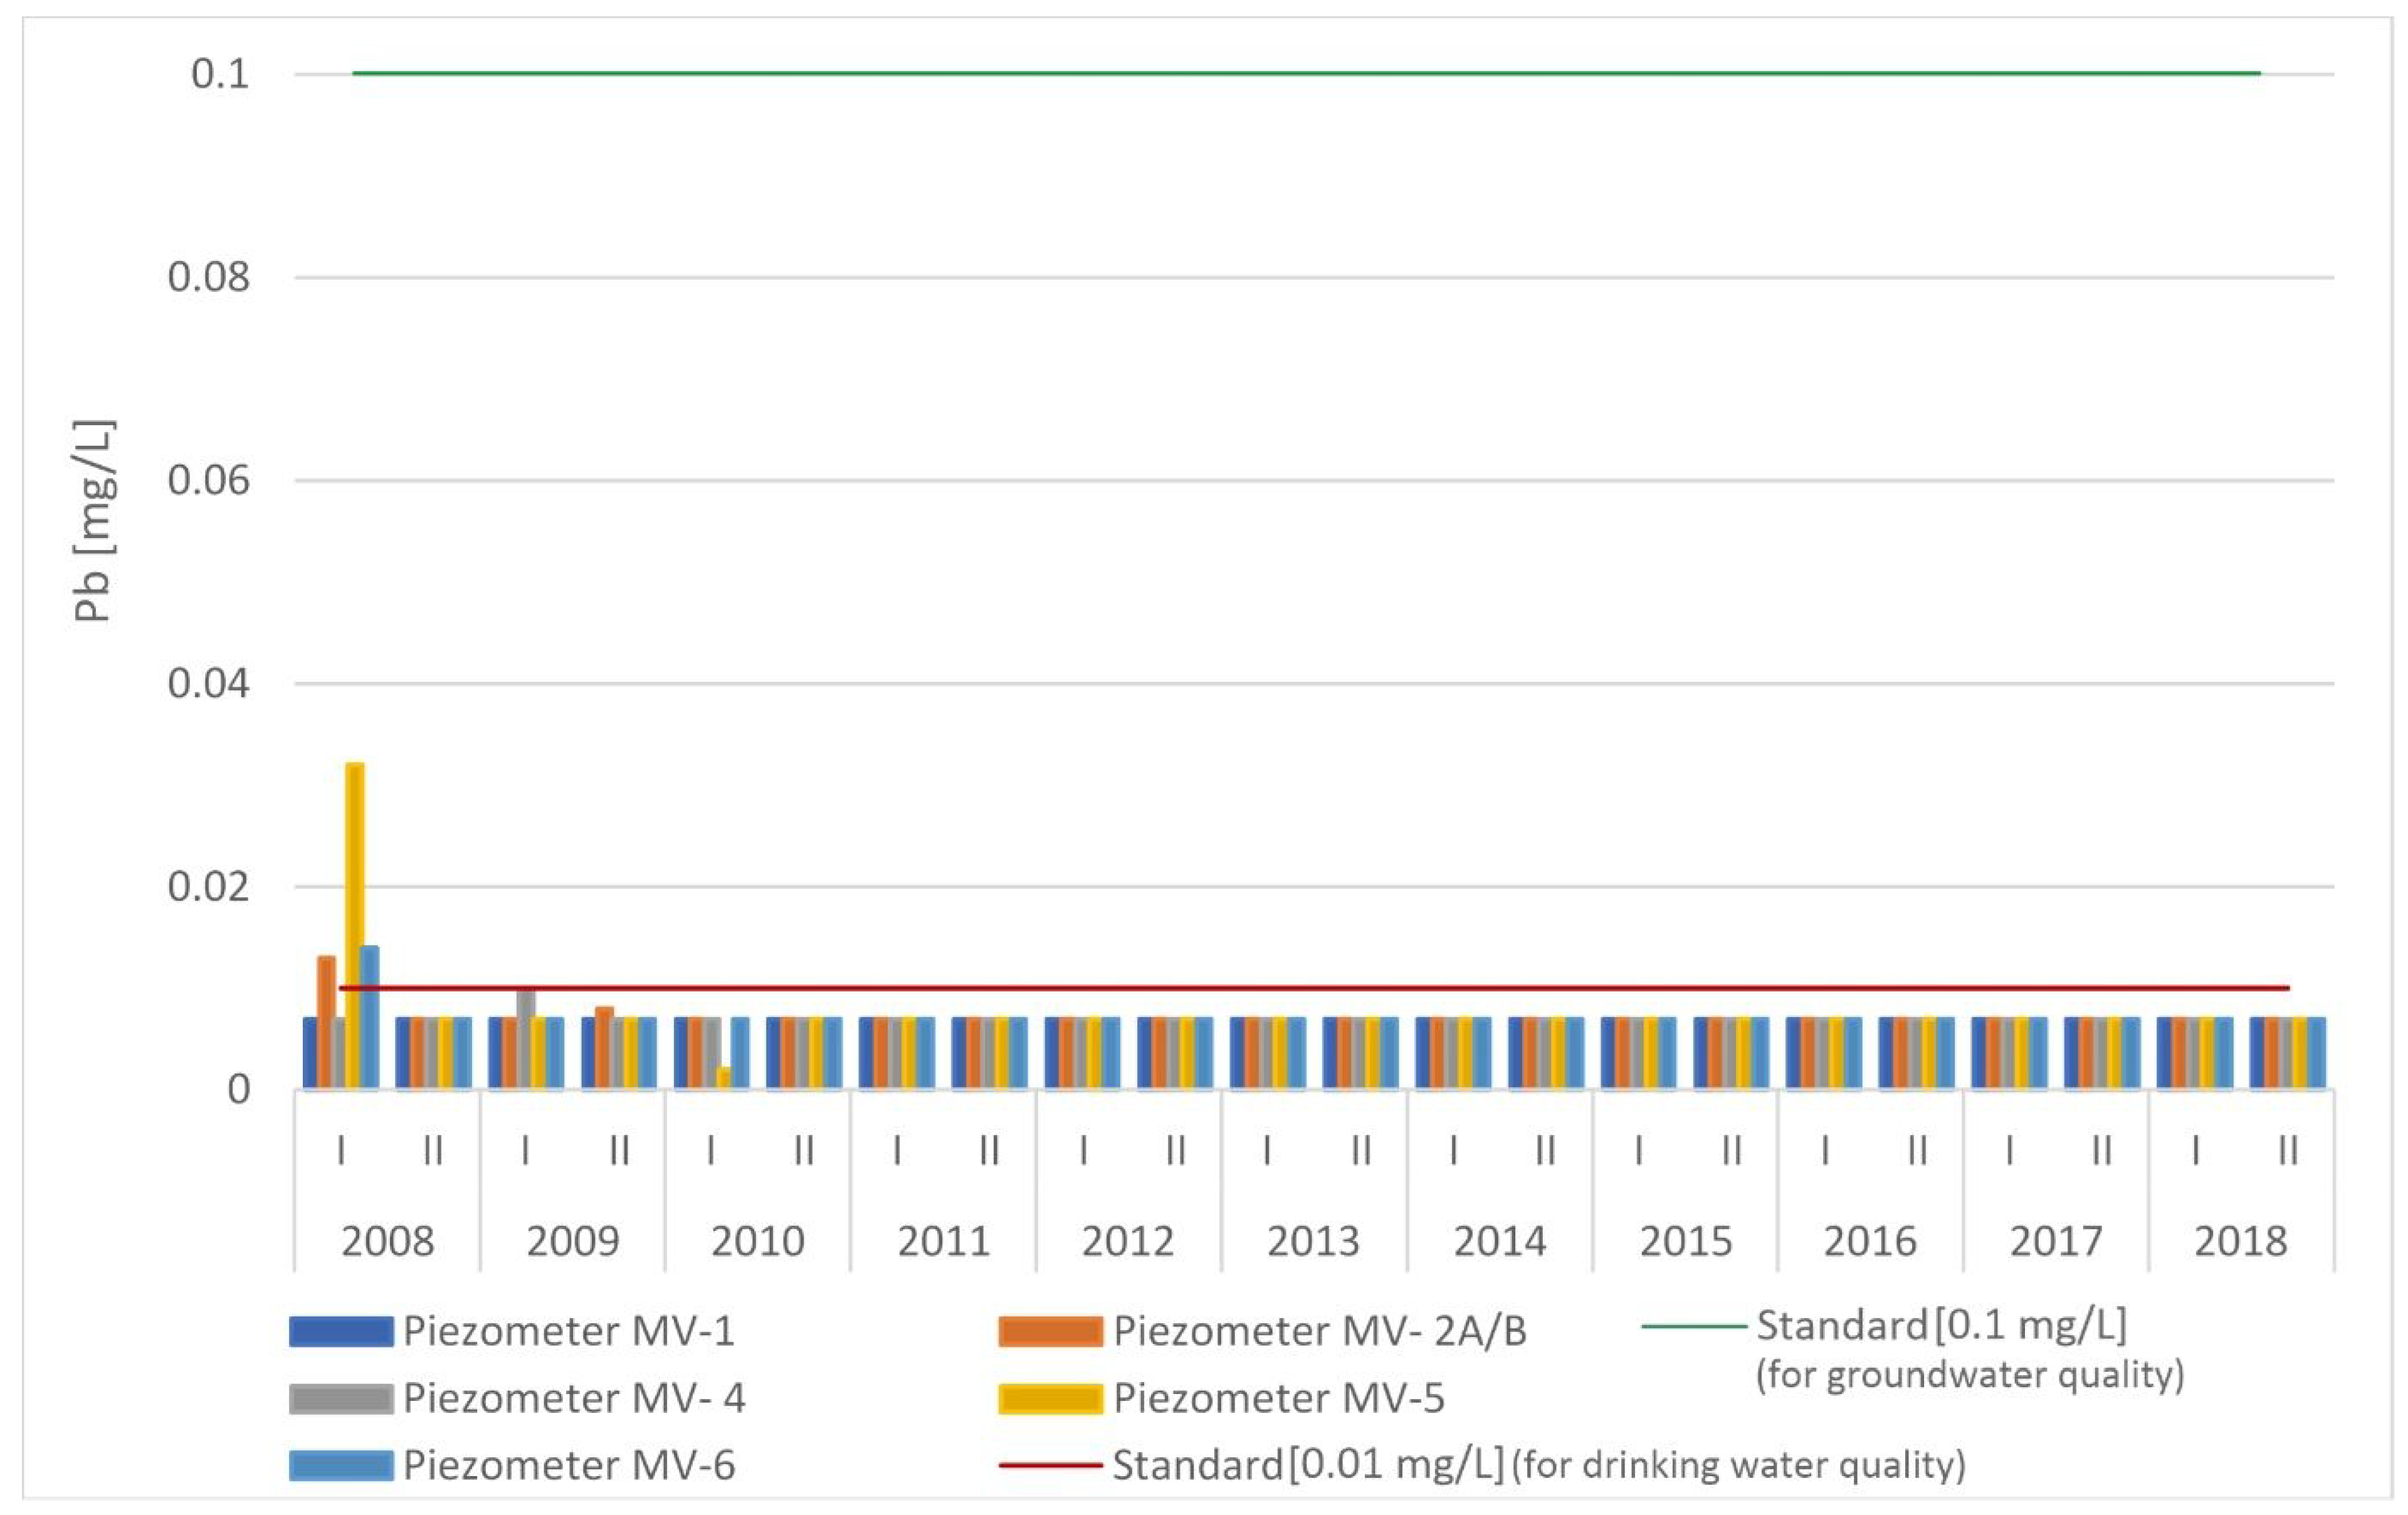
| MV-1 | 0.008 | 0.007 | 0.000 | 0.070 | 0.000 | 0.014 | 4.336 | 19.809 |
| MV-2 A/B | 0.009 | 0.007 | 0.000 | 0.070 | 0.000 | 0.014 | 4.238 | 19.156 |
| MV-4 | 0.008 | 0.007 | 0.000 | 0.070 | 0.000 | 0.014 | 4.303 | 19.596 |
| MV-5 | 0.054 | 0.045 | 0.000 | 0.150 | 0.002 | 0.043 | 0.489 | −0.334 |
| MV-6 | 0.009 | 0.007 | 0.000 | 0.070 | 0.000 | 0.015 | 3.569 | 13.791 |
| Piezometer | Mean | Median | Minimum | Maximum | Variance | Standard Deviation | Skewness | Kurtosis |
|---|---|---|---|---|---|---|---|---|
| Radiowo landfill | ||||||||
| P2-A | 0.0004 | 0.0003 | 0.0003 | 0.0010 | 0.0000 | 0.0002 | 2.1061 | 3.4662 |
| P-4 | 0.0004 | 0.0003 | 0.0003 | 0.0010 | 0.0000 | 0.0002 | 2.1061 | 3.4662 |
| P-6A | 0.0004 | 0.0003 | 0.0003 | 0.0010 | 0.0000 | 0.0002 | 2.1061 | 3.4662 |
| P-7A | 0.0004 | 0.0003 | 0.0003 | 0.0007 | 0.0000 | 0.0001 | 2.2065 | 3.7459 |
| P-9 | 0.0004 | 0.0003 | 0.0003 | 0.0010 | 0.0000 | 0.0002 | 2.1061 | 3.4662 |
| P-10A | 0.0004 | 0.0003 | 0.0003 | 0.0010 | 0.0000 | 0.0002 | 2.1061 | 3.4662 |
| P-11A | 0.0004 | 0.0003 | 0.0003 | 0.0010 | 0.0000 | 0.0002 | 2.0789 | 3.4079 |
| P-12A | 0.0004 | 0.0003 | 0.0003 | 0.0010 | 0.0000 | 0.0002 | 2.1061 | 3.4662 |
| P-14A | 0.0004 | 0.0003 | 0.0003 | 0.0010 | 0.0000 | 0.0002 | 2.1061 | 3.4662 |
| P-15 | 0.0004 | 0.0003 | 0.0003 | 0.0010 | 0.0000 | 0.0002 | 2.1061 | 3.4662 |
| P-17 | 0.0005 | 0.0003 | 0.0003 | 0.0020 | 0.0000 | 0.0004 | 2.9317 | 9.5506 |
| Zdounky landfill | ||||||||
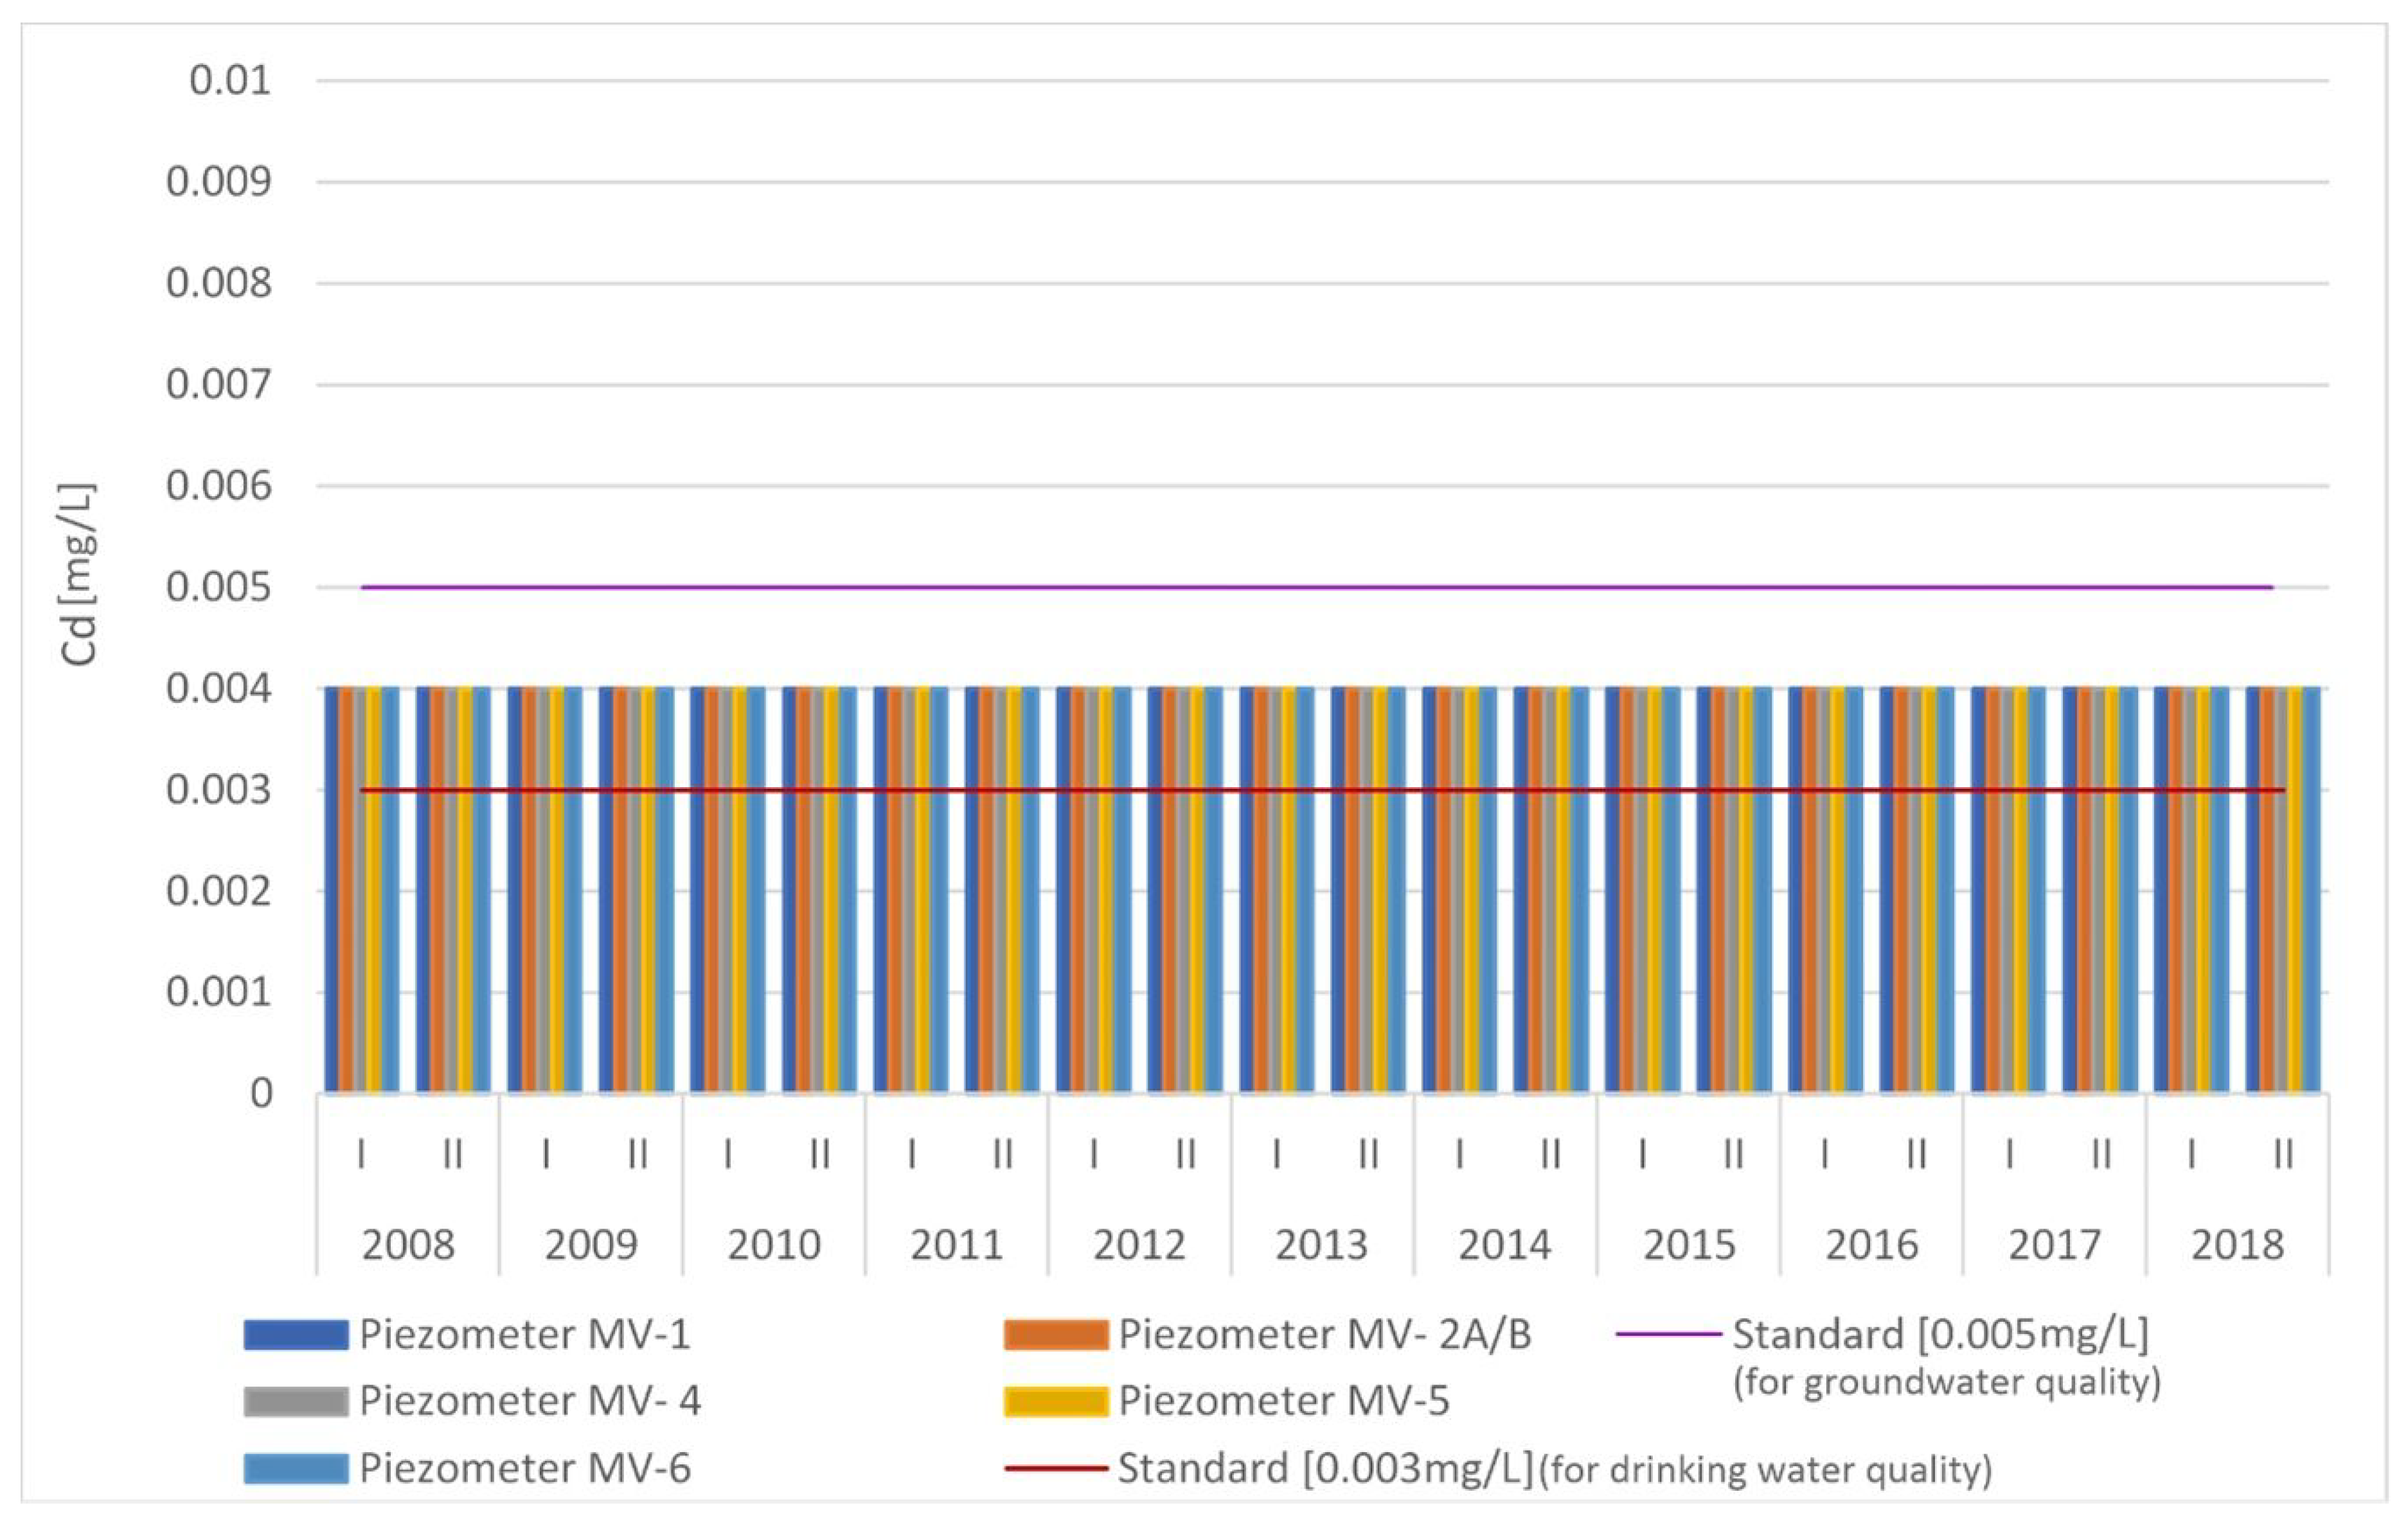
| MV-1 | 0.0031 | 0.0040 | 0.0000 | 0.0040 | 0.0000 | 0.0017 | −1.3988 | −0.0572 |
| MV-2 A/B | 0.0031 | 0.0040 | 0.0000 | 0.0040 | 0.0000 | 0.0017 | −1.3988 | −0.0572 |
| MV-4 | 0.0031 | 0.0040 | 0.0000 | 0.0040 | 0.0000 | 0.0017 | −1.3988 | −0.0572 |
| MV-5 | 0.0031 | 0.0040 | 0.0000 | 0.0040 | 0.0000 | 0.0017 | −1.3988 | −0.0572 |
| MV-6 | 0.0031 | 0.0040 | 0.0000 | 0.0040 | 0.0000 | 0.0017 | −1.3988 | −0.0572 |
| Piezometer | Mean | Median | Minimum | Maximum | Variance | Standard Deviation | Skewness | Kurtosis |
|---|---|---|---|---|---|---|---|---|
| Radiowo landfill | ||||||||
| P2-A | 0.0001 | 0.0001 | 0.0001 | 0.0005 | 0.0000 | 0.0002 | 2.2082 | 3.2965 |
| P-4 | 0.0001 | 0.0001 | 0.0001 | 0.0005 | 0.0000 | 0.0002 | 2.2082 | 3.2965 |
| P-6A | 0.0001 | 0.0001 | 0.0001 | 0.0005 | 0.0000 | 0.0002 | 2.2082 | 3.2965 |
| P-7A | 0.0001 | 0.0001 | 0.0001 | 0.0005 | 0.0000 | 0.0002 | 2.2082 | 3.2965 |
| P-9 | 0.0001 | 0.0001 | 0.0001 | 0.0005 | 0.0000 | 0.0002 | 2.2082 | 3.2965 |
| P-10A | 0.0001 | 0.0001 | 0.0001 | 0.0005 | 0.0000 | 0.0002 | 2.2082 | 3.2965 |
| P-11A | 0.0001 | 0.0001 | 0.0001 | 0.0005 | 0.0000 | 0.0002 | 2.2082 | 3.2965 |
| P-12A | 0.0001 | 0.0001 | 0.0001 | 0.0005 | 0.0000 | 0.0002 | 2.2082 | 3.2965 |
| P-14A | 0.0001 | 0.0001 | 0.0001 | 0.0005 | 0.0000 | 0.0002 | 2.2082 | 3.2965 |
| P-15 | 0.0001 | 0.0001 | 0.0001 | 0.0005 | 0.0000 | 0.0002 | 2.2082 | 3.2965 |
| P-17 | 0.0001 | 0.0001 | 0.0001 | 0.0005 | 0.0000 | 0.0002 | 2.2082 | 3.2965 |
| Zdounky landfill | ||||||||
| MV-1 | 0.0008 | 0.0010 | 0.0000 | 0.0010 | 0.0000 | 0.0004 | −1.3988 | −0.0572 |
| MV-2 A/B | 0.0008 | 0.0010 | 0.0000 | 0.0010 | 0.0000 | 0.0004 | −1.3988 | −0.0572 |
| MV-4 | 0.0008 | 0.0010 | 0.0000 | 0.0010 | 0.0000 | 0.0004 | −1.3988 | −0.0572 |
| MV-5 | 0.0010 | 0.0010 | 0.0000 | 0.0050 | 0.0000 | 0.0010 | 3.2508 | 13.8396 |
| MV-6 | 0.0008 | 0.0010 | 0.0000 | 0.0010 | 0.0000 | 0.0004 | −1.3988 | −0.0572 |
References
- Przydatek, G.; Kanownik, W. Impact of a small municipal solid waste landfill on groundwater quality. Environ. Monit. Assess. 2019, 191, 169. [Google Scholar] [CrossRef] [Green Version]
- Sauve, G.; Van Acker, K. The environmental impacts of municipal solid waste landfills in Europe: A life cycle assessment of proper reference cases to support decision making. J. Environ. Manag. 2020, 261, 110216. [Google Scholar] [CrossRef]
- Eurostat. Available online: https://ec.europa.eu/eurostat/statisticsexplained/index.php?title=File:Municipal_waste_landfilled,_ncinerated,_recycled_and_composted,_EU-27,_1995-2019.png (accessed on 21 February 2021).
- Zhang, C.; Xu, T.; Feng, H.; Chen, S. Greenhouse Gas Emissions from Landfills: A Review and Bibliometric Analysis. Sustainability 2019, 11, 2282. [Google Scholar] [CrossRef] [Green Version]
- Chidichimo, F.; De Biase, M.; Straface, S. Groundwater pollution assessment in landfill areas: Is it only about the leachate? Waste Manag. 2020, 102, 655–666. [Google Scholar] [CrossRef] [PubMed]
- Ríos, A.-M.; Picazo-Tadeo, A.J. Measuring environmental performance in the treatment of municipal solid waste: The case of the European Union-28. Ecol. Indic. 2021, 123, 107328. [Google Scholar] [CrossRef]
- Nikulishyn, V.; Savchyn, I.; Lompas, O.; Lozynskyi, V. Applying of geodetic methods for monitoring the effects of waste-slide at Lviv municipal solid waste landfill. Environ. Nanotechnol. Monit. Manag. 2020, 13, 13. [Google Scholar] [CrossRef]
- Piekutin, J. Monitoring of Groundwater in the Area of a Reclaimed Municipal Waste Landfill. J. Ecol. Eng. 2019, 20, 262–268. [Google Scholar] [CrossRef]
- Abiriga, D.; Vestgarden, L.S.; Klempe, H. Groundwater contamination from a municipal landfill: Effect of age, landfill closure, and season on groundwater chemistry. Sci. Total Environ. 2020, 737, 140307. [Google Scholar] [CrossRef] [PubMed]
- Moody, C.M.; Townsend, T.G. A comparison of landfill leachates based on waste composition. Waste Manag. 2017, 63, 267–274. [Google Scholar] [CrossRef]
- Kapelewska, J. Odcieki ze Składowisk Odpadów Komunalnych Jako Potencjalne Źródło Zanieczyszczenia Środowiska Wodnego. Ph.D. Thesis, Uniwersytet w Białymstoku, Białystok, Poland, 2018. [Google Scholar]
- Renou, S.; Givaudan, J.; Poulain, S.; Dirassouyan, F.; Moulin, P. Landfill leachate treatment: Review and opportunity. J. Hazard. Mater. 2008, 150, 468–493. [Google Scholar] [CrossRef]
- Vaverková, M.; Adamcova, D. Evaluation of landfill leachate pollution: Findings from a monitoring study at municipal waste landfill. J. Ecol. Eng. 2015, 16, 19–32. [Google Scholar] [CrossRef] [Green Version]
- Aharoni, I.; Siebner, H.; Yogev, U.; Dahan, O. Holistic approach for evaluation of landfill leachate pollution potential—From the waste to the aquifer. Sci. Total Environ. 2020, 741, 140367. [Google Scholar] [CrossRef]
- Murtaza, G.; Sabihakhurram, H.R. Assessment of Heavy Metals Contamination in Water, Soil and Plants around the Landfill in Khanewal Pakistan. Int. J. Res. Stud. Sci. Eng. Technol. 2018, 5, 7–13. [Google Scholar]
- Grygorczuk-Petersons, E. Effect of not-sealed municipal waste landfill on the underground water quality. Inżynieria Ekologiczna 2016, 48, 61–68. [Google Scholar] [CrossRef] [Green Version]
- Koda, E.; Miszkowska, A.; Sieczka, A.; Osiński, P. Cut-off Walls and Dewatering Systems as an Effective Method of Con-taminated Sites Reclamation Processes. IOP Conf. Ser. Mater. Sci. Eng. 2019, 471, 042021. [Google Scholar] [CrossRef]
- Smol, M.; Marcinek, P.; Koda, E. Drivers and Barriers for a Circular Economy (CE) Implementation in Poland—A Case Study of Raw Materials Recovery Sector. Energies 2021, 14, 2219. [Google Scholar] [CrossRef]
- Regulation of the Minister of the Environment of 30 April 2013 on landfills (Journal of Laws 2013, item 523). Available online: http://isap.sejm.gov.pl/isap.nsf/DocDetails.xsp?id=WDU20130000523 (accessed on 3 February 2021).
- Adamcová, D. Comparison of technical methods of securing closed landfills in the Czech Republic and Poland. Acta Sci. Pol. Arch. Bud. 2020, 18, 61–71. [Google Scholar] [CrossRef]
- Vaverková, M. Impact assessment of the municipal solid landfill on environment: A case study. Acta Sci. Pol. Arch. Bud. 2019, 18, 11–20. [Google Scholar] [CrossRef]
- Koda, E.; Miszkowska, A.; Sieczka, A. Levels of Organic Pollution Indicators in Groundwater at the Old Landfill and Waste Management Site. Appl. Sci. 2017, 7, 638. [Google Scholar] [CrossRef] [Green Version]
- Koda, E.; Sieczka, A.; Osinski, P. Ammonium Concentration and Migration in Groundwater in the Vicinity of Waste Management Site Located in the Neighborhood of Protected Areas of Warsaw, Poland. Sustainabilty 2016, 8, 1253. [Google Scholar] [CrossRef] [Green Version]
- Koda, E.; Osiński, P.; Kołanka, T. Flow numerical modeling for efficiency assessment of vertical barriers in landfills. In Coupled Phenomena in Environmental Geotechnics; Manassero, M., Dominijanni, A., Foti, S., Musso, G., Eds.; CRC Press/Balkema: London, UK, 2013; pp. 693–698. [Google Scholar]
- Vaverková, M.D.; Elbl, J.; Koda, E.; Adamcová, D.; Bilgin, A.; Lukas, V.; Podlasek, A.; Kintl, A.; Wdowska, M.; Brtnický, M.; et al. Chemical Composition and Hazardous Effects of Leachate from the Active Municipal Solid Waste Landfill Surrounded by Farmlands. Sustainability 2020, 12, 4531. [Google Scholar] [CrossRef]
- PKN. PN-EN ISO 5667-3:2013-05: Water Quality Sampling Part 3: Preservation and Handling of Water Samples; PKN: Warsaw, Poland, 2013. [Google Scholar]
- PKN. PN-ISO 5667-11:2004: Water Quality Sampling Part 11: Guidance on Sampling of Groundwater; PKN: Warsaw, Poland, 2004. [Google Scholar]
- Ireland’s EPA. Parameters of Groundwater Quality. Interpretation and Standards; Environmental Protection Agency: Wexford, Ireland, 2001.
- US EPA. Edition of the Drinking Water Standards and Health Advisories Tables; U.S. Environmental Protection Agency: Washington, DC, USA, 2018.
- World Health Organization (WHO). Guidelines for Drinking-Water Quality: Fourth Edition Incorporating First Addendum, 4th ed.; World Health Organization: Geneva, Switzerland, 2017. [Google Scholar]
- Regulation of the Minister of Health of 7 December 2017 on the Quality of Water Intended for Human Consumption. Journal of Laws 2017, Item 2294. Available online: http://isap.sejm.gov.pl/isap.nsf/DocDetails.xsp?id=WDU20170002294 (accessed on 3 March 2021).
- Regulation of the Minister of Marine Economy and Inland Navigation of 11 October 2019 on the Criteria and Method of As-sessing the Status of Groundwater Bodies. Journal of Laws 2019, Item 2148. Available online: https://isap.sejm.gov.pl/isap.nsf/DocDetails.xsp?id=WDU20190002148 (accessed on 3 March 2021).
- Edet, A.E.; Offiong, O.E. Evaluation of water quality pollution indices for heavy metal contamination moni-toring. A study case from Akpabuyo-Odukpani area, Lower Cross River Basin (Southeastern Nigeria). GeoJournal 2002, 57, 295–304. [Google Scholar] [CrossRef]
- Maskooni, E.K.; Naseri-Rad, M.; Berndtsson, R.; Nakagawa, K. Use of Heavy Metal Content and Modified Water Quality Index to Assess Groundwater Quality in a Semiarid Area. Water 2020, 12, 1115. [Google Scholar] [CrossRef] [Green Version]
- Ghaderpoori, M.; Kamarehie, B.; Jafari, A.; Ghaderpoury, A.; Karami, M. Heavy metals analysis and quality assessment in drinking water—Khorramabad city, Iran. Data Brief 2018, 16, 685–692. [Google Scholar] [CrossRef] [PubMed]
- Nawrot, N.; Wojciechowska, E.; Rezania, S.; Walkusz-Miotk, J.; Pazdro, K. The effects of urban vehicle traffic on heavy metal contamination in road sweeping waste and bottom sediments of retention tanks. Sci. Total Environ. 2020, 749, 141511. [Google Scholar] [CrossRef] [PubMed]
- Adachi, K.; Tainosho, Y. Characterization of heavy metal particles embedded in tire dust. Environ. Int. 2004, 30, 1009–1017. [Google Scholar] [CrossRef]
- Hamid, Y.; Tang, L.; Sohail, M.I.; Cao, X.; Hussain, B.; Aziz, M.Z.; Usman, M.; He, Z.-L.; Yang, X. An explanation of soil amendments to reduce cadmium phytoavailability and transfer to food chain. Sci. Total Environ. 2019, 660, 80–96. [Google Scholar] [CrossRef]
- Bulmer, M.G. Principles of Statistics; Dover: Mineola, NY, USA, 1979. [Google Scholar]
- Balanda, K.P.; MacGillivray, H.L. Kurtosis: A Critical Review. Am. Stat. 1988, 42, 111–119. [Google Scholar] [CrossRef]
- Robinson, T. Removal of toxic metals during biological treatment of landfill leachates. Waste Manag. 2017, 63, 299–309. [Google Scholar] [CrossRef]
- Bilardi, S.; Calabrò, P.S.; Greco, R.; Moraci, N. Selective removal of heavy metals from landfill leachate by reactive granular filters. Sci. Total Environ. 2018, 644, 335–341. [Google Scholar] [CrossRef] [PubMed]
- Boateng, T.K.; Opoku, F.; Akoto, O. Heavy metal contamination assessment of groundwater quality: A case study of Oti landfill site, Kumasi. Appl. Water Sci. 2019, 9, 33. [Google Scholar] [CrossRef] [Green Version]
- Zeng, D.; Chen, G.; Zhou, P.; Xu, H.; Qiong, A.; Duo, B.; Lu, X.; Wang, Z.; Han, Z. Factors influencing groundwater contamination near municipal solid waste landfill sites in the Qinghai-Tibetan plateau. Ecotoxicol. Environ. Saf. 2021, 211, 111913. [Google Scholar] [CrossRef] [PubMed]
- Koda, E.; Grzyb, M.; Osiński, P.; Vaverkova, M.D. Analysis of failure in landfill construction systems. Matec. Web Conf. 2019, 284, 03002. [Google Scholar] [CrossRef]
- Sun, X.-C.; Xu, Y.; Liu, Y.-Q.; Nai, C.-X.; Dong, L.; Liu, J.-C.; Huang, Q.-F. Evolution of geomembrane degradation and defects in a landfill: Impacts on long-term leachate leakage and groundwater quality. J. Clean. Prod. 2019, 224, 335–345. [Google Scholar] [CrossRef]
- Ahamad, A.; Raju, N.J.; Madhav, S.; Gossel, W.; Wycisk, P. Impact of non-engineered Bhalswa landfill on groundwater from Quaternary alluvium in Yamuna flood plain and potential human health risk, New Delhi, India. Quat. Int. 2019, 507, 352–369. [Google Scholar] [CrossRef]
- Koda, E.; Miszkowska, A.; Sieczka, A.; Osiński, P. Heavy metals contamination within restored landfill site in Poland. Environ. Geotech. 2020, 7, 512–521. [Google Scholar] [CrossRef]
- Javahershenas, M.; Nabizadeh, R.; Alimohammadi, M.; Mahvi, A.H. The effects of Lahijan landfill leachate on the quality of surface and groundwater resources. Int. J. Environ. Anal. Chem. 2020, 1–17. [Google Scholar] [CrossRef]
- De, S.; Maiti, S.K.; Hazra, T.; Dutta, A. Evaluation of the impact of landfill leachate on groundwater quality in Kolkata, India. Pollution 2017, 3, 443–452. [Google Scholar]
- Teta, C.; Hikwa, T. Heavy Metal Contamination of Ground Water from an Unlined Landfill in Bulawayo, Zimbabwe. J. Health Pollut. 2017, 7, 18–27. [Google Scholar] [CrossRef] [Green Version]
- Amano, K.O.A.; Danso-Boateng, E.; Adom, E.; Nkansah, D.K.; Amoamah, E.S.; Appiah-Danquah, E. Effect of waste landfill site on surface and ground water drinking quality. Water Environ. J. 2021, 35, 715–729. [Google Scholar] [CrossRef]
- Vongdala, N.; Tran, H.-D.; Xuan, T.D.; Teschke, R.; Khanh, T.D. Heavy Metal Accumulation in Water, Soil, and Plants of Municipal Solid Waste Landfill in Vientiane, Laos. Int. J. Environ. Res. Public Health 2018, 16, 22. [Google Scholar] [CrossRef] [Green Version]
- Ančić, M.; Huđek, A.; Rihtarić, I.; Cazar, M.; Bačun-Družina, V.; Kopjar, N.; Durgo, K. PHYSICO chemical properties and toxicological effect of landfill groundwaters and leachates. Chemosphere 2020, 238, 124574. [Google Scholar] [CrossRef] [PubMed]
- Olagunju, T.; Olagunju, A.; Akawu, I.; Ugokwe, C. Quantification and Risk Assessment of Heavy Metals in Groundwater and Soil of Residential Areas around Awotan Landfill, Ibadan, Southwest-Nigeria. J. Toxicol. Risk Assess. 2020, 6. [Google Scholar] [CrossRef]
- Ravindra, K.; Mor, S. Distribution and health risk assessment of arsenic and selected heavy metals in Groundwater of Chandigarh, India. Environ. Pollut. 2019, 250, 820–830. [Google Scholar] [CrossRef] [PubMed]
- Han, Z.; Ma, H.; Shi, G.; He, L.; Wei, L.; Shi, Q. A review of groundwater contamination near municipal solid waste landfill sites in China. Sci. Total Environ. 2016, 569–570, 1255–1264. [Google Scholar] [CrossRef] [PubMed]


| Standard | Specific Value | Crtotal [mg L−1] | Zn [mg L−1] | Pb [mg L−1] | Cd [mg L−1] | Hg [mg L−1] |
|---|---|---|---|---|---|---|
| Ireland’s EPA, 2001 [28] | I/PV | 0.05 | - | 0.01 | 0.005 | 0.001 |
| US EPA, 2018 [29] | MCLG | 0.1 | - | 0 | 0.005 | 0.002 |
| MCL | 0.1 | - | - | 0.005 | 0.002 | |
| SDWR | - | 5 | - | - | - | |
| WHO [30] | - | 0.05 | 1 | 0.01 | 0.003 | 0.006 |
| Polish Regulation a [31] | - | 0.05 | 0.01 | 0.005 | 0.001 | |
| Polish Regulation b [32] | - | 0.05 | 1 | 0.1 | 0.005 | 0.001 |
| Geochemical bacground [32] | - | 0.0001–0.010 | 0.005–0.050 | 0.001–0.010 | 0.0001–0.0005 | 0.00005–0.001 |
Publisher’s Note: MDPI stays neutral with regard to jurisdictional claims in published maps and institutional affiliations. |
© 2021 by the authors. Licensee MDPI, Basel, Switzerland. This article is an open access article distributed under the terms and conditions of the Creative Commons Attribution (CC BY) license (https://creativecommons.org/licenses/by/4.0/).
Share and Cite
Podlasek, A.; Jakimiuk, A.; Vaverková, M.D.; Koda, E. Monitoring and Assessment of Groundwater Quality at Landfill Sites: Selected Case Studies of Poland and the Czech Republic. Sustainability 2021, 13, 7769. https://doi.org/10.3390/su13147769
Podlasek A, Jakimiuk A, Vaverková MD, Koda E. Monitoring and Assessment of Groundwater Quality at Landfill Sites: Selected Case Studies of Poland and the Czech Republic. Sustainability. 2021; 13(14):7769. https://doi.org/10.3390/su13147769
Chicago/Turabian StylePodlasek, Anna, Aleksandra Jakimiuk, Magdalena Daria Vaverková, and Eugeniusz Koda. 2021. "Monitoring and Assessment of Groundwater Quality at Landfill Sites: Selected Case Studies of Poland and the Czech Republic" Sustainability 13, no. 14: 7769. https://doi.org/10.3390/su13147769