Abstract
The purpose of this study is to compare the economic viability of direct disposal and pyroprocessing. This is because the selection of an alternative cannot be justified without a guarantee of economic feasibility. This paper sets the KRS (Korea Reference System) spent fuel repository and KAPF+ (Korea Advanced Pyroprocess Facility plus) as the cost objects, administers a cost-benefit analysis, and presents the results on the net cost. The results of the calculation demonstrate that the net costs of direct disposal and pyroprocessing are USD 17,719,319,040 and USD 19,329,252,755, respectively. The difference in the net cost for the two alternatives is thus not insignificant. However, the economic viability of direct disposal was found to be superior compared to that of pyroprocessing. In the end, it was found that the operating and maintenance cost of a pyroprocessing facility is comparatively high. Accordingly, direct disposal costs less than pyroprocessing. The direct disposal option is advantageous in terms of economical nuclear power sustainability.
1. Introduction
The objective of this study is to increase the knowledge of the differences between two alternative solutions—direct disposal and pyroprocessing—for the back-end nuclear fuel cycle. Korea is currently considering direct disposal and pyroprocessing as alternatives for the disposal of spent nuclear fuel. Each of these two alternatives has advantages and disadvantages. To select one alternative, this study first analyzed economic feasibility using CB (cost and benefits). The results of CB can greatly contribute to establishing a nuclear policy for the back-end nuclear fuel cycle.
Pyroprocessing is one of the spent fuel management alternatives. It is a technology for the reuse of spent fuel by recovering uranium and TRU (TRansUranium) from spent fuel using the electrochemical method [1]. The recovered uranium and TRU can be used as the raw materials for SFR (Sodium-cooled Fast Reactor) nuclear fuel [2]. Moreover, the pyroprocess cannot extract pure plutonium, and it is known to have a high proliferation resistance [3].
Amid this background, Korea, Japan, China, Russia, the United States, and others are developing pyroprocessing technology. However, it is necessary to judge the economic viability of the pyroprocess before commercializing pyroprocessing technology. In other words, it is necessary to analyze the economic viability of the pyroprocess compared to that of direct disposal. An analysis of economic viability, which is the most important factor, must be conducted when comparing direct disposal and pyroprocessing [4]. This is because the selection of an alternative cannot be justified without a guarantee of economic feasibility [4]. Moreover, the necessary costs for direct disposal and pyroprocessing may be different depending on the environmental factors of each nation. Towards this end, this study set two alternatives, direct disposal and pyroprocessing, as the targets of a cost-benefit analysis [5,6], and analyzed economic viability by identifying the key cost drivers of each alternative [7]. In other words, benefit and cost for the identified key cost drivers were calculated. The relative economic viability was then judged based on the net cost, which is the difference between the cost and benefit [8]. Table 1 shows the comparison of the two options of direct disposal and pyroprocessing.

Table 1.
Comparison between direct disposal and pyroprocessing.
The cost calculation methods are first described in detail in Section 2. Namely, the direct disposal facility cost calculation method is described in Section 2.1, and in Section 2.2, the pyroprocess facility cost calculation method is presented. The quantitative cost and benefit of the two alternatives (direct disposal vs. pyroprocess) are presented in Section 3. Specifically, sensitivity analysis to discount the rate of both direct disposal cost and pyroprocessing cost was performed. In Section 4, we present the results of the cost-benefit analysis. Finally, conclusions are drawn from the net cost calculation results.
2. Materials and Methods
Back-end fuel cycle economic analysts use the following methods to select a better alternative to the back-end fuel cycle. In the first, theoretical mathematical models are used to analyze back-end nuclear fuel cycle alternatives. In the second, assuming evaluation objects, nuclear fuel cycle alternatives are compared based on evaluation criteria such as cost. This is a so-called empirical method. Therefore, this research method is closer to the latter method rather than a case study.
While theoretical methods are of great interest to groups of researchers studying the pure back-end nuclear fuel cycle theory, the empirical methods are of great interest to back-end nuclear fuel cycle policy makers. That is, this method is to develop knowledge about the best solution for the selection of nuclear fuel cycle alternatives. Therefore, in order to apply the empirical method, if the cost is set as the evaluation standard, a comparable evaluation object is required. To this end, in this study, the KRS (Korean Reference System) was assumed as the evaluation object of direct disposal, and KAPF+ (Korea Advanced Pyroprocess Facility Plus) was assumed as the evaluation object of the pyroprocessing nuclear fuel cycle. This is because KRS and KAPF+ are representative back-end nuclear fuel cycle facilities in Korea so far. The KRS and KAPF+ facilities are facilities that can solve the issue of the accumulated spent nuclear fuel in Korea. Therefore, the method assuming KRS and KAPF+ facilities as evaluation objects is judged to be the correct method. Input data for these facilities are required to analysis economic feasibility. It was collected jointly via a third party to increase reliability. For example, the data of KRS were collected in collaboration with Posiva of Finland, and the KAPF+ data were collected by Hyundai Eng. Co. Ltd, which has a lot of experience in designing nuclear fuel cycle facilities in Korea.
In general, a cost-benefit analysis is one of the most universal methods utilized to analyze the economic viability of public projects [9]. The incurred cost is calculated as overnight cost or as the present value [10]. Moreover, there are three types of cost-benefit analysis methods. First, economic viability is assessed based on the share of benefit and cost, as shown in Equation (1) [11]. It is judged that economic viability exists when the R value in Equation (1) is greater than 1. Moreover, when the two alternatives are compared, if the R values of the two alternatives are both greater than 1, then the alternative with greater R value is selected [12]. When the cost is incurred in the future, it is possible to compare the cost and benefit by converting to the present value of the base year.
Herein, benefit refers to the net benefit that deduces a non-benefit (negative effect) from all benefits (positive effect) that are for the beneficiary. Meanwhile, cost refers to the net cost that deduced a loss reduction or income resulting from investments from all costs incurred for the public projects.
Second, it is possible to assess the economic viability by obtaining the difference between benefit and cost, as shown in Equation (2) or Equation (3) [13,14]. That is, an alternative with smaller net cost is judged to have superior economic viability. This method can be calculated as overnight cost to assess the economic viability, or when the cost is incurred in the future, the discount rate can be applied to assess the economic viability with the net present value of the reference point [15].
The third is a method that uses IRR (internal rate of return), as shown in Equation (4) [16]. In other words, an interest rate with a net present value of zero is calculated to set as the IRR [17], which is the method for evaluating the economic viability with IRR [13].
here, = benefit at t year, = cost at t year.
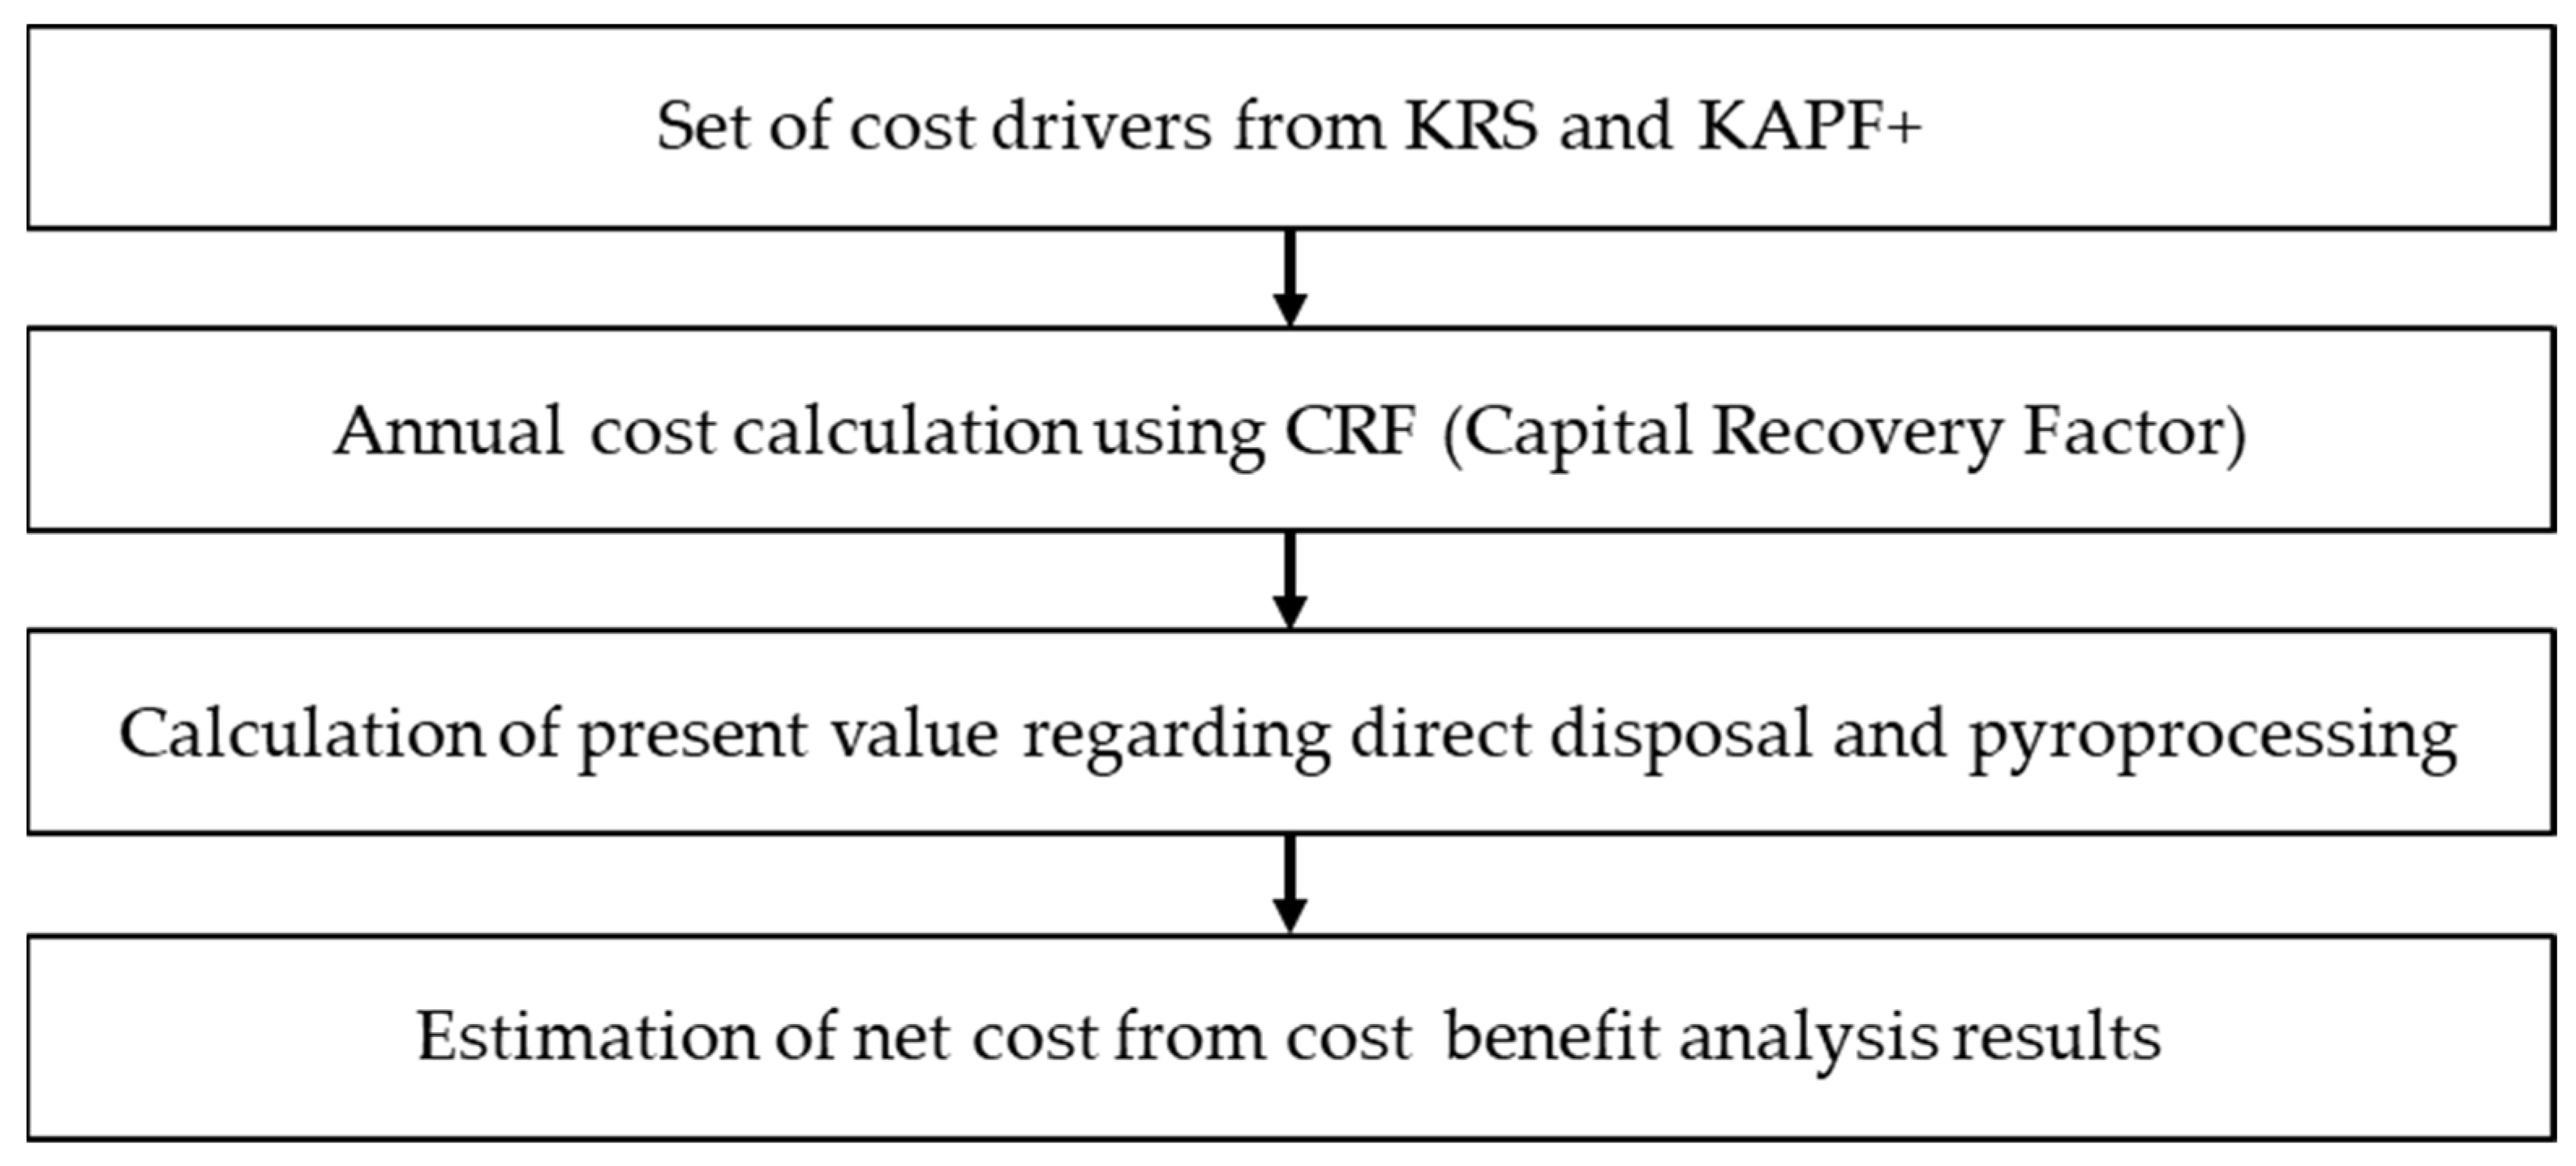
A cost-benefit analysis can be classified into an instance of a single alternative and an instance of multiple alternatives depending on the number of comparison targets. An instance of multiple alternatives should utilize an incremental approach [12]. In this study, a multiple alternatives analysis method was applied to carry out a simple comparative analysis of direct disposal and pyroprocessing. However, an incremental approach was not applied because two options were being compared. In other words, Equation (2) was used to determine that the option with a lower net cost had a relatively higher economic viability. A detailed cost-benefit calculation method is shown in Figure 1.
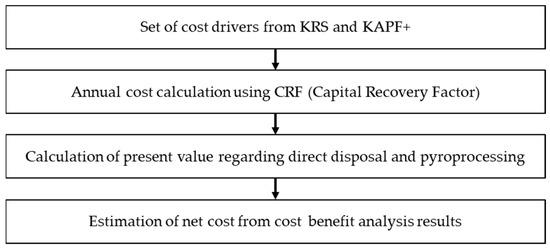
Figure 1.
Procedure of cost and benefit analysis.
When the methods mentioned above are applied, it is possible to compare the cost and benefit quickly when calculated as the overnight cost. However, alternatives in which the cost is incurred in the future are converted to the present value of the base year by applying a discount rate. This is because a time value exists for the currency [13]. Thus, the cost and benefit that result in the future during a long period are converted into the present value. When converted into the present value, the discount rate can be used by selecting the real discount rate and nominal discount rate. The real discount rate is that which excludes the escalation. Compared to this, the nominal discount rate is used when the cost indicated as the nominal price including escalation is analyzed. Moreover, the cost and benefit can be converted into the value of the reference time point for an economic analysis.
2.1. Direct Disposal and Pyroprocessing Facilities
Table 2 shows the specifications of KRS and KAPF+ as the cost objects. KAPF+ was developed by the Korea Atomic Energy Research Institute (KAERI).
Table 2.
The specification of KRS and KAPF+.
The benefits of pyroprocessing compared to direct disposal were grouped into two categories. In other words, the uranium cost reduction amount and the interim storage cost reduction amount were assumed as the benefit’s cost drivers. As for the cost reduction amount of uranium, which can be reused, it was used as a proxy variable of benefit. This occurred for the following reasons. First, the recovered uranium can be reused later on as the SFR’s nuclear fuel. Thus, there is no need to dispose of it. Accordingly, it is possible to reduce the uranium cost up to the amount of the recovered uranium [18]. Even when recovered uranium is not used as the SFR’s raw material, it is possible to reduce the disposal cost [19,20]. This is because significant cost is incurred in the case of spent fuel by carrying out deep geological disposal. Thus, the cost decreases significantly [21,22]. Second, the strength of the pyroprocess is that spent fuel can be reprocessed at a high temperature of at least 500 °C. Thus, interim storage is not a must. Accordingly, the pyroprocess can save interim storage costs. Thus, the amount saved from the interim storage costs can be a benefit of the pyroprocess.
2.2. Input Data
To calculate the benefit of a pyroprocess alternative, the price of recovered uranium was assumed to be USD 25/kgU. In fact, the price of uranium in 2017 was approximately USD 100/kgU. However, the price of uranium continues to decline. In addition, there are impure substances in the recovered uranium compared to natural uranium. Thus, the evaluated value was assumed to be approximately half the market price [23]. The base year for the cost calculation was 2020. Because recovered uranium will be used in the future, a discount rate of 2.3% was applied to convert to the present value using 2020 as the standard.
Nuclear fuel cycle economists use historical escalations as input parameters for economic analysis. The future economic phenomena are highly uncertain. If assuming the estimated escalation as a parameter, the uncertainty of economic analysis results increases. Although there are differences among economic analysts, the average value of the past 1, 2, 3, 4, or 5 years is assumed as the input parameter of escalation. Currently, the global economy is not in a normal stable state due to the COVID-19 pandemic. It is judged that it is reasonable to use the long-term escalation as an input parameter rather than the short-term escalation of the past.
Among the benefits of the pyroprocessing are that when TRU is used as SFR nuclear fuel, it is possible to reduce the raw material cost of SFR nuclear fuel. However, the TRU market price is not presently set. Thus, this study did not factor in the benefit for the raw materials for the SFR nuclear fuel cost following the reuse of recovered TRU. Table 3 shows the input data for the cost calculation.
Table 3.
Input data.
3. Quantitative Cost-Benefit Analysis
3.1. Direct Disposal Facility Cost
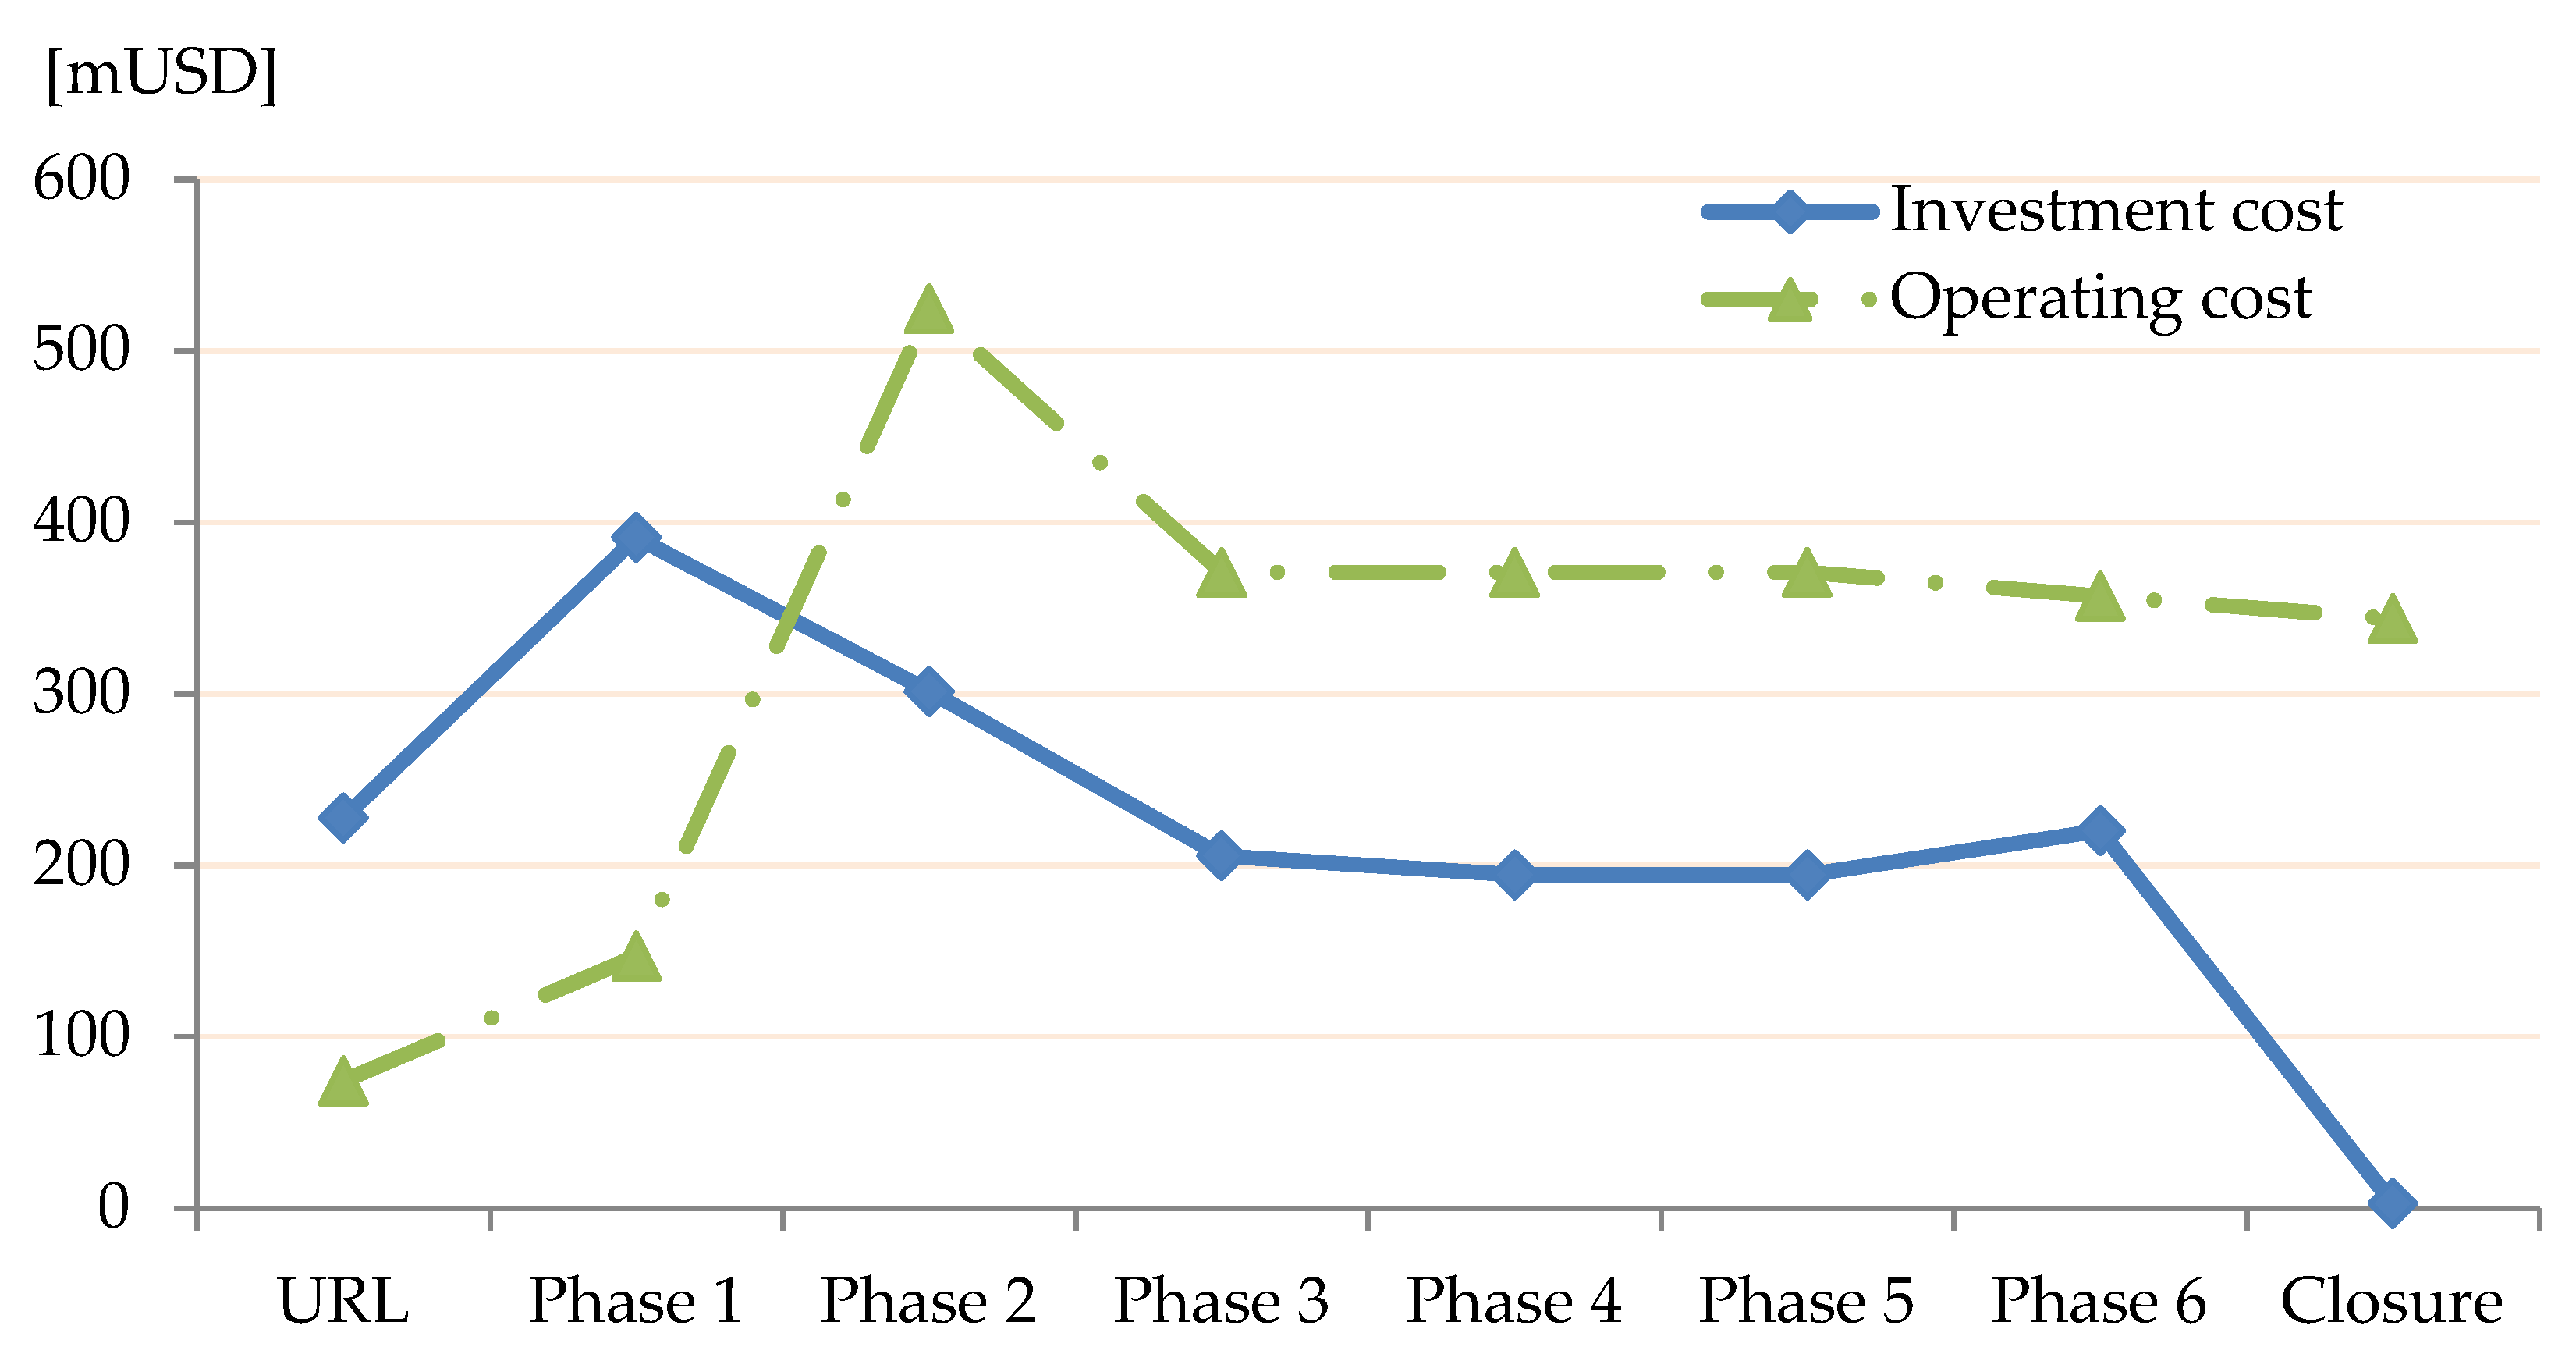
The direct disposal facility cost is mainly divided into underground and ground costs. As for the underground cost, the value that was calculated as the overnight cost according to the concept of KRS, which KAERI and Finland’s Posiva researched jointly in 2002, was applied. Underground cost’s capital investment and operation costs take up 40% and 60% in Table 4, respectively, and the cost trend is as shown in Figure 2 [26].
Table 4.
The direct disposal underground overnight cost for KRS as a function of the construction phase.
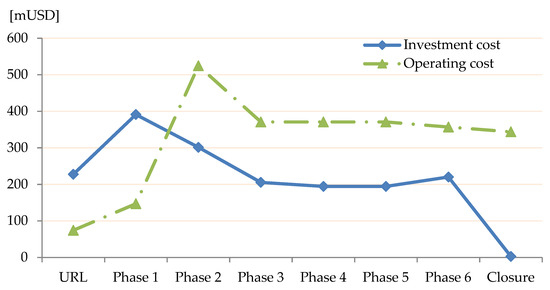
Figure 2.
The trend of cash flows for direct disposal underground overnight cost.
According to joint research administered by KAERI and Finland’s Posiva, the spent fuel repository cost for direct disposal was calculated as shown in Table 4 [26]. This cost was calculated based on the conceptual design that entails disposing of a total of 36,000 tons (PWR spent fuel: 20,000 tons, CANDU spent fuel: 16,000 tons) of spent fuel at 500 m underground [27]. The underground repository was designed conceptually as a single tier instead of multiple tiers, and comprised a shaft, disposal tunnel, and disposal hole. The base year for the cost calculation was the end of 2002. Accordingly, an escalation of 2.3% was applied to convert to the 2020 reference time point. In the end, the overnight cost required for the total repository cost was calculated as approximately USD 12,900 m (1 USD = 1000 KRW, 1 EUR = 1400 KRW) [26].
Moreover, escalation was factored into the spent fuel repository cost, which is the result of a joint study between Korea and Finland administered to evaluate the relative economic viability, and was recalculated as a time point at the end of 2020. Underground cost was classified as the underground disposal facility’s capital investment, operation and maintenance, and closure costs, as shown in Equation (5).
where = underground cost of direct disposal, = capital investment cost at time t1, = cost of operation and maintenance at time t2, and = closure cost at time t3.
The ground cost was also factored into the ground facility’s capital investment, operation, and closure costs, such as underground costs. However, greater ground cost is incurred than underground cost because canister cost is included in the ground cost. To prevent corrosion, copper, which is very costly, is used for the outer canister for the spent fuel’s canister [28]. Accordingly, the canister cost becomes the highest cost driver for the direct disposal cost [29,30]. This study factored in the canister cost according to the judgment of experts at Posiva of Finland to set the overall ground cost to two times the underground cost, as shown in Equation (6) [26].
where = ground cost of direct disposal, = underground cost of direct disposal.
3.2. Pyroprocessing Facility Cost
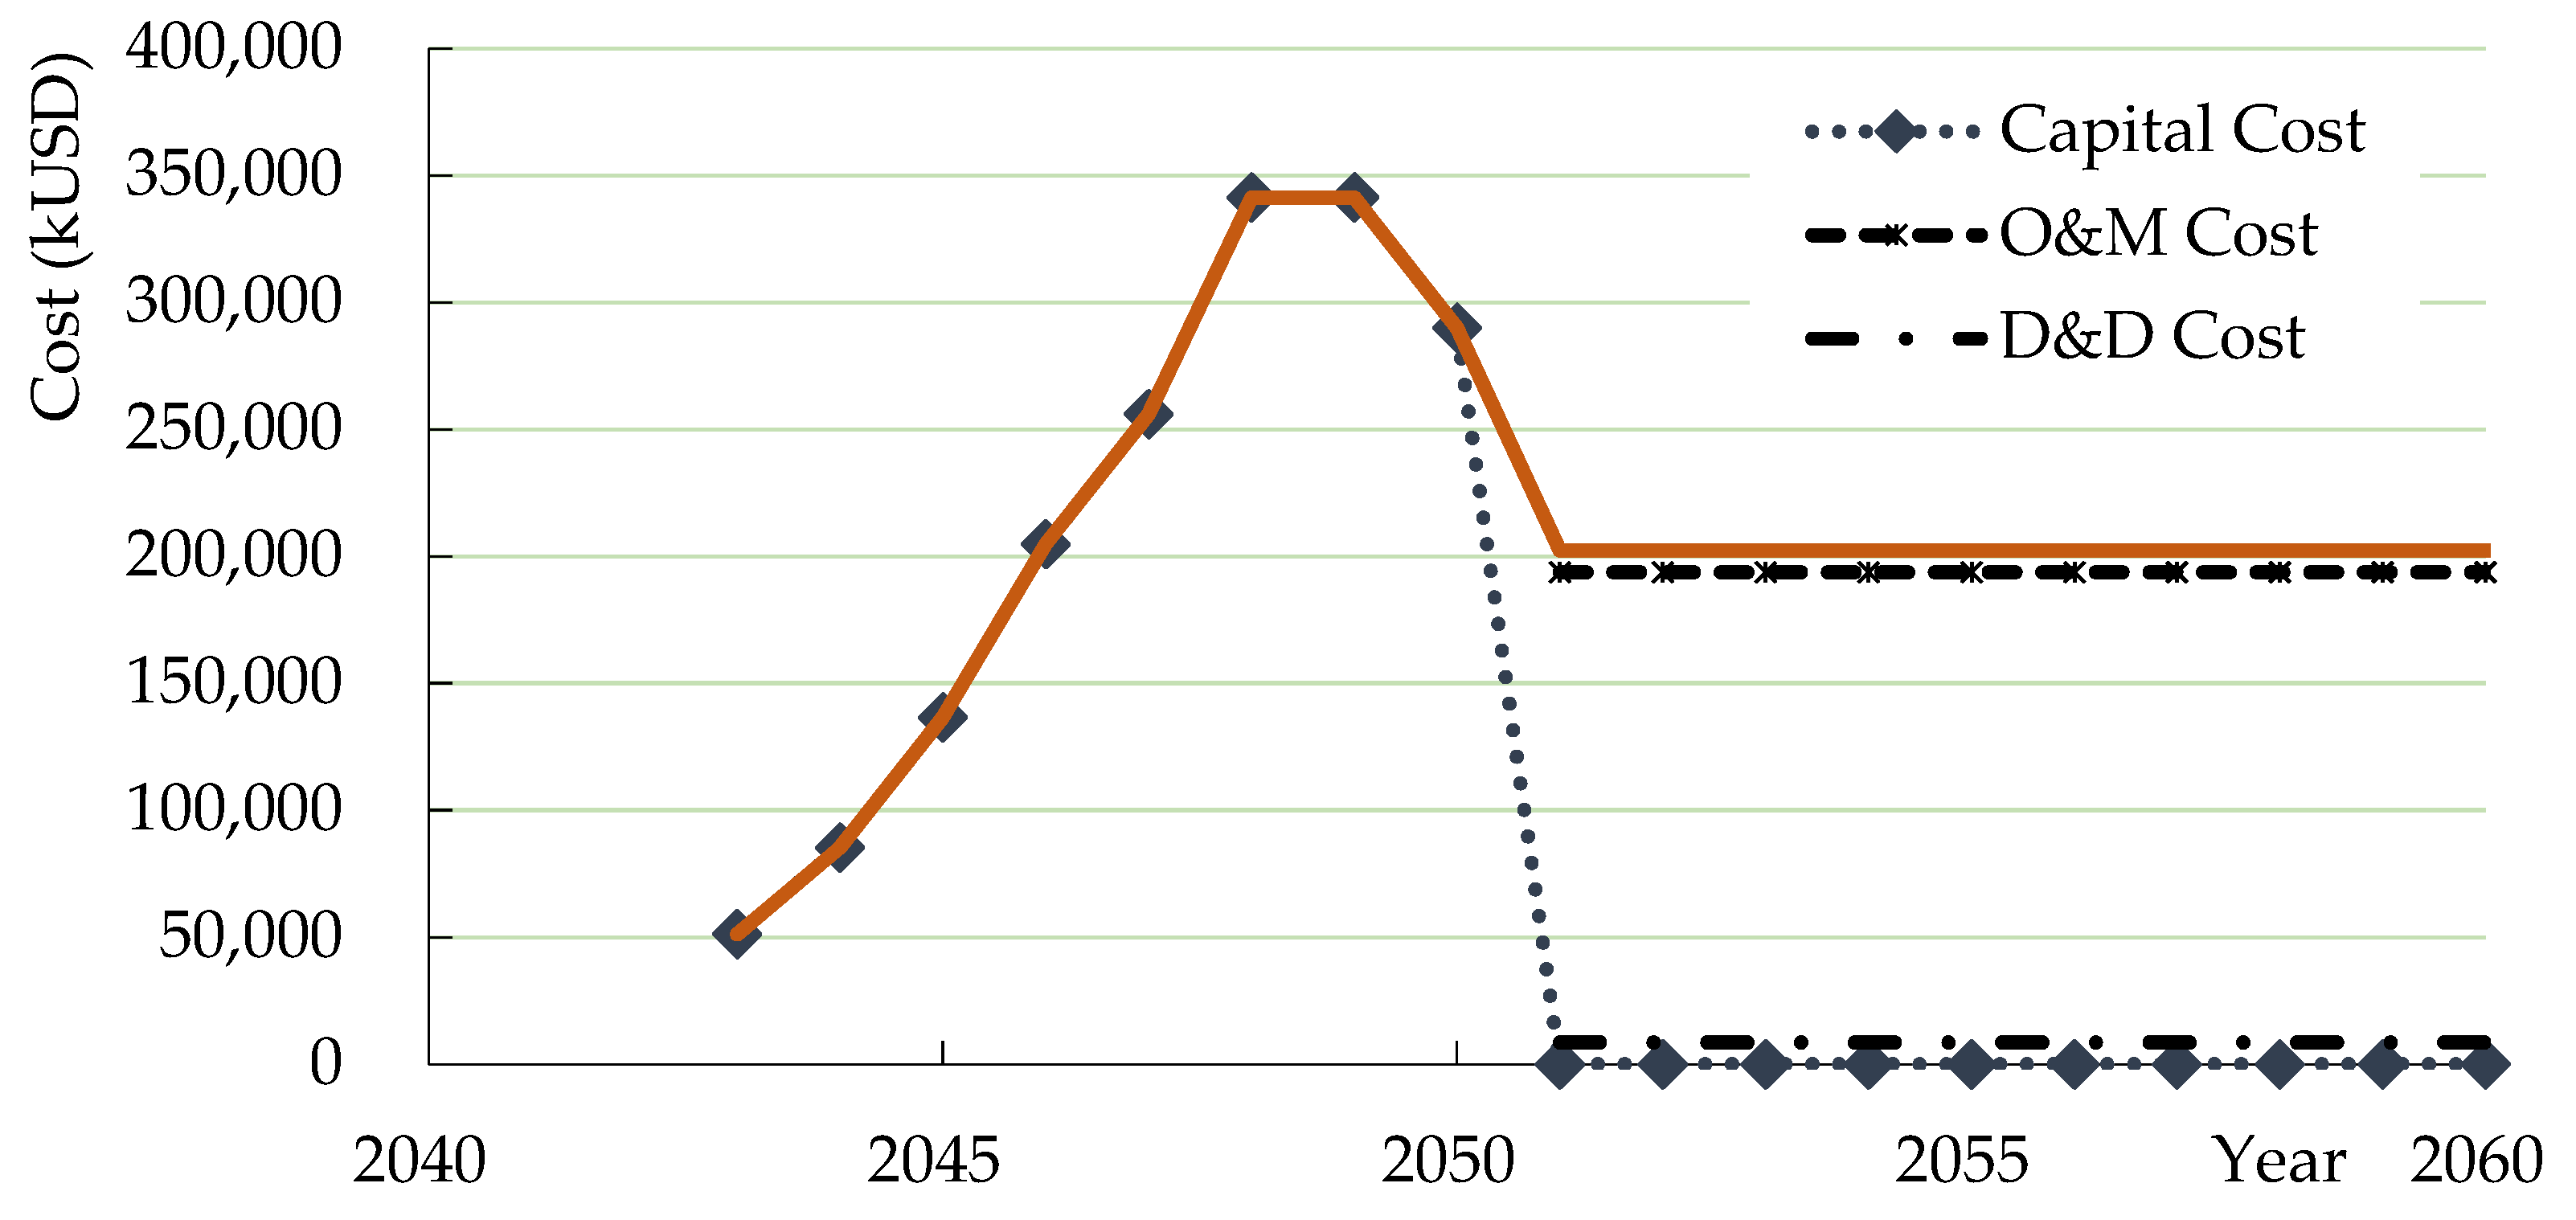
The pyroprocess cost was calculated based on the KAPF+ conceptual design. In other words, the pyroprocess cost was classified into capital investment, operation and maintenance, and decommissioning and disposal costs [31]. A flow diagram of the pyroprocess cost (KAPF+) is shown in Figure 3 [27].
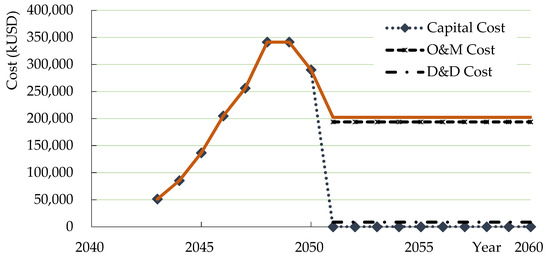
Figure 3.
The trend of pyroprocessing overnight cost (KAPF+) as a function of time (years).
Table 5 shows the pyroprocessing facility cost calculated based on the KAPF+ conceptual design [27]. Because the time of the calculation was the end of 2009, an escalation of 2.3% was applied to convert to the cost for 2020 year.
Table 5.
Cost of KAPF+.
As shown in Table 5, the KAPF+ overnight cost was calculated as USD 13,848,273k [27]. Among the overnight costs, the capital investment cost was calculated as 12.3%. It was shown that the operation and maintenance costs take up the highest share at 84% [27]. An escalation of 2.3% was factored in to compare with the cost of direct disposal, and was converted using the end of 2020 as the standard.
Moreover, the refabrication cost was added to reuse uranium and TRU, as shown in Equation (7) [32]. This is because it is necessary to refabricate as a metal fuel to reuse the recovered uranium and TRU for an SFR [33].
where = pyroprocess cost, = capital investment cost of pyroprocess at time t1, = operation and maintenance cost of pyroprocess at time t2, = decommissioning and disposal cost of pyroprocess at time t3, and = cost of refabrication at time t4.
KAPF+, a pyroprocessing facility, has processed 400 tons of spent fuel per year during its 60-year history, which is the facility’s lifetime. Accordingly, pretreatment, electrochemical reduction, electrorefining, and electrowinning pyroprocesses are needed [34,35]. Relatively significant capital investment and operation costs are required. The pyroprocessing facility’s capital investment cost was assumed to be injected during eight years prior to the facility operation. Capital investment increased incrementally, and the highest amount was injected using the same amounts as during the sixth and seventh years. The operation and maintenance costs were assumed to accrue consistently during the 60-year period. Moreover, decommissioning and disposal costs were also distributed at a consistent amount during the 60 years. This is because the pyroprocessing facility’s design lifetime is 60 years, and because it is advised to reserve a specific amount as the decommissioning and disposal costs during the operation period.
3.3. The Benefit Factors of Direct Disposal and Pyroprocessing
As for the cost-benefit analysis used to carry out a comparative analysis of the economic viability of direct disposal and the pyroprocess, the cost and benefit were calculated quantitatively. The difference between the cost and benefit was then obtained to evaluate the economic viability with a net cost [36]. Among the two alternatives, the alternative with the lower net cost becomes the alternative that is more comparatively favorable. Table 6 shows the quantitative cost driver and cost object, spent fuel repository, and pyroprocess facility’s specifications used to calculate the cost and benefit.
Table 6.
Quantitative benefit factors and the cost drivers.
When the exchange rate was assumed to be 1 USD = 1000 KRW and 1 EUR = 1400 KRW, then the amount of uranium fuel cost savings in pyroprocessing was calculated to be USD 153,094,335.
As shown in Equation (8), the amount of interim storage cost reduction in pyroprocessing was calculated by multiplying USD 68/kgHM, which is the wet storage unit cost, by the spent fuel amount [13]. In the end, 20,000 tons of light-water reactor spent fuel was assumed as the inventory, and the amount the interim storage cost was reduced was calculated to be USD 553,647,730.
where = storage cost savings from pyroprocess option, = amount of spent fuel, and = unit cost of wet storage.
4. Cost-Benefit Analysis Results
The benefits of alternatives to pyroprocessing are summarized in Table 7. Because a direct disposal option does not reuse spent fuel, there is no direct benefit to the back-end fuel cycle. The amount of uranium cost reduction in the pyroprocess alternatives was set by multiplying the uranium unit cost by the amount of uranium recovered every year during the pyroprocess facility’s lifetime period of 60 years [13]. Moreover, the amount of cost reduction of interim storage was the amount when applying a discount rate of 2.3% to the value calculated by multiplying the wet storage unit cost of USD 68/kgHM by PWR spent fuel amount of 20,000 tons during a cooling time of 40 years [25]. As shown in Table 7, the total benefit of the pyroprocess alternative was calculated as USD 706,742,065, and it was shown that the storage cost reduction amount was greater than the amount of uranium saved. This may be because the interim storage unit cost was higher than the recovered uranium’s unit cost.
Table 7.
Benefits of direct disposal and pyroprocessing.
Table 8 shows the construction investment cost of a spent fuel repository (KRS) and pyroprocessing facility (KAPF+) [25,26]. When the facility capacity is examined, KRS is shown to be a facility that disposes of 20,000 tons of PWR nuclear fuel and 16,000 tons of CANDU nuclear fuel for a total of 36,000 tons. Moreover, KAPF+ is a facility that produces uranium and TRU during a 60-year-long design lifetime, handling 400 tons per year. It is a facility that has handled a total of 24,000 tons. In the end, it was proven that a greater cost was incurred for KRS’s construction than the KAPF+ construction cost, as shown in Table 8.
Table 8.
Investment costs for KRS and KAPF+.
The capital investment cost that is incurred for the pyroprocessing facility every year was calculated using Equation (9) for an economic viability analysis [13].
where = yearly repayment, = capital recovery factor = 0.0309, = total capital cost, = interest rate = 2.3%, and = useful life of pyroprocess facility.
Table 9 shows the conversion into the base cost amount of 2020 by factoring in an escalation of 2.3%.
Table 9.
Cost of surface building plant.
Table 10 shows the results of calculating the operation and maintenance costs, decommissioning and disposal costs, and refabrication costs. The annual cost was calculated using Equation (9). For the SFR fuel manufacturing unit cost, a value of USD 5511/kgHM, calculated by Hyundai Engineering Company based on the SFCF (SFR Fuel Cycle Facility)’s conceptual design, was used. The annual amount of SFR nuclear fuel manufacturing was calculated as 38.62 tHM/year [24].
Table 10.
Costs of two options (direct disposal vs. pyroprocessing).
Table 11 shows the results of calculating the net cost of direct disposal and the pyroprocess. Calculation of the quantitative net cost shows that the net cost of the pyroprocess alternative is greater than that of direct disposal. In other words, it was calculated that the direct disposal alternative is economically favorable compared to the pyroprocess. However, because the difference in cost compared to the total cost is not very high, the result of calculating the net cost can be reversed according to the input unit cost with high uncertainty. In this case, it is estimated that judging the two alternatives’ economic viability will not be easy.
Table 11.
Quantitative net cost analysis results.
In addition, a DNC comparison for 1 year between direct disposal and pyroprocess was calculated using Equation (10) [37]. DNC means the cost of doing nothing.
where DNC = do nothing cost, NPV = net present value, t = time (year).
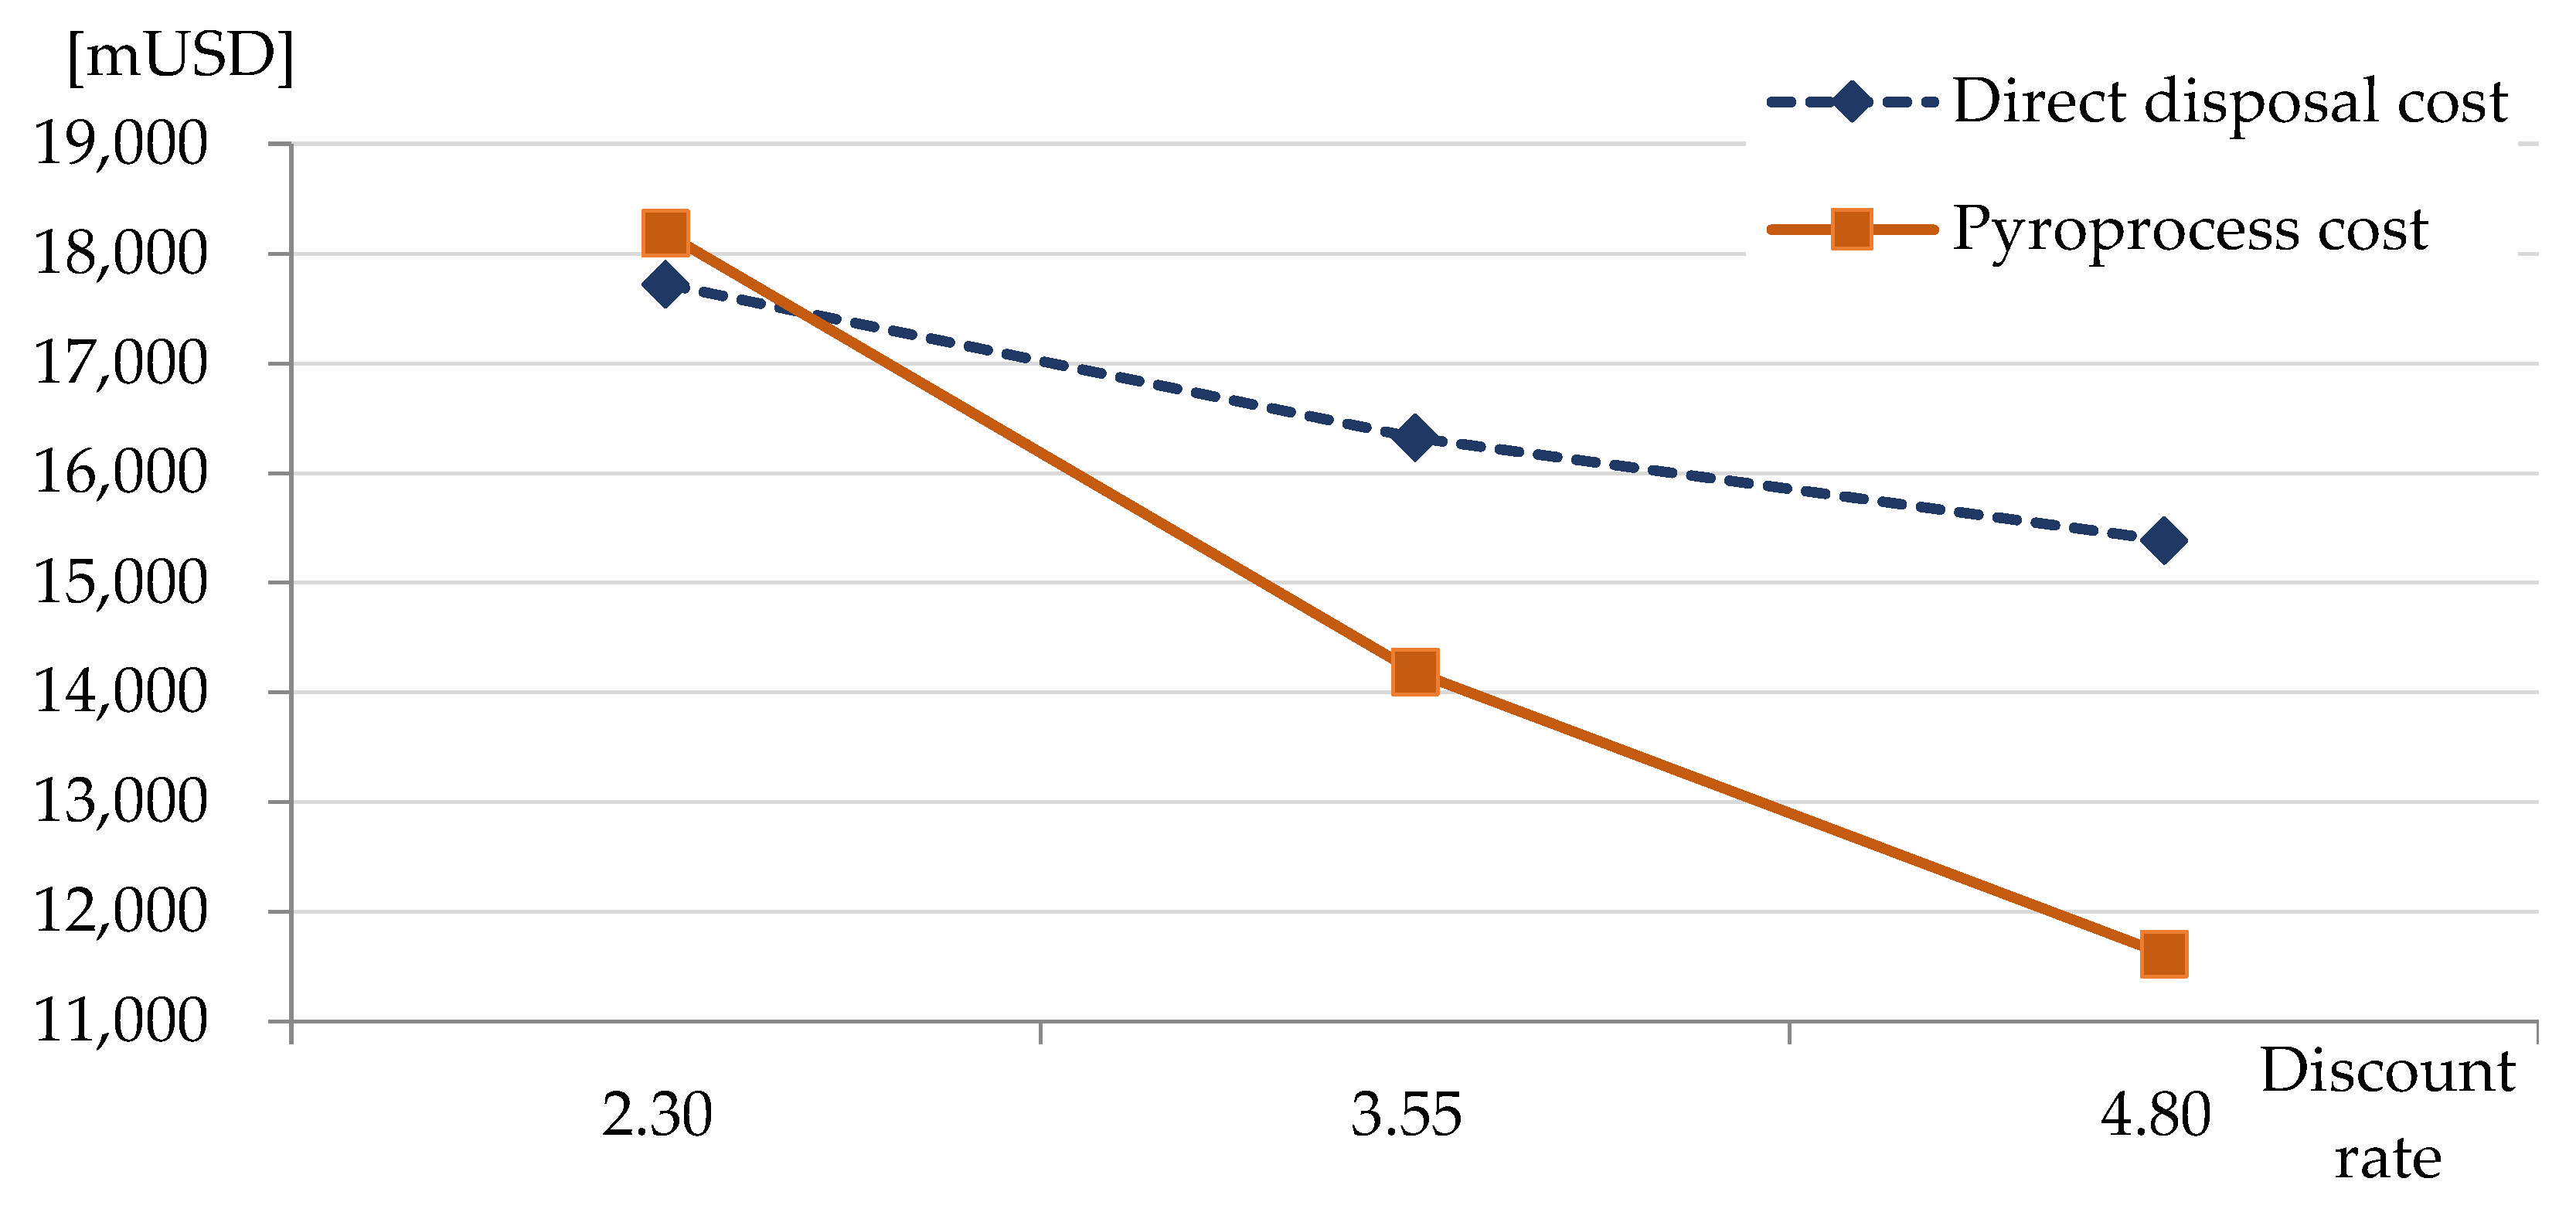
Finally, a sensitivity analysis was administered for the discount rate, as shown in Figure 4. The results of the analysis show that the pyroprocess cost has greater sensitivity toward the discount rate compared to the direct disposal cost. This may be because the share of the incurred pyroprocess cost in the latter half may be greater compared to the direct disposal cost.
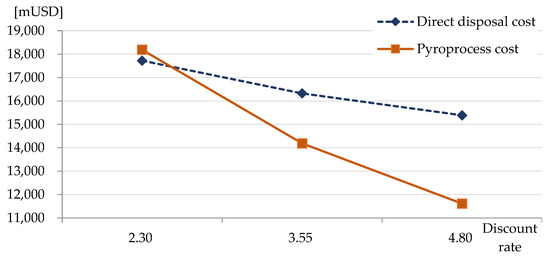
Figure 4.
Sensitivity to discount rate of both direct disposal cost and pyroprocess cost.
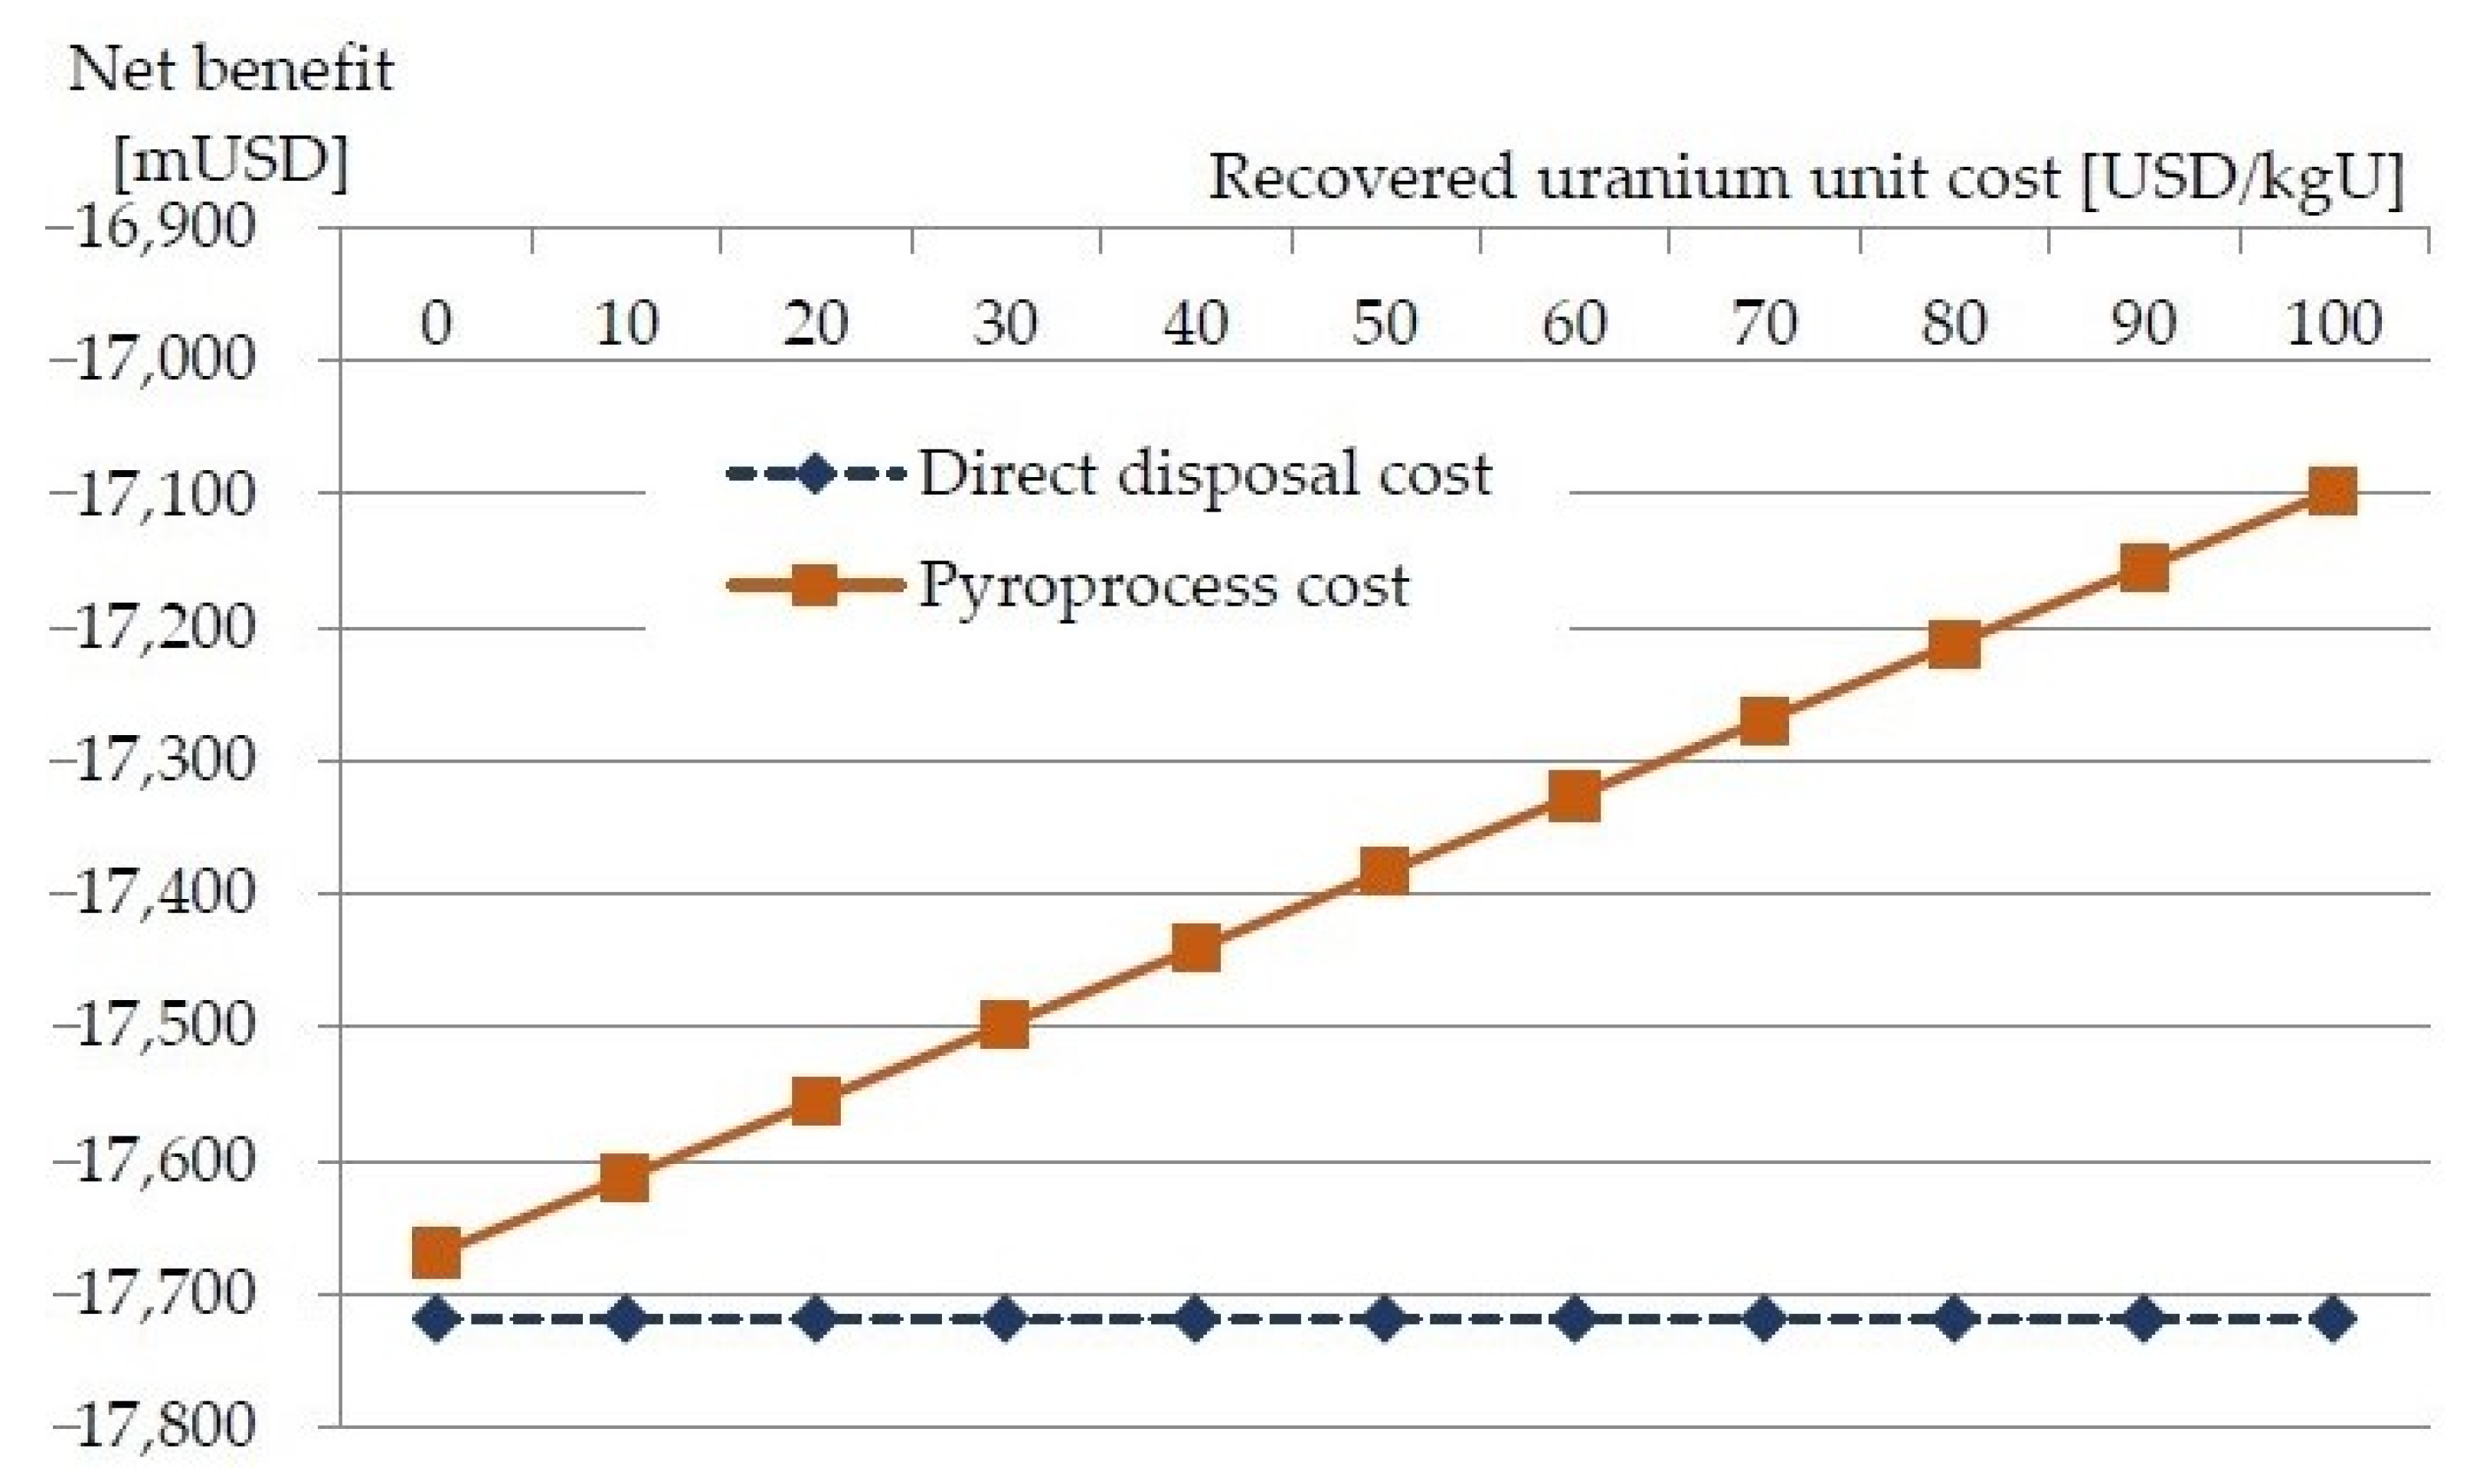
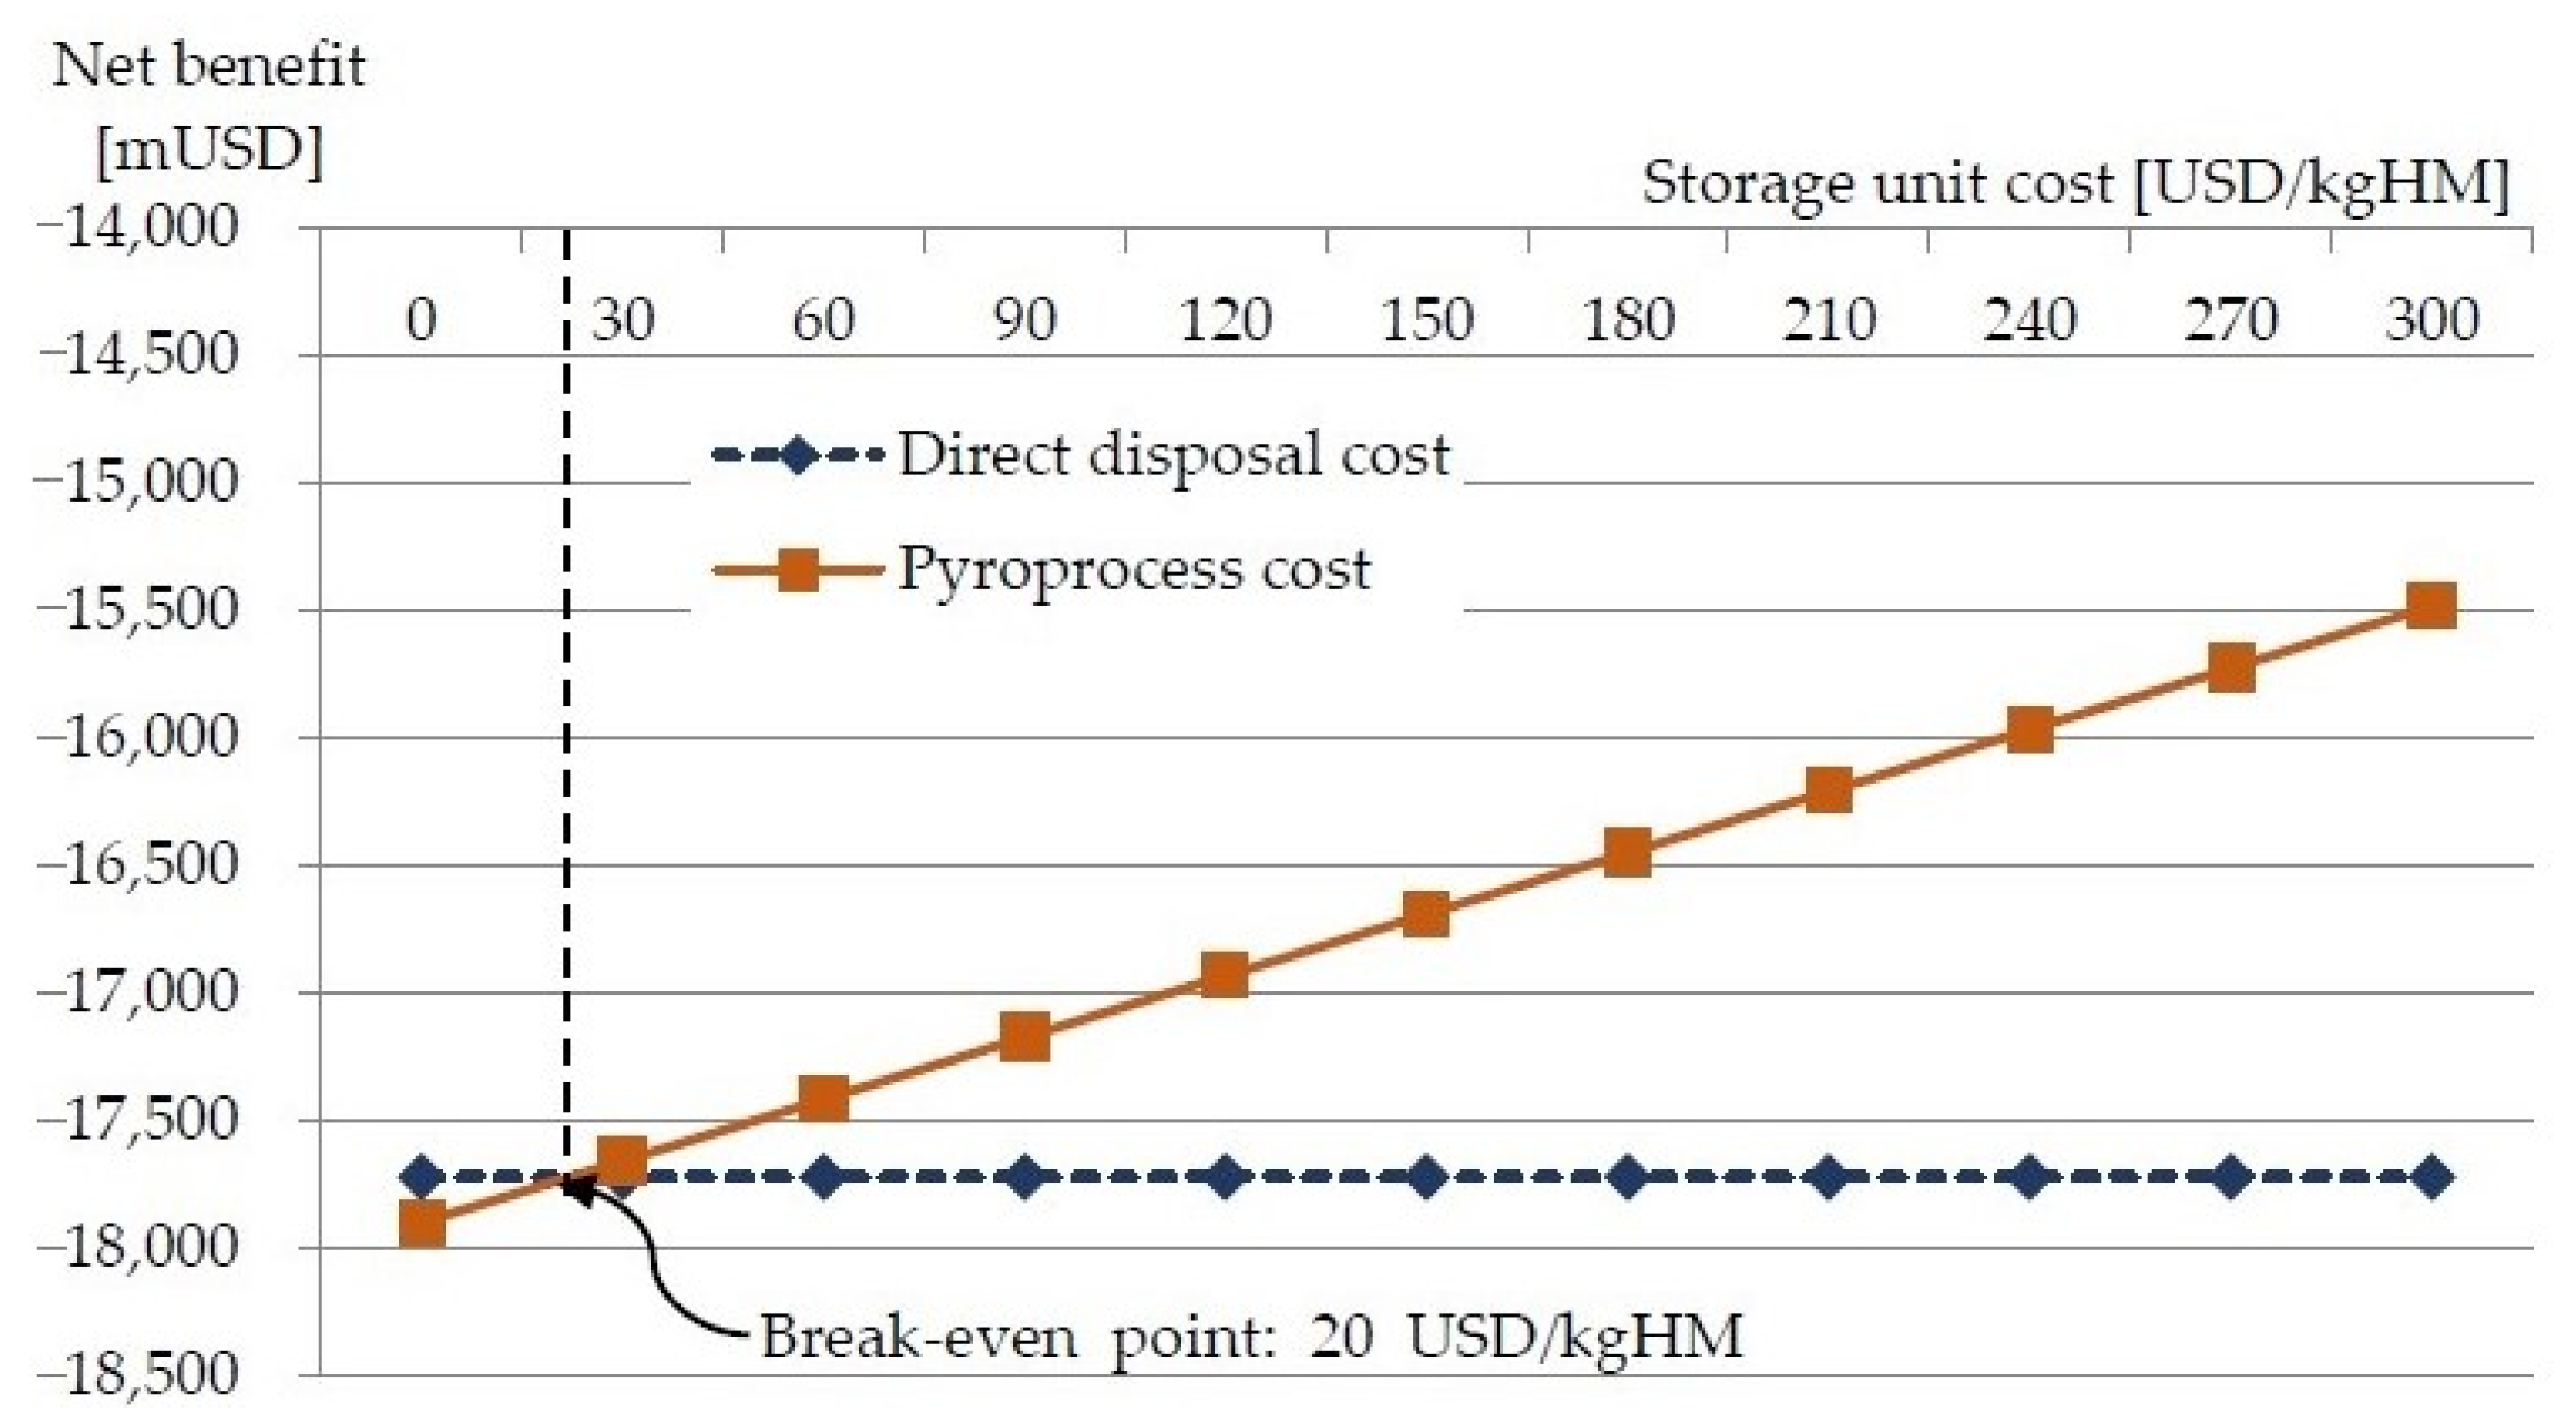
Figure 5 and Figure 6 show the sensitivity analysis results for the recovered uranium unit cost and storage unit cost, respectively. As shown in Figure 6, the break-even point of spent fuel storage unit cost between the direct disposal and the pyroprocess was calculated as approximately USD 20/kgHM.
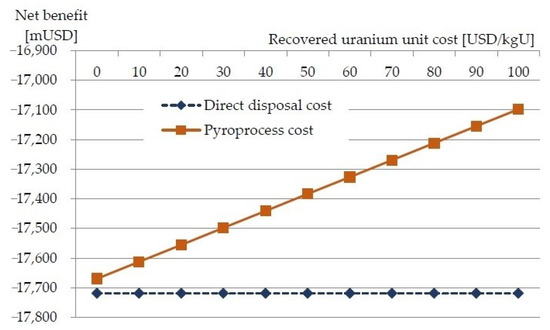
Figure 5.
Sensitivity to the recovered uranium unit cost.
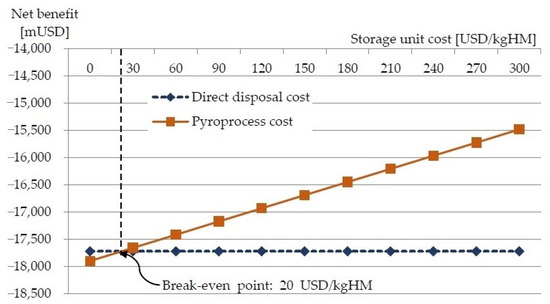
Figure 6.
Break-even point of storage unit cost between direct disposal and pyroprocessing.
5. Conclusions
Pyroprocessing is a technology for recovering uranium and TRU from spent fuel using an electrochemical method. Recovered uranium and TRU are used as the raw materials for SFR nuclear fuel. In countries such as Korea, which has no desert and is characterized by a high population density, it is challenging to secure land for a spent fuel repository owing to the NIMBY (not in my backyard) phenomenon. Thus, it is advised to actively reuse spent fuel. However, it is necessary to secure economic viability of the pyroprocess compared to the direct disposal method before commercializing a pyroprocessing facility.
This study utilized a cost-benefit analysis method to compare the economic viability of direct disposal and pyroprocessing. The analysis results demonstrated that the discounted benefit from the pyroprocessing alternative was USD 706,742,065 (3.5% based on the pyroprocessing cost), whereas direct disposal does not offer direct benefit. This is because there is no benefit to the back-end fuel cycle stage since direct disposal disposes of all spent fuel.
The discounted costs for direct disposal and pyroprocessing were calculated as USD 17,719,319,040 (88% based on the pyroprocessing cost) and USD 20,035,994,820, respectively. Accordingly, it was demonstrated that greater cost is incurred for pyroprocessing compared to direct disposal. In addition, the net cost was calculated as USD 17,719,319,040 (91% based on the pyroprocessing cost) for direct disposal and as USD 19,329,252,755 for pyroprocessing. In the end, the net cost of pyroprocessing was higher than that of direct disposal. However, the difference in the net cost of the two alternatives was not high compared to the total cost. Accordingly, the economic viability of the two alternatives can be reversed going forward because the uncertainty for the unit costs to be input into the cost calculation is high. However, as of today, it is possible to make the claim that the economic viability of direct disposal is superior compared to that of pyroprocessing.
Pyroprocessing is more expensive than direct disposal, so direct disposal is advantageous in terms of economical nuclear power sustainability. Therefore, automation of the entire pyroprocess is essential to overcome these shortcomings in the pyro-SFR nuclear fuel cycle.
In addition, this study may be limited because it does not factor in the economic effects of facility capacity since the KRS spent fuel repository and KAPF+’s cost object, which were factored into the cost calculation, do not have the same facility capacity. Namely, the capacity of KRS is 36,000 tons while the capacity of KAPF+ is 23,800 tons.
Going forward, when the spent fuel repository and KAPF+’s facility are commercialized, it will become possible to calculate a unit cost that factors into the scale effect more accurately. Thus, this problem will be resolved.
In addition, the final purpose of an analysis on nuclear fuel cycle options is to select the optimum nuclear fuel cycle suitable for the environment of one’s own country, and to maintain nuclear power sustainability by reflecting it in nuclear power policy. Accordingly, since the nuclear fuel cycle should be evaluated according to various aspects such as politics, the economy, and society, diverse evaluation criteria are necessary. Namely, the various evaluation criteria such as safety (technological features), economic feasibility, environmental features, and nuclear non-proliferation can be used as evaluation criteria.
The results of this study are not intended to suggest an optimal nuclear cycle alternative. Its aim is to suggest a better back-end nuclear fuel cycle alternative within a limited economic scope. This is because the nature of the back-end nuclear fuel cycle must take into account various aspects such as political, economic, safety, and environmental characteristics. After evaluating all these factors, the optimum nuclear fuel cycle alternative can be suggested. Currently, the political phenomenon of back-end nuclear fuel cycle alternatives is complicated in Korea due to the phasing out of nuclear power. In addition, this political situation is expected to affect the construction of nuclear power plants, which will greatly affect the nuclear economy in the future. Additionally, the public’s interest in the safety of nuclear facilities increased significantly due to the Fukushima nuclear accident in Japan, a neighboring country. Korea has no desert and has a relatively high population density compared to other countries. The Korean government is making great efforts to solve the environmental problem of spent nuclear fuel. When seeking an optimal back-end nuclear fuel cycle alternative, it is very difficult to take into account all factors, including public acceptance and political issues. Because this is very complex and difficult research, we leave it as a future research topic. In this study, comparative analysis results of the back-end nuclear fuel cycle alternatives were presented by limiting economic feasibility.
In the future, we will conduct a cost-benefit analysis considering such various evaluation criteria. Furthermore, external costs such as public acceptance costs for local community support will be assessed in the near future.
Author Contributions
The main theme of this paper was developed by S.K. and was coordinated by S.B. S.K. wrote the manuscript, and S.B. processed the submission of this paper. S.B. and J.K. prepared most of the equations, tables, and figures. D.C. commented on the results and conclusions. All authors have read and agreed to the published version of the manuscript.
Funding
This work was supported by the Institute for Korea Spent Nuclear Fuel (iKSNF) and National Research Foundation of Korea (NRF) grant funded by the Korea government (Ministry of Science and ICT, MSIT) (2021M2E1A1085193).
Institutional Review Board Statement
Not applicable.
Informed Consent Statement
Not applicable.
Data Availability Statement
Not applicable.
Acknowledgments
The authors highly appreciate the anonymous reviewers of this article for their helpful comments and suggestions, and the editors for their hard work.
Conflicts of Interest
The authors declare no conflict of interest.
References
- Chang, Y.I.; Benedict, R.W.; Bucknor, M.D.; Figueroa, J.; Herceg, J.E.; Johnson, T.R.; Wolf, M. Conceptual design of a pilot-scale pyroprocessing facility. Nucl. Technol. 2019, 205, 708–726. [Google Scholar] [CrossRef]
- Simpson, M.F. Developments of Spent Nuclear Fuel Pyroprocessing Technology at INL; INL/EXT-12-25124; Idaho National Laboratory (INL): Idaho Falls, ID, USA, 2012.
- Kim, S.; Ko, W.; Bang, S. Analysis of unit process cost for an engineering-scale pyroprocess facility using a process costing method in Korea. Energies 2015, 8, 8775–8797. [Google Scholar] [CrossRef] [Green Version]
- Kim, S.; Jang, H.; Gao, R.; Kim, C.; Chung, Y.; Bang, S. Break-even point analysis of sodium-cooled fast reactor capital investment cost comparing the direct disposal option and pyro-sodium-cooled fast reactor nuclear fuel cycle option in Korea. Sustainability 2017, 9, 1518. [Google Scholar] [CrossRef] [Green Version]
- Lee, J.; Lee, J.I.; Chang, W.J.; Chang, S.H. Comparative cost analysis of direct disposal versus pyro-processing with DUPIC in Korea. Ann. Nucl. Energy 2010, 37, 1699–1704. [Google Scholar] [CrossRef]
- Lee, J.; Chang, Y.I.; Chang, S.H. Cost benefit analysis of advanced nuclear fuel cycle using Linear Programming optimization. Ann. Nucl. Energy 2012, 46, 116–120. [Google Scholar] [CrossRef]
- Sidhu, A.S.; Pollitt, M.G.; Anaya, K.L. A social cost benefit analysis of grid-scale electrical energy storage projects: A case study. Appl. Energy 2018, 212, 881–894. [Google Scholar] [CrossRef]
- Preciado-Pérez, O.A.; Fotios, S. Comprehensive cost-benefit analysis of energy efficiency in social housing. Case study: Northwest Mexico. Energy Build. 2017, 152, 279–289. [Google Scholar] [CrossRef]
- Zhang, B.; Chen, B. Emergy-based cost-benefit analysis for urban biogas project. Energy Procedia 2016, 88, 119–125. [Google Scholar] [CrossRef] [Green Version]
- Lee, D.H. Cost-benefit analysis, LCOE and evaluation of financial feasibility of full commercialization of biohydrogen. Int. J. Hydrogen Energy 2016, 41, 4347–4357. [Google Scholar] [CrossRef]
- Volchko, Y.; Norrman, J.; Rosén, L.; Fedje, K.K. Cost-benefit analysis of copper recovery in remediation projects: A case study from Sweden. Sci. Total Environ. 2017, 605, 300–314. [Google Scholar] [CrossRef] [PubMed]
- Park, Y.T. An Introduction to Engineering Economics; Cheongmoongak Press: Paju, Korea, 2008; pp. 174–181. [Google Scholar]
- Ham, H.J. Engineering Economics; Donghyeun Press: Euijeongbu, Korea, 2004; pp. 76–103. [Google Scholar]
- Liu, C.; Zhang, Q.; Wang, H. Cost-benefit analysis of waste photovoltaic module recycling in China. Waste Manag. 2020, 118, 491–500. [Google Scholar] [CrossRef] [PubMed]
- O’Mahony, T. Cost-Benefit Analysis and the environment: The time horizon is of the essence. Environ. Impact Assess. Rev. 2021, 89, 106587. [Google Scholar] [CrossRef]
- Liu, Y.; Liu, T.; Ye, S.; Liu, Y. Cost-benefit analysis for Energy Efficiency Retrofit of existing buildings: A case study in China. J. Clean. Prod. 2018, 177, 493–506. [Google Scholar] [CrossRef]
- Hsu, E. Cost-benefit analysis for recycling of agricultural wastes in Taiwan. Waste Manag. 2021, 120, 424–432. [Google Scholar] [CrossRef] [PubMed]
- Laidler, J.J.; Battles, J.E.; Miller, W.E.; Ackerman, J.P.; Carls, E.L. Development of pyroprocessing technology. Prog. Nucl. Energy 1997, 31, 131–140. [Google Scholar] [CrossRef]
- Vienna, J.D. Waste Forms for an Advanced Fuel Cycle; Pacific Northwest National Laboratory: Richland, WA, USA, 2009. [Google Scholar]
- Jones, R.H. Low Level Waste Disposition–Quantity and Inventory; FCRD-USED-2010-000033 Revision 2; U.S. Department of Energy: Washington, DC, USA, 2011.
- Piet, S.J.; Soelberg, N.R.; Pincock, L.F.; Shaber, E.L.; Teske, G.M. The FIT 2.0 Model-Fuel-Cycle Integration and Tradeoffs; INL/EXT-10-20190; Idaho National Laboratory (INL): Idaho Falls, ID, USA, 2010.
- Sealy, L.; Baumgartner, P. Preliminary Level Cost Estimate for Surface Works of Spent Fuel Disposal Facility; AECL KOS-047610 Rev. 1; Atomic Energy of Canada Limited (AECL): Ontario, ON, Canada, 2006; pp. 10–23. [Google Scholar]
- Shropshire, D.E.; Williams, K.A.; Boore, W.B.; Smith, J.D.; Dixon, B.W.; Dunzik-Gougar, M.; Adams, R.D.; Gombert, D.; Schneider, E. Advanced Fuel Cycle Cost Basis-2017 Edition; INL/EXT-17-43826; Idaho National Laboratory (INL): Idaho Falls, ID, USA, 2017; pp. 19–23.
- KAERI. Preliminary Conceptual Design and Cost Estimation for SFR Fuel Cycle Facility; KAERI/CM-1383/2010; Korea Atomic Energy Research Institute: Daejeon, Korea, 2010; p. 137. [Google Scholar]
- KAERI. Preliminary Conceptual Design and Cost Estimation for Korea Advanced Pyroprocess Facility Plus (KAPF+); KAERI/CM-1382; Korea Atomic Energy Research Institute: Daejeon, Korea, 2010; pp. 111–115. [Google Scholar]
- Kukkola, T.; Saanio, T.; Choi, J.; Kang, C. KAERI’s Spent Fuel Repository Design Evaluation and Cost Estimation; R&D Report 2003-02; Korea Atomic Energy Research Institute: Daejeon, Korea, 2003; pp. 63–75. [Google Scholar]
- KAERI. Geological Disposal System Development; KAERI/RR-2336/2002; Korea Atomic Energy Research Institute: Daejeon, Korea, 2002; pp. 660–663. [Google Scholar]
- Andersson, C.G.; Eriksson, P.; Westman, M.; Emilsson, G. Status Report, Canister Fabrication; No. SKB-TR-04-23; Swedish Nuclear Fuel and Waste Management Co.: Solna, Sweden, 2004; pp. 29–41. [Google Scholar]
- KAERI. Development of a Korean Reference Disposal System(A-KRS) for the HLW from Advanced Fuel Cycles; KAERI/RR-3100/2009; Korea Atomic Energy Research Institute: Daejeon, Korea, 2009; pp. 380–391. [Google Scholar]
- Kim, S.K.; Chun, K.S.; Choi, H.J.; Choi, J.W.; Kwak, T.W. Cost estimation of the canisters for an HLW repository in Korea. Prog. Nucl. Energy 2007, 49, 555–566. [Google Scholar] [CrossRef]
- Chang, Y.I.; James, R. Summary Report Conceptual Design of a Pilot-Scale Pyroprocessing Facility; ANL/NE-Landmark-CRADA-12; Argonne National Laboratory: Argonne, WI, USA, 2015.
- INL. Advanced Fuel Cycle Facility Conceptual Design and NEPA Support Activities; AFCF Report AFCF-ST-001, Rev.1; Idaho National Laboratory: Idaho Falls, ID, USA, 2008.
- Kinoshita, K.; Koyama, K. Material Balance and Plant Design of Pyro-Reprocessing for Metal Fuel; CRIEPI Nuclear Technology Research Laboratory Report No. L11009; Central Research Institute of Electric Power Industry (CRIEPI): Tokyo, Japan, 2013. [Google Scholar]
- Cipiti, B.B.; Durán, F.A.; Key, B.; Liu, Y.; Lozano, I.; Ward, R. Modeling and Design of Integrated Safeguards and Security for an Electrochemical Reprocessing Facility; SAND2012-9303; Sandia National Laboratories: Albuquerque, NM, USA, 2012.
- Simpson, M.F.; Benedict, R.W. Strategic Minimization of High Level Waste from Pyroprocessing of Spent Nuclear Fuel; INL/CON-07-12123; Idaho National Laboratory (INL): Idaho Falls, ID, USA, 2007.
- Quah, E.; Siong, T.T.; Lee, Z.J.L. Chapter 9—Cost-benefit analysis in developing countries. In Advances in Transport Policy and Planning; Elsevier Inc.: Amsterdam, The Netherlands, 2021; Volume 7, pp. 235–260. Available online: https://www.sciencedirect.com/bookseries/advances-in-transport-policy-and-planning/vol/7/suppl/C (accessed on 1 July 2021).
- D’Adamo, I.; Falcone, P.M.; Huisingh, D.; Morone, P. A circular economy model based on biomethane: What are the opportunities for the municipality of Rome and beyond? Renew. Energy 2021, 163, 1660–1672. [Google Scholar] [CrossRef]
Publisher’s Note: MDPI stays neutral with regard to jurisdictional claims in published maps and institutional affiliations. |
© 2021 by the authors. Licensee MDPI, Basel, Switzerland. This article is an open access article distributed under the terms and conditions of the Creative Commons Attribution (CC BY) license (https://creativecommons.org/licenses/by/4.0/).