
Improvement of the Outdoor Thermal Comfort by Water Spraying in a High-Density Urban Environment under the Influence of a Future (2050) Climate


Abstract
:1. Introduction
2. Materials and Methods
2.1. Model Setting for the WRF Model
2.2. Model Setting for the ENVI-Met Models
2.3. Adopted Thermal Sensation Category
3. Results and Discussion
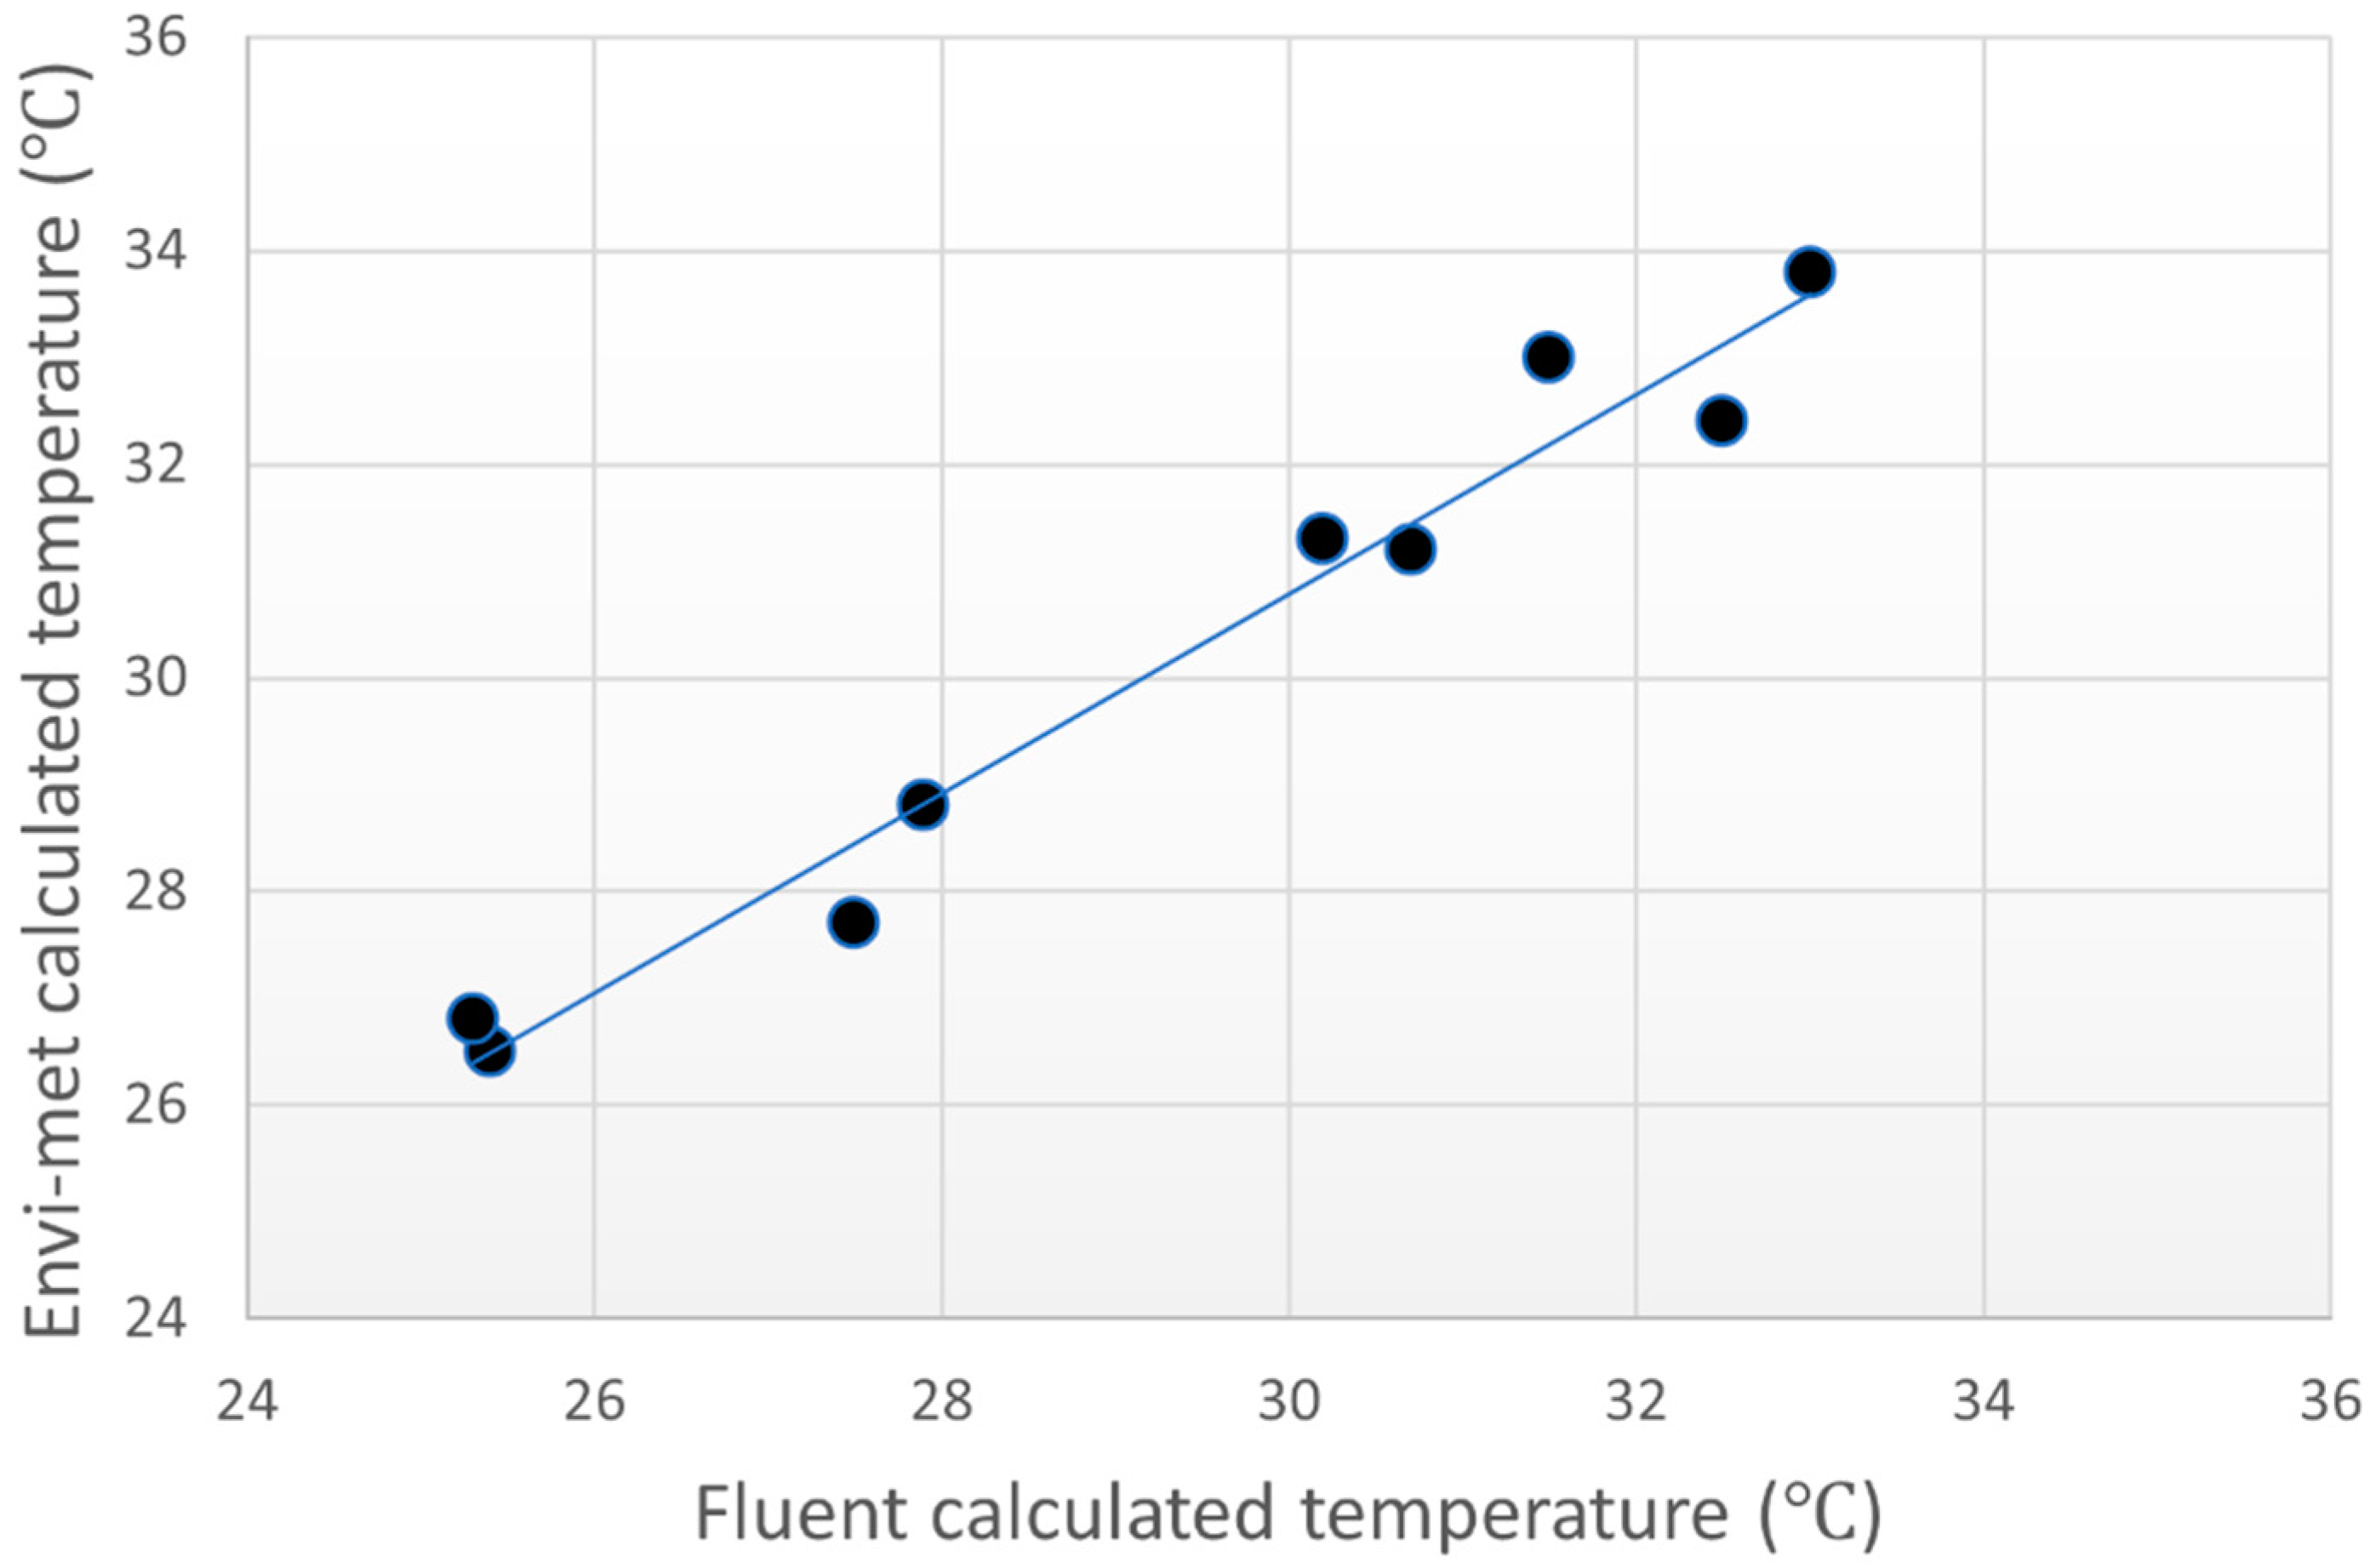
3.1. Evaluation of the ENVI-Met Model Version 3.1 Regarding Air Temperature
3.2. Evaluation of the ENVI-Met Model Version 4.4.4 Regarding Water Spray Model Performance
3.3. Reduction in Ambient Air Temperature by Water Spraying
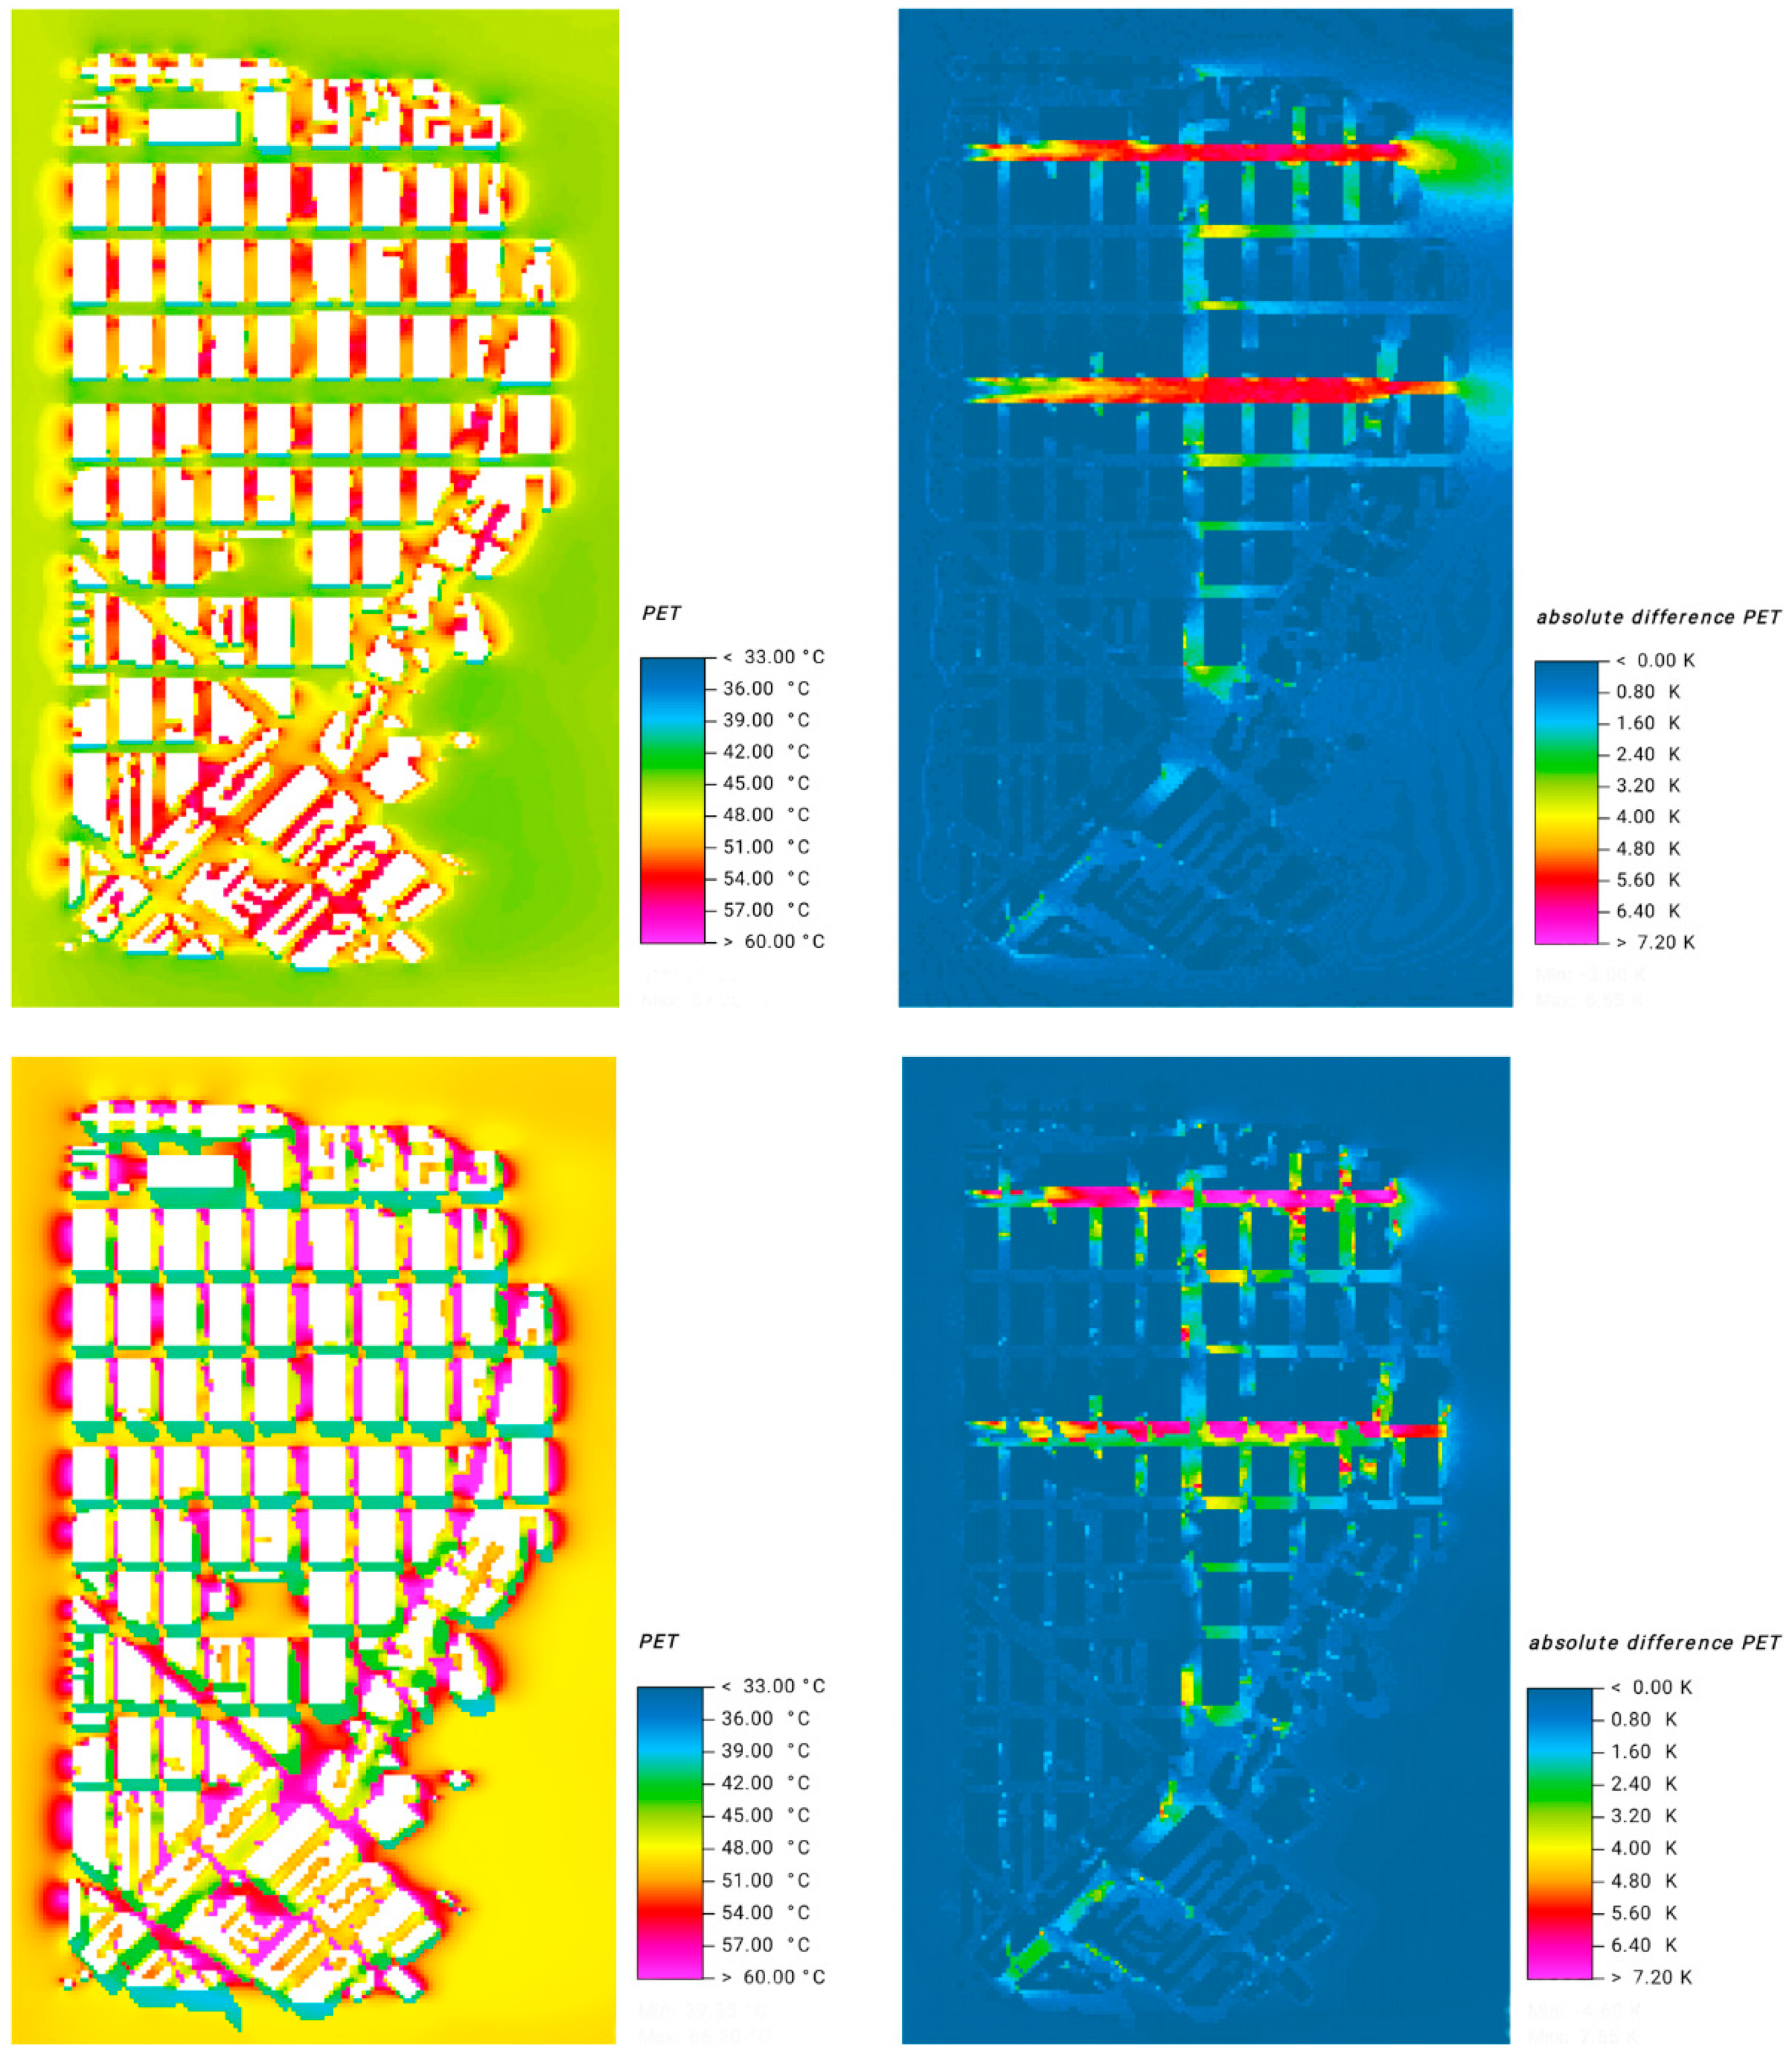
3.4. Reduction in PET by Water Spraying
3.5. Implications on Climate Change and UHI Adaptation Measures
4. Conclusions
Author Contributions
Funding
Data Availability Statement
Acknowledgments
Conflicts of Interest
References
- Arifwidodo, S.D.; Chandrasiri, O. Urban heat stress and human health in Bangkok, Thailand. Environ. Res. 2020, 185, 109398. [Google Scholar] [CrossRef]
- Georgescu, M.; Moustaoui, M.; Mahalov, A.; Dudhia, J. Summer-time climate impacts of projected megapolitan expansion in Arizona. Nat. Clim. Chang. 2013, 3, 37–41. [Google Scholar] [CrossRef]
- Georgescu, M.; Morefield, P.E.; Bierwagen, B.G.; Weaver, C.P. Urban adaptation can roll back warming of emerging megapolitan regions. Proc. Natl. Acad. Sci. USA 2014, 111, 2909–2914. [Google Scholar] [CrossRef] [Green Version]
- Kameni Nematchoua, M.; Roshan, G.; Tchinda, R. Impact of Climate Change on Outdoor Thermal Comfort and Health in Tropical Wet and Hot Zone (Douala), Cameroon, African. J. Health Sci. 2014, 2, 25–36. [Google Scholar]
- Müller, N.; Kuttler, W.; Barlag, A. Counteracting urban climate change: Adaptation measures and their effect on thermal comfort. Theor. Appl. Climatol. 2014, 115, 243–257. [Google Scholar] [CrossRef] [Green Version]
- Huang, Y.Q.; Lai, D.Y.; Liu, Y.Q.; Xuan, H. Impact of climate change on outdoor thermal comfort in cities in united states. In E3S Web of Conferences; EDP Sciences: Les Ulis, France, 2020; Volume 158. [Google Scholar]
- IPCC. Climate Change 2013: The Physical Science Basis. In Contribution of Working Group I to the Fifth Assessment Report of the Intergovernmental Panel on Climate Change; Stocker, T.F., Qin, D., Plattner, G.-K., Tignor, M., Allen, S.K., Boschung, J., Nauels, A., Xia, Y., Bex, V., Midgley, P.M., Eds.; Cambridge University Press: Cambridge, UK; New York, NY, USA, 2013. [Google Scholar]
- Hondula, D.M.; Georgescu, M.; Balling, R.C., Jr. Challenges associated with projecting urbanization-induced heat-related mortality. Sci. Total Environ. 2014, 490, 538–544. [Google Scholar] [CrossRef]
- Shashua-Bar, L.; Pearlmutter, D.; Erell, E. The cooling efficiency of urban landscape strategies in a hot dry climate. Landsc. Urban Plan. 2009, 92, 179–186. [Google Scholar] [CrossRef]
- Tan, Z.; Lau, K.K.L.; Ng, E. Urban tree design approaches for mitigating daytime urban heat island effects in a high-density urban environment. Energ. Build. 2016, 114, 265–274. [Google Scholar] [CrossRef]
- Wai, K.M.; Tan, T.Y.Z.; Morakinyo, T.E.; Chan, T.C.; Lai, A. Reduced effectiveness of tree planting on micro-climate cooling due to ozone pollution—A modeling study. Sustain. Cities Soc. 2020, 52, 101803. [Google Scholar] [CrossRef]
- Ali-Toudert, F.; Mayer, H. Effects of asymmetry, galleries, overhanging facades and vegetation on thermal comfort in urban street canyons. Sol. Energy 2007, 81, 742–754. [Google Scholar] [CrossRef]
- Jamei, E.; Rajagopalan, P. Urban development and pedestrian thermal comfort in Melbourne. Sol. Energy 2017, 144, 681–698. [Google Scholar] [CrossRef]
- Wai, K.M.; Yuan, C.; Lai, A.; Yu, P.K.N. Relationship between pedestrian-level outdoor thermal comfort and building morphology in a high-density city. Sci. Total Environ. 2020, 708, 134–516. [Google Scholar] [CrossRef]
- Atieh, A.; Shariff, S.A. Solar energy powering up aerial misting systems for cooling surroundings in Saudi Arabia. Energ. Convers. Manag. 2013, 65, 670–674. [Google Scholar] [CrossRef]
- Montazeri, H.; Toparlar, Y.; Blocken, B.; Hensen, J.L.M. Simulating the cooling effects of water spray systems in urban landscapes: A computational fluid dynamics study in Rotterdam, The Netherlands. Landsc. Urban Plan. 2017, 159, 85–100. [Google Scholar] [CrossRef]
- Chatzidimitriou, A.; Liveris, P.; Bruse, M.; Topli, L. Urban Redevelopment and Microclimate Improvement: A Design Project in Thessaloniki, Greece. In Proceedings of the PLEA2013—29th Conference, Sustainable Architecture for a Renewable Future, Munich, Germany, 10–12 September 2013. [Google Scholar]
- Martins, T.; Adolphe, L.; Bonhomme, M.; Bonneaud, F.; Faraut, S.; Ginestet, S.; Michel, C.; Guyard, W. Impact of Urban Cool Island measures on outdoor climate and pedestrian comfort: Simulations for a new district of Toulouse, France. Sustain. Cities Soc. 2016, 26, 9–26. [Google Scholar] [CrossRef]
- Vanos, J.K.; Wright, M.K.; Kaiser, A.; Middel, A.; Ambrose, H.; Hondula, D.M. Evaporative misters for urban cooling and comfort: Effectiveness and motivations for use. Int. J. Biomet. 2020, 1–13. [Google Scholar] [CrossRef]
- Situ, S.; Guenther, A.; Wang, X.; Jiang, X.; Turnipseed, A.; Wu, Z.; Bai, J.; Wang, X. Impacts of seasonal and regional variability in biogenic VOC emissions on surface ozone in the Pearl River delta region, China. Atmos. Chem. Phys. 2013, 13, 11803–11917. [Google Scholar] [CrossRef] [Green Version]
- Lin, Y.L.; Farley, R.D.; Orvilie, H.D. Bulk parameterization of the snow field in a cloud model. J. Appl. Meteor. 1983, 22, 1065–1092. [Google Scholar] [CrossRef] [Green Version]
- Chou, M.D.; Suarez, M.J.; Ho, C.H.; Yan, M.H.H.; Lee, K.T. Parameterizations for cloud overlapping and shortwave single scattering properties for use in general circulation and cloud ensemble models. Climate 1998, 11, 202–214. [Google Scholar] [CrossRef]
- Mlawer, E.J.; Taubman, S.J.; Brown, P.D.; Iacono, M.J.; Clough, S.A. Radiative transfer for inhomogeneous atmosphere: RRTM, a validated correlated-K model for longwave. J. Geophys. Res. Atmos. 1997, 102, 16663–16682. [Google Scholar] [CrossRef] [Green Version]
- Janjic, Z.L. Nonsingular Implementation of the Mellor-Yamada Level 2.5 Scheme in the NCEP Meso model. NCEP Off. Note 2002, 437, 61. [Google Scholar]
- Kain, J.S.; Fritsch, J.M. Convective parameterization for mesoscale model: The Kain-Fritsch scheme. Meteorol. Monogr. 1993, 24, 165–170. [Google Scholar]
- Chen, F.; Dudhia, J. Coupling an advanced land-surface/hydrology model with the Penn State/NCAR MM5 modeling system. Part I Model Descr. Implement. 2001, 129, 569–585. [Google Scholar]
- Martilli, A.; Clappier, A.; Rotach, M.W. An urban surface exchange parameterization for mesoscale models. Bound. Layer Meteorol. 2002, 104, 261–304. [Google Scholar] [CrossRef]
- Wang, X.M.; Lin, W.S.; Yang, L.M.; Deng, R.R.; Lin, H. A numerical study of influences of urban land-use change on ozone distribution over the Pearl River Delta Region, China. Tellus Series B chem. Phys. Meteorol. 2007, 59, 633–641. [Google Scholar] [CrossRef]
- Bruyère, C.L.; Done, J.M.; Holland, G.J.; Fredrick, S. Bias corrections of global models for regional climate simulations of high-impact weather. Clim. Dynam. 2014, 43, 1847–1856. [Google Scholar] [CrossRef] [Green Version]
- Monaghan, A.J.; Steinhoff, D.F.; Bruyere, C.L.; Yates, D. NCAR CESM Global Bias-Corrected CMIP5 Output to Support WRF/MPAS Research. In Research Data Archive at the National Center for Atmospheric Research; Computational and Information Systems Laboratory: Valmont, CO, USA, 2014. [Google Scholar]
- Kim, D.W.; Deo, R.C.; Chung, J.H.; Lee, J.S. Projection of heat wave mortality related to climate change in Korea. Nat. Hazards 2016, 80, 623–637. [Google Scholar] [CrossRef]
- European Union. Global and European Temperature; European Environment Agency (EEA). Available online: https://www.eea.europa.eu/data-and-maps/indicators/global-and-european-temperature-9/assessment (accessed on 11 June 2021).
- Bruse, M.; Fleer, H. Simulating surface–plant–air interactions inside urban environments with a three dimensional numerical model. Environ. Modell. Softw. 1998, 13, 373–384. [Google Scholar] [CrossRef]
- Perini, K.; Magliocco, A. Effects of vegetation, urban density, building height, and atmospheric conditions on local temperatures and thermal comfort. Urban For. Urban Gree. 2014, 13, 495–506. [Google Scholar] [CrossRef]
- Drapella-Hermansdorfer, A.; Gierko, A. Rediscovering the “Atrium Effect” in Terms of the European Green Deal’s Objectives: A Case Study. Buildings 2020, 10, 46. [Google Scholar] [CrossRef] [Green Version]
- Buildings Department. A Guideline of Building Regulation Submission for Lighting Requirements of Buildings Using Computational Simulations, Technical Report for Buildings Department HKSAR; Buildings Department: Hong Kong, China, 2004.
- Lin, T.; Matzarakis, A. Tourism climate and thermal comfort in Sun Moon Lake, Taiwan. Int. J. Biometeor. 2008, 52, 281–290. [Google Scholar] [CrossRef]
- Chow, W.T.L.; Pope, R.L.; Martin, C.A.; Brazel, A.J. Observing and modeling the nocturnal park cool island of an arid city: Horizontal and vertical impacts. Theor. Appl. Climatol. 2011, 103, 197–211. [Google Scholar] [CrossRef]
- Sodoudi, S.; Zhang, H.; Chi, X.; Müller, F.; Li, H. The influence of spatial configuration of green areas on microclimate and thermal comfort. Urban For. Urban Gree. 2018, 34, 85–96. [Google Scholar] [CrossRef]
- Berardi, U. The outdoor microclimate benefits and energy saving resulting from green roofs retrofits. Energy Build. 2016, 121, 217–229. [Google Scholar] [CrossRef]
- Hu, L.; Brunsell, N.A.; Monaghan, A.J.; Barlage, M.; Wilhelmi, O.V. How can we use MODIS land surface temperature to validate long-term urban model simulations? J. Geophys. Res. Atmos. 2014, 119, 3185–3201. [Google Scholar] [CrossRef] [Green Version]
- Toparlar, Y.; Blocken, B.; Vos, P.V.; Van Heijst, G.J.F.; Janssen, W.D.; van Hooff, T.; Montazeri, H.; Timmermans, H.J.P. CFD simulation and validation of urban microclimate: A case study for Bergpolder Zuid, Rotterdam. Build. Environ. 2015, 83, 79–90. [Google Scholar] [CrossRef] [Green Version]
- Narita, K.; Kohno, T.; Misaka, I. Experimental study on evaporative cooling of fine water mist for outdoor comfort in the urban environment. In Proceedings of the Third International Conference on Countermeasures to Urban Heat Island, Venice, Italy, 13–15 October 2014. [Google Scholar]
- Nishimura, N.; Nomura, T.; Iyota, H.; Kimoto, S. Novel water facilities for creation of comfortable urban micrometeorology. Sol. Energy 1998, 64, 197–207. [Google Scholar] [CrossRef]
- Santamouris, M.; Papanikolaou, N.; Livada, I.; Koronakis, I.; Georgakis, C.; Argiriou, A.; Assimakopoulos, D.N. On the impact of urban climate on the energy consumption of buildings. Sol. Energy 2001, 70, 3201–3216. [Google Scholar] [CrossRef]
- Fung, W.Y.; Lam, K.S.; Hung, W.T.; Pang, S.W.; Lee, Y.L. Impact of urban temperature on energy consumption of Hong Kong. Energy 2006, 31, 2623–2637. [Google Scholar] [CrossRef]
- Huttner, S.; Bruse, M.; Dostal, P. Using ENVI-met to simulate the impact of global warming on the microclimate in central European cities. In Proceedings of the Berichte des Meteorologischen Instituts der Albert-Ludwigs-Universität Freiburg Nr, Helmut Mayer and Andreas Matzarakis (eds.): 5th Japanese-German Meeting on Urban Climatology, Freiburg, Germany, 6 October 2008; pp. 307–312. [Google Scholar]
- Roshan, G.; Ghanghermeh, A.; Kong, Q. Spatial and temporal analysis of outdoor human thermal comfort during heat and cold waves in Iran. Weather Clim. Extrem. 2018, 19, 58–67. [Google Scholar] [CrossRef]
- Van Hove, L.W.A.; Jacobs, C.M.J.; Heusinkveld, B.G.; Elbers, J.A.; van Driel, B.L.; Holtslag, A.A.M. Temporal and spatial variability of urban heat island and thermal comfort within the Rotterdam agglomeration. Build. Environ. 2015, 83, 91–103. [Google Scholar] [CrossRef] [Green Version]
- Kleerekoper, L.; Taleghani, M.; van den Dobbelsteen, A.; Hordijk, T. Urban measures for hot weather conditions in a temperate climate condition: A review study. Renew. Sust. Energ. Rev. 2017, 75, 515–533. [Google Scholar] [CrossRef]
- Gómez, F.; Cueva, A.P.; Valcuende, M.; Matzarakis, A. Research on ecological design to enhance comfort in open spaces of a city (Valencia, Spain). Utility of the physiological equivalent temperature (PET). Ecol. Eng. 2013, 57, 27–39. [Google Scholar] [CrossRef]
- Wong, W.H.; Jusuf, S.K. Urban heat island and mitigation strategies at city and building level. In Advances in the Development of Cool Materials for the Built Environment; Bentham Science: Sharjah, United Arab Emirates, 2013; pp. 3–32. [Google Scholar]
- Yuan, C.; Ng, E. Building porosity for better urban ventilation in high-density cities—A computational parametric study. Build. Environ. 2012, 50, 176–189. [Google Scholar] [CrossRef] [PubMed]


| ENVI-Met (Version 4.4.4) | |
|---|---|
| Hourly air temperature | Based on ENVI-met model version 3.1 outputs |
| Prevailing wind speed (at 10 m AGL) | 2.0 ms−1 |
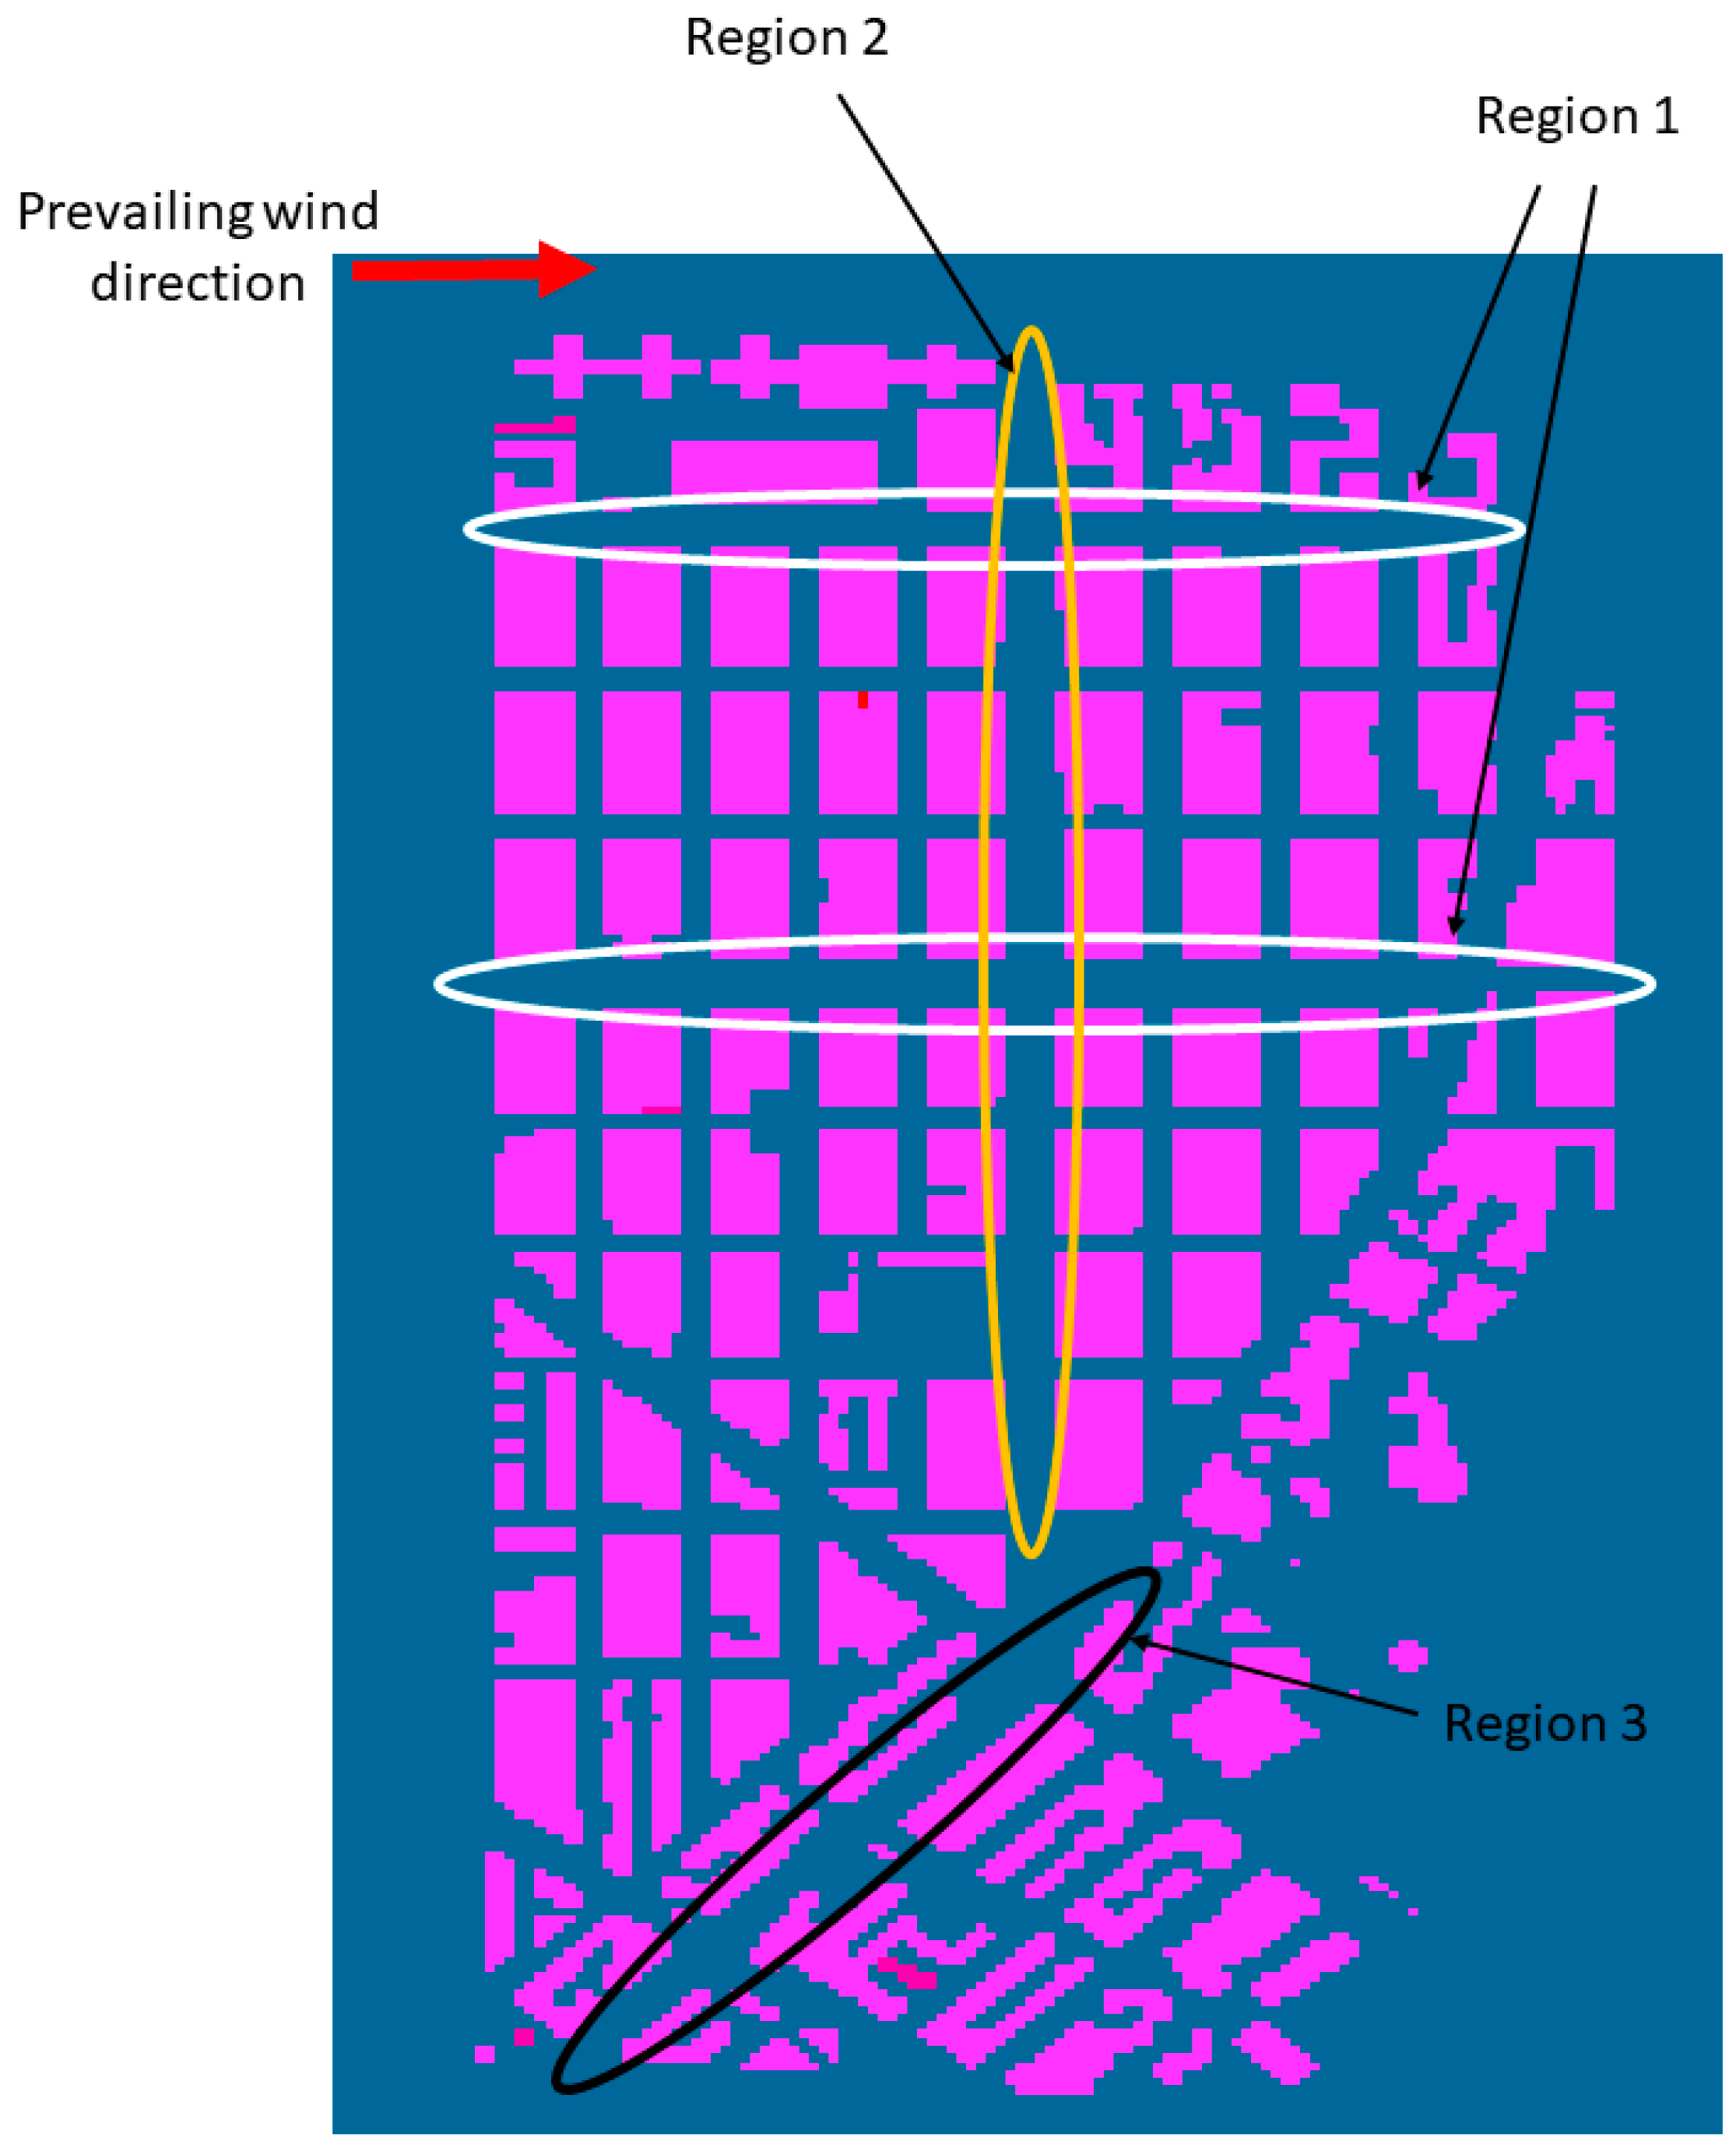
| Prevailing wind direction | 225° |
| Relative humidity (at 2 m AGL) | 84.3% |
| Roughness length | 0.1 m |
| ENVI-Met (Version 3.1) | |
| Initial air temperature at the present-time | 26.4 °C |
| Initial air temperature in 2050 | 30.9 °C, see text |
| Scenarios | Remarks |
|---|---|
| S0, no spray | No spraying applied to the urban thermal environment, representing the future base scenario |
| S1, early operation of the spray system | The spray system operating at an injected water flow rate of 4.5 L min−1, from 10:00 to 16:00 at urban canyons |
| S2, late operation of the spray system | Same as scenario S1, but operating from 12:00 to 16:00 |
| Thermal Sensation | PET (°C) |
|---|---|
| Very cold | <14 |
| Cold | 14 to 18 |
| Cool | 18 to 22 |
| Slightly cool | 22 to 26 |
| Neutral | 26 to 30 |
| Slightly warm | 30 to 34 |
| Warm | 34 to 38 |
| Hot | 38 to 42 |
| Very hot | >42 |
Publisher’s Note: MDPI stays neutral with regard to jurisdictional claims in published maps and institutional affiliations. |
© 2021 by the authors. Licensee MDPI, Basel, Switzerland. This article is an open access article distributed under the terms and conditions of the Creative Commons Attribution (CC BY) license (https://creativecommons.org/licenses/by/4.0/).
Share and Cite
Wai, K.-M.; Xiao, L.; Tan, T.Z. Improvement of the Outdoor Thermal Comfort by Water Spraying in a High-Density Urban Environment under the Influence of a Future (2050) Climate. Sustainability 2021, 13, 7811. https://doi.org/10.3390/su13147811
Wai K-M, Xiao L, Tan TZ. Improvement of the Outdoor Thermal Comfort by Water Spraying in a High-Density Urban Environment under the Influence of a Future (2050) Climate. Sustainability. 2021; 13(14):7811. https://doi.org/10.3390/su13147811
Chicago/Turabian StyleWai, Ka-Ming, Lei Xiao, and Tanya Zheng Tan. 2021. "Improvement of the Outdoor Thermal Comfort by Water Spraying in a High-Density Urban Environment under the Influence of a Future (2050) Climate" Sustainability 13, no. 14: 7811. https://doi.org/10.3390/su13147811
APA StyleWai, K.-M., Xiao, L., & Tan, T. Z. (2021). Improvement of the Outdoor Thermal Comfort by Water Spraying in a High-Density Urban Environment under the Influence of a Future (2050) Climate. Sustainability, 13(14), 7811. https://doi.org/10.3390/su13147811