Abstract
To perform technology analysis, we usually search patent documents related to target technology. In technology analysis using statistics and machine learning algorithms, we have to transform the patent documents into structured data that is a matrix of patents and keywords. In general, this matrix is very sparse because its most elements are zero values. The data is not satisfied with data normality assumption. However, most statistical methods require the assumption for data analysis. To overcome this problem, we propose a patent analysis method using Bayesian structure learning and visualization. In addition, we apply the proposed method to technology analysis of extended reality (XR). XR technology is integrated technology of virtual and real worlds that includes all of virtual, augmented and mixed realities. This technology is affecting most of our society such as education, healthcare, manufacture, disaster prevention, etc. Therefore, we need to have correct understanding of this technology. Lastly, we carry out XR technology analysis using Bayesian structure learning and visualization.
1. Introduction
Extended reality (XR) technology, including virtual reality (VR), augmented reality (AR) and mixed reality (MR), has been rapidly developing in recent years and have a lot of influence on our society in various fields such as education, psychology, firefighting, culture and manufacturing [1,2,3,4,5,6]. As our daily life is increasingly dependent on XR technology, we need to have a good understanding of this technology. So, we have to analyze XR technology to understand this technology well. In general, most studies on technology analysis have been focused on patent documents related to target technology [7,8,9,10,11]. This is because a patent contains detailed results of the researched and developed technology [12]. In this paper, we also collect the patent documents on XR technology. To analyze XR patent documents, we have to preprocess the retrieved patent documents, that is, transform the patent documents into structured data such as table of database management system, because statistics and machine learning algorithms require structured data type for patent data analysis [8,10,13]. There are various approaches to patent data preprocessing, such as text mining and natural language processing [14,15,16]. The structured data that has been preprocessed is a matrix that has patent document and keyword for its row and column, respectively. Its element represents occurred frequency of each keyword in a patent document. However, this structured data has several problems in terms of data analysis using statistical machine learning. One of them is data sparsity with a value of zero in many elements of the matrix [17,18]. Due to this problem, the normality assumption of the data is not satisfied. The same problem arises in the analysis of patent documents related to XR technology. However, most statistical machine learning methods require the data normality assumption. Therefore, new approach to patent data analysis is needed to overcome this obstacle. In our research, we propose a patent analysis method to know technological structure of XR based on Bayesian structure learning and visualization. To solve the sparsity problem that the structured patent data does not satisfy the normality assumption, we build a graphical model based on Bayesian structure learning [19]. In our graphical model, each node represents a patent keyword related to XR technology, and we extract conditional dependencies between nodes for understanding XR technology. Lastly, we perform XR technology analysis using XR patent documents searched from various patent databases to show how the proposed method can be applied to practical fields of XR technology. The remainder of this paper is organized as follows. In Section 2, we introduce the basic concepts of Bayesian networks and XR technology. Our proposed method is described in Section 3. The experiments and results are shown in Section 4. Next, in discussion section, we discuss the limitations and overcoming of our research. Finally, we conclude our research and explain future research plans in conclusions section.
2. Related Works
2.1. Bayesian Networks
We can represent the relationship between variables (keywords) using joint distributions of variables. Bayesian networks is a directed graph model based on the joint distributions using chain rule as follow [20]:
are n random variables and is a joint distribution of . Using the Equation (1), we can find the causal relations between variables (keywords). So, this model is called as Bayesian belief networks or causal networks. The Bayesian networks have applied to patent data analysis for technology analysis [21]. This model generally requires a complete data to compute the joint probabilities. However, the structured data from patent documents by data preprocessing as sparse because most elements of the structured patent data are zeros. The previous research of Bayesian networks was not considered this sparse problem. So, the technology analysis results by Bayesian network have a limit in the performance of the model. To overcome this problem, we propose a technology analysis using Bayesian structure learning considering prior distribution for model parameters.
2.2. Extended Reality Technology
VR is another world created using computer technology, which means an environment that users believe to be real [1,5,22]. AR is a variation of VR which combines real and virtual environments [1,5,22,23]. We can interact with the real world in virtual environment by VR technology [1,5,22,23]. MR is defined as an environment which represents real and virtual worlds at the same time [1,5,23]. Therefore, XR technology expands human senses and cognition into a virtual world that contains experiences and emotions similar to real life based on information and communication technology (ICT). XR technology is being used in various fields such as education, firefighting, culture, music, etc. [2,3,4,6]. In recent years, XR technology has evolved further in cloud computing environments [1]. To solve the cost problem of high-performance computing in XR technology, Liubogoshchev et al. (2021) proposed an XR system based on adaptive cloud computing platform [1]. Using the cloud XR technology, they provided an efficient data preprocessing generated from XR technology [1].
Recently, XR technology has been actively researched in various academic fields, and at the same time, demand for it is continuously increasing in industrial fields. In particular, in fields such as manufacturing, cultural industry, education and disaster prevention, XR technology has already been applied to improve the quality of human life [1,2,3,4,5,6]. However, the XR technology is still in beginning stage of research and development, and the possibilities for application of XR technology will continue to increase. So, in this paper, we propose a method of technology analysis and apply the proposed method to XR technology analysis. We improve our understanding of XR technology and suggest its applicability through the research results of this paper.
3. Proposed Methods
In this paper, we propose a technology analysis method using Bayesian structure learning for visualization. We also select XR technology as target technology in our research. Using Bayesian structure learning, we construct graphical models to understand XR technology by XR patent keywords. For technology analysis of XR field, we first collect patent documents from various patent databases such as the Korea Intellectual Property Rights Information Service (KIPRIS) and the United States Patent and Trademark Office (USPTO) [24,25]. In general, using the text mining techniques, the collected patent documents are transformed to a structure data as follows.
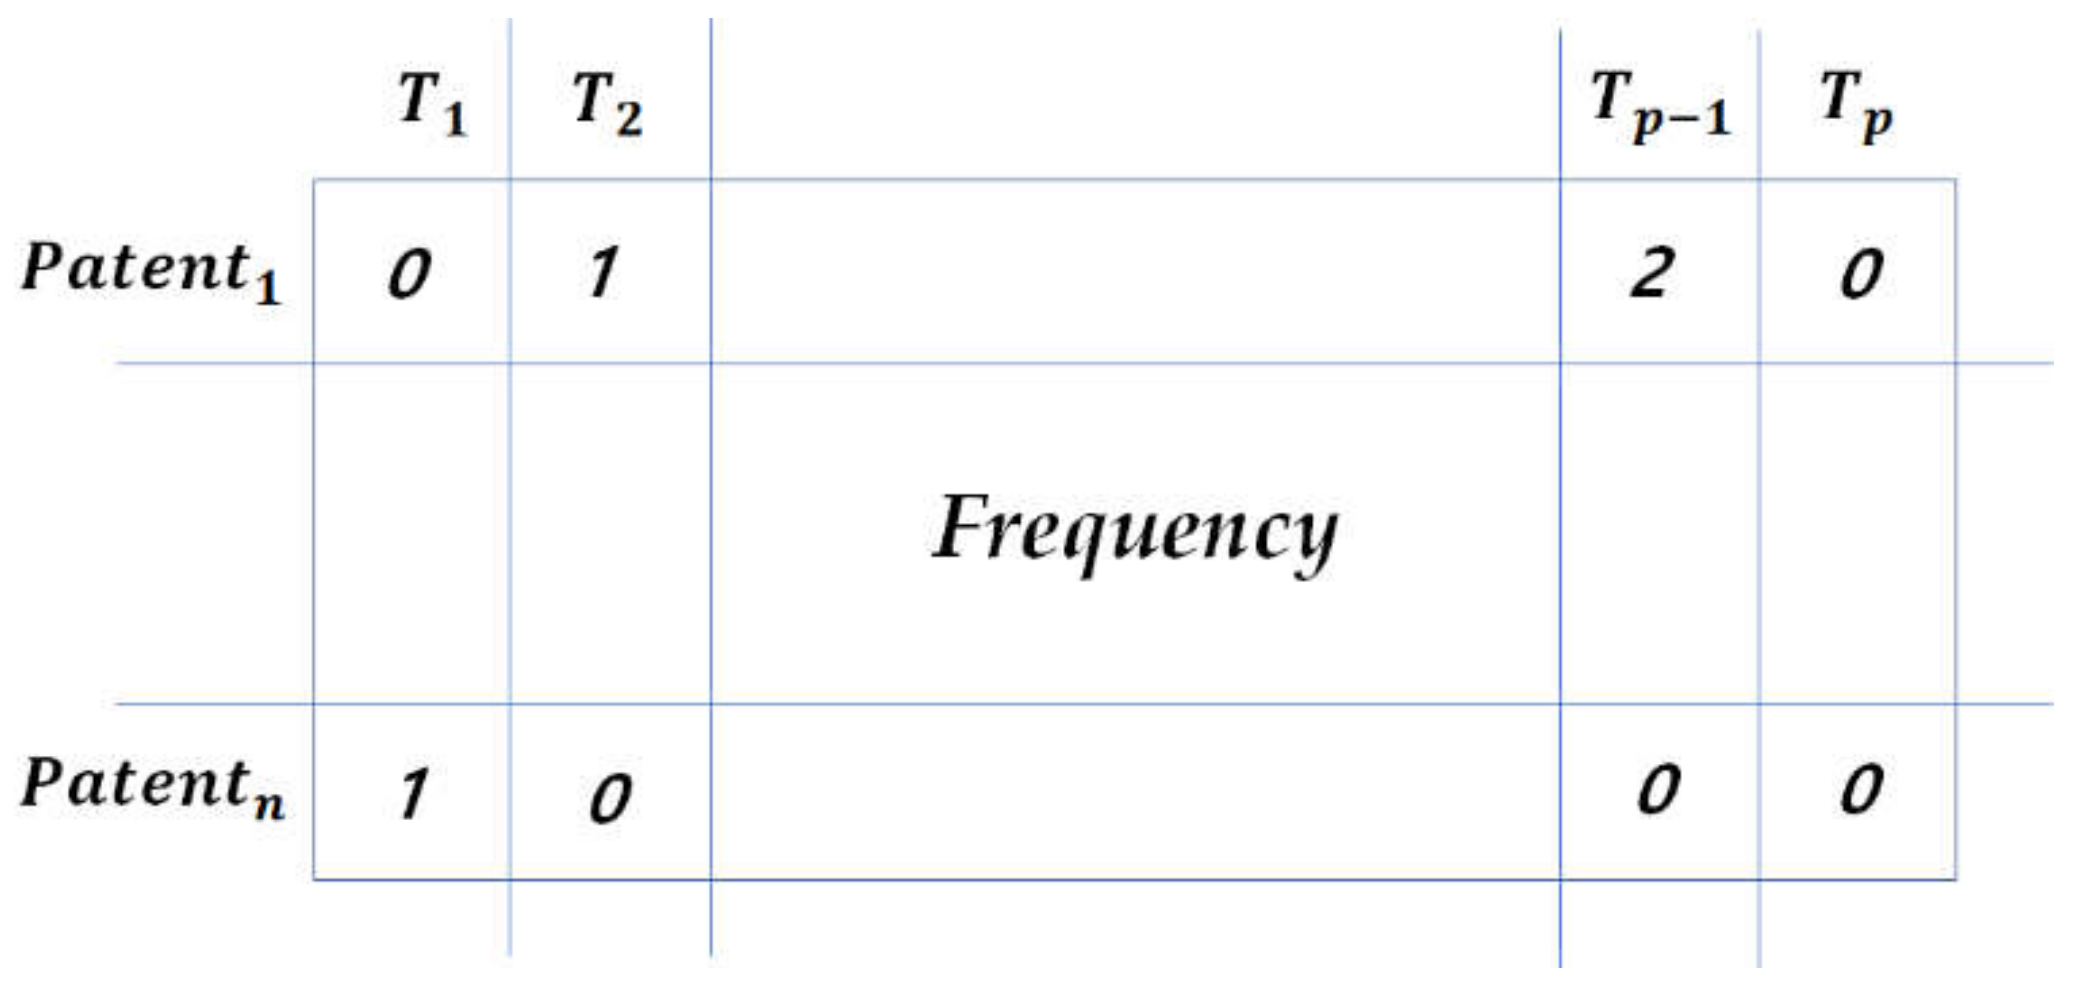
The structured patent data consists of patent documents and keywords. In Figure 1, is ith term representing ith keyword, and is jth patent document. The rows are XR patent documents and the columns are XR patent keywords corresponding to technologies. That is, this is a matrix and its elements represent occurred frequency of each keyword in a patent. In most previous research related to patent technology analysis, we met sparsity problem in this matrix. This problem occurs because most elements of the matrix have a value of zero. In addition, due to the data sparsity problem, this matrix does not satisfy the data normality assumption required by statistical machine learning. In order to analyze patent data using statistical machine learning algorithms, this problem must be solved. In this paper, we also use this data for the proposed method of XR technology analysis. The keywords are random variables in our model, and we find the technological relationships among the variables (keywords). For example, in the visualization by Bayesian graphical models, the node and link are random variable and technological dependency between variables. In graphical models, a graph is defined as G = (V, E), where V is vertex (node) and E is edge (link) [19]. In Figure 1, V and E are specified as (2).
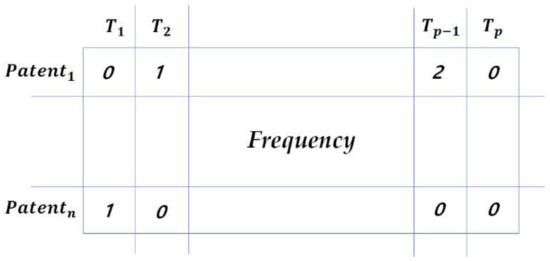
Figure 1.
Structured patent data.
If two different keywords are not linked, then they are independent each other. In other words, two sub-technologies based on two keywords do not have any technological relationship. On the other hand, if there is a link between the two keywords, they have a technological relationship with each other. We assume that the collected and preprocessed patent data is distributed to Gaussian distribution with mean = µ and variance = . We basically set the mean to zero and build the proposed model. The data of n independent samples is shown as , and the probability function is represented as (3) [26,27].
In our Bayesian learning, this is used as likelihood function of given data D and graph G. Next, we use G-Wishart probability distribution for prior distribution of . This is a conjugate prior to the likelihood in (3). Using the G-Wishart distribution [19,27], we define the prior distribution as (4).
where symmetric positive definite matrices with for all . is normalizing constant and its elements, b and S are degree of freedom and symmetric positive definite matrix, respectively [20]. In addition, is 1 when is satisfied. So, using the likelihood and prior of (3) and (4), we drive the posterior distribution of as (5) [26,27].
where is an observed data . In Formula (5), the posterior distribution of is the G-Wishart distribution with parameters, and , represented as . In the proposed method, we extract sample from this posterior distribution for Bayesian learning. We illustrate the joint posterior distribution of G and in Formula (6).
where the prior distribution of graph G, P(G) is binomial distribution on each link with binary values of 1 (connect) and 0 (disconnect). In this paper, we use the birth-death Markov Chain Monte Carlo (MCMC) sampling algorithm for XR technology analysis based on Bayesian graphical models [26]. Finally, we build the Bayesian visualization showing technological relations between XR patent keywords by the sampled data extracted from the posterior distribution. Our proposed method is carried out by the following procedure.
- (Step 1) Collect patent documents related to XR technology.
- (1-1) Retrieving patents from patent databases
- (1-2) Filtering valid patent documents for XR technology
- (Step 2) Transform the patent documents into structured data.
- (2-1) Using text mining techniques to make patent-keyword matrix
- (2-2) Checking normality assumption of structured data
- (Step 3) Select prior and likelihood for determining posterior of Bayesian learning.
- (3-1) Selecting conjugate prior to likelihood
- (3-2) Computing posterior by prior and likelihood
- (Step 4) Extract samples from the posterior distribution for patent keyword analysis.
- (4-1) Considering G-Wishart distribution for conjugate prior
- (4-2) Sampling based on birth-death MCMC algorithm
- (Step 5) Use the extracted samples for Bayesian visualization.
- (5-1) Estimating Bayesian graph of sata not satisfying normality assumption
- (5-2) Visualizing Bayesian graphs based on Gaussian graphical models
- (Step 6) Perform XR technology analysis using results of Bayesian graphical models.
- (6-1) Building Bayesian visualization based on inferred graphs of XR technology
- (6-2) Comparing performance results of Bayesian visualization
- (Step 7) Find technological relationships between sub technologies of XR.
- (7-1) Analyzing technological relations among XR patent keywords
- (7-2) Applying technological structure of XR technologies to R&D planning
From collecting patent documents to analyzing XR technology, we consider and use various approaches such as text mining, Bayesian statistics and Gaussian graphical models. Additionally, in this paper, we use skewness, kurtosis and Shapiro-Wilk test to check whether the structured patent data satisfies the normality assumption. The confirmation of data normality assumption is conducted individually according to each keyword. Therefore, the data of ith keyword is represented by , and n is the number of patents. The is occurred frequency of ith keyword in jth patent document. The skewness of a keyword data is calculated by the following equation [20].
In Equation (7), E(X) and 𝜎 are mean and standard deviation, respectively. The skewness of normal random variable equals to zero [20]. So, we compare the skewness values of the patent keywords with zero. We also define the kurtosis of patent keyword data as (8) [20].
As in the case of skewness, in order for the keyword data to satisfy the normality assumption, the value of kurtosis must also be zero [20]. We will compare how far the skewness and kurtosis values of each keyword are from zero to check whether the data is satisfied with the normality assumption. Lastly, we carry out the Shapiro-Wilk test to check the data normality assumption. For the Shapiro-Wilk test, we use the following statistic in (9) [28,29].
where are ordered frequency values of n patent documents. The is a tabulated constant of jth patent and is the mean value of ith keyword. We compute probability value (p-value) of the statistic and test the normality assumption of the structured patent data related to XR technology. In next section, we make experiments using XR patent documents searched from world patent databases and illustrate how the proposed method could be applied to practical domain of XR technology.
4. Experiments and Results
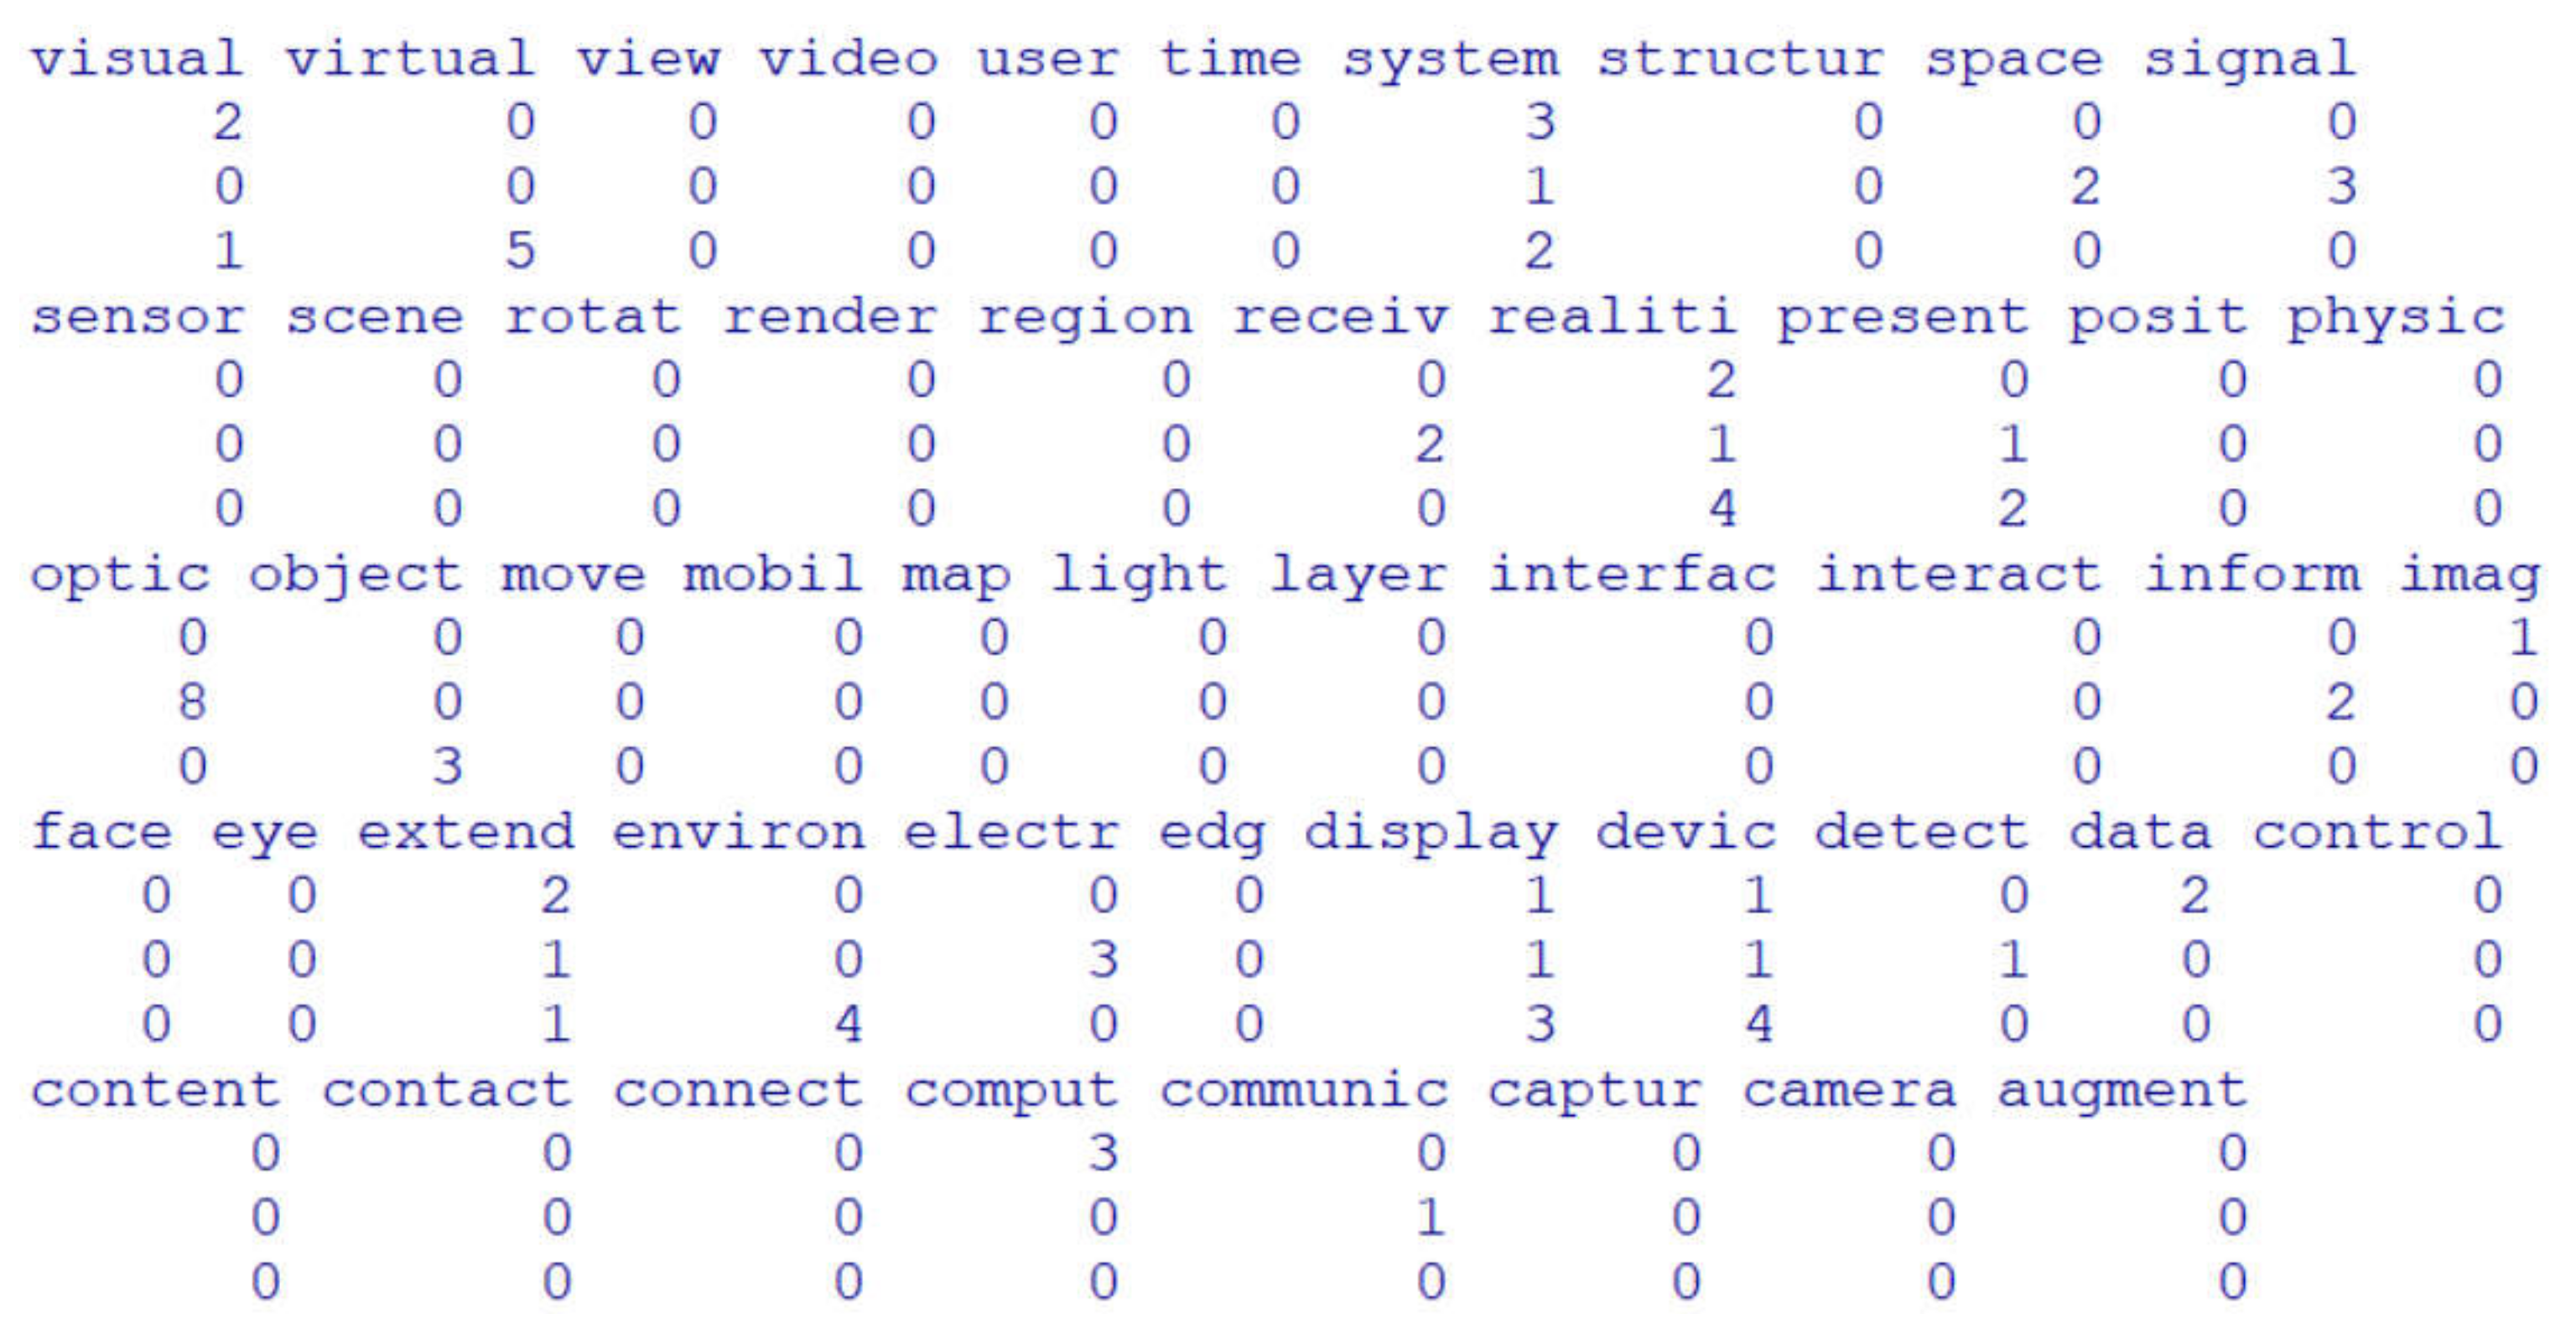
To illustrate the practical implementation of our methods, we used the patent documents of XR technology. We retrieved the documents from patent database of the KIPRIS and the USPTO [24,25]. The Keyword search formula was as follows; ((extended + virtual + augmented) * reality) * ((artificial * intelligent) + (data * (analysis + mining)) + (machine * learning)). The total number of valid patents was 3000. Using text mining techniques, we extracted 50 keywords representing XR technology as follows; device, system, virtual, user, display, image, reality, extend, data, object, posit, environ, control, augment, receive, light, inform, optic, present, view, content, sensor, space, compute, video, signal, layer, connect, structure, region, physic, camera, detect, capture, communication, interact, visual, rotate, render, time, face, interface, scene, electric, mobile, edge, contact, eye, map, move. So, we made patent-keyword matrix as a structured data used for Bayesian structure learning and visualization. Figure 2 shows the patent-keyword matrix for the first three documents for 50 keywords.
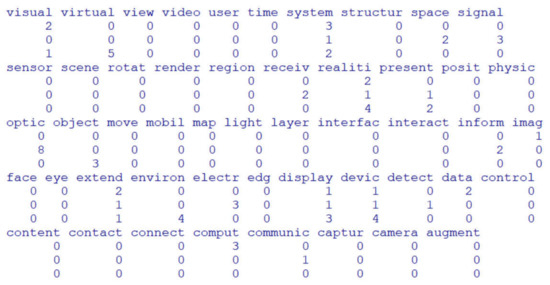
Figure 2.
Structured data consisting of patent-keyword matrix.
In Figure 2, each element of this matrix is occurred frequency value of keyword in a patent document. As can be seen in Figure 2, this matrix has a data sparsity problem where most elements are zero. Therefore, it is difficult for this data to satisfy the normality assumption. To check whether the structured data satisfies the normality assumption, we first calculated the skewness and kurtosis of the keywords included in the data. Table 1 shows the skewness values of all keywords.

Table 1.
Skewness values of keywords.
From Table 1, it can be seen that the skewness values of all keywords show a large difference from zero. Therefore, in skewness point of view, we found that the XR patent data does not satisfy the normality assumption. We also show the kurtosis values of all keywords in Table 2.
Table 2.
Kurtosis values of keywords.
Similar to skewness, we could see that the kurtosis values of all keywords showed a big difference from 0. So, from the results of skewness and kurtosis, we knew the XR patent data does not satisfy the normality assumption. Next, we carried out the Shapiro-Wilk test of normality to check normality assumption of data. Table 3 illustrates the results of Shapiro-Wilk normality test.
Table 3.
Results of Shapiro-Wilk normality test.
In Table 3, we represent W statistic and its p-value of each keyword. The p-value of all keywords are less than . So, we can conclude that all variables (keywords) are not satisfied with data normality assumption. Therefore, we found that the structured patent data related to XR technology is not satisfied with the data normality assumption from the results of Table 1, Table 2 and Table 3. In this paper, to overcome the problem of dissatisfaction with the normality assumption, we proposed a methodology of patent analysis using Bayesian learning and visualization. We first used all keywords for Bayesian visualization for understanding XR technology as follows.
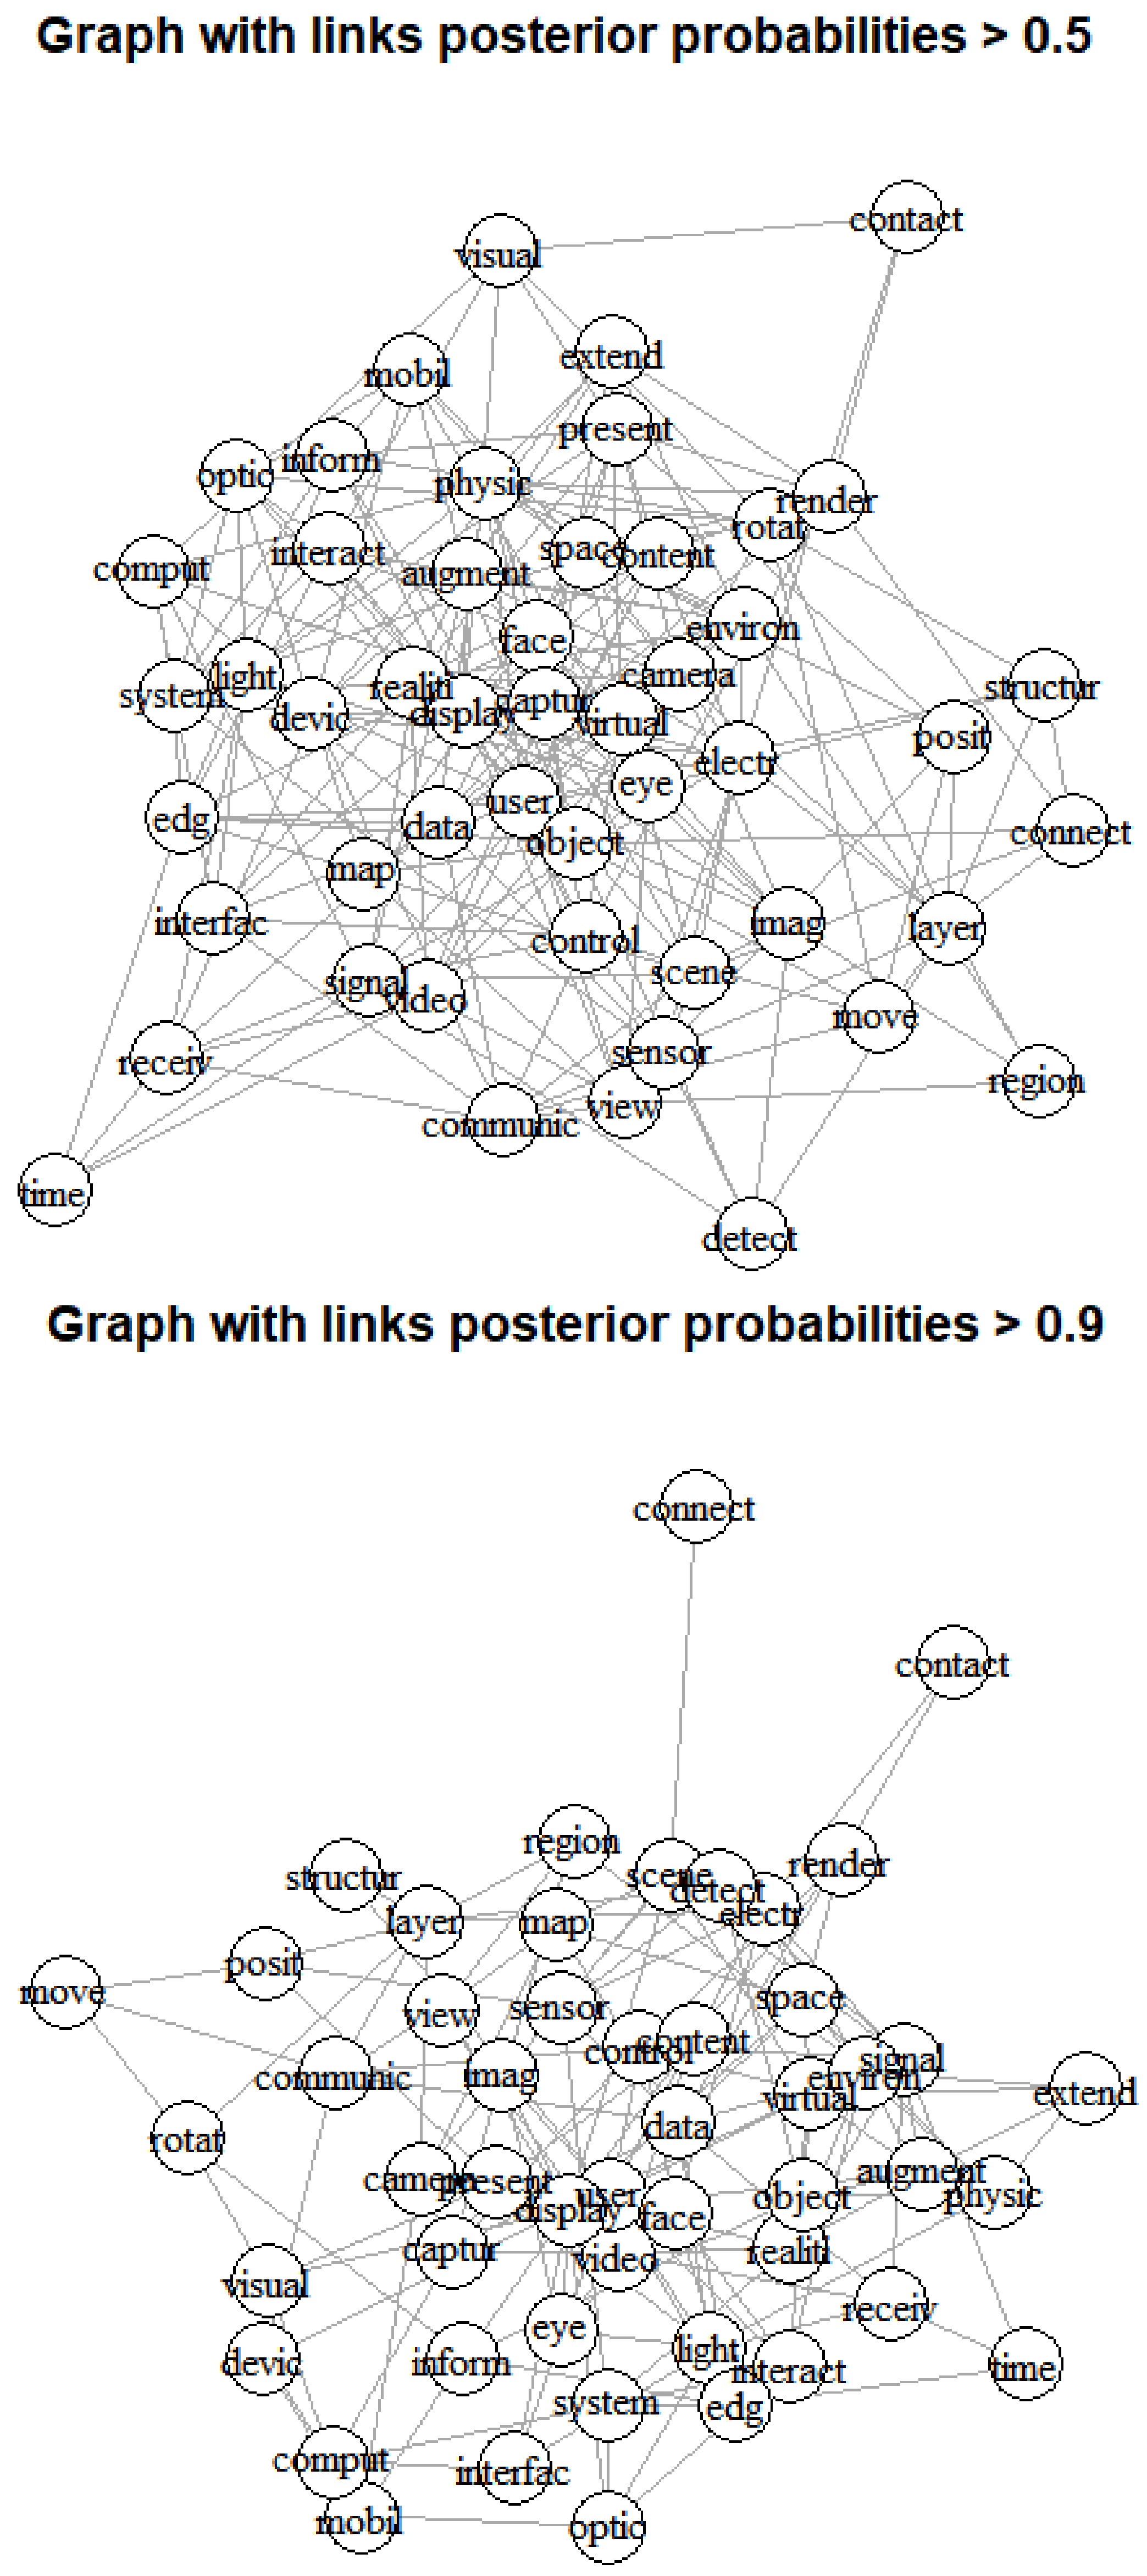
In Figure 3, the left graph is a visualization result of connecting all nodes with a posterior probability value of 0.5 or more, and the right graph is a visualization result connecting only nodes with a posterior probability value of 0.9 or more. First, through the results of the left graph of Figure 3, we confirmed that the nodes corresponding to keywords argument and display are located in the center of the graph and are most connected to other nodes. In contrast, in the graph on the right of Figure 3, we found that keywords corresponding to display, data and camera were connected to the most other keywords at the center of the graph. So, Table 4 shows the link ranking of all keywords according to posterior probabilities of 0.5 and 0.9.
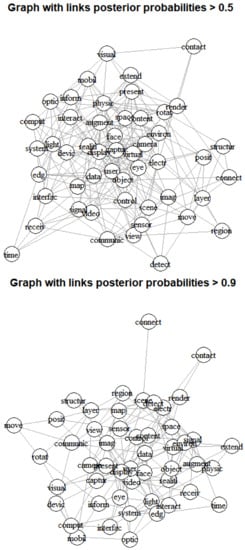
Figure 3.
Bayesian visualization based on inferred graph of all keywords (top: p > 0.5, bottom: p > 0.9).
Table 4.
Link ranking of all keywords.
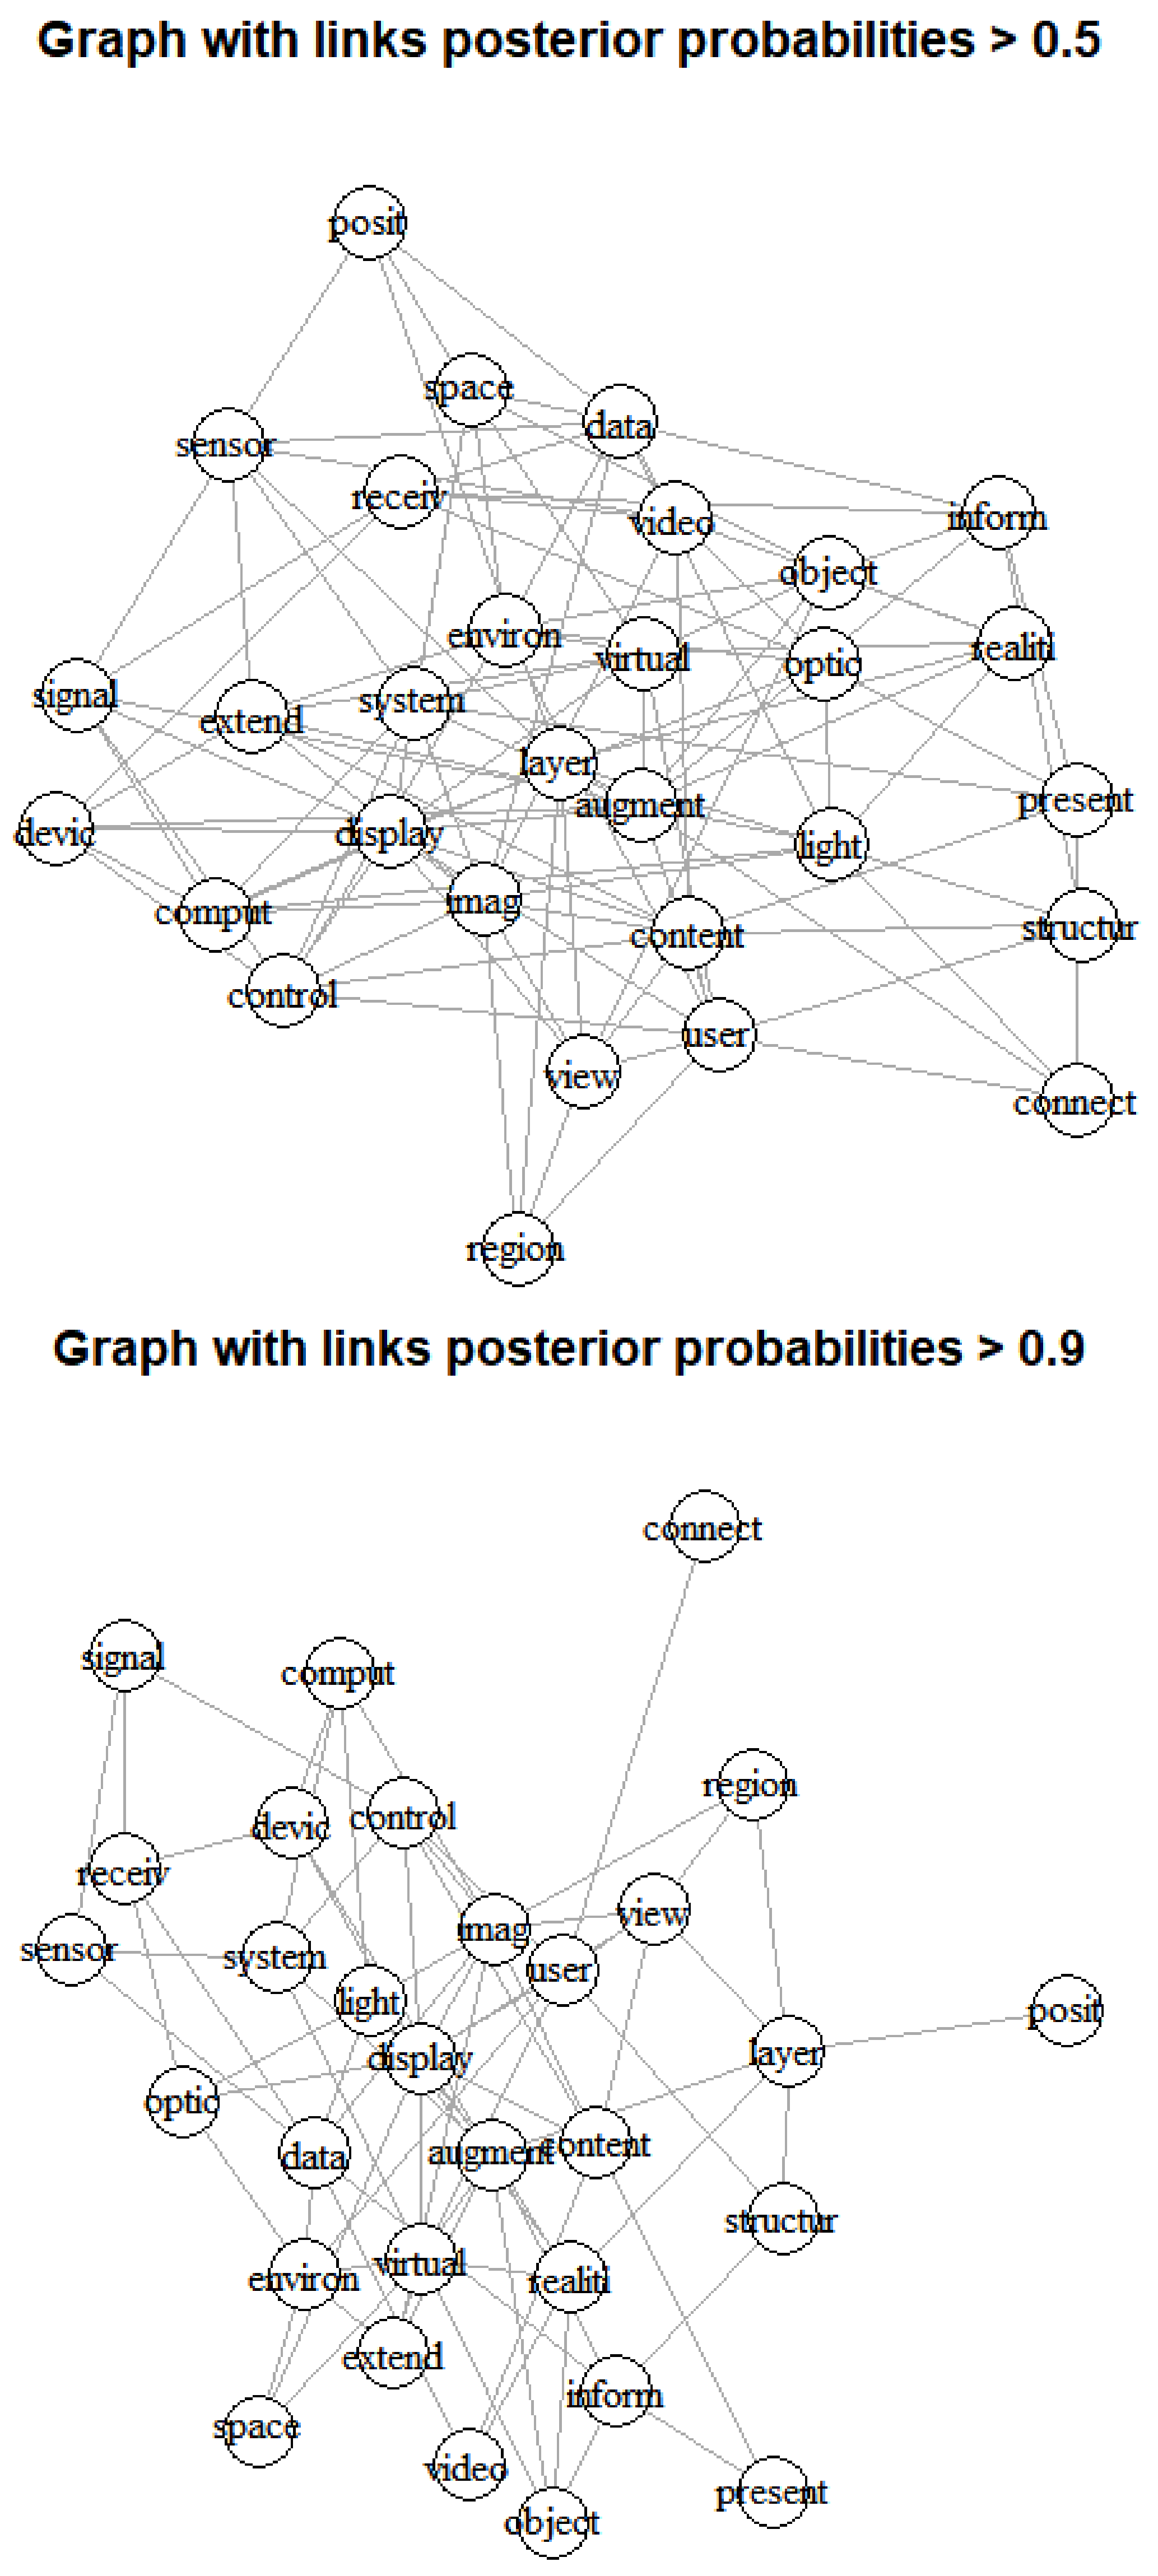
In the results of Table 4, we found that the keywords of virtual, user, space are highly ranked nodes in all two graphs. In addition, in the result with posterior probability > 0.5, the keywords, system and reality have many links after the keywords of virtual, user and space. On the other hand, the result with posterior probability > 0.9 shows that the keywords of signal and video contains many connections after the keywords of virtual, user and space. Therefore, if we consider all the keywords, we knew that the technologies based on the keywords virtual, user, space, system, reality, signal and video are the most influential technologies in XR domain. Next, Figure 4 shows the Bayesian visualization based on Gaussian inferred graph of top 30 keywords according to the posterior probabilities.
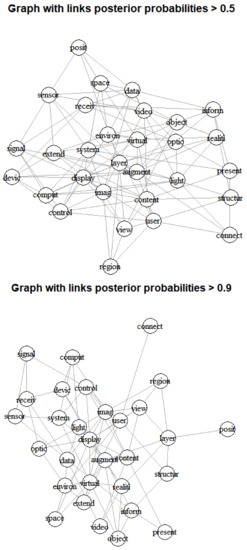
Figure 4.
Bayesian visualization based on inferred graph of top 30 keywords (top: p > 0.5, bottom: p > 0.9).
In the left graph of Figure 4, we found that the keywords of augment and content are located in center of the nodes with posterior probabilities > 0.5. In addition, we can see that the three keywords, augment, content and control are located at the center of all nodes from the right graph with posterior probability > 0.9. Table 5 illustrates the connection ranking of top 30 keywords.
Table 5.
Link ranking of top 30 keywords.
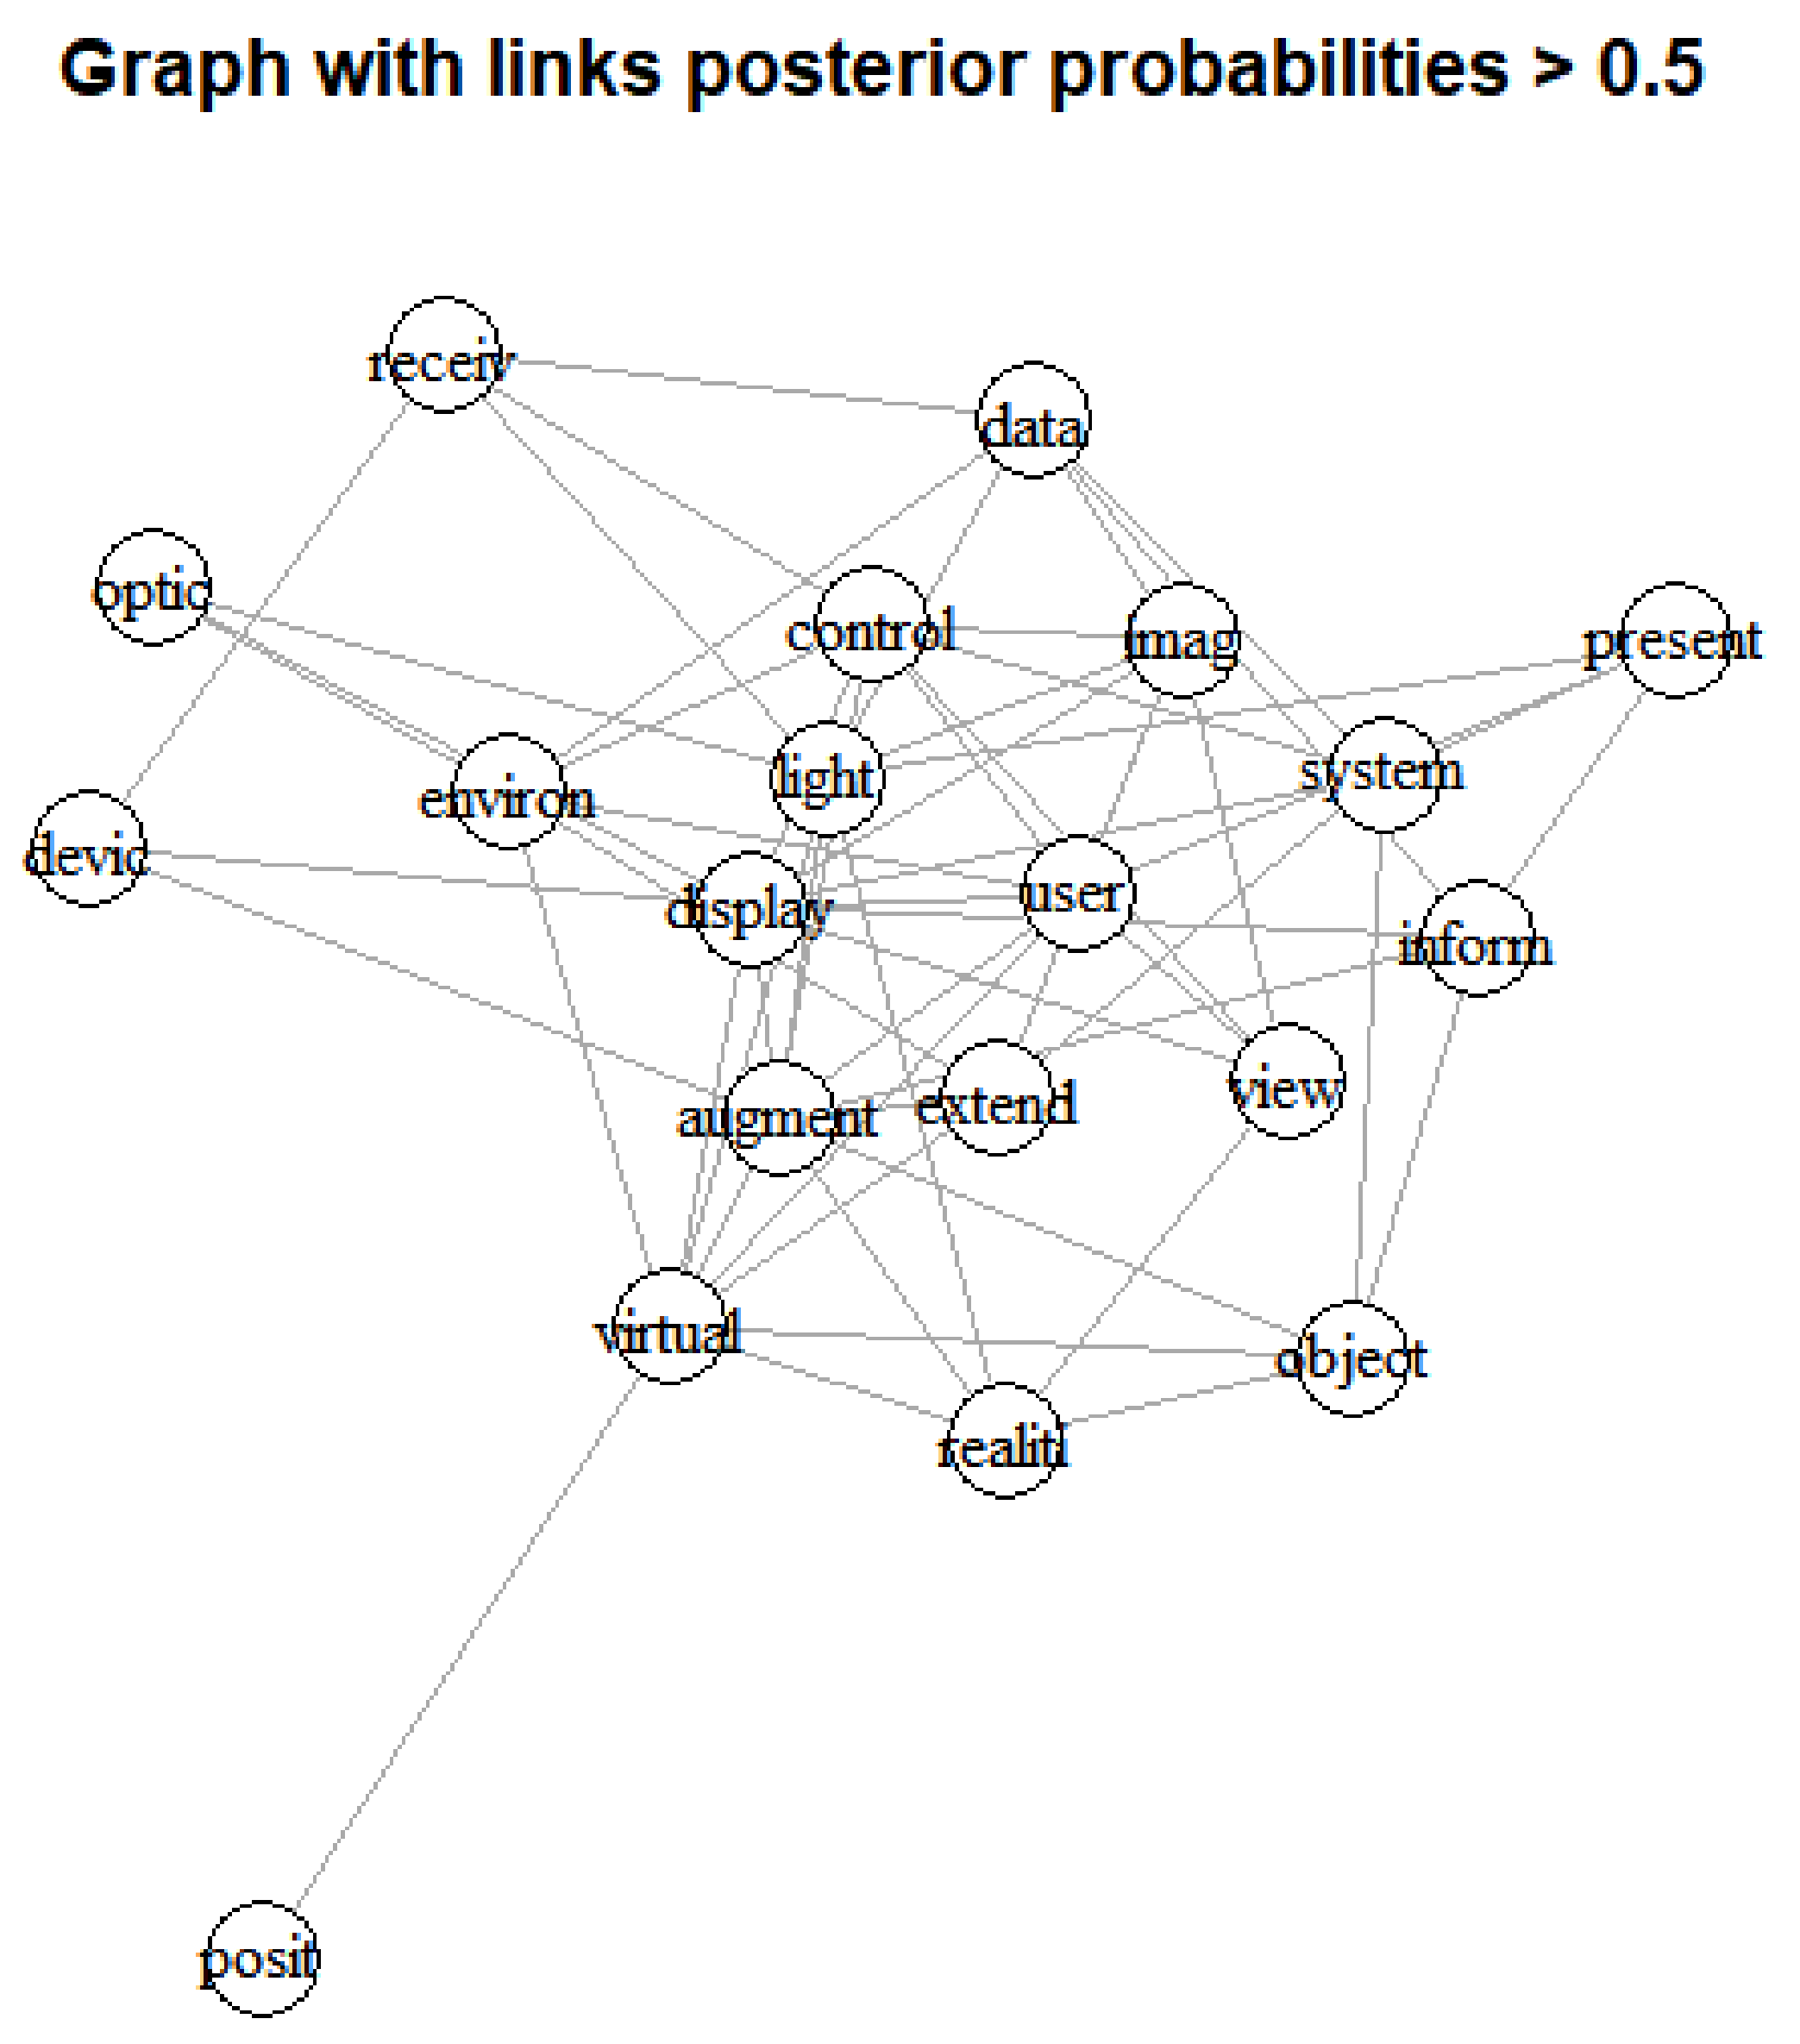
In the Bayesian visualization with low and high posterior probabilities, we can see that the keywords of user, display, image and virtual have highly ranked connections. In addition, we found that the keyword of system is meaningful in the result with posterior probability > 0.5, and data is an influential keyword in the result with posterior probability > 0.9. Next, to find the technological structure based on higher ranked keywords, we carried out Bayesian visualization using top 20 and 10 keywords related to XR technology. Figure 5 provides the Bayesian visualization results of top 20 keywords by posterior probabilities with larger than 0.5 and 0.9.
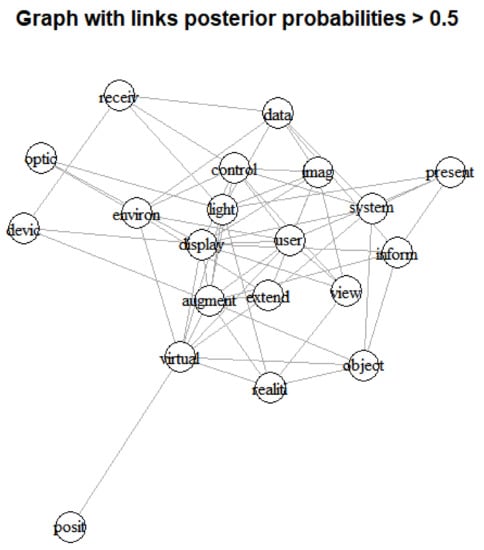
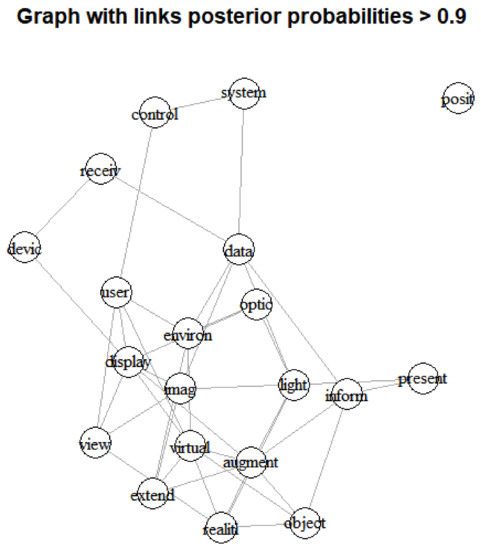
Figure 5.
Bayesian visualization based on inferred graph of top 20 keywords (top: p > 0.5, bottom: p > 0.9).
In the left graph with posterior probability > 0.5, we knew that the keywords of augment, light and control are on the central area, and connect to many nodes. The keywords of augment, environment and light are located at the central in the right graph with posterior probability > 0.9. We represent the link ranking of top 20 keywords in Table 6.
Table 6.
Link ranking of top 20 keywords.
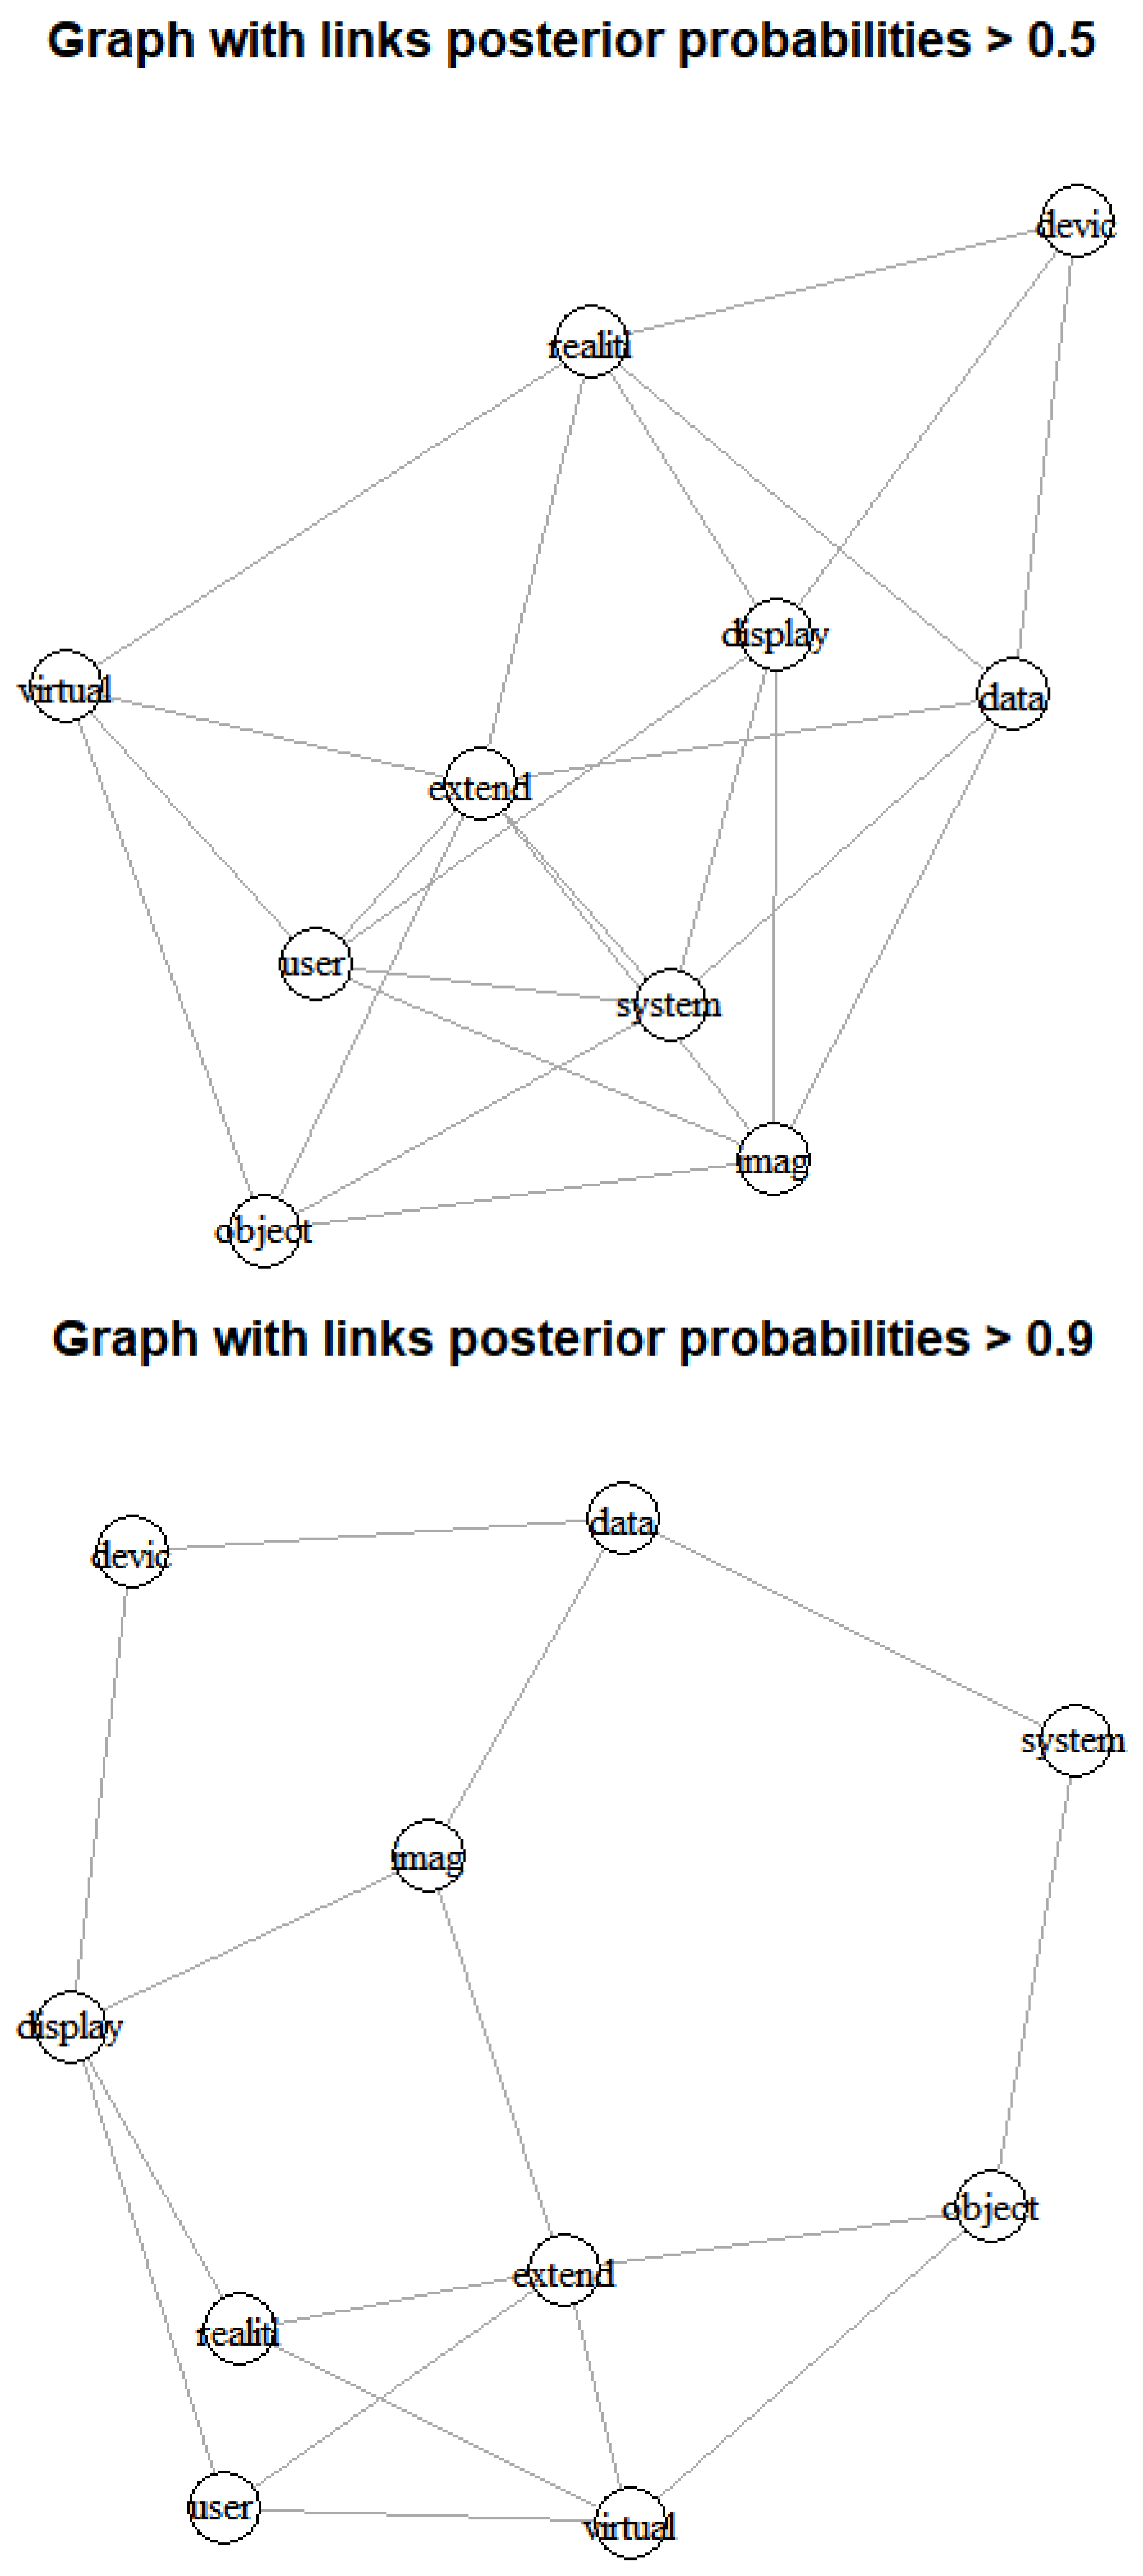
The keywords of virtual, user, display and image are located in the central of left and right graphs at the same time. Furthermore, the system is the keyword with more links than other nodes in the left graph, and the reality is the keyword with more connections than others in the right graph. Lastly, we performed the Bayesian visualization using top 10 keywords for XR technology in Figure 6.
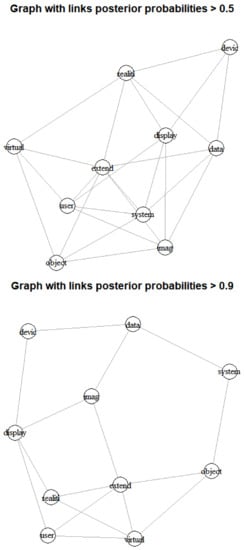
Figure 6.
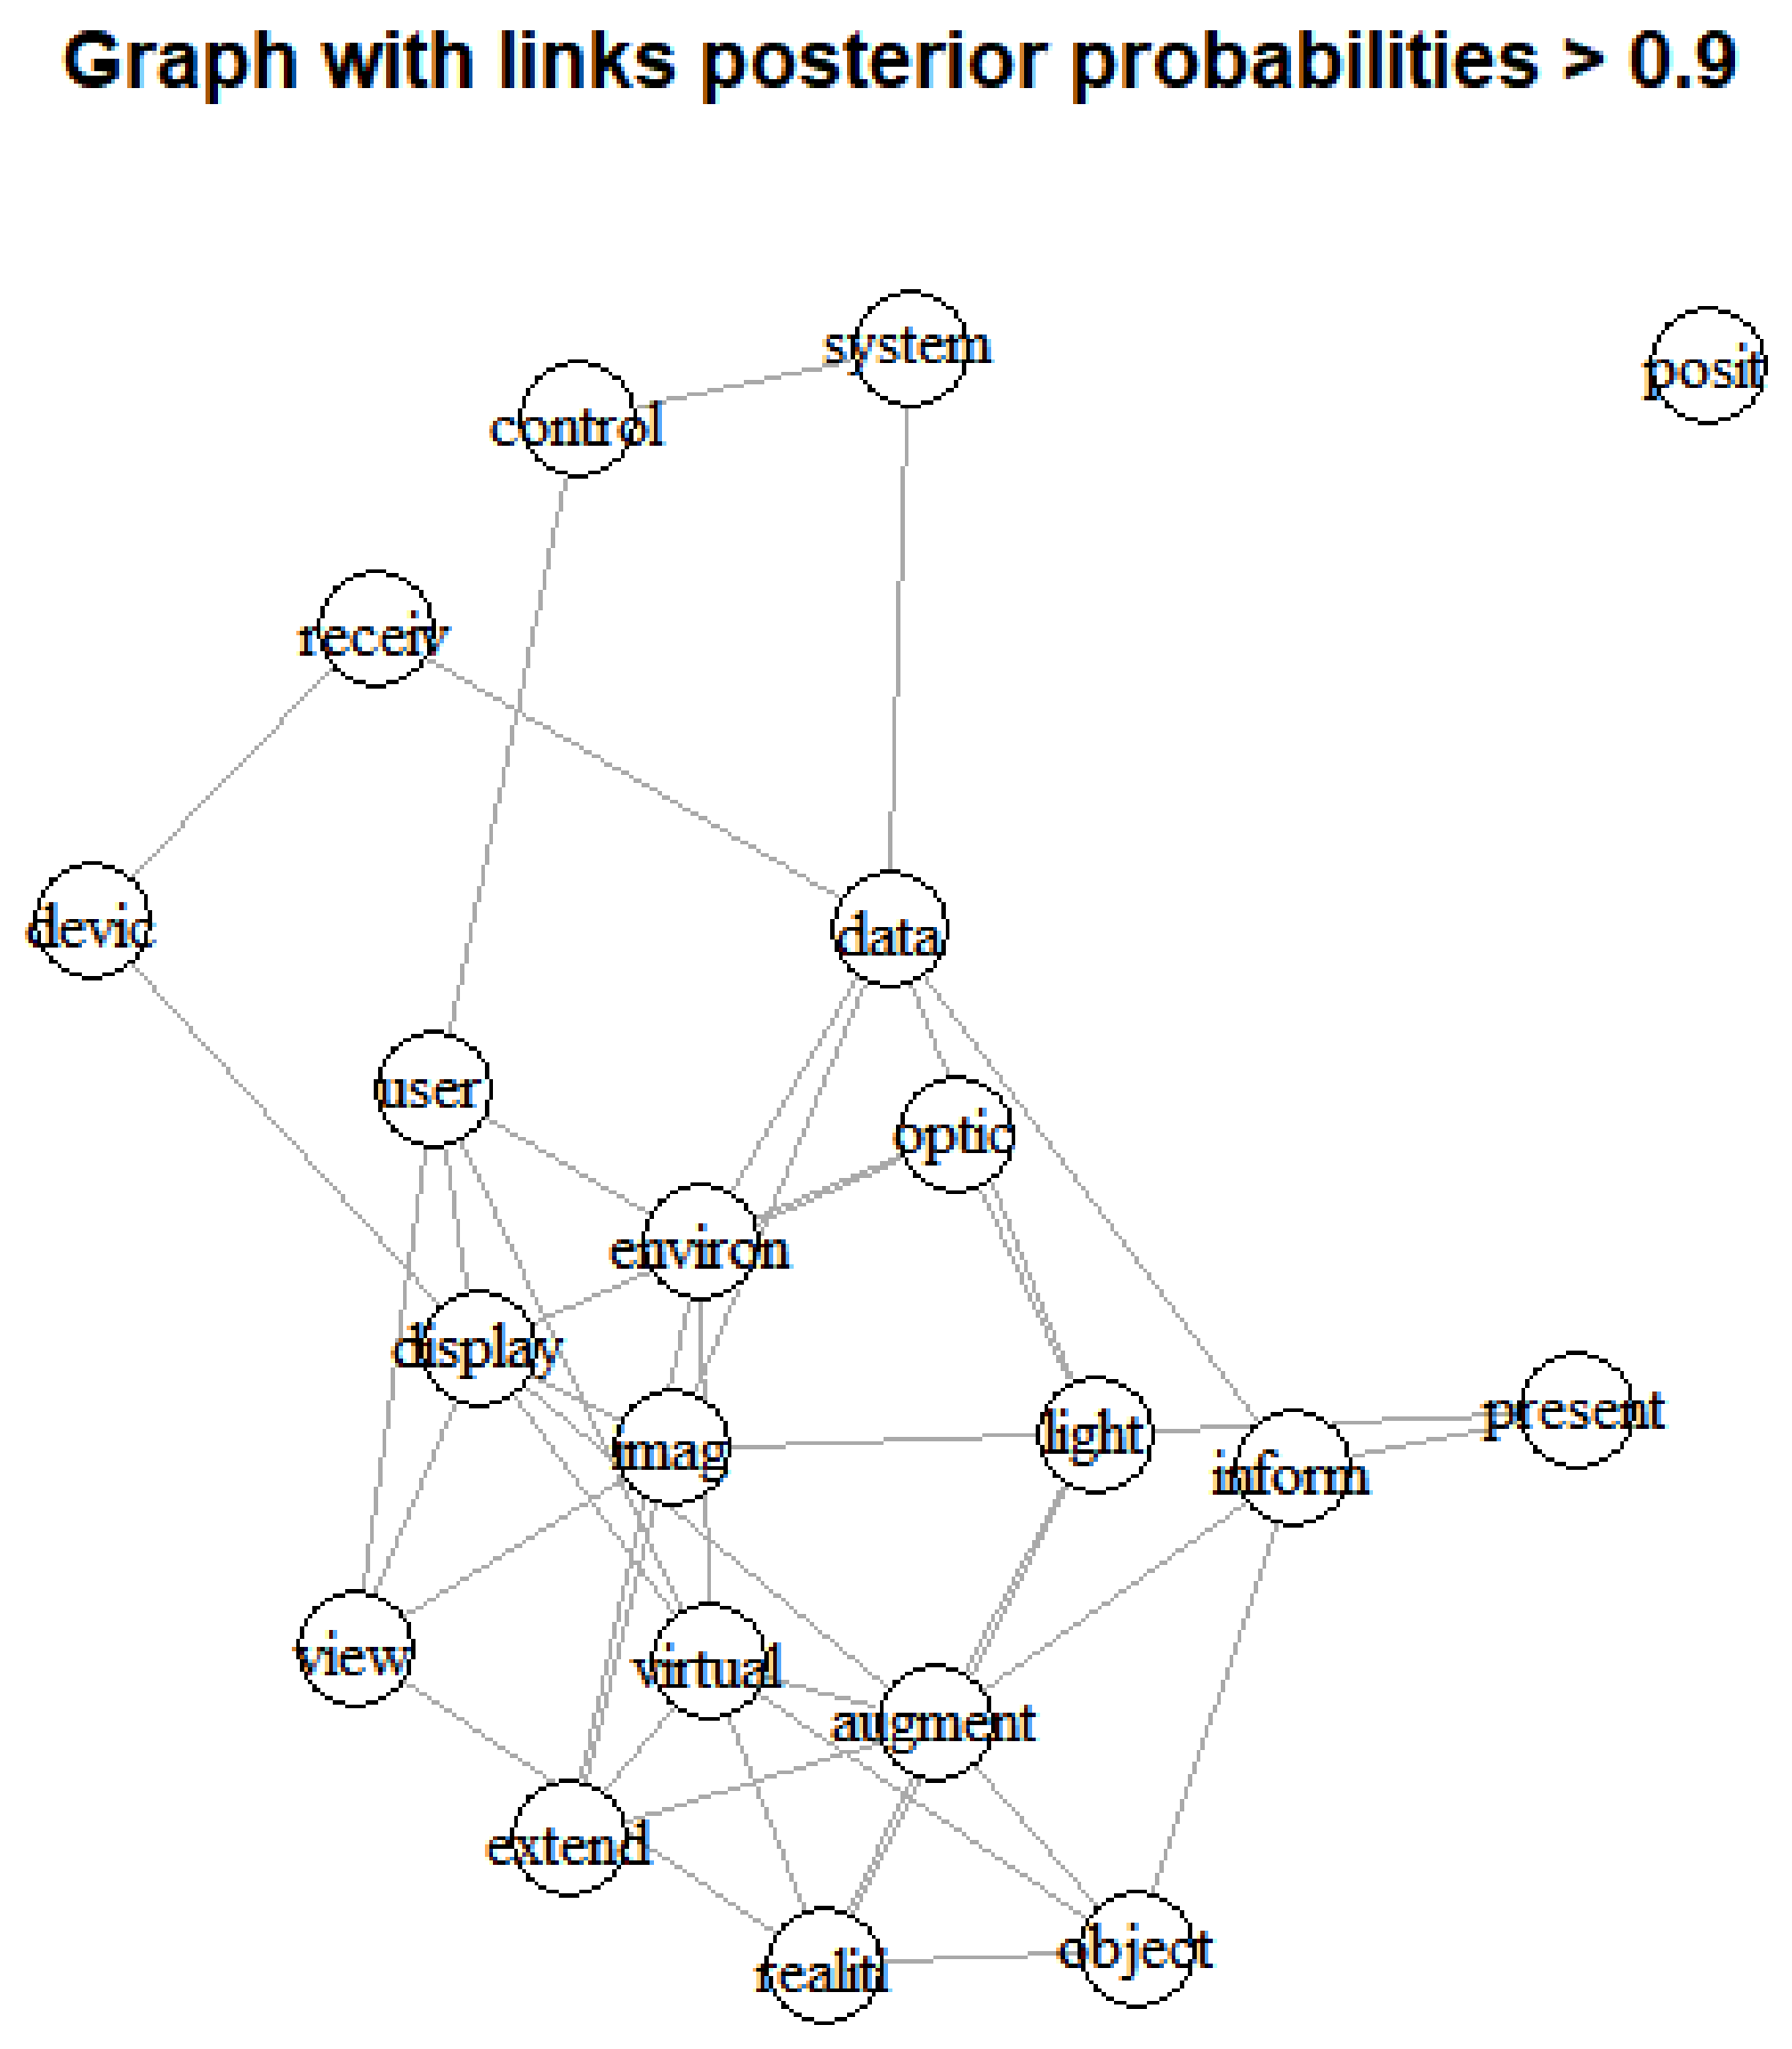
Bayesian visualization based on inferred graph of top 10 keywords (top: p > 0.5, bottom: p > 0.9).
We found that the keywords of extend, data and reality are located at the center in the left graph, and the extend is the central keyword of the right graph. Table 7 shows link ranking of top 10 keywords by posterior probabilities of 0.5 and 0.9.
Table 7.
Link ranking of top 10 keywords.
In the two results, we found that the keywords of system, virtual, device and user are representative to XR technology. In addition, we knew the image is another meaningful keyword in the result with posterior probability > 0.5, and the keyword of display is an influential keyword on the result with posterior probability > 0.9. In this paper, we selected top five ranked keywords from the previous results as follows.
In Table 8, we illustrate the important keywords according to the number of selected keywords and the posterior probabilities of Bayesian structure learning and visualization. We found the most pivot keywords for XR technology are virtual and user. So, firstly we need to consider and develop the technologies based on virtual and user. In other words, we should develop XR technology while prioritizing the user’s aspect in the virtual reality environment. Next, it is necessary to develop technologies related to visual systems and signal devices in the XR environment. Finally, we can see that it is necessary to understand the processing and analysis technology for the enormous amount of data generated in the virtual space in XR. Of course, we expect the experimental results of this paper to be used in a variety of ways by the experts of XR domains.
Table 8.
Top five keywords for XR technology.
5. Discussion
In this paper, we showed two studies. Firstly, we proposed a novel method for technology analysis. We applied Bayesian structure learning to our proposed method of patent document analysis. This is not Bayesian networks. Bayesian networks is a graphical model based on conditional probability. This model is a popular approach to extract the dependencies between nodes (patent keywords). So, in our previous research, we used Bayesian networks to analyze the patent keyword analysis for technology analysis in disaster artificial intelligence field [21]. In addition, we found there is the sparsity problem in patent data analysis, that is, most of elements of patent-keyword matrix (structured patent data) are zero values. The Bayesian network model also did not solve this problem. This is because, in order to compute conditional probabilities in Bayesian networks, the most complete data structure is required. To overcome the sparseness occurred in patent data analysis, we propose an analytical method of patent data in this paper. Compared to the Bayesian networks using Markov chain, the Bayesian structure learning model in this paper tried to solve the sparsity problem using G-Wishart probability distribution for prior distribution in exponential family likelihood.
Next, we analyzed the patent documents related to XR technology using the proposed method. This is because this technology can be used very influentially in various fields of our society. In this paper, we have visualized and presented the relations between various technology keywords constituting XR technology. Using this result, the practitioners dealing with XR technology will be able to use it in various ways in their works such as R&D planning for XR technology.
6. Conclusions
We studied on a patent analysis method for XR technology analysis. XR technology have influenced on diverse fields in our society. So, we need to understand this technology. In this paper, we collected the patent documents related to XR technology and analyzed them to build technological structure of XR domain. To analyze the patent documents by statistics and machine learning algorithms, we have to preprocess the documents to make structured data which is a matrix of patents and keywords for rows and columns, respectively, because the analytical methods of statistical machine learning require structured data type for data analysis. Each element of this matrix represents occurred frequency of each keyword in a patent document. In this procedure, we encountered data sparsity problem that most elements of the matrix are zero values. However, this assumption has to be satisfied in order for us to use most statistical machine learning methods. To solve this problem, we proposed a technology analysis method using Bayesian structured learning and Gaussian graphical models for visualization of XR technological keywords. In the experimental results, we provided various results of XR patent analysis according to the technological keywords of XR. From the results, we found that the technologies related to user interface, visual systems, signal devices, virtual space and XR data analysis. Of course, our research results could be used in various ways by the experts of XR fields. Furthermore, our proposed method could be applied to a variety of other technology fields such as artificial intelligence, smart phones, self-driving cars and internet of things.
The Bayesian networks model is a directed acyclic graph (DAG) based on conditional independences of all variables (patent keywords) using Markov property. In comparison, our proposed model is based on Bayesian structured learning using prior, likelihood and posterior distributions. In addition, we used the G-Wishart probability distribution as a prior distribution in the Bayesian structure learning. In the sparsity of patent data analysis, this is more robust than the Bayesian networks. Due to the sparseness problem of the preprocessed patent document data, the Bayesian networks have difficulties in obtaining conditional probabilities between nodes (variables), but the Bayesian structure learning model solves this problem by defining the prior distribution for the sparse data. We are not the experts of XR technology and have studied on patent analysis modeling in diverse technology fields such as artificial intelligence, big data, three-dimensional printing, etc. In this paper, we chose the keywords of XR technology from the papers, articles, books and experts related to XR. So, we conducted the XR technology analysis using the keywords from a macro perspective. It is the responsibility of the XR experts to apply the results of this paper to the actual works related to XR. In our future works, we will study on more advanced method to overcome the obstacles arising in patent technology analysis such as the sparsity apply the method to XR technology analysis for more understanding this technology.
Author Contributions
S.J. designed this study and collected the data for the experiment. S.P. preprocessed the data and selected valid patents and analyzed the data to show the performance of the study. S.C. wrote the paper and carried out all the research steps. All authors have read and agreed to the published version of the manuscript.
Funding
This research was supported by Basic Science Research Program through the National Research Foundation of Korea (NRF) funded by the Ministry of Education (NRF-2020R1I1A3A04037885).
Acknowledgments
We thank anonymous reviewers for valuable suggestions and comments.
Conflicts of Interest
The authors declare no conflict of interest.
References
- Liubogoshchev, M.; Ragimova, K.; Lyakhov, A.; Tang, S.; Khorov, E. Adaptive Cloud-Based Extended Reality: Modeling and Optimization. IEEE Access 2021, 9. [Google Scholar] [CrossRef]
- Railean, E.A.; Valeyeva, N.S.; Kupriyanov, R.V. Psychological Pedagogy for Extended Reality in STEMx Education. IEEE Explor. 2020, 976–979. [Google Scholar] [CrossRef]
- Heirman, J.; Selleri, S.; Vleeschauwer, T.D.; Hamesse, C.; Bellemans, M.; Schoofs, E.; Haelterman, R. Exploring the possibilities of Extended Reality in the world of firefighting. In Proceedings of the 2020 IEEE International Conference on Artificial Intelligence and Virtual Reality (AIVR), Utrecht, The Netherlands, 14–18 December 2020; pp. 266–273. [Google Scholar]
- Silva, M.; Teixeira, L. Developing an eXtended Reality platform for Immersive and Interactive Experiences for Cultural Herit-age: Serralves Museum and Coa Archeologic Park. In Proceedings of the 2020 IEEE International Symposium on Mixed and Augmented Reality Adjunct (ISMAR-Adjunct), Recife, Brazil, 9–13 November 2020; pp. 300–302. [Google Scholar]
- Gong, L.; Fast-Berglund, A.; Johansson, B. A Framework for Extended Reality System Development in Manufacturing. IEEE Access 2021, 9, 24796–24813. [Google Scholar] [CrossRef]
- Turchet, L.; Hamilton, R.; Camci, A. Music in Extended Realities. IEEE Access 2021, 9, 15810–15832. [Google Scholar] [CrossRef]
- Jun, S. Technology Integration and Analysis Using Boosting and Ensemble. J. Open Innov. Technol. Mark. Complex. 2021, 7, 27. [Google Scholar] [CrossRef]
- Uhm, D.; Ryu, J.-B.; Jun, S. Patent Data Analysis of Artificial Intelligence Using Bayesian Interval Estimation. Appl. Sci. 2020, 10, 570. [Google Scholar] [CrossRef] [Green Version]
- Kim, J.-M.; Sun, B.; Jun, S. Sustainable Technology Analysis Using Data Envelopment Analysis and State Space Models. Sustainability 2019, 11, 3597. [Google Scholar] [CrossRef] [Green Version]
- Kim, J.-M.; Kim, N.-K.; Jung, Y.; Jun, S. Patent data analysis using functional count data model. Soft Comput. 2018, 23, 8815–8826. [Google Scholar] [CrossRef]
- Jun, S. Bayesian Count Data Modeling for Finding Technological Sustainability. Sustainability 2018, 10, 3220. [Google Scholar] [CrossRef] [Green Version]
- Hunt, D.; Nguyen, L.; Rodgers, M. Patent Searching Tools & Techniques; Wiley: Hoboken, NJ, USA, 2007. [Google Scholar]
- Feng, X.; Fuhai, L. Patent text mining and informetric-based patent technology morphological analysis: An empirical study. Technol. Anal. Strat. Manag. 2012, 24, 467–479. [Google Scholar] [CrossRef]
- Kim, S.; Yoon, B. Patent infringement analysis using a text mining technique based on SAO structure. Comput. Ind. 2021, 125, 103379. [Google Scholar] [CrossRef]
- Khachatryan, D.; Muehlmann, B. Measuring the drafting alignment of patent documents using text mining. PLoS ONE 2020, 15, e0234618. [Google Scholar] [CrossRef] [PubMed]
- Zhou, X.; Huang, L.; Zhang, Y.; Yu, M. A hybrid approach to detecting technological recombination based on text mining and patent network analysis. Scientometrics 2019, 121, 699–737. [Google Scholar] [CrossRef]
- Jun, S.; Park, S.; Jang, D. Document Clustering Method Using Dimension Reduction and Support Vector Clustering to Over-come Sparseness. Expert Syst. Appl. 2014, 41, 3204–3212. [Google Scholar] [CrossRef]
- Sert, O.C.; Şahin, S.D.; Özyer, T.; Alhajj, R. Analysis and prediction in sparse and high dimensional text data: The case of Dow Jones stock market. Phys. A Stat. Mech. Appl. 2020, 545, 123752. [Google Scholar] [CrossRef]
- Mohammadi, R.; Wit, E.C. BDgraph: An R Package for Bayesian Structure Learning in Graphical Models. J. Stat. Softw. 2019, 89, 1–30. [Google Scholar] [CrossRef] [Green Version]
- Murphy, K.P. Machine Learning: A Probabilistic Perspective; MIT Press: Cambridge, MA, USA, 2012. [Google Scholar]
- Park, S.; Jun, S. Patent Keyword Analysis of Disaster Artificial Intelligence Using Bayesian Network Modeling and Factor Analysis. Sustainability 2020, 12, 505. [Google Scholar] [CrossRef] [Green Version]
- Lu, S.-Y.; Shpitalni, M.; Gadh, R. Virtual and Augmented Reality Technologies for Product Realization. CIRP Ann. 1999, 48, 471–495. [Google Scholar] [CrossRef]
- Milgram, P.; Kishino, F. Taxonomy of mixed reality visual displays. IEICE Transact. Inf. Syst. 1994, E77-D, 1321–1329. [Google Scholar]
- KIPRIS. Korea Intellectual Property Rights Information Service. Available online: http://www.kipris.or.kr (accessed on 15 January 2021).
- USPTO. The United States Patent and Trademark Office. Available online: http://www.uspto.gov (accessed on 15 January 2021).
- Mohammadi, A.; Wit, E.C. Bayesian Structure Learning in Sparse Gaussian Graphical Models. Bayes. Anal. 2015, 10, 109–138. [Google Scholar] [CrossRef]
- Wang, H.; Li, S.Z. Efficient Gaussian graphical model determination under G-Wishart prior distributions. Electron. J. Stat. 2012, 6, 168–198. [Google Scholar] [CrossRef]
- Hanusz, Z.; Tarasińska, J. Normalization of the Kolmogorov–Smirnov and Shapiro–Wilk tests of normality. Biometr. Lett. 2015, 52, 85–93. [Google Scholar] [CrossRef] [Green Version]
- Aslam, M. Analysing Gray Cast Iron Data using a New Shapiro-Wilks test for Normality under Indeterminacy. Int. J. Cast Met. Res. 2020, 34, 1–5. [Google Scholar] [CrossRef]
Publisher’s Note: MDPI stays neutral with regard to jurisdictional claims in published maps and institutional affiliations. |
© 2021 by the authors. Licensee MDPI, Basel, Switzerland. This article is an open access article distributed under the terms and conditions of the Creative Commons Attribution (CC BY) license (https://creativecommons.org/licenses/by/4.0/).