Article

Acrylonitrile Process Enhancement through Waste Minimization: Effect of Reaction Conditions and Degree of Backmixing

by
Ibrahim M. Abu Reesh
Department of Chemical Engineering, College of Engineering, Qatar University, Doha P.O. Box 2713, Qatar
Sustainability 2021, 13(14), 7923; https://doi.org/10.3390/su13147923
Submission received: 10 June 2021 / Revised: 7 July 2021 / Accepted: 12 July 2021 / Published: 15 July 2021
(This article belongs to the Special Issue Sustainable and Clean Chemical Engineering Technologies)

Abstract

:
Waste minimization in reactor design is an effective approach for pollution control, when compared to the traditional practice of the end-of-pipe treatment. Reactor degree of backmixing and operating conditions are important factors that determine the performance of chemical process, including environmental impact. For the purpose of waste minimization, two modeling methods were used for simulating the performance of the acrylonitrile production reactor, based on the ammoxidation of propylene. The effect of residence time, temperature, degree of backmixing on the steady-state propylene conversion, and production of waste were determined. The tanks-in-series model and the axial dispersion model were used to account for the degree of backmixing. The two main by-products in the acrylonitrile process are acetonitrile and hydrogen cyanide, which are both highly toxic waste. Extensive reactor backmixing reduces propylene conversion, especially at high temperature and residence time. Minimum acetonitrile production is favored by low residence time, high to moderate temperature, and no backmixing. Minimum hydrogen cyanide production is favored by low residence time, low temperature, and no backmixing. At 450 °C, the percentage of increase in the selectivity of acrylonitrile, with respect to hydrogen cyanide at plug-flow reactor conditions, as compared to a continuous stirred tank reactor, is 87.1, 74.3, 50.9, 30.4, and 12.4% at a residence time of 1, 2, 4, 6, and 8 s, respectively. The reactor degree of backmixing and operating conditions are important factors that affect the environmental friendliness of the acrylonitrile production process.

1. Introduction

In the past, the approach to chemical reactor design had been to achieve high yield at low cost. Impact of the chemical process on the environment was rarely considered. Recent trend is to include environmental factor in the design in addition to minimize the cost of the process. Waste source reduction, also known as waste prevention, is to prevent waste from occurring in the first place, rather than treating produced waste using the end-of-pipe treatment. It was found that it is possible to decrease the production of waste in a chemical process via modifications of the design conditions. Li et al. [1] reported a decrease in waste discharge by 80% in the production of dimethyl dichlorosilene by modifying the production process. In addition to process modification (to reduce waste production), recycling is another strategy to minimize waste and increase the efficiency of the process [2]. Sepiacci et al. [3] applied a waste reduction (WAR) algorithm to determine plant design’s environmental impact, in regard to chemical processing. The aim of WAR is to reduce environmental impact during the design stage of chemical processing. Recently, total conversion of hazardous aluminum waste into zeolite (zero-waste) was carried out in a 200 L pilot-scale plant autoclave reactor. The process produces zeolite, ammonia, and hydrogen with no other wastes [4].
The reactor is the heart of a chemical process. Product formation, including by-product waste generation, in any chemical process originates from reaction system. Backmixing is the tendency of reacted chemicals to intermingle with unreacted feed in a reactor. Backmixing affects chemical reactor performance, determined by conversion, yield, and selectivity. Backmixing reduces the reactant concentration due to the mixing of products. Single parameter models have been used in the literature to model backmixing in chemical reactors. Both the tanks-in-series model (TISM) and the axial dispersion model (ADM) are one-parameter models; they describe reactors that are partially mixed with a finite level of mixing. The plug-flow reactor (PFR) and continuous stirred tank reactor (CSTR) are different ideal reactor models that are used to describe flow reactors. The PFR assumes no mixing, while CSTR assumes perfect mixing. No real reactor can be described by either of the two models. Most real industrial reactors exhibit a finite degree of backmixing. In general, reactor backmixing increases with reactor size [5]. Peclet number (uL/Dz) is used to characterize the ADM, as Pe decreases from to 0, the reactor flow pattern changes from no mixing (PFR, Dz = 0) to complete mixing (CSTR, Dz = ). The TISM is characterized by the number of CSTRs in series N, as N decreases from to 1, the flow pattern changes from no mixing (PFR conditions) to complete mixing (1 CSTR). In the literature, there has been no consensus in using the ADM and TISM in modeling real reactor systems. Some authors showed that the ADM describes the case of mixing well, which does not differ largely from PFR behavior [6]; others did not recommend using ADM for Pe values of less than 10, they recommend using TISM in this range (Pe < 0) [7]. Alvare and Al-Dahhan [8] suggested using TISM to describe backmixing in trayed bubble column reactors, using experimental tracer study. Compared to ADM, the TISM was found to be more realistic and advantageous for simulating Fischer–Tropsch slurry bubble column reactors [9]. In their design of batch reactors for the production of allyl chloride, Chen and Feng [10] included environmental impact parameters and potential environmental impact (PEI) to simulate the effect of reaction conditions, backmixing, mass, and heat transfer on the environmental performance of the process. The use of PFR would decrease the PEI generation rate, compared to CSTR (high backmixing), which increases the emission of the PEI of the process. Other researchers have also emphasized the importance of design, research, and developmental stages in the minimization of the environmental impact of the chemical process [11]. Reactor type, size, and reactant concentration are important parameters that determine the greenness of the chemical process, since all products, including waste, are traced back to the reaction system [12].
Production of acrylonitrile via the ammoxidation of propylene process (SOHIO) was first discovered by Standard Oil of Ohio in 1957. This highly exothermic process uses a fluidized bed reactor containing a catalyst, a mixture of metal oxides. The SOHIO process is characterized as a large water consumer (especially in separation) as well as a large wastewater producer. This is reflected in the elevated wastewater treatment and energy cost of this process. The two main pollutants in the SOHIO process are acetonitrile and hydrogen cyanide. The typical production rate of these pollutants are 0.02 to 0.11 and 0.15 to 0.2 kg/kg acrylonitrile, respectively [13]. An alternative method has been used for the production of acrylonitrile, using propane instead of propylene. Using life cycle assessment methodology showed that this method has a higher impact, in terms of climate change and fossil fuel depletion, compared to the SOHIO process [14]. Karp et al. [15] presented a process for renewable acrylonitrile production from 3-hydroxy propionic acid, which is a renewable substrate that can be produced from sugar using microbes. This process is known to have a higher yield, compared to the SOHIO process.
In a SOHIO reactor, reactants mixing with products produce undesired products, because of the overoxidation of acrylonitrile [16]. In general, most industrial large-scale reactors operate with a finite degree of backmixing that reduces the reactor performance, compared to PFR that has no backmixing. Although using a fluidized bed reactor for the production of acrylonitrile is suitable for the removal of heat released from highly exothermic reaction, this reactor suffers from the severe backmixing of gas and solid phases [16]. This problem can be reduced by inserting horizontal baffles to approach PFR [17]. Several mathematical models have been used to describe a fluidized bed reactor as PFR for both gas and solid phases [18]. Weiss et al. [19] simulated a fluidized bed reactor as 11 CSTRs, connected in series for both solid and gas phases. Later, [20] described fluidized bed reactor as CSTR and PFR for gas and solid phases, respectively. Using sensitivity analysis, Shadiya et al. [21] showed that PFR is the optimal reactor scheme for the acrylonitrile process, compared to CSTR scheme. The optimal scheme is the one that has better economy, higher conversion, higher acrylonitrile production, and less waste production.
The main goal of this work is to determine the effect of reaction conditions and backmixing on the acrylonitrile reactor performance. The effects of reactor temperature, residence time, and backmixing on reactor performance were determined. The performance of the reactor is described by propylene conversion and environmental factors (minimum waste or maximum selectivity). The ADM and TISM were used to simulate reactor backmixing. Predictions of the two models were compared at different levels of backmixing. Operating conditions that produce minimum waste in the acrylonitrile reactor were also determined.

1.1. Acrylonitrile Process

Acrylonitrile has a sharp, irritating odor and colorless liquid. It is used in the production of polymers, such as plastic, rubber, nylon, acrylic fiber, adiponitrile, and acrylamide [13]. The global acrylonitrile market is valued at 11.38 billion $ in 2020 and is expected to reach 13.18 billion $ by end of the year 2026 [22]. Acrylonitrile is mainly produced via the catalytic oxidation of ammonia and propylene in gas phase (SOHIO process). The catalyst used is mixed metal oxides. The main reaction is as follows:
C H 2 = C H C H 3 + N H 3 + 1.5   O 2 C H 2 = C H C N + 3 H 2 O + 515   kJ
Another five-sided reaction takes place (Scheme 1). In addition to the main product (acrylonitrile), several other toxic waste and by-products are produced, such as acetonitrile, acrolein, hydrogen cyanide, carbon dioxide, and carbon monoxide.

1.2. Kinetic Data

The reaction rate equation of propylene, oxygen, and ammonia is a first order, with respect to propylene, and zero order, with respect to ammonia and oxygen when they are provided in their stoichiometric quantities. These kinetics are widely used in the literature [24,25]. The rate equations for all the side reactions, with respect to propylene, are first order (acrolein, acrylonitrile, and acetonitrile production). The reaction rate constants at 470 °C and activation energies for reactions 1–6 are given in Table 1 [23]. The reaction rate constants at other temperatures can be calculated, given the reaction activation energy.
r 1 = k 1 C C 3 H 6 ; r 2 = k 2 C C 3 H 6 ; r 3 = k 3 C C 3 H 6 ; r 4 = k 4 C C H 2 C H C H O ; r 5 = k 5 C C H 2 C H C N ; r 6 = k 6 C C H 3 C N  

2. Model Development

The two different modeling approaches used to account for acrylonitrile reactor backmixing are A D M and T I S M :

2.1. Axial Dispersion Model ( A D M )

Consider an acrylonitrile reactor of length L and fluid velocity u. With axial dispersion model assumptions, the balance of species i at steady-state is given by:
D z u   d 2 C i d z 2 d C i d z + r i u = 0   i = A , B , C , D , E
where z is the flow longitudinal direction, D z is the dispersion coefficient, and ri is the reaction rate, with respect to species i. Danckwerts’ [26] boundary conditions require the continuity of flux at z = 0 and z = L.
z = 0   C i = C i o + D z u   d C i d Z  
  z = L   d C i d Z = 0  
The net rate of the equations for the species A, B, C, D, E are:
r A = ( k 1 + k 2 + k 3 )   C A
r B = k 1 C A + k 4 C C k 5 C B
r c = k 2 C A k 4 C C
  r D = k 3 C A k 6 C D
r E = k 5 C B + k 6 C D
Substituting Equations (6)–(10) in Equation (3) using dimensionless variables, the obtained equations, with the boundary conditions, are shown in Table 2.
where   λ = Z L   ,   y i = C i C A o   ,   P e = u   L D z   ,   τ = L u
Table 2. The A D M dimensionless differential equations with boundary conditions.
BoundaryConditions
SpeciesDifferential Equationλ = 0λ = 1
A (propylene) 1 P e d 2 y A d λ 2 d y A d λ τ ( k 1 + k 2 + k 3 ) y A = 0   (12) y A = 1 + 1 P e d y A d λ d y A d λ = 0
B (acrylonitrile) 1 P e d 2 y B d λ 2 d y B d λ + τ ( k 1 y A + k 4 y C k 5 y B ) = 0   (13) y B = 1 P e d y B d λ d y B d λ = 0
C (acrolein) 1 P e d 2 y C d λ 2 d y C d λ + τ ( k 2 y A k 4 y C ) = 0   (14) y C = 1 P e d y C d λ d y C d λ = 0
D (acetonitrile)   1 P e d 2 y D d λ 2 d y D d λ + τ ( k 3 y A k 6 y D ) = 0   (15) y D = 1 P e d y D d λ d y D d λ = 0
E (HCN) 1 P e d 2 y E d λ 2 d y E d λ + τ ( k 5 y B + k 6 y D ) = 0   (16) y E = 1 P e d y E d λ d y E d λ = 0
As seen in the above equations, the A D M lumps all mechanisms of mixing into one parameter, which is Pe number or the dispersion coefficient, D z . Solution of the above 5 s order differential equations (Equations (12)–(16)), with boundary conditions, can be achieved by converting each equation into two first-order differential equations. The result is 10 first-order differential equations, with 10 boundary conditions. The commercially available package Matlab function bvp4c was used to solve the obtained differential equations [27]. The bvp4c solver uses finite differences. The solution starts with an initial guess that is provided. The “bvp4c” function syntax command line is written in the form:
sol = bvp4c(@odefun, @bcfun, solinit, options). Where odefun = a function that determines the differential equations, bcfun = a function determines the boundary conditions residual, solinit = contains the initial guess of the solution, and options = optional parameters that change the default integration properties. The Matlab function, bvp4c, showed to be very efficient in solving a system of second-order differential equations with boundary conditions.

2.2. Tanks-in-Series Model ( T I S M )

Consider N   C S T R s , in a series of equal size (i.e equal residence time). Material balance of species i over the jth reactor at steady-state gives:
τ i j 1 = C i j 1 C i j r i j   i = A , B , C , D , E         j = 1 , 2 , N  
Substitute the rate Equations (6)–(10) in Equation (17) for the species A , B , C , D , a n d   E . Using dimensionless concentrations, the obtained material balance equations are given in Table 3, with the feed composition for the first reactor. The dimensionless concentration of each species can be found if the number of reactors and residence time in each reactor are known. The exit concentration can be obtained starting with species equation that has one unknown variable.
Table 3. Dimensionless concentration of species A ,   B ,   C ,   D ,   a n d   E in reactor j (TISM), with feed composition of the first reactor.
SpeciesMaterial Balance Equation around Reactor jReactor Feed Condition
A (propylene) y A j = y A j 1 1 + τ j ( k 1 + k 2 + k 3 )   (18)yAo = 1
B (acrylonitrile) y B j = y B j 1 + τ j ( k 1   y A j + k 4   y C j ) 1 + τ j k 5   (19)yBo = 1
C (acrolein) y C j = y C j 1 + τ j   k 2   y A j 1 + τ j k 4   (20)yCo = 1
D (acetonitrile) y D j = y D j 1 + τ j   k 3   y A j 1 + τ j k 6   (21)yDo = 1
E (HCN)   y E j =   y E j 1 + τ j ( k 5 y B j + k 6 y D j )   (22)yEo = 1

2.3. Reactor Performance

The reactor performance is measured by two criteria, the propylene conversion ( X ) and selectivity S (the ratio of desired to undesired product). The amount of acrolein production is very small and will not be considered in this study. The two selectivities determined are acrylonitrile selectivity, with respect to acetonitrile S A C / A C N , and acrylonitrile selectivity, with respect to hydrogen cyanide ( S A C / H C N ). Table 4 shows how the above two criteria are calculated using the A D M and T I S M .

2.4. Comparison between A D M and T I S M

Comparing the variances of the T I S M and A D M leads to a relation between N and Pe [28]. For slight deviations from P F R , the Pe number is equal to 2N. The equation, P e = 2 ( N 1 ) was used to describe the whole range of dispersion. In this study, the parameters of the two models are related by the equation, P e = 2 ( N 1 ) . A good agreement between P F R and T I S M was found in the literature for first-order, first-order successive, and second-order reactions [28]. The equation ( P e = 2 ( N 1 ) ) showed to have a good theoretical basis [28]. In the literature, other researchers [29,30,31,32,33,34,35] also suggested using the same equation. For equal volume reactor systems, the relation between the residence time used in the A D M and that of T I S M is given by:
τ A D M = N   τ T I S M  

3. Results and Discussions

As shown in the previous equations for A D M and T I S M , the acrylonitrile reactor performance (as determined by propylene conversion and selectivity) depends on residence time, temperature, and the intensity of reactor backmixing. In this work, the performance of the acrylonitrile reactor was simulated to cover the a range of operating conditions of the SOHIO process (i.e fluidized bed reactor with some degree of backmixing, temperature 350–550 °C, and up to 10 s residence time) [21].

3.1. Propylene Conversion

Figure 1 shows that propylene conversion increases with increasing reactor temperature ( τ of 2 s). Increasing temperature increases the reaction rate constant and reaction rate, therefore leading to conversion increase. Figure 1 also shows that increasing backmixing (decreasing Pe) reduces the conversion and P F R (no backmixing) achieves higher conversion, while C S T R (complete mixing) has lower conversion. It is also clear from Figure 1 that backmixing is more important at high temperatures, while at low temperatures, the degree of backmixing has almost no effect on conversion.
Figure 2 displays the effect of residence time on reactor conversion (temperature of 450 °C). Higher conversion is achieved at higher residence time. In Figure 2, the effect of backmixing is the same as in Figure 1, conversion is reduced by increasing reactor backmixing. Also in Figure 2, it is clear that the backmixing effect on conversion is more important at high residence time and also has a negligible effect on conversion at low residence time.
Figure 3 displays the effect of the degree of backmixing on propylene conversion, using A D M for temperatures ranging from 400 to 550 °C and a constant residence time of 2 s. In this figure, increasing temperature increases the propylene conversion. Conversion increases with decreasing backmixing (i.e., increasing Pe number). The effect of backmixing is more significant at higher temperatures. For Pe ≥ 1000 (close to P F R conditions) and Pe ≤ 0.01 (close to C S T R conditions), the conversion is almost constant and marginally changes with Pe. For the range of Pe (0.01–1000), the conversion changes significantly with Pe. In this region, the effect of the Pe number on conversion is important at high temperatures. For example, the increase in conversion of P F R (Pe ≥ 1000), as compared to C S T R (Pe ≤ 0.01), is 10.26, 20.6, and 29.2% at temperatures of 400, 450, and 500 °C, respectively. It is also noticed that at higher temperature such as 550 °C, the percentage of increase in the conversion of P F R conditions, as compared to C S T R conditions, decreases to 26.86%.
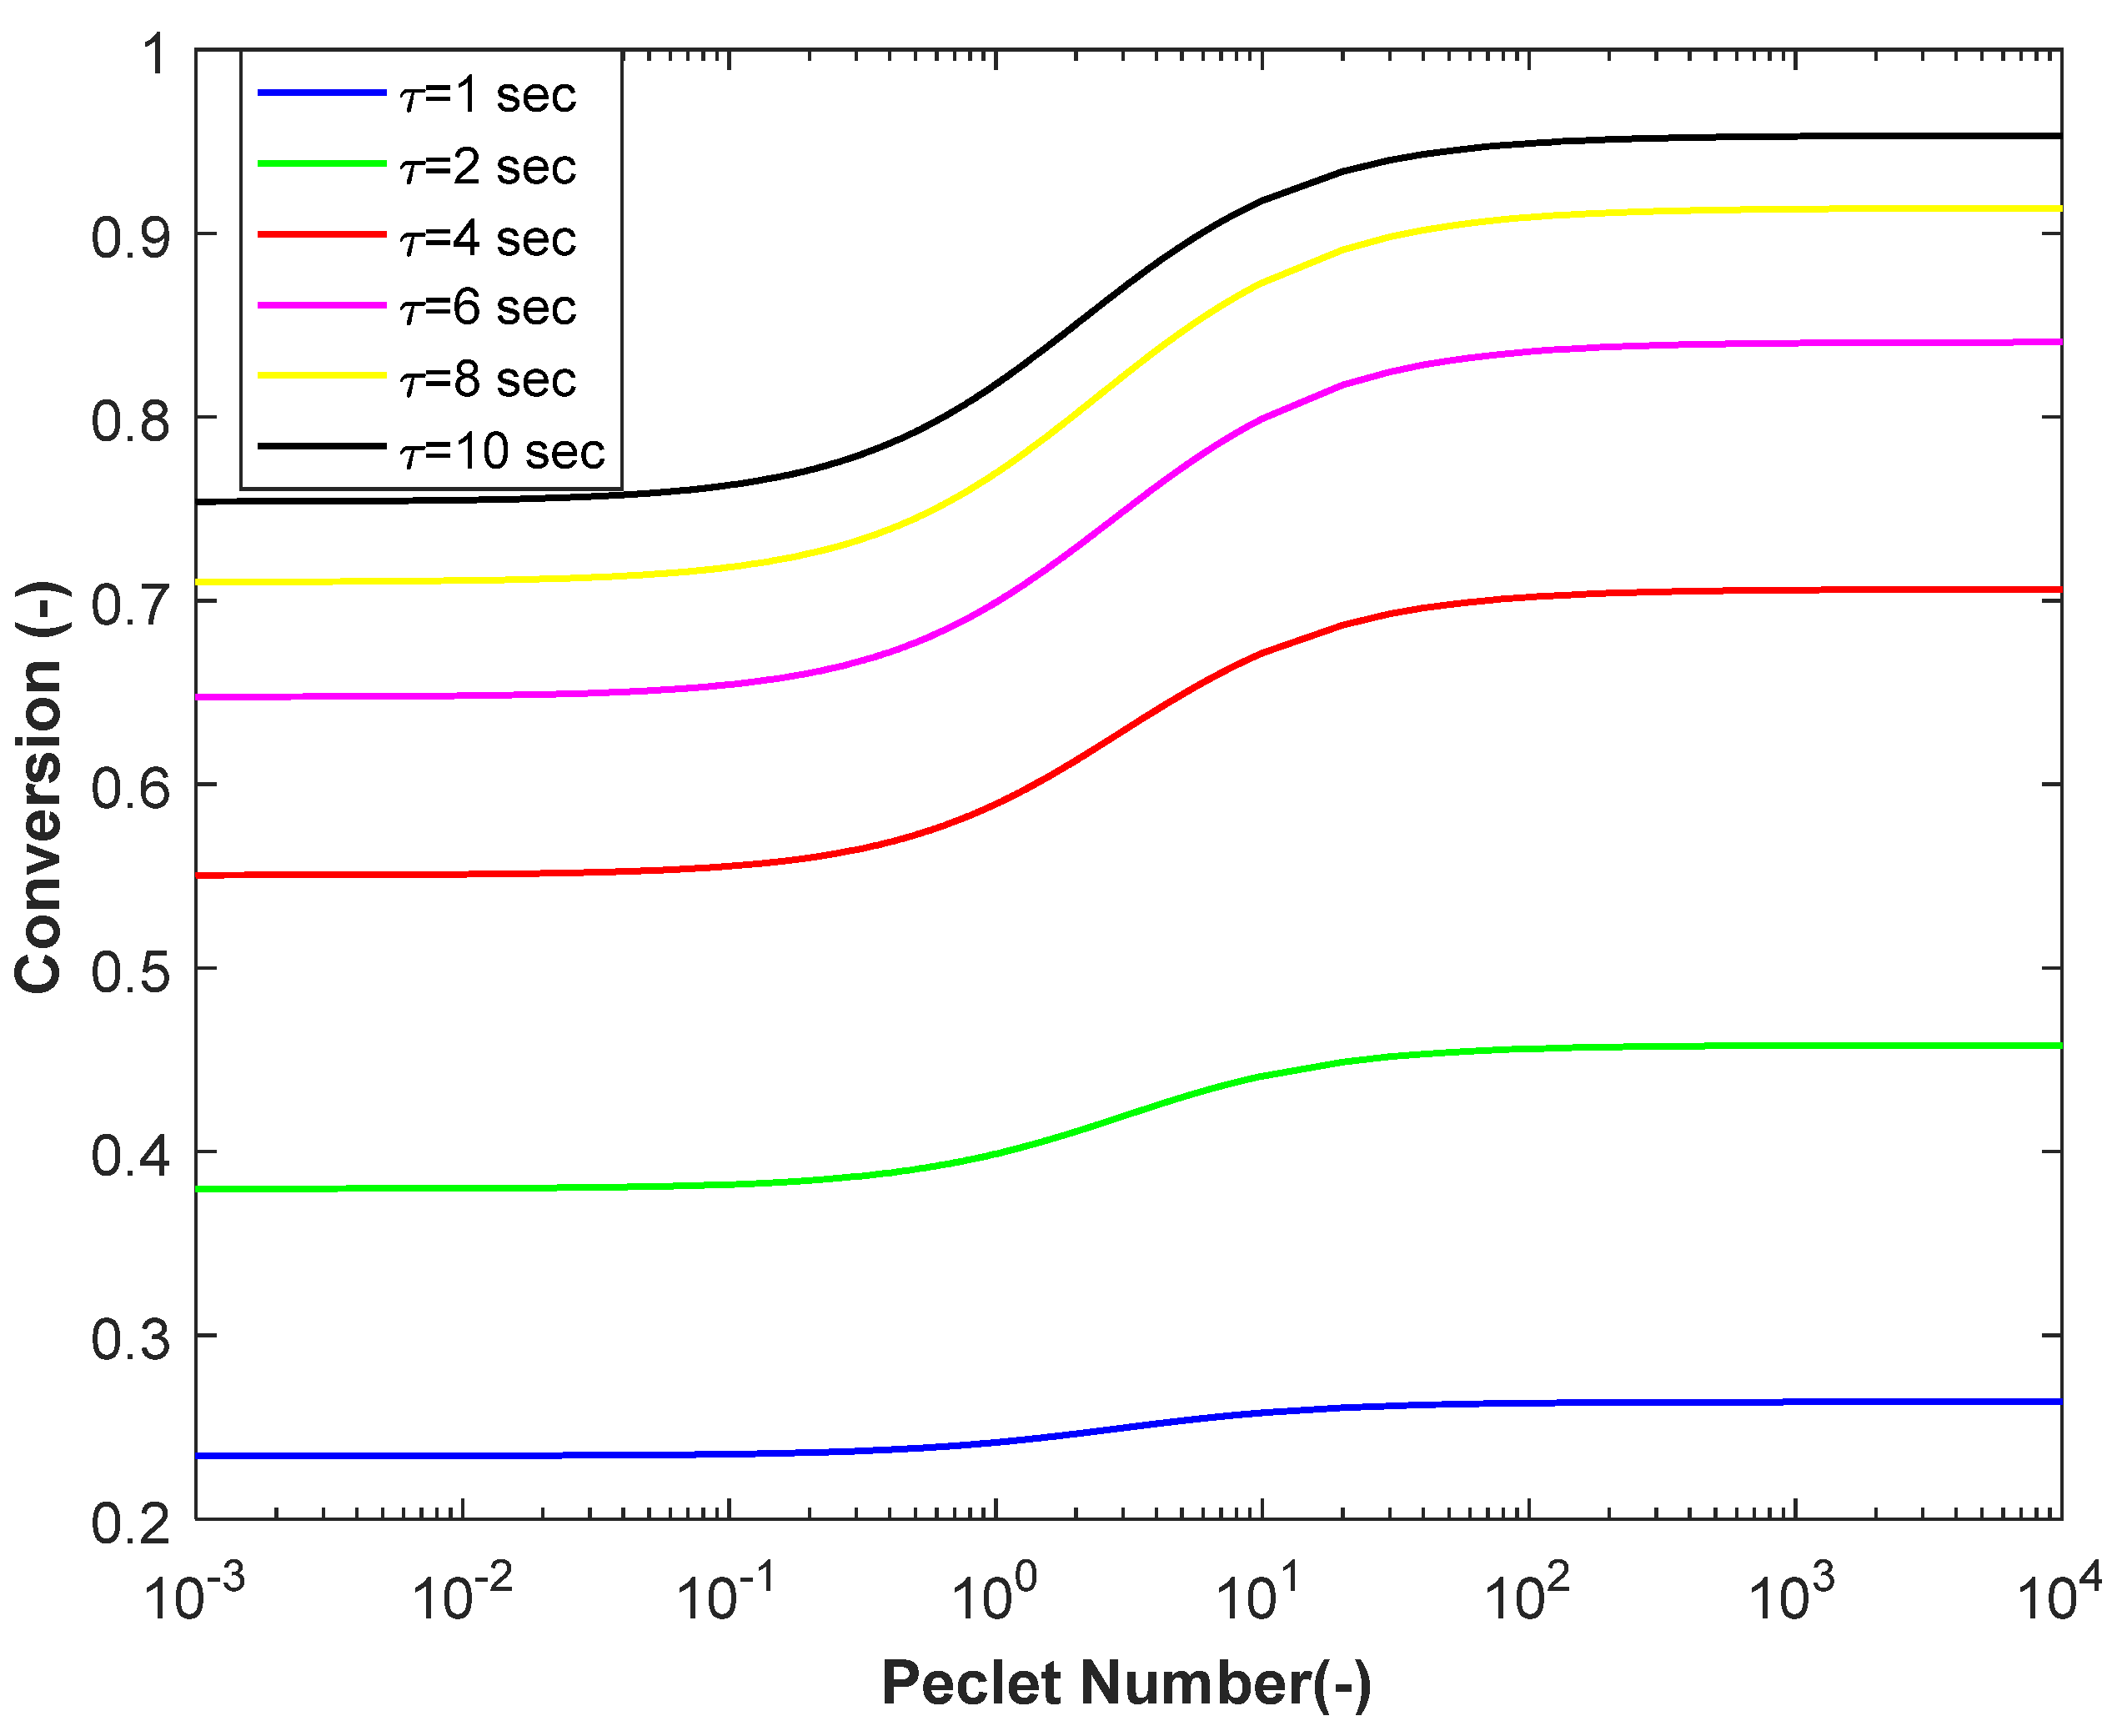
Figure 4 displays the effect of the degree of backmixing on propylene conversion, using A D M at a residence time ranging from 1 to 10 s and constant temperature of 450 °C. The effect of τ on propylene conversion is the same as in Figure 2, increasing τ increases the propylene conversion. The conversion increases with decreasing backmixing (i.e., an increasing Pe number). The effect of the Pe number on conversion is important at a high residence time. For example, the percentage of increase in the conversion of P F R conditions (Pe ≥ 1000), as compared to C S T R conditions (Pe ≤ 0.01), is 12.54, 20.6, 28.26, and 29.8% at τ of 1, 2, 4, and 6 s, respectively. It is also noticed that at higher τ , such as 8 and 10 s, the percentage of increase in the conversion at P F R conditions, as compared to C S T R conditions decrease to 28.65 and 26.45%, respectively. This agree with the literature (Shadiya et al. [21]) that PFR is the optimum scheme for the acrylonitrile process compared to CSTR.

3.2. Production of Acetonitrile ( A C N ) and Hydrogen Cyanide ( H C N )

Waste minimization in the chemical reactor is equivalent to reaction selectivity maximization. The two main pollutants in the acrylonitrile reactor are acetonitrile and hydrogen cyanide. In the ammoxidation process, usually the amount of H C N produced is larger than acetonitrile, but acetonitrile is about three times more toxic, compared to H C N [17]. Figure 5 shows how the dimensionless concentrations (compared to propylene feed concentration) of A C N and H C N vary with Pe number at 500 °C and a residence time of 2 s. The dimensionless concentration of A C N increased from 0.0148 at a low Pe number ( C S T R conditions) to 0.0202 at a high Pe ( P F R conditions), i.e, a 3.65% increase. The dimensionless concentration of H C N change with a Pe number between the C S T R and P F R conditions in a zig-zag pattern (Figure 5, right). In this figure, the amount of waste increases (like acrylonitrile) with decreasing backmixing. Also, other simulation results showed that the amount of waste increases with increasing reactor temperature and residence time.

3.3. Product Selectivity, S A C / A C N and S A C / H C N

Figure 6 displays the effect of temperature on the selectivity of acrylonitrile ( A C ) , with respect to acetonitrile, S A C / A C N at τ of 2 s. Increasing the temperature increases the selectivity ( S A C / A C N ) up to 525 °C, then the selectivity decreases with temperature. This can be explained by increasing the waste production via the overoxidation of acrylonitrile at very high temperatures. The effect of backmixing on S A C / A C N is important at high temperatures. Figure 6 also shows the decline of selectivity of A C , with respect to H C N ( S A C / H C N ), with temperature increase. Again, the decline of S A C / H C N can be explained by the increase in waste production at high temperatures, due to consumption of intermediates (acrylonitrile, acrolein, and acetonitrile) to produce H C N . In this figure, high S A C / H C N is achieved at high a Pe number. A similar trend to Figure 6 was obtained at a residence time of 4 s (data not shown). The effect of backmixing on S A C / A C N is important only at low temperatures. Compared to Figure 6, lower selectivities were obtained at a higher residence time of 4 s.
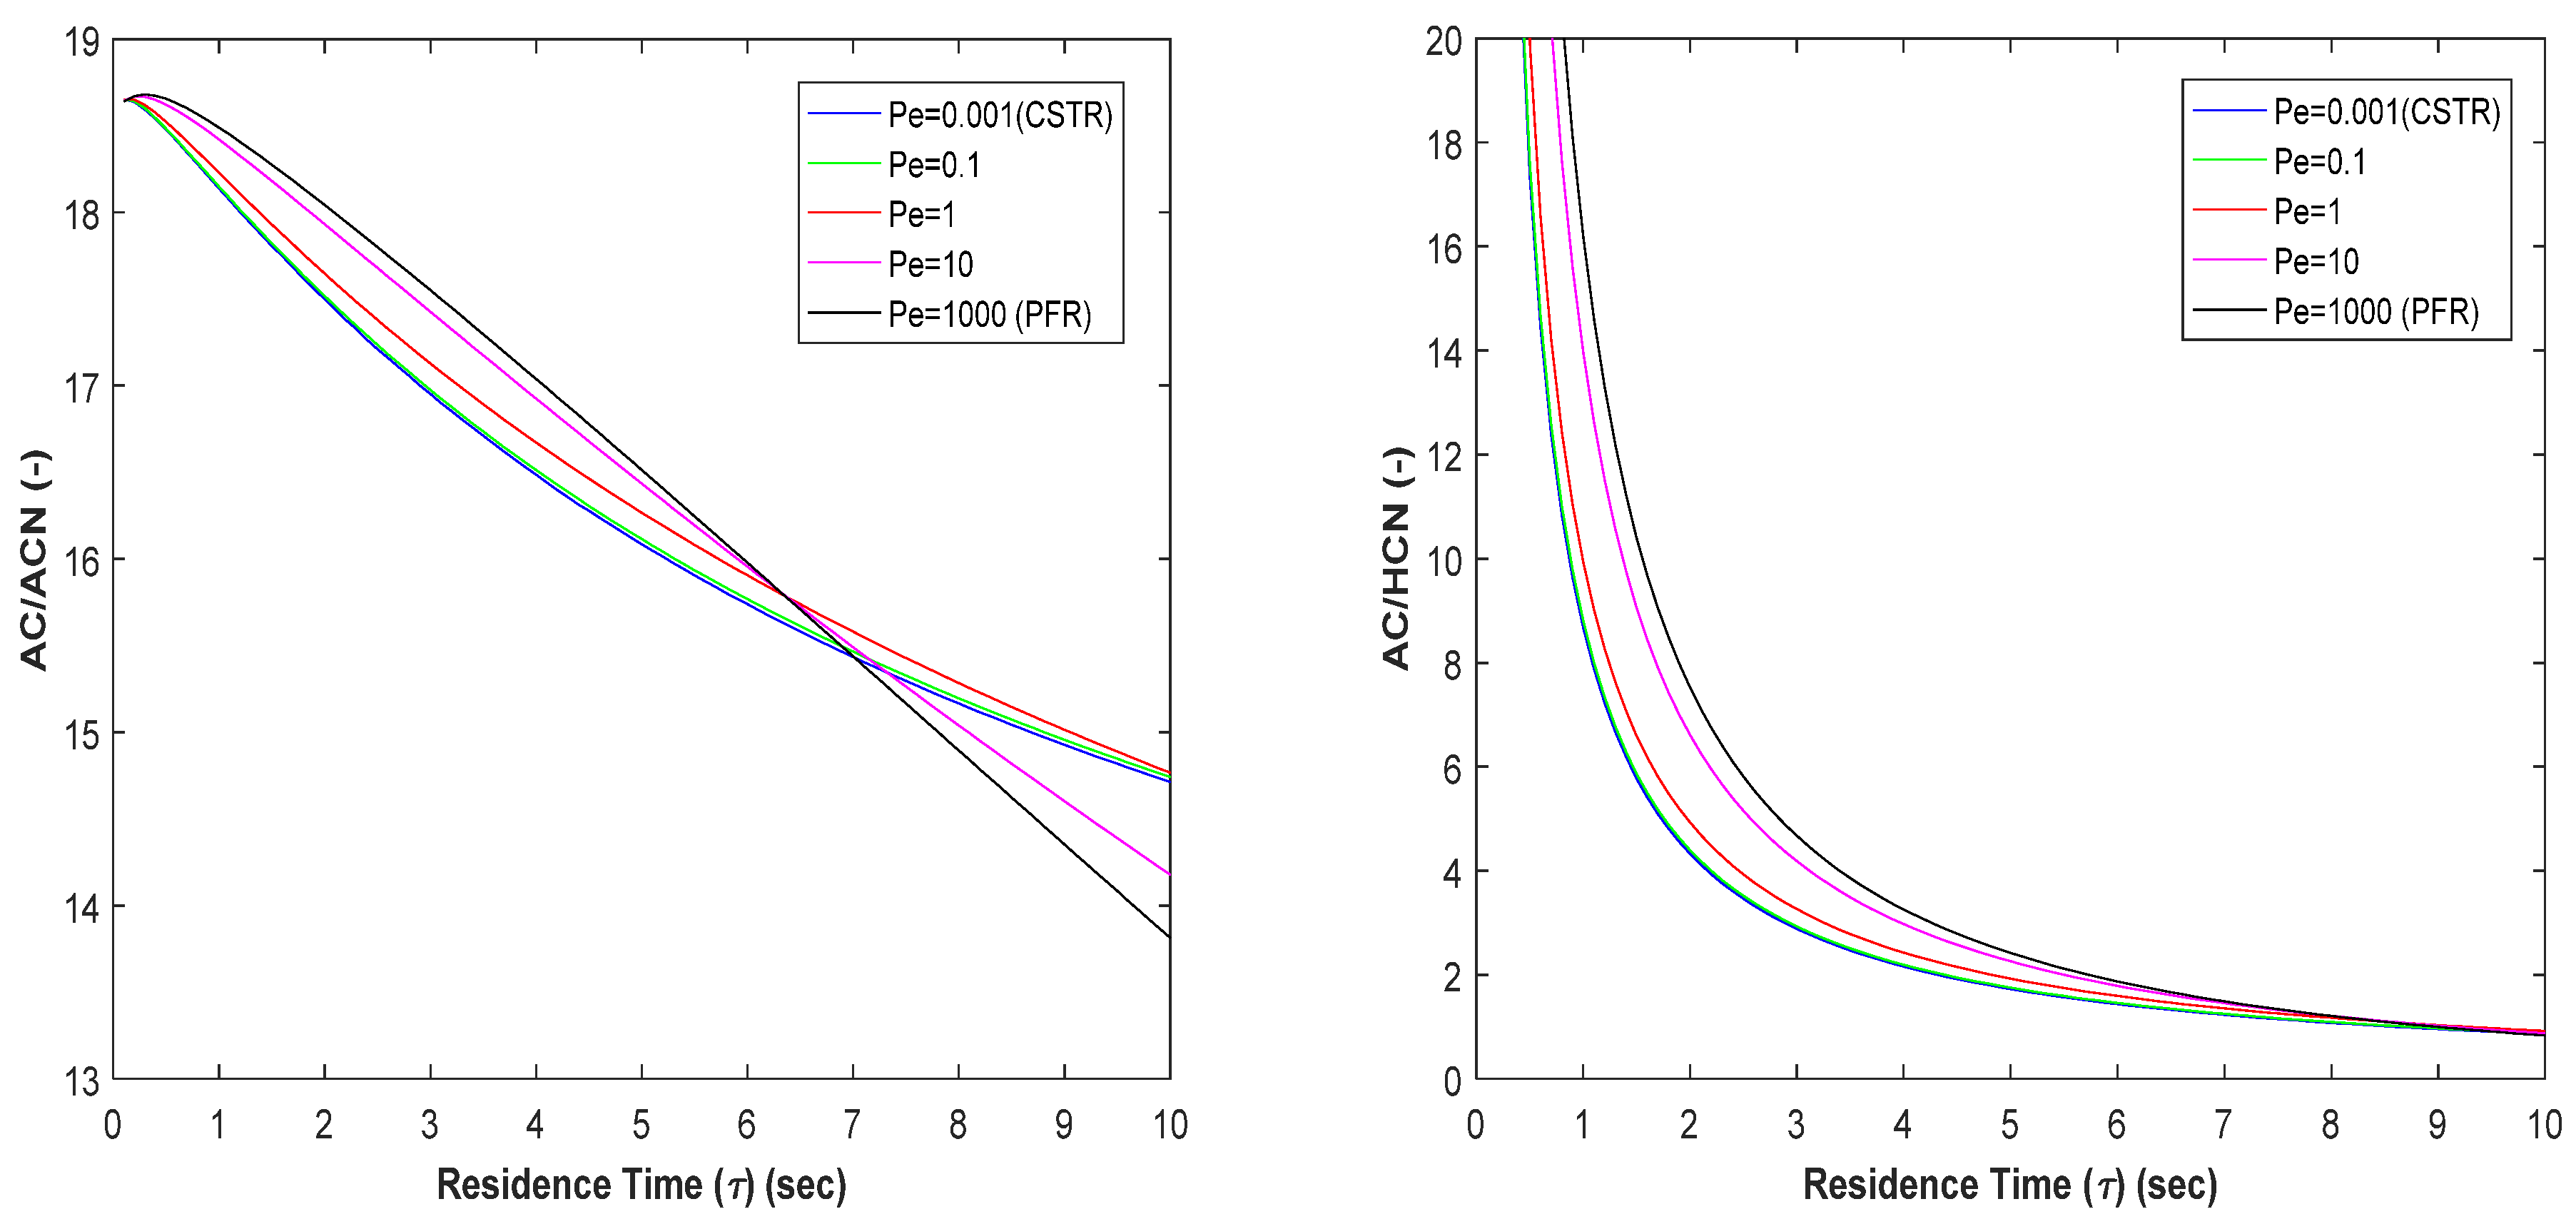
Figure 7 displays the effect of residence time on the selectivity of acrylonitrile S A C / A C N and S A C / H C N at 450 °C. Increasing τ decreases both selectivities. This can be explained by increasing the production of waste product at longer τ , due to the consumption of acrylonitrile. As seen in Figure 7, the S A C / A C N declines gradually with increasing τ , compared to the selectivity S A C / H C N , that is sharply declined with increasing τ . The effect of backmixing on S A C / H C N is important only at low τ and increasing the degree of backmixing reduces the selectivity S A C / H C N . The effect of backmixing on S A C / A C N exhibits a complex profile, with respect to τ . At low τ , backmixing reduces the selectivity while at high τ , the opposite behavior is observed. At a residence time of about 7 s, backmixing has a negligible effect on the selectivity S A C / A C N . At this τ , using P F R and C S T R conditions resulted in almost the same selectivity ( S A C / A C N = 15.5 ). It is clear that selectivity values in Figure 6 and Figure 7 agree with the typical values reported in the literature [13].
The effect of the P e number on the selectivities S A C / A C N and S A C / H C N is shown in Figure 8. Previous results showed that S A C / A C N pass through the maximum with increasing temperature, while S A C / H C N decreases with temperature increase. The effect of backmixing on S A C / A C N is important at high temperatures. At temperatures of 400, 450, 500, and 550 °C ( τ = 2 s), the increase or decrease in selectivity at P F R conditions changed by −3.52, 3.1, 6, and −6.55% as compared to C S T R conditions, respectively. The percentage change in the selectivity S A C / H C N at P F R conditions as compared to C S T R conditions at the above temperatures and τ of 2 s are 89.85, 74.26, 43.4, and −4.27%, respectively. Results of S A C / H C N agree with the literature (Shadiya et al. [21]), that PFR is the optimum scheme for acrylonitrile process, compared to CSTR.
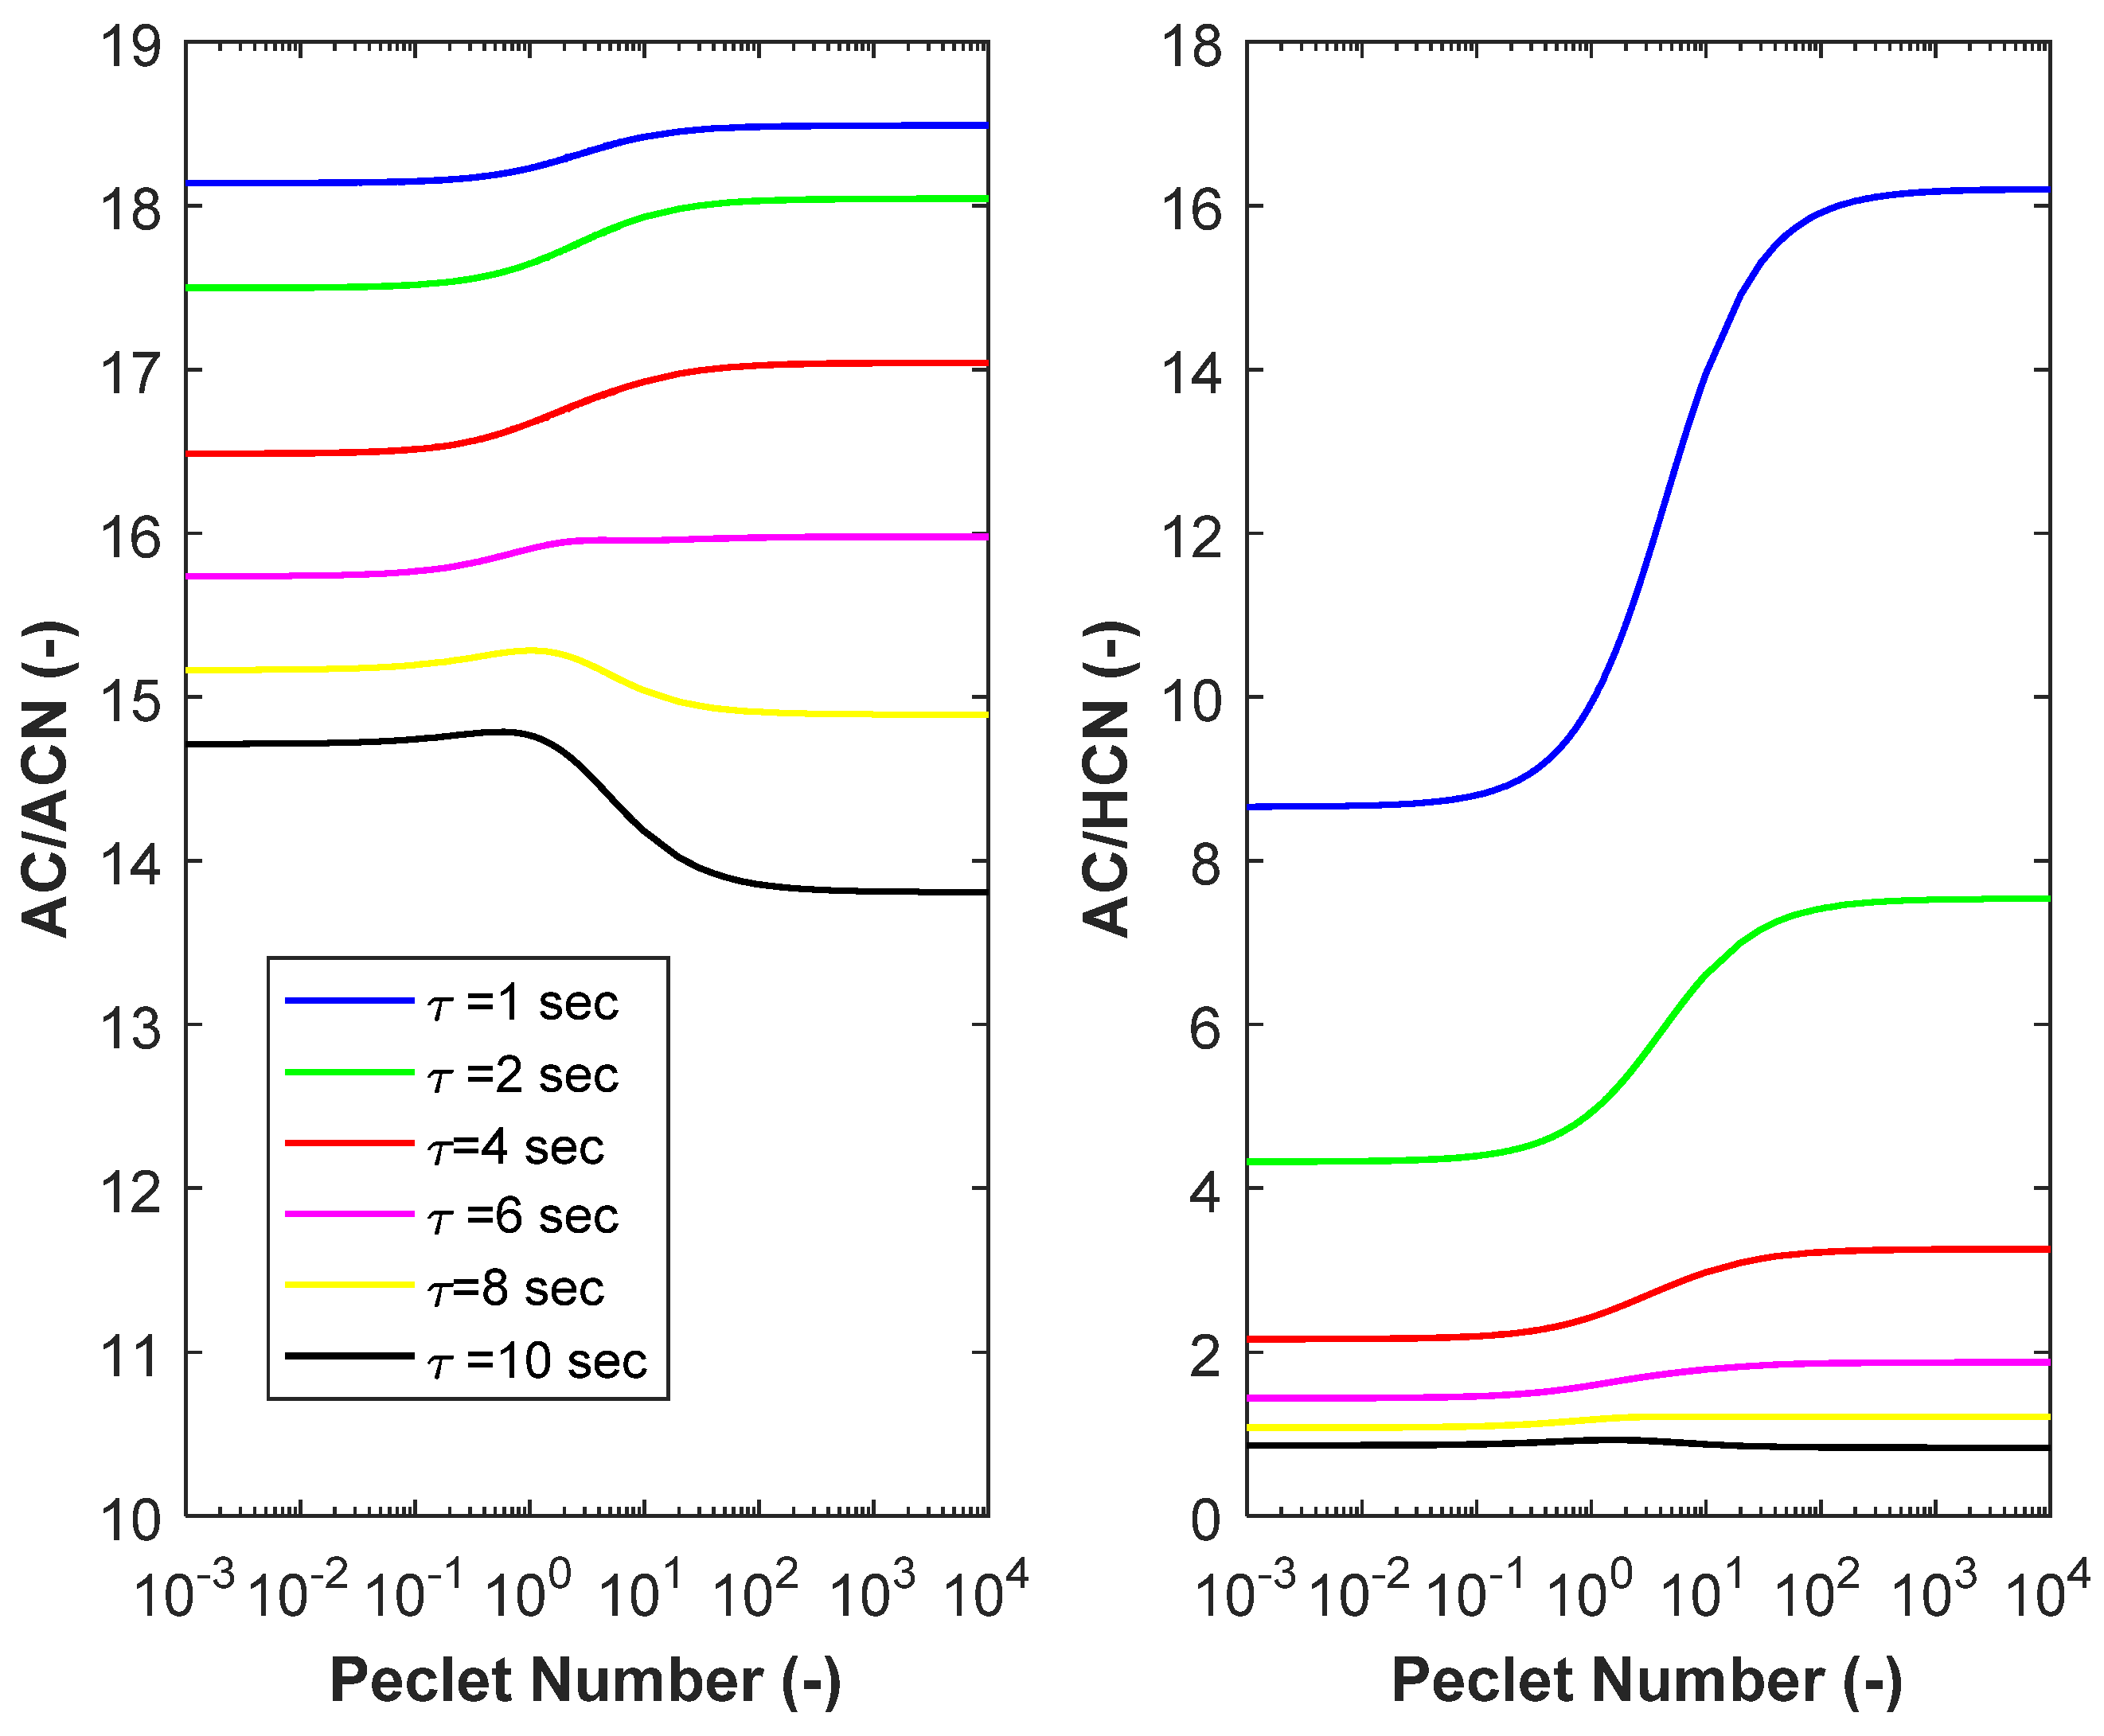
The effect of the Pe number on selectivities S A C / A C N and S A C / H C N , with τ as a parameter (450 °C), is shown in Figure 9. As shown in previous figures and in this figure, both selectivities decrease with increasing τ . For τ values of 1, 2, 4, and 6 s, the percentage of increase in S A C / A C N at P F R conditions, as compared to C S T R conditions are 1.94, 3.12, 3.38, and 1.53%, respectively. When τ was increased to 8 and 10 s, this percentage decreased by 1.8 and 6.15%, respectively. The percentage of increase in the selectivity S A C / H C N at P F R conditions, as compared to C S T R conditions, are 87.1, 74.26, 50.93, 30.4, and 12.4% at τ values of 1, 2, 4, 6, and 8 s, respectively. Increasing τ to 10 s resulted in a percentage decrease of 3.31%. It is clear that the selectivity values in Figure 8 and Figure 9 agree with that reported in the literature [13].

3.4. Comparison between A D M and T I S M Predictions

Predictions of the A D M and T I S M of the reactor conversion and selectivities S A C / A C N and S A C / H C N are shown in Figure 10 for τ of 1,2,4,6,8, and 10 s at 450 °C. The x-axis in this figure is 1 / 2 ( N 1 ) for the T I S M and 1 / P e for the A D M . If the equation P e = 2 ( N 1 ) is used to relate the constants of A D M and T I S M , the x-axes of the two models are equal. In Figure 10, the circle symbols represent points for N = 2 to 11 reactors in-series while the predictions of A D M are represented by a continuous line. It is clear from Figure 10 that increasing the residence time results in increasing propylene conversion and decreasing of the selectivities S A C / A C N and S A C / H C N . In Figure 10, the effect of backmixing on propylene conversion and S A C / A C N is more important with the increasing of τ values. At τ = 1, the prediction of the two models for conversion and S A C / A C N are almost horizontal, indicating no effect of backmixing; opposite behavior was observed in the case of the selectivity S A C / H C N . Also in Figure 10, increasing τ results in the decrease of both selectivities. In this figure, it can be seen that the conversion and selectivity predicted by the two models are in good agreement. Very small differences can be noticed only at high mixing intensity, such as N = 2 reactors in series for conversion, S A C / A C N at a high τ such as 10 s, and S A C / H C N at low a τ such as 1 s. Figure 11 shows a comparison between the predictions of the T I S M and A D M for conversion and the two selectivities using τ of 2 s and temperatures of 400, 450, 500, and 550 °C. In this figure, high S A C / A C N is obtained at a high temperature (550 °C), while high selectivity S A C / H C N is obtained at a low temperature (400 °C). The effect of backmixing on selectivity S A C / H C N is important at high temperatures, while the effect of backmixing on selectivity S A C / H C N is important at low temperatures. It is also clear, in this figure, that the two model predictions agree well with each other. Very small deviations were observed at a high mixing intensity, such as N = 2 C S T R s in series for S A C / A C N at a high temperature (550 °C) and for S A C / H C N at a low temperature (400 °C). Figure 10 and Figure 11 show that the equation P e = 2 ( N 1 ) can be used to relate the parameters of the two modeling methods used to describe backmixing. This equation was used in the literature to model the backmixing of other reactor systems [29,30,31,32,33,34,35]. The T I S M is recommended to account for the effect of backmixing, because it is simple and has computational advantages over A D M .

4. Conclusions

The two modeling approaches, axial dispersion model and tanks-in-series model were used to simulate the effect of temperature, residence time, and the degree of backmixing on the steady-state performance of the acrylonitrile reactor. The reactor performance was determined by the propylene conversion and waste production described by selectivity. Propylene conversion increases with increasing temperature and residence time and decreases with an increasing degree of backmixing. The effect of backmixing is more important at high temperatures and a high residence time. For example, the increase in the conversion of reactor at plug-flow conditions as compared to complete mixing, is 10.26, 20.6, and 29.2% at temperatures of 400, 450, and 500 °C, respectively. The production of acrylonitrile and waste increase with the reduction of reactor backmixing. For example, at 500 °C and a residence time of 2 s, the concentration of acetonitrile at PFR conditions is 3.65% more than that of CSTR conditions. Increasing the temperature increases the selectivity with respect to acetonitrile while the selectivity with respect to hydrogen cyanide decreases. Both selectivities decrease with an increasing residence time and showed a complex profile with the degree of backmixing. The effect of backmixing on selectivity is significant only at high temperature for selectivity with respect to acetonitrile and at low temperature for selectivity, with respect to hydrogen cyanide. At 450 °C, the percentage of increase in the selectivity of acrylonitrile, with respect to hydrogen cyanide, at plug-flow reactor conditions, as compared to a continuous stirred tank reactor is 87.1, 74.3, 50.9, 30.4, and 12.4% at a residence time of 1, 2, 4, 6, and 8 s, respectively. Although the plug-flow reactor has the advantage of zero backmixing, some degree of mixing is suitable for the removal of the heat released from highly exothermic reactions, such as the one in an acrylonitrile reactor. The tanks-in-series model and axial dispersion model parameters are related and the two-models prediction for the conversion and selectivity agree well with each other. The operating conditions and backmixing knowledge of an acrylonitrile reactor give insight about the environmental performance of the reactor. Multi-objective optimization is required to determine the best performance possible for acrylonitrile reactors.

Funding

This research received no external funding.

Institutional Review Board Statement

Not applicable.

Informed Consent Statement

Not applicable.

Data Availability Statement

Not applicable.

Conflicts of Interest

The author declares no conflict of interest.

Nomenclature

A ,   B ,   C ,   D ,   E propylene, acrylonitrile, acrolein, acetonitrile and hydrogen cyanide
C concentration [gmole/m3]
D z axial dispersion coefficient [m2/sec]
Eactivation energy [cal/gmole]
kreaction rate constant [1/sec]
L reactor   length   [ m ]
Nnumber of CSTRs in series
P e Peclet   number   ( P e = u L / D z )   [ ]
rreaction rate [gmole/m3 sec]
S selectivity   ( desired   product / undesired   product )   [ ]
T temperature   [ K ]
u fluid   velocity   [ m / s e c ]
X propylene   conversion   [ ]
y i dimensionless   concentration   of   species   i   ( y i = C i / C A o )   [ ]
z axial distance in the reactor [m]
Greek Symbols
λ dimensionless   length   ( λ = Z / L )   [ ]
τresidence time [sec]
Subscripts
i refer to the ith species
j refer to the jth reactor
Leffluent
N refers   to   the   N th reactor
o initial
Abbreviations
A D M axial dispersion model
C S T R continuous stirred tank reactor
P E I potential environmental impact
P F R plug-flow reactor
T I S M tanks-in-series model
W A R waste reduction

References

  1. Li, X.; Zhang, P.; Chen, G.; Wang, W.; Li, J. Waste minimization and efficient disposal of particles in optimized organic silicon production. J. Cleaner Prod. 2020, 242, 118445. [Google Scholar] [CrossRef]
  2. Cucciniello, R.; Cespi, D. Recycling within the chemical industry: The circular economy era. Recycling 2018, 3, 22. [Google Scholar] [CrossRef] [Green Version]
  3. Sepiacci, P.; Depetri, V.; Manca, D. A systematic approach to the optimal design of chemical plants with waste reduction and market uncertainty. Comp. Chem. Eng. 2017, 102, 96–109. [Google Scholar] [CrossRef]
  4. Lopez-Delgado, A.; Rabla, J.I.; Padilla, I.; Lopez-Andres, S.; Romero, M. Zero-waste process for the transformation of a hazardous aluminum waste into a raw material to obtain zeolites. J. Cleaner Prod. 2020, 255, 120178. [Google Scholar] [CrossRef]
  5. Levenspiel, O. Chemical Reaction Engineering, 3rd ed.; John Wiley and Sons: Hoboken, NJ, USA, 1999. [Google Scholar]
  6. Wen, C.Y.; Fan, L.T. Models for Flow Systems and Chemical Reactors; Marcel Dekker: New York, NY, USA, 1975. [Google Scholar]
  7. Shinnar, R. Use of residence and contact time distributions in reactor design. In Chemical Reaction and Reactor Engineering; Carberry, J., Varma, A., Eds.; Marcel Dekker: New York, NY, USA, 1987. [Google Scholar]
  8. Alvare, J.; Al-Dahhan, M. Liquid phase mixing in trayed bubble column reactors. Chem. Eng. Sci. 2006, 61, 1819–1835. [Google Scholar] [CrossRef]
  9. Turner, J.R.; Mills, P.L. Comparison of axial dispersion and mixing cell models for design and simulation of Fischer-Tropsch slurry bubble column reactors. Chem. Eng. Sci. 1990, 45, 2317–2324. [Google Scholar] [CrossRef]
  10. Chen, Q.; Feng, X. A pollution reduction methodology in reactor design. Chem. Eng. Process. 2005, 44, 13–21. [Google Scholar] [CrossRef]
  11. Kohlbrand, H.T. From waste treatment to pollution prevention and beyond: Opportunities for the next 20 years. AIChE Symp. Ser. 1998, 94, 117–121. [Google Scholar]
  12. Curzons, A.D.; Constable, D.J.C.; Mortimer, D.N.; Cunningham, V.L. So you think your process is green, how do you know?—Using principles of sustainability to determine what is green—A corporate perspective. Green Chem. 2001, 3, 1–6. [Google Scholar] [CrossRef]
  13. Brazdil, J.F. Acrylonitrile. In Ullmanns Encycl. of Industrial Chemistry; Wiley-VCH Verlag GmbH &Co. KGaA: Weinheim, Germany, 2012. [Google Scholar] [CrossRef]
  14. Cespi, D.; Passarini, F.; Neri, E.; Vassura, I.; Ciacci, L. Life cycle assessment comparison of two ways for acrylonitrile production: The SOHIO process and an alternative route using propane. J. Clean. Prod. 2014, 69, 17–25. [Google Scholar] [CrossRef]
  15. Karp, E.M.; Eaton, T.R.; Nogue, V.S.I.; Vorotnikov, V.; Biddy, M.J.; Tan, E.C.D.; Brandner, D.G.; Cywar, R.M.; Liu, R.; Manker, L.P.; et al. Renewable acrylonitrile production. Science 2017, 358, 1307–1310. [Google Scholar] [CrossRef] [PubMed] [Green Version]
  16. Wei, F.; Wan, X.; Hu, Y.; Wang, Z.; Yang, Y.; Jin, Y. A pilot plant study and 2-D dispersion reactor model for a high-density riser reactor. Chem. Eng. Sci. 2001, 56, 613–620. [Google Scholar] [CrossRef]
  17. Miracca, I.; Capone, G. The staging in fluidized bed reactors: From CSTR to plug-flow. Chem. Eng. J. 2001, 82, 259–266. [Google Scholar] [CrossRef]
  18. Basu, P.; Sett, A.; Gbordzoe, E.A.M. A simplified model for combustion of carbon in a circulating fluidized bed combustor. In FBC Comes of Age; Mustonen, J.P., Ed.; ASME: New York, NY, USA, 1987; pp. 738–742. [Google Scholar]
  19. Weiss, V.; Fert, F.N.; Helmrich, H.; Janssen, K. Mathematical modelling of circulating fluidized bed reactors by reference to a solids decomposition reaction and coal combustion. Chem. Eng. Process. 1987, 22, 79–90. [Google Scholar] [CrossRef]
  20. Lee, Y.Y.; HyppanIen, T. In FBC Technology for Today; Manaker, A.M., Ed.; ASME: New York, NY, USA, 1989; pp. 753–764. [Google Scholar]
  21. Shadiya, O.; Satish, V.J.; High, K.A. Process enhancement through waste minimization and multi-objective optimization. J. Clean. Prod. 2012, 31, 137–149. [Google Scholar] [CrossRef]
  22. MarketWatch (Press Release). Global Acrylonitrile Market Size, 2020 Market Share, Top Companies Report Covers, Definition, Share, and Regional Analysis by Key Players, Showing Impressive Growth by 2026. December 2020. Available online: https://www.marketwatch.com/press-release/global-acrylonitrile-market-size-2020-market-share-top-companies-report-covers-definition-share-and-regional-analysis-by-key-players-showing-impressive-growth-by-2026-2020-12-07 (accessed on 24 January 2021).
  23. Hopper, J.R.; Yaws, C.L.; Ho, T.C.; Vichailak, M. Waste minimization by process modification. Waste Manag. 1993, 13, 3–14. [Google Scholar] [CrossRef]
  24. Licht, R.B.; Vogt, D.; Bell, A. The mechanism and kinetics of propene ammoxidation over α-bismuth molybdate. J. Catal. 2016, 339, 228–241. [Google Scholar] [CrossRef] [Green Version]
  25. Hopper, J.R.; Yaws, C.L.; Ho, T.C. Pollution prevention by process modification: Reactions and separations. Waste Manag. 1994, 14, 187–202. [Google Scholar] [CrossRef]
  26. Danckwerts, P.V. Continuous flow systems, Distribution of residence times. Chem. Eng. Sci. 1953, 2, 1–13. [Google Scholar] [CrossRef]
  27. MATLAB. Version (R2020b); The MathWorks Inc.: Natick, MA, USA, 2019. [Google Scholar]
  28. Elgeti, K. A new equation for correlating a pipe flow reactor with a cascade of mixed reactors. Chem. Eng. Sci. 1996, 51, 5077–5080. [Google Scholar] [CrossRef]
  29. Kramers, H.; Aberda, G. Frequency response analysis of continuous flow systems. Chem. Eng. Sci. 1953, 2, 173–181. [Google Scholar] [CrossRef]
  30. Aris, R. End and beginnings in the mathematical modeling of chemical engineering systems. Chem. Eng. Sci. 1993, 48, 2507–2517. [Google Scholar] [CrossRef]
  31. Abu-Reesh, I.; Abu-Sharkh, B.F. Comparison of axial dispersion and tanks-in-series Models for simulating the performance of enzyme reactors. Ind. Eng. Chem. Res. 2003, 42, 5495–5505. [Google Scholar] [CrossRef]
  32. Rodriguez-Gomez, R.; Renman, G.; Moreno, L.; Liu, L. A model to describe the performance of the UASB reactor. Biodegradation 2014, 25, 239–251. [Google Scholar] [CrossRef] [PubMed] [Green Version]
  33. Fernengel, J.; Bolton, L.; Hinrichsen, O. Characterization and design of single pellet string reactors using numerical simulation. Chem. Eng. J. 2019, 373, 1397–1408. [Google Scholar] [CrossRef]
  34. Toson, P.; Doshi, P.; Jajcevic, D. Explicit residence time distribution of generalized cascade of continuous stirred tank reactors for a description of a short recirculation time (by passing). Processes 2019, 7, 615. [Google Scholar] [CrossRef] [Green Version]
  35. Montiel, J.I.P.; Montero, A.G.; Ramirez-Munoz, J. Comparison of different methods for evaluating the hydraulics of a pilot-scale upflow anaerobic sludge blanket reactor. Environ. Process 2019, 6, 25–41. [Google Scholar] [CrossRef]
Scheme 1. Scheme for reactions in the production of acrylonitrile, via the ammoxidation of propylene catalytic process [23].
Sustainability 13 07923 sch001
Figure 1. Effect of temperature on propylene conversion at different Pe numbers, τ = 2 s.
Sustainability 13 07923 g001
Figure 2. Effect of residence time on propylene conversion at different Pe numbers, T = 450 °C.
Sustainability 13 07923 g002
Figure 3. Effect of Pe number on propylene conversion at different temperatures, τ = 2 s.
Sustainability 13 07923 g003
Figure 4. Effect of Pe number on propylene conversion at different residence times, T = 450 °C.
Sustainability 13 07923 g004
Figure 5. Effect of Pe number on the dimensionless concentration of acetonitrile and hydrogen cyanide. Temperature = 500 °C, residence time = 2 s.
Sustainability 13 07923 g005
Figure 6. Effect of temperature on acrylonitrile ( A C ) selectivity, with respect to acetonitrile ( A C N ) (left) and hydrogen cyanide ( H C N ) (right), at different Pe numbers, residence time = 2 s.
Sustainability 13 07923 g006
Figure 7. Effect of residence time on acrylonitrile ( A C ) selectivity with respect to acetonitrile ( A C N ) (left) and hydrogen cyanide ( H C N ) (right) at differrent P e numbers, temperature = 450 °C.
Sustainability 13 07923 g007
Figure 8. Effect of the Pe number on acrylonitrile ( A C ) selectivity, with respect to acetonitrile ( A C N ) (left) and hydrogen cyanide ( H C N ) (right) at differrent temperatures, residence time = 2 s.
Sustainability 13 07923 g008
Figure 9. Effect of Pe number on acrylonitrile ( A C ) selectivity with respect to acetonitrile ( A C N ) (left) and hydrogen cyanide ( H C N ) (right) at differrent residence times, temperature = 450 °C.
Sustainability 13 07923 g009
Figure 10. Propylene conversion and selectivities predicted by A D M (solid line) and T I S M (circule) at different residence times, temperature = 450 °C.
Sustainability 13 07923 g010
Figure 11. Propylene conversion and selectivities predicted by A D M (solid line) and T I S M (circule) at different temperatures, residence time = 2 s.
Sustainability 13 07923 g011
Table 1. The activation energies and rate constants at 470 °C for ammoxidation of propylene [23].
ReactionActivation Energy
(cal/mol)
Rate Constant at
470 °C (sec−1)
1E1 = 19,000k1 = 0.40556
2E2 = 19,000k2 = 0.00973
3E3 = 7000k3 = 0.01744
4E4 = 7000k4 = 6.81341
5E5 = 19,800k5 = 0.16222
6E6 = 7000k6 = 0.07300
Table 4. Calculation of conversion and selectivity using A D M and T I S M .
ModelConversion (X) Selectivity   ( S A C / A C N ) Selectivity   ( S A C / H C N )
ADM1—yAL y B L y D L y B L y E L
TISM1—yAN y B N y D N y B N y E N
Publisher’s Note: MDPI stays neutral with regard to jurisdictional claims in published maps and institutional affiliations.