
Acrylonitrile Process Enhancement through Waste Minimization: Effect of Reaction Conditions and Degree of Backmixing

Abstract
:1. Introduction
1.1. Acrylonitrile Process
1.2. Kinetic Data
2. Model Development
2.1. Axial Dispersion Model ()

| Boundary | Conditions | |||
|---|---|---|---|---|
| Species | Differential Equation | λ = 0 | λ = 1 | |
| A (propylene) | (12) | |||
| B (acrylonitrile) | (13) | |||
| C (acrolein) | (14) | |||
| D (acetonitrile) | (15) | |||
| E (HCN) | (16) | |||
2.2. Tanks-in-Series Model ()
| Species | Material Balance Equation around Reactor j | Reactor Feed Condition | |
|---|---|---|---|
| A (propylene) | (18) | yAo = 1 | |
| B (acrylonitrile) | (19) | yBo = 1 | |
| C (acrolein) | (20) | yCo = 1 | |
| D (acetonitrile) | (21) | yDo = 1 | |
| E (HCN) | (22) | yEo = 1 | |
2.3. Reactor Performance
2.4. Comparison between and
3. Results and Discussions
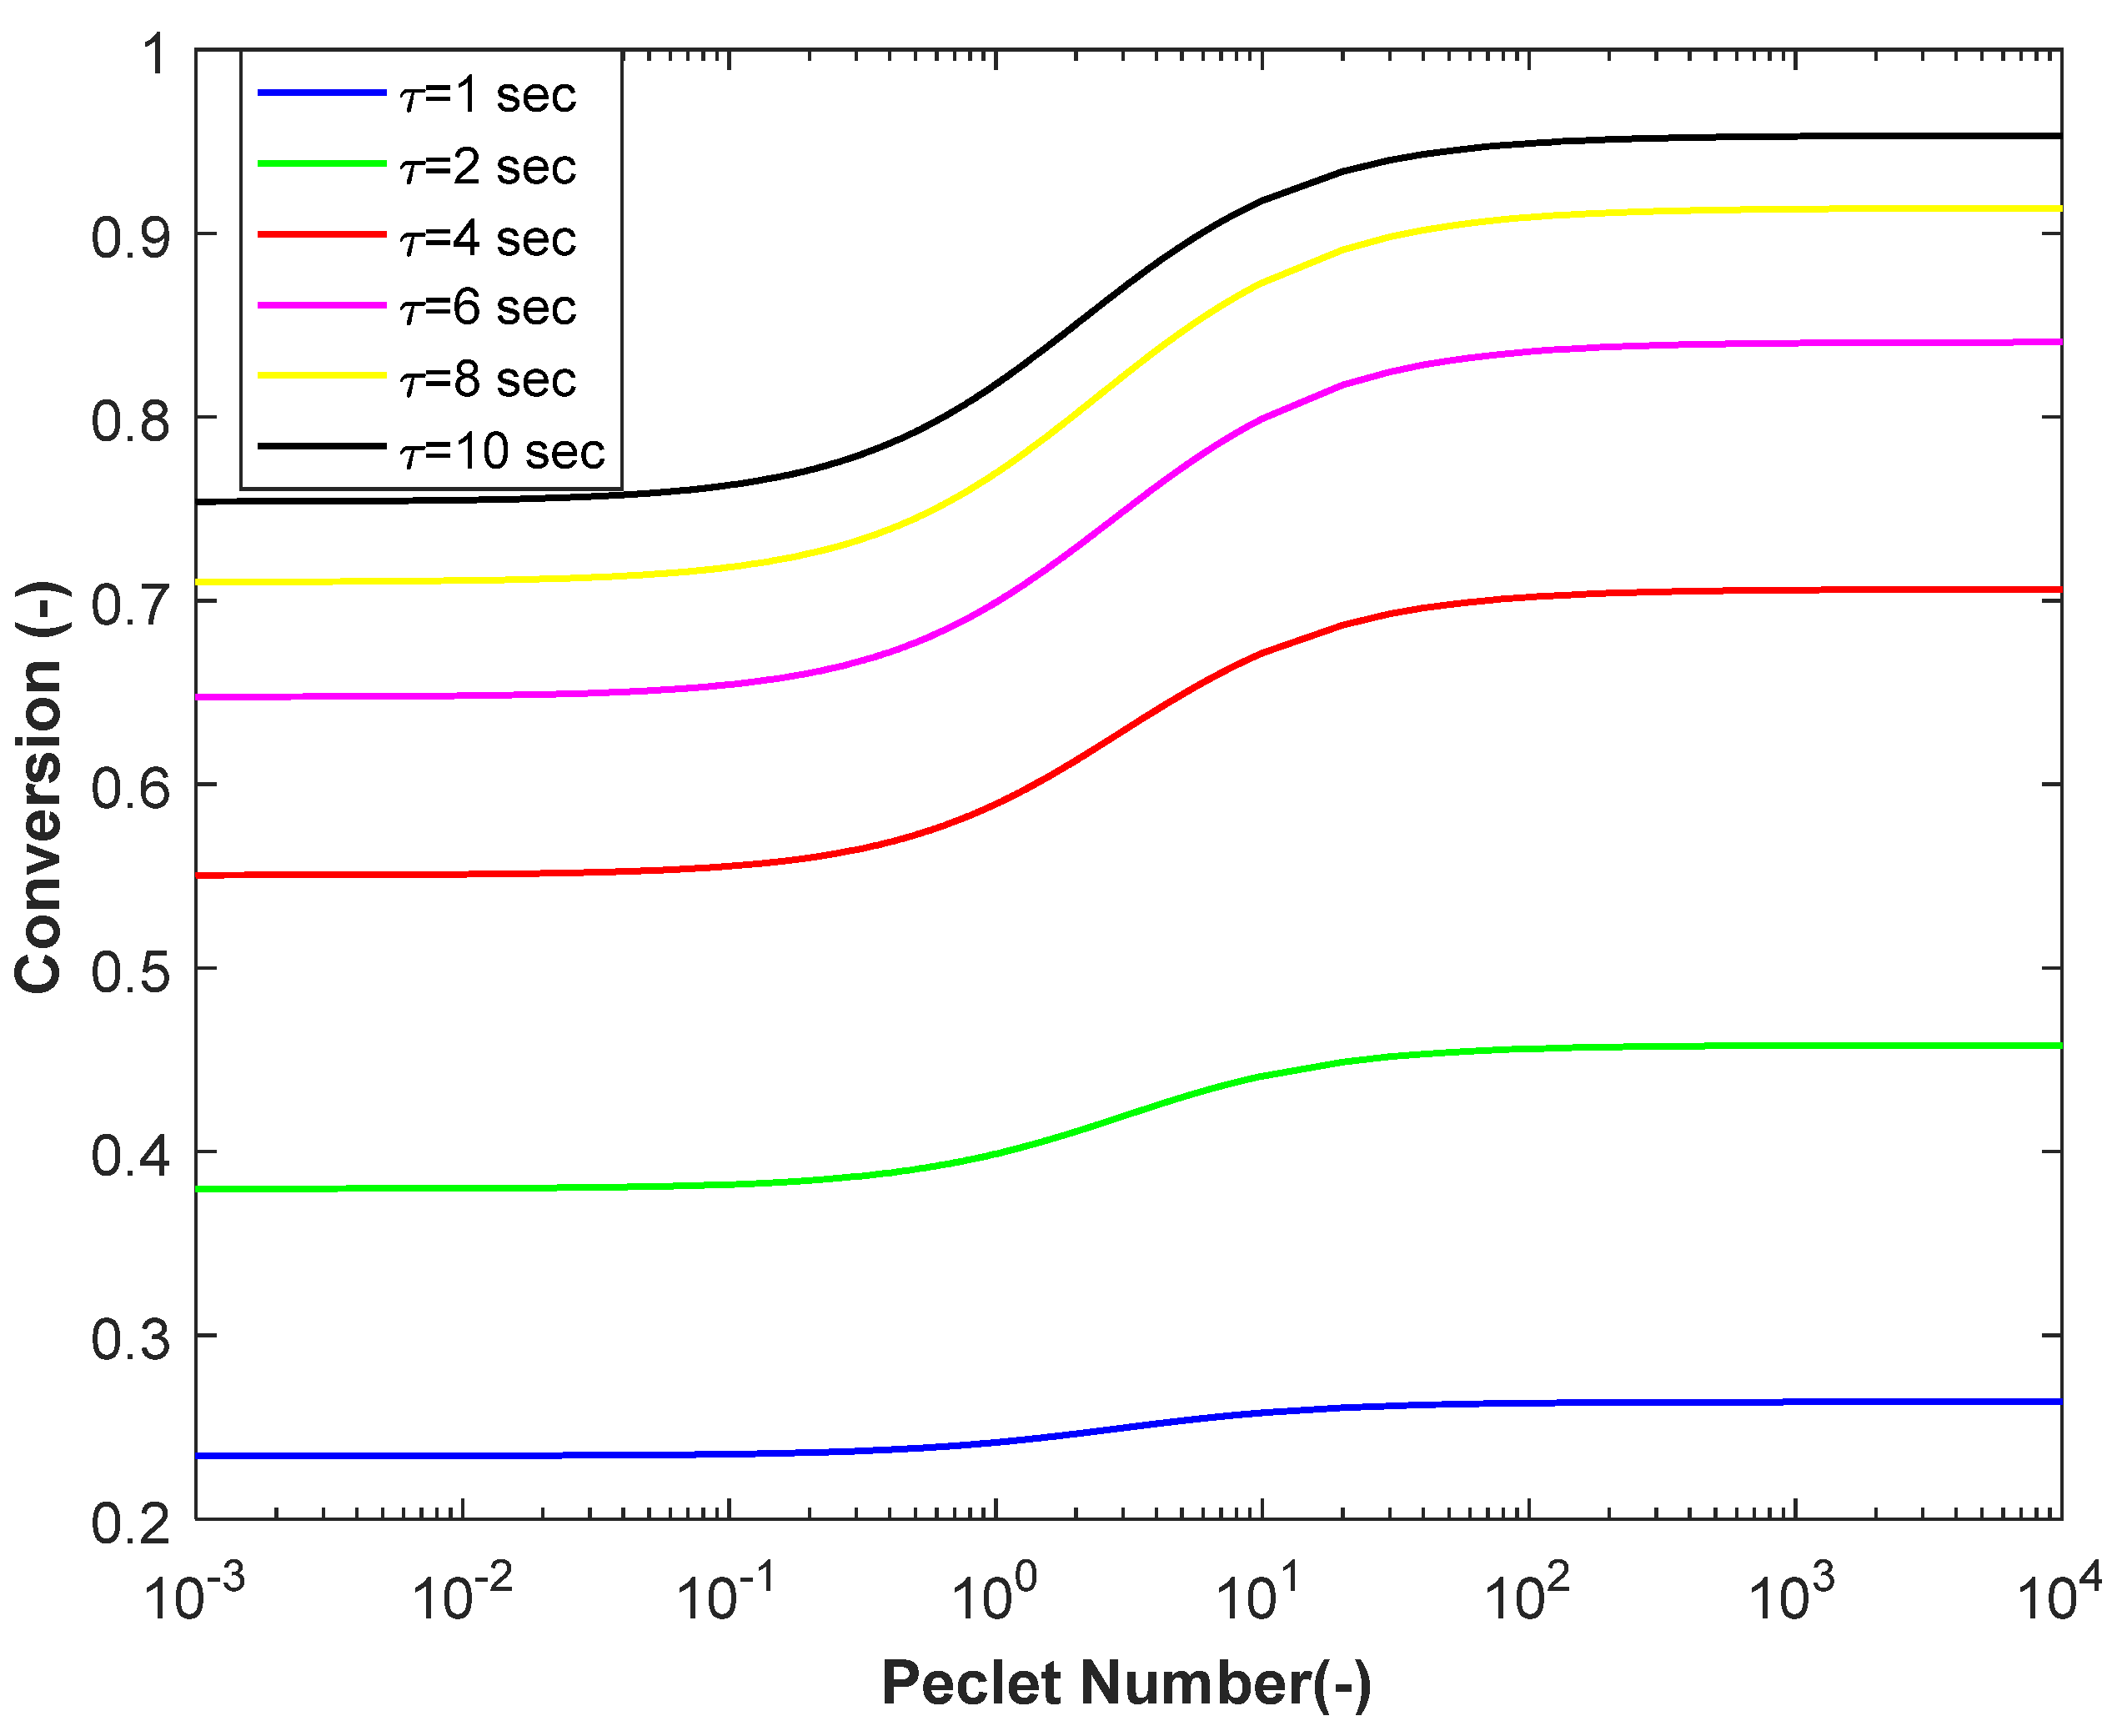
3.1. Propylene Conversion
3.2. Production of Acetonitrile and Hydrogen Cyanide
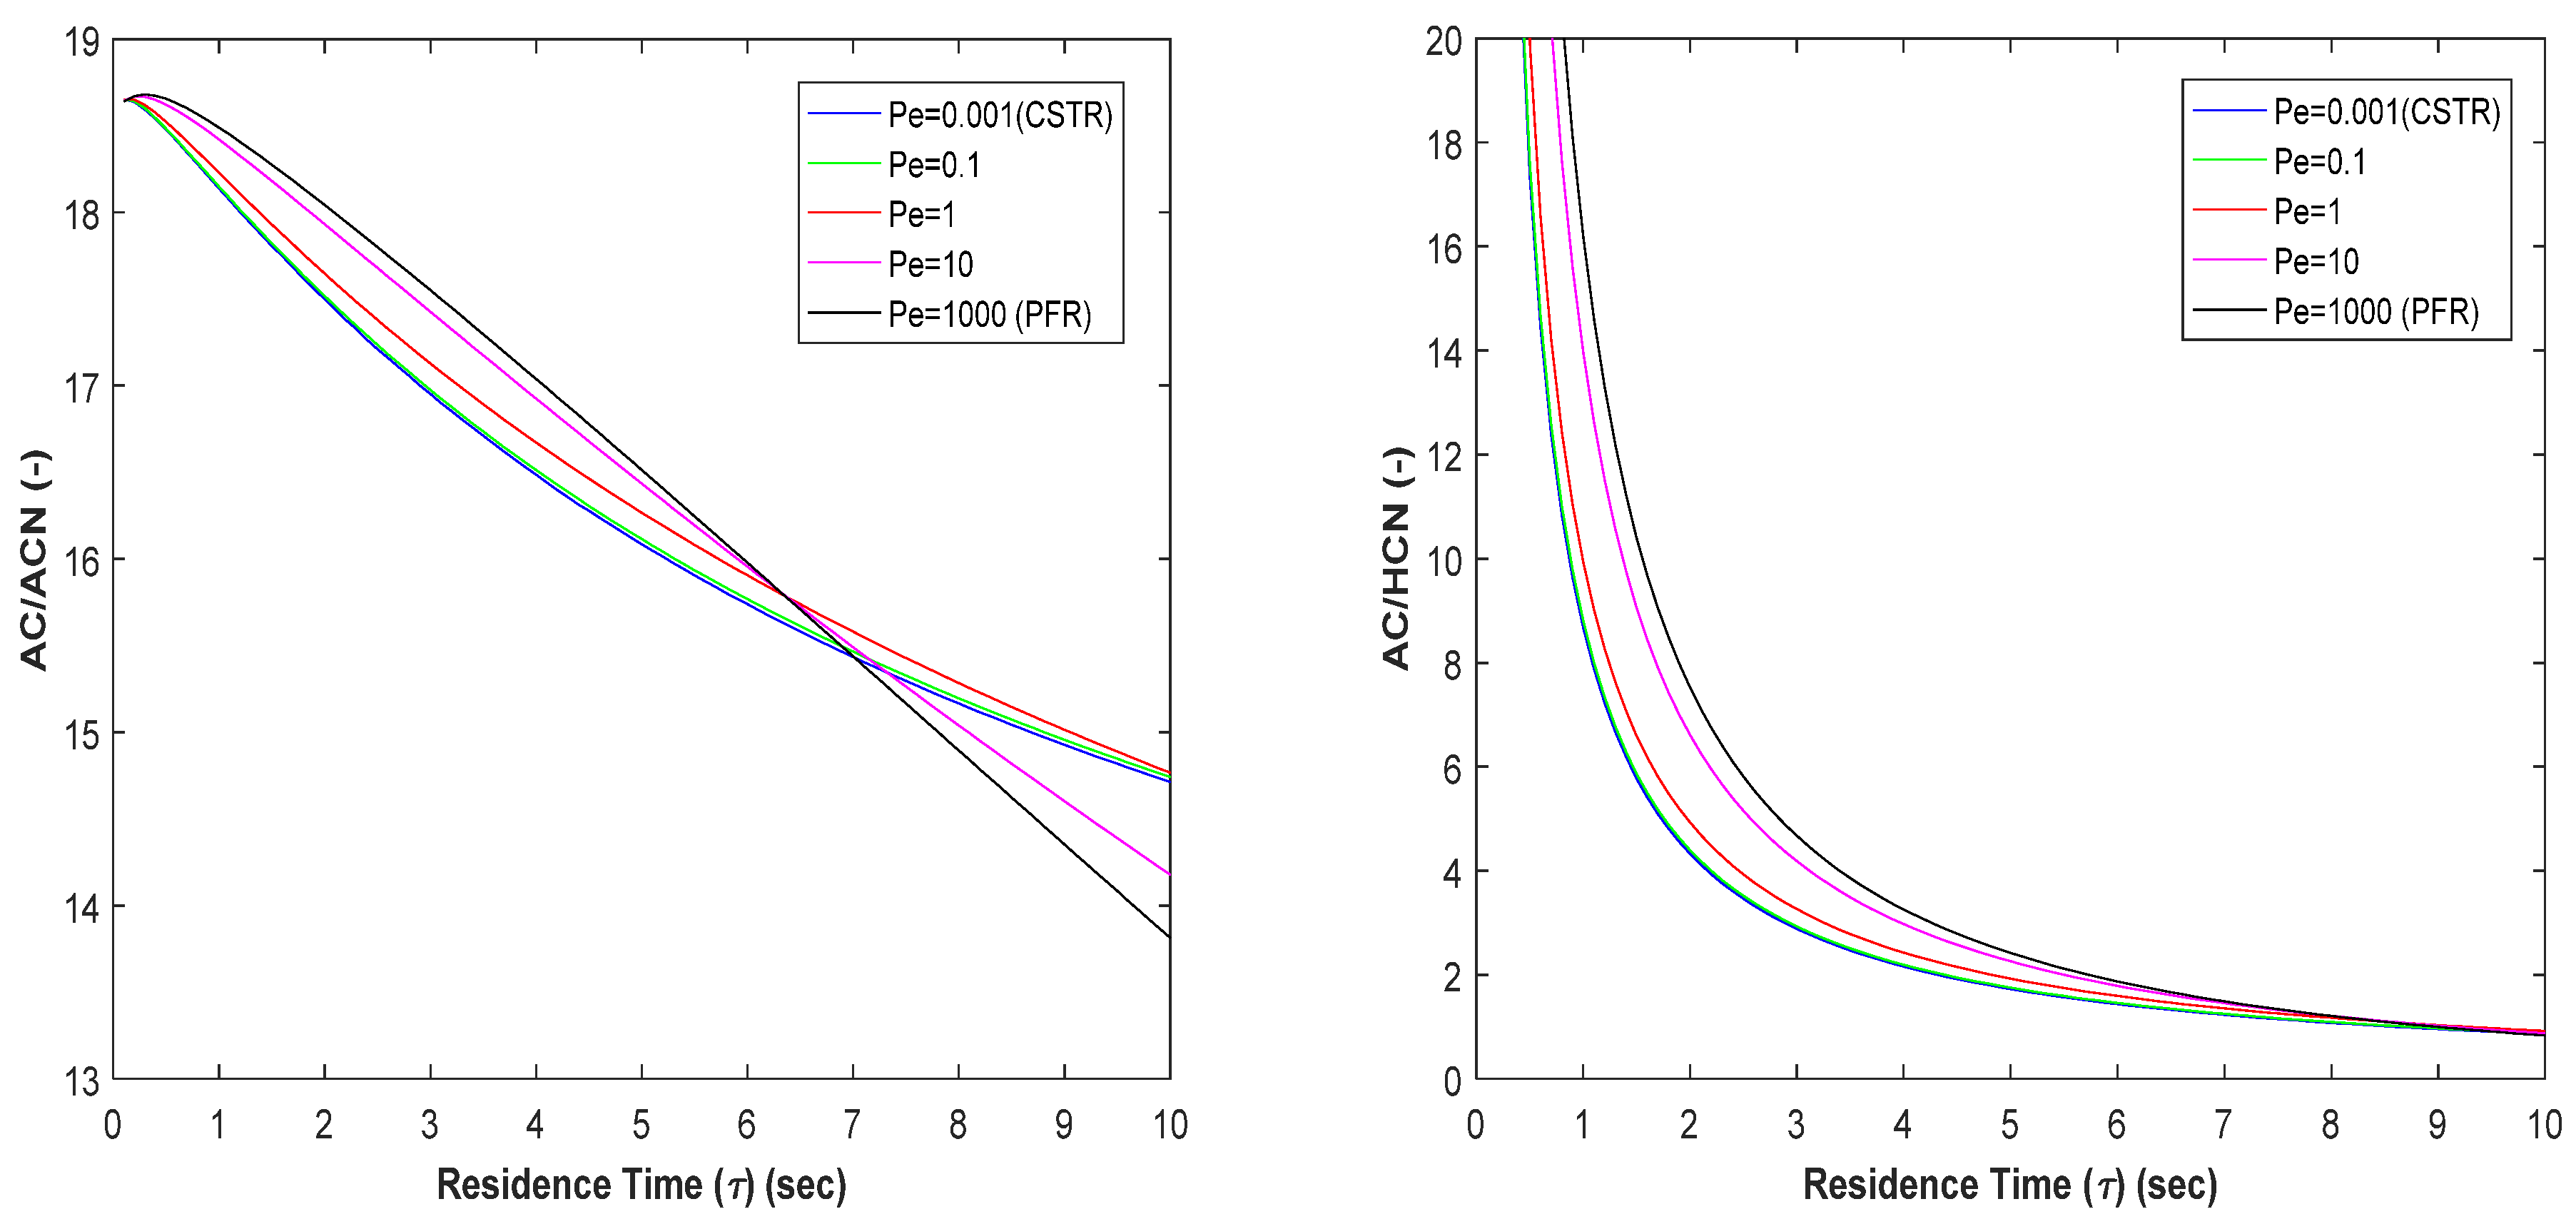
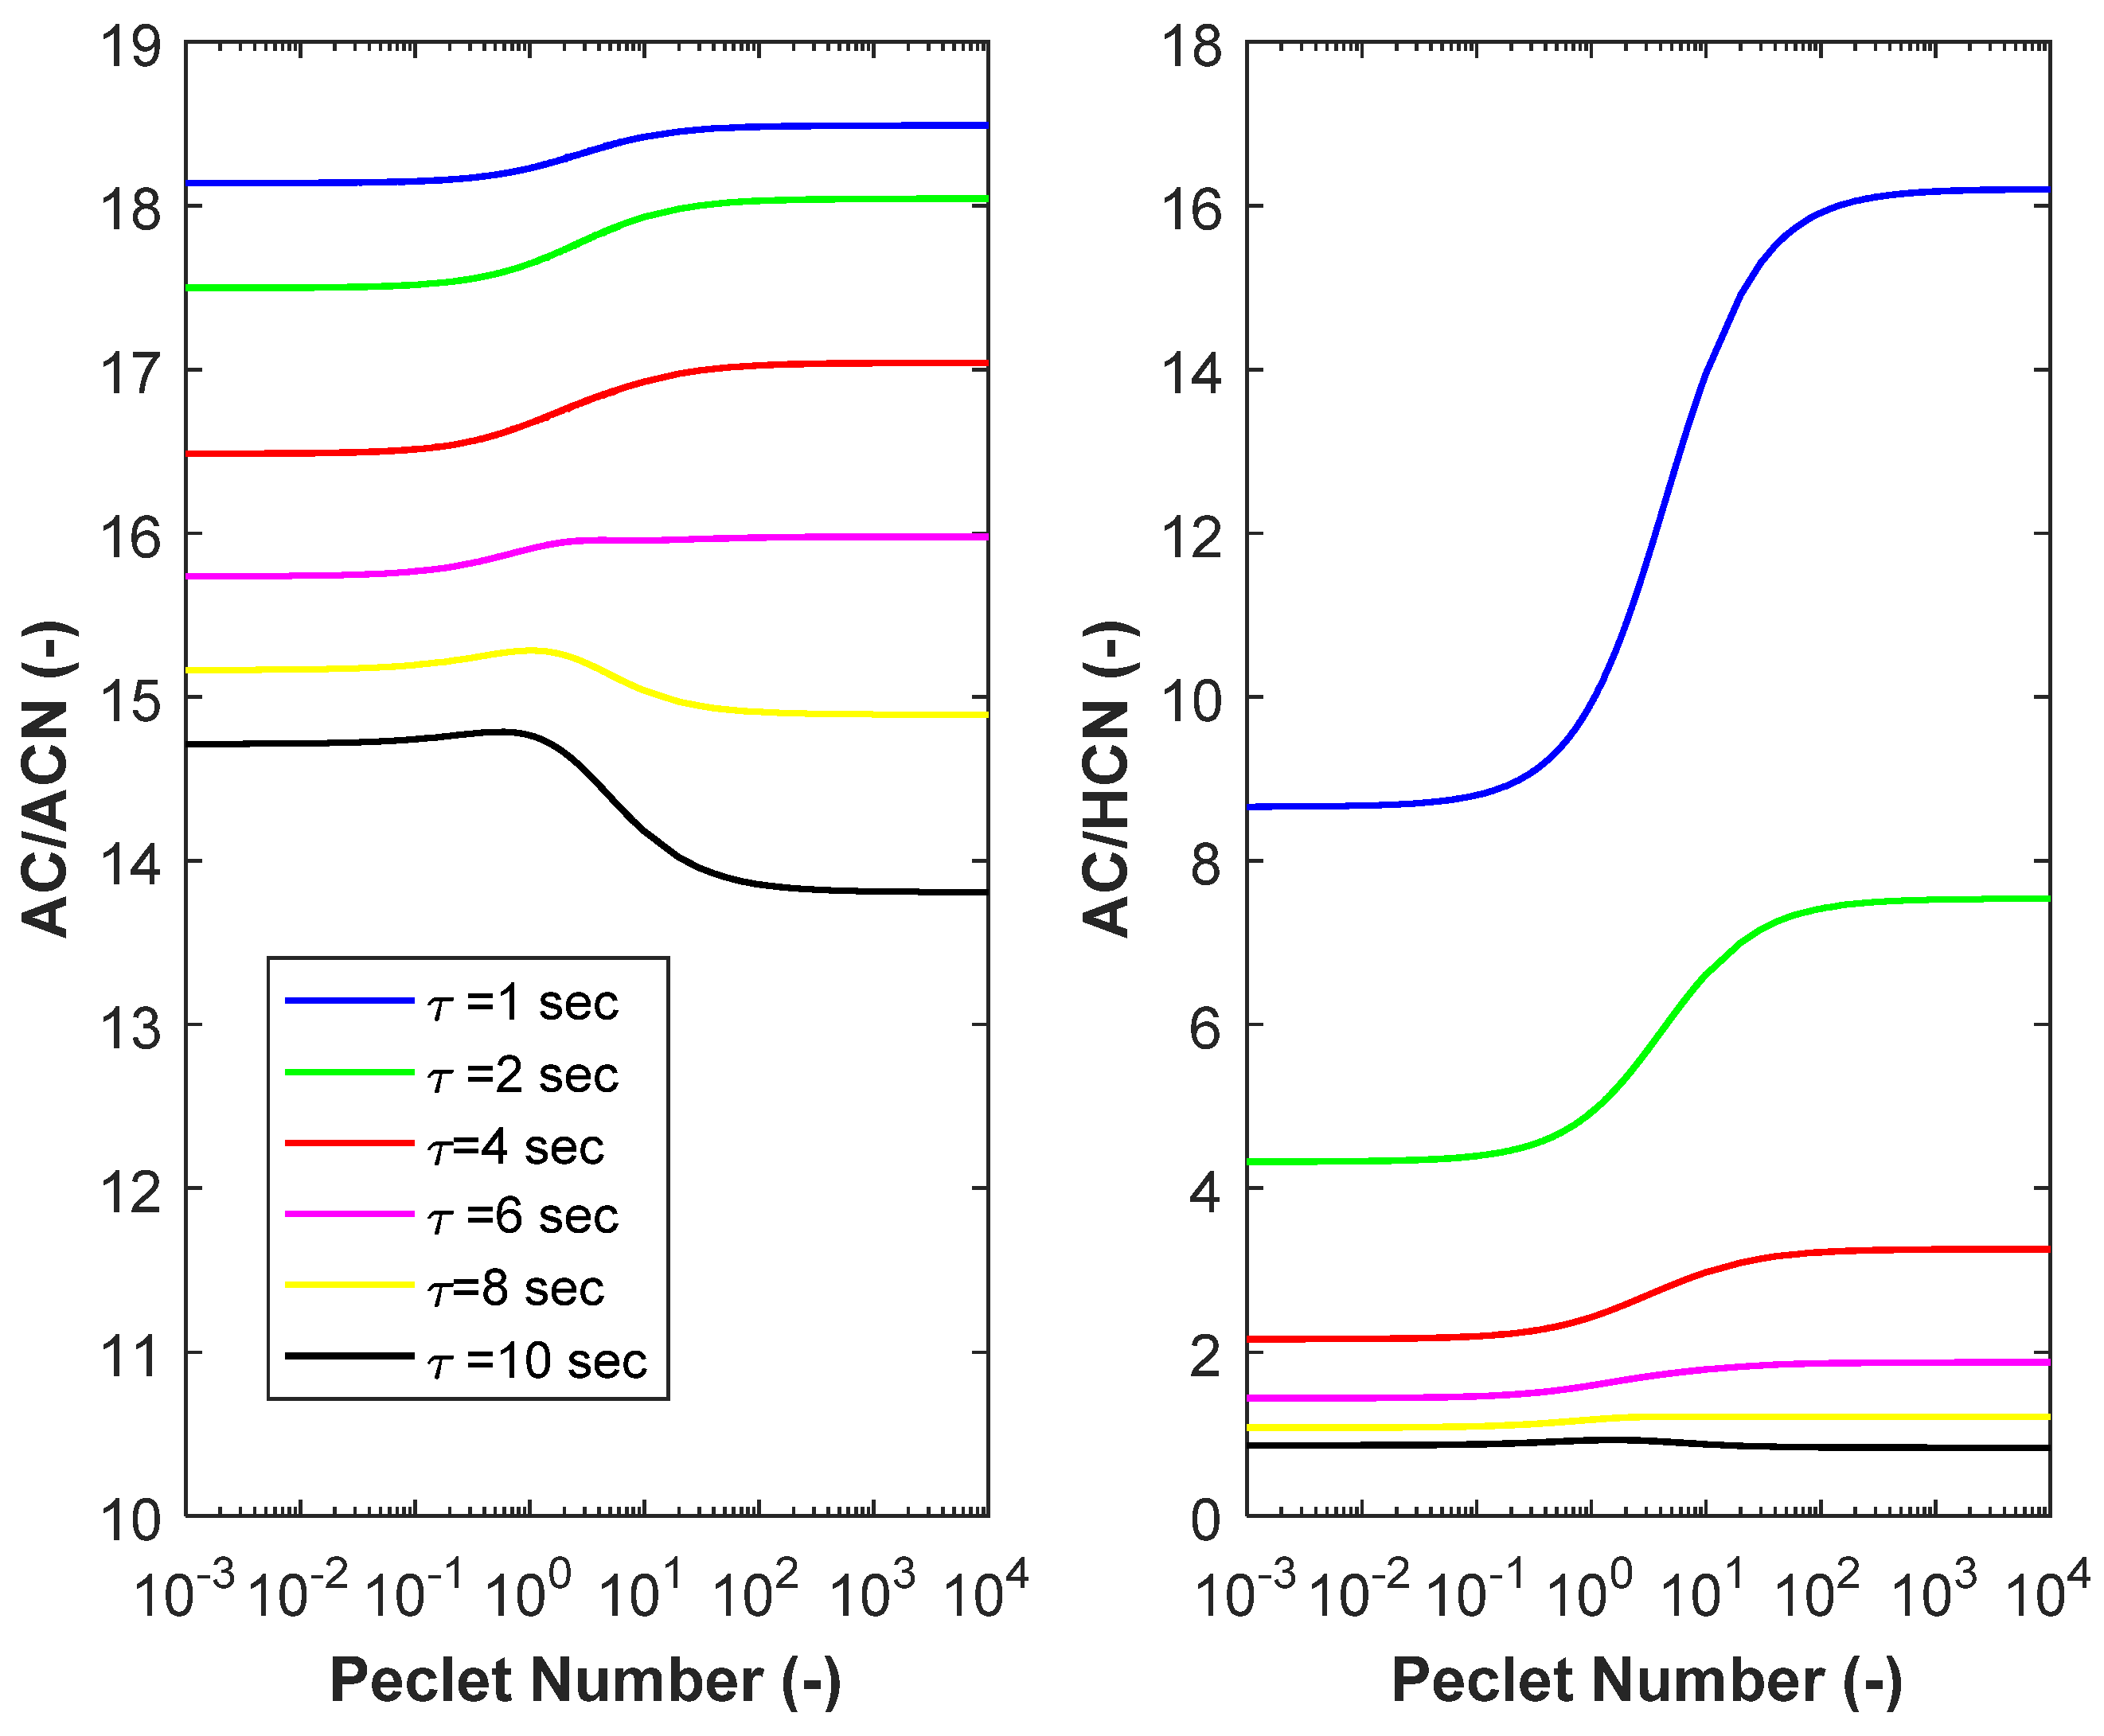
3.3. Product Selectivity, and
3.4. Comparison between and Predictions
4. Conclusions
Funding
Institutional Review Board Statement
Informed Consent Statement
Data Availability Statement
Conflicts of Interest
Nomenclature
| propylene, acrylonitrile, acrolein, acetonitrile and hydrogen cyanide | |
| concentration [gmole/m3] | |
| axial dispersion coefficient [m2/sec] | |
| E | activation energy [cal/gmole] |
| k | reaction rate constant [1/sec] |
| L | |
| N | number of CSTRs in series |
| r | reaction rate [gmole/m3 sec] |
| axial distance in the reactor [m] | |
| Greek Symbols | |
| λ | |
| τ | residence time [sec] |
| Subscripts | |
| refer to the ith species | |
| refer to the jth reactor | |
| L | effluent |
| th reactor | |
| initial | |
| Abbreviations | |
| axial dispersion model | |
| continuous stirred tank reactor | |
| potential environmental impact | |
| plug-flow reactor | |
| tanks-in-series model | |
| waste reduction | |
References
- Li, X.; Zhang, P.; Chen, G.; Wang, W.; Li, J. Waste minimization and efficient disposal of particles in optimized organic silicon production. J. Cleaner Prod. 2020, 242, 118445. [Google Scholar] [CrossRef]
- Cucciniello, R.; Cespi, D. Recycling within the chemical industry: The circular economy era. Recycling 2018, 3, 22. [Google Scholar] [CrossRef] [Green Version]
- Sepiacci, P.; Depetri, V.; Manca, D. A systematic approach to the optimal design of chemical plants with waste reduction and market uncertainty. Comp. Chem. Eng. 2017, 102, 96–109. [Google Scholar] [CrossRef]
- Lopez-Delgado, A.; Rabla, J.I.; Padilla, I.; Lopez-Andres, S.; Romero, M. Zero-waste process for the transformation of a hazardous aluminum waste into a raw material to obtain zeolites. J. Cleaner Prod. 2020, 255, 120178. [Google Scholar] [CrossRef]
- Levenspiel, O. Chemical Reaction Engineering, 3rd ed.; John Wiley and Sons: Hoboken, NJ, USA, 1999. [Google Scholar]
- Wen, C.Y.; Fan, L.T. Models for Flow Systems and Chemical Reactors; Marcel Dekker: New York, NY, USA, 1975. [Google Scholar]
- Shinnar, R. Use of residence and contact time distributions in reactor design. In Chemical Reaction and Reactor Engineering; Carberry, J., Varma, A., Eds.; Marcel Dekker: New York, NY, USA, 1987. [Google Scholar]
- Alvare, J.; Al-Dahhan, M. Liquid phase mixing in trayed bubble column reactors. Chem. Eng. Sci. 2006, 61, 1819–1835. [Google Scholar] [CrossRef]
- Turner, J.R.; Mills, P.L. Comparison of axial dispersion and mixing cell models for design and simulation of Fischer-Tropsch slurry bubble column reactors. Chem. Eng. Sci. 1990, 45, 2317–2324. [Google Scholar] [CrossRef]
- Chen, Q.; Feng, X. A pollution reduction methodology in reactor design. Chem. Eng. Process. 2005, 44, 13–21. [Google Scholar] [CrossRef]
- Kohlbrand, H.T. From waste treatment to pollution prevention and beyond: Opportunities for the next 20 years. AIChE Symp. Ser. 1998, 94, 117–121. [Google Scholar]
- Curzons, A.D.; Constable, D.J.C.; Mortimer, D.N.; Cunningham, V.L. So you think your process is green, how do you know?—Using principles of sustainability to determine what is green—A corporate perspective. Green Chem. 2001, 3, 1–6. [Google Scholar] [CrossRef]
- Brazdil, J.F. Acrylonitrile. In Ullmanns Encycl. of Industrial Chemistry; Wiley-VCH Verlag GmbH &Co. KGaA: Weinheim, Germany, 2012. [Google Scholar] [CrossRef]
- Cespi, D.; Passarini, F.; Neri, E.; Vassura, I.; Ciacci, L. Life cycle assessment comparison of two ways for acrylonitrile production: The SOHIO process and an alternative route using propane. J. Clean. Prod. 2014, 69, 17–25. [Google Scholar] [CrossRef]
- Karp, E.M.; Eaton, T.R.; Nogue, V.S.I.; Vorotnikov, V.; Biddy, M.J.; Tan, E.C.D.; Brandner, D.G.; Cywar, R.M.; Liu, R.; Manker, L.P.; et al. Renewable acrylonitrile production. Science 2017, 358, 1307–1310. [Google Scholar] [CrossRef] [PubMed] [Green Version]
- Wei, F.; Wan, X.; Hu, Y.; Wang, Z.; Yang, Y.; Jin, Y. A pilot plant study and 2-D dispersion reactor model for a high-density riser reactor. Chem. Eng. Sci. 2001, 56, 613–620. [Google Scholar] [CrossRef]
- Miracca, I.; Capone, G. The staging in fluidized bed reactors: From CSTR to plug-flow. Chem. Eng. J. 2001, 82, 259–266. [Google Scholar] [CrossRef]
- Basu, P.; Sett, A.; Gbordzoe, E.A.M. A simplified model for combustion of carbon in a circulating fluidized bed combustor. In FBC Comes of Age; Mustonen, J.P., Ed.; ASME: New York, NY, USA, 1987; pp. 738–742. [Google Scholar]
- Weiss, V.; Fert, F.N.; Helmrich, H.; Janssen, K. Mathematical modelling of circulating fluidized bed reactors by reference to a solids decomposition reaction and coal combustion. Chem. Eng. Process. 1987, 22, 79–90. [Google Scholar] [CrossRef]
- Lee, Y.Y.; HyppanIen, T. In FBC Technology for Today; Manaker, A.M., Ed.; ASME: New York, NY, USA, 1989; pp. 753–764. [Google Scholar]
- Shadiya, O.; Satish, V.J.; High, K.A. Process enhancement through waste minimization and multi-objective optimization. J. Clean. Prod. 2012, 31, 137–149. [Google Scholar] [CrossRef]
- MarketWatch (Press Release). Global Acrylonitrile Market Size, 2020 Market Share, Top Companies Report Covers, Definition, Share, and Regional Analysis by Key Players, Showing Impressive Growth by 2026. December 2020. Available online: https://www.marketwatch.com/press-release/global-acrylonitrile-market-size-2020-market-share-top-companies-report-covers-definition-share-and-regional-analysis-by-key-players-showing-impressive-growth-by-2026-2020-12-07 (accessed on 24 January 2021).
- Hopper, J.R.; Yaws, C.L.; Ho, T.C.; Vichailak, M. Waste minimization by process modification. Waste Manag. 1993, 13, 3–14. [Google Scholar] [CrossRef]
- Licht, R.B.; Vogt, D.; Bell, A. The mechanism and kinetics of propene ammoxidation over α-bismuth molybdate. J. Catal. 2016, 339, 228–241. [Google Scholar] [CrossRef] [Green Version]
- Hopper, J.R.; Yaws, C.L.; Ho, T.C. Pollution prevention by process modification: Reactions and separations. Waste Manag. 1994, 14, 187–202. [Google Scholar] [CrossRef]
- Danckwerts, P.V. Continuous flow systems, Distribution of residence times. Chem. Eng. Sci. 1953, 2, 1–13. [Google Scholar] [CrossRef]
- MATLAB. Version (R2020b); The MathWorks Inc.: Natick, MA, USA, 2019. [Google Scholar]
- Elgeti, K. A new equation for correlating a pipe flow reactor with a cascade of mixed reactors. Chem. Eng. Sci. 1996, 51, 5077–5080. [Google Scholar] [CrossRef]
- Kramers, H.; Aberda, G. Frequency response analysis of continuous flow systems. Chem. Eng. Sci. 1953, 2, 173–181. [Google Scholar] [CrossRef]
- Aris, R. End and beginnings in the mathematical modeling of chemical engineering systems. Chem. Eng. Sci. 1993, 48, 2507–2517. [Google Scholar] [CrossRef]
- Abu-Reesh, I.; Abu-Sharkh, B.F. Comparison of axial dispersion and tanks-in-series Models for simulating the performance of enzyme reactors. Ind. Eng. Chem. Res. 2003, 42, 5495–5505. [Google Scholar] [CrossRef]
- Rodriguez-Gomez, R.; Renman, G.; Moreno, L.; Liu, L. A model to describe the performance of the UASB reactor. Biodegradation 2014, 25, 239–251. [Google Scholar] [CrossRef] [PubMed] [Green Version]
- Fernengel, J.; Bolton, L.; Hinrichsen, O. Characterization and design of single pellet string reactors using numerical simulation. Chem. Eng. J. 2019, 373, 1397–1408. [Google Scholar] [CrossRef]
- Toson, P.; Doshi, P.; Jajcevic, D. Explicit residence time distribution of generalized cascade of continuous stirred tank reactors for a description of a short recirculation time (by passing). Processes 2019, 7, 615. [Google Scholar] [CrossRef] [Green Version]
- Montiel, J.I.P.; Montero, A.G.; Ramirez-Munoz, J. Comparison of different methods for evaluating the hydraulics of a pilot-scale upflow anaerobic sludge blanket reactor. Environ. Process 2019, 6, 25–41. [Google Scholar] [CrossRef]


| Reaction | Activation Energy (cal/mol) | Rate Constant at 470 °C (sec−1) |
|---|---|---|
| 1 | E1 = 19,000 | k1 = 0.40556 |
| 2 | E2 = 19,000 | k2 = 0.00973 |
| 3 | E3 = 7000 | k3 = 0.01744 |
| 4 | E4 = 7000 | k4 = 6.81341 |
| 5 | E5 = 19,800 | k5 = 0.16222 |
| 6 | E6 = 7000 | k6 = 0.07300 |
| Model | Conversion (X) | ||
|---|---|---|---|
| ADM | 1—yAL | ||
| TISM | 1—yAN |
Publisher’s Note: MDPI stays neutral with regard to jurisdictional claims in published maps and institutional affiliations. |
© 2021 by the author. Licensee MDPI, Basel, Switzerland. This article is an open access article distributed under the terms and conditions of the Creative Commons Attribution (CC BY) license (https://creativecommons.org/licenses/by/4.0/).
Share and Cite
Abu Reesh, I.M. Acrylonitrile Process Enhancement through Waste Minimization: Effect of Reaction Conditions and Degree of Backmixing. Sustainability 2021, 13, 7923. https://doi.org/10.3390/su13147923
Abu Reesh IM. Acrylonitrile Process Enhancement through Waste Minimization: Effect of Reaction Conditions and Degree of Backmixing. Sustainability. 2021; 13(14):7923. https://doi.org/10.3390/su13147923
Chicago/Turabian StyleAbu Reesh, Ibrahim M. 2021. "Acrylonitrile Process Enhancement through Waste Minimization: Effect of Reaction Conditions and Degree of Backmixing" Sustainability 13, no. 14: 7923. https://doi.org/10.3390/su13147923