Article

The Application of Advanced Mapping Methods and Tools for Spatial-Visual Analysis in Landscape Design Practice

Section of Landscape Architecture, Department of Urbanism, Faculty of Architecture and Built Environment, Delft University of Technology, 2628 BL Delft, The Netherlands
*
Author to whom correspondence should be addressed.
Sustainability 2021, 13(14), 7952; https://doi.org/10.3390/su13147952
Submission received: 18 June 2021 / Revised: 13 July 2021 / Accepted: 14 July 2021 / Published: 16 July 2021
(This article belongs to the Special Issue Visual Landscape Research in Sustainable Urban and Landscape Planning)

Abstract

:
Spatial design is at the core of landscape architecture. Mapping spatial–visual characteristics is of significance for landscape architects to interpret and talk about space. Advanced mapping methods and tools for spatial–visual analysis (i.e., mapping techniques describing landscape architectonic compositions from both qualitative and quantitative perspectives) offer great potential to increase knowledge of spatial organization and reveal design principles. Despite the availability and wide range of possibilities, the application of advanced mapping methods and tools for spatial–visual analysis is still not common in landscape architecture. The main reasons include the lack of awareness and prejudice. In order to get a more detailed understanding of the problem, this study presents the outcome of semi-structured open-ended interviews with 11 practitioners with a design background in landscape architecture. The paper discusses the relevance of advanced mapping methods and tools with practitioners in order to gain a better understanding about what methods landscape practitioners use to describe and experience space in their daily work. Findings demonstrate the critical bottlenecks of implementing advanced mapping methods in daily practices and how the practitioners think about the implementation of advanced mapping methods in the future of landscape practices.

1. Introduction

Landscape architecture is defined as the design of outdoor areas, landmarks, and structures to achieve environmental, social–behavioural, or aesthetic outcomes [1]. Landscape design provides a physical, functional, symbolic, and aesthetic arrangement of corporeal and non-corporeal aspects, and results in form and a perceptual experience of a space [2]. Landscape designers manipulate space creation in terms of three-dimensional architectonic compositions and visual qualities (in short: spatial–visual characteristics) as a skeleton of the landscape and in such a way that they can become spatially effective to meet the desires of the user and the conditions of the site [3]. As a potential solution for describing landscape spaces, advanced spatial–visual mapping methods are a valuable medium to associate information and visualise it for purposes of understanding complex and abstract knowledge of space and fulfil the spatial–visual narratives of landscape [4].
Liu and Nijhuis (2020) identified six categories of advanced methods and tools for spatial–visual analysis that are useful in design research (Figure 1) [5]:
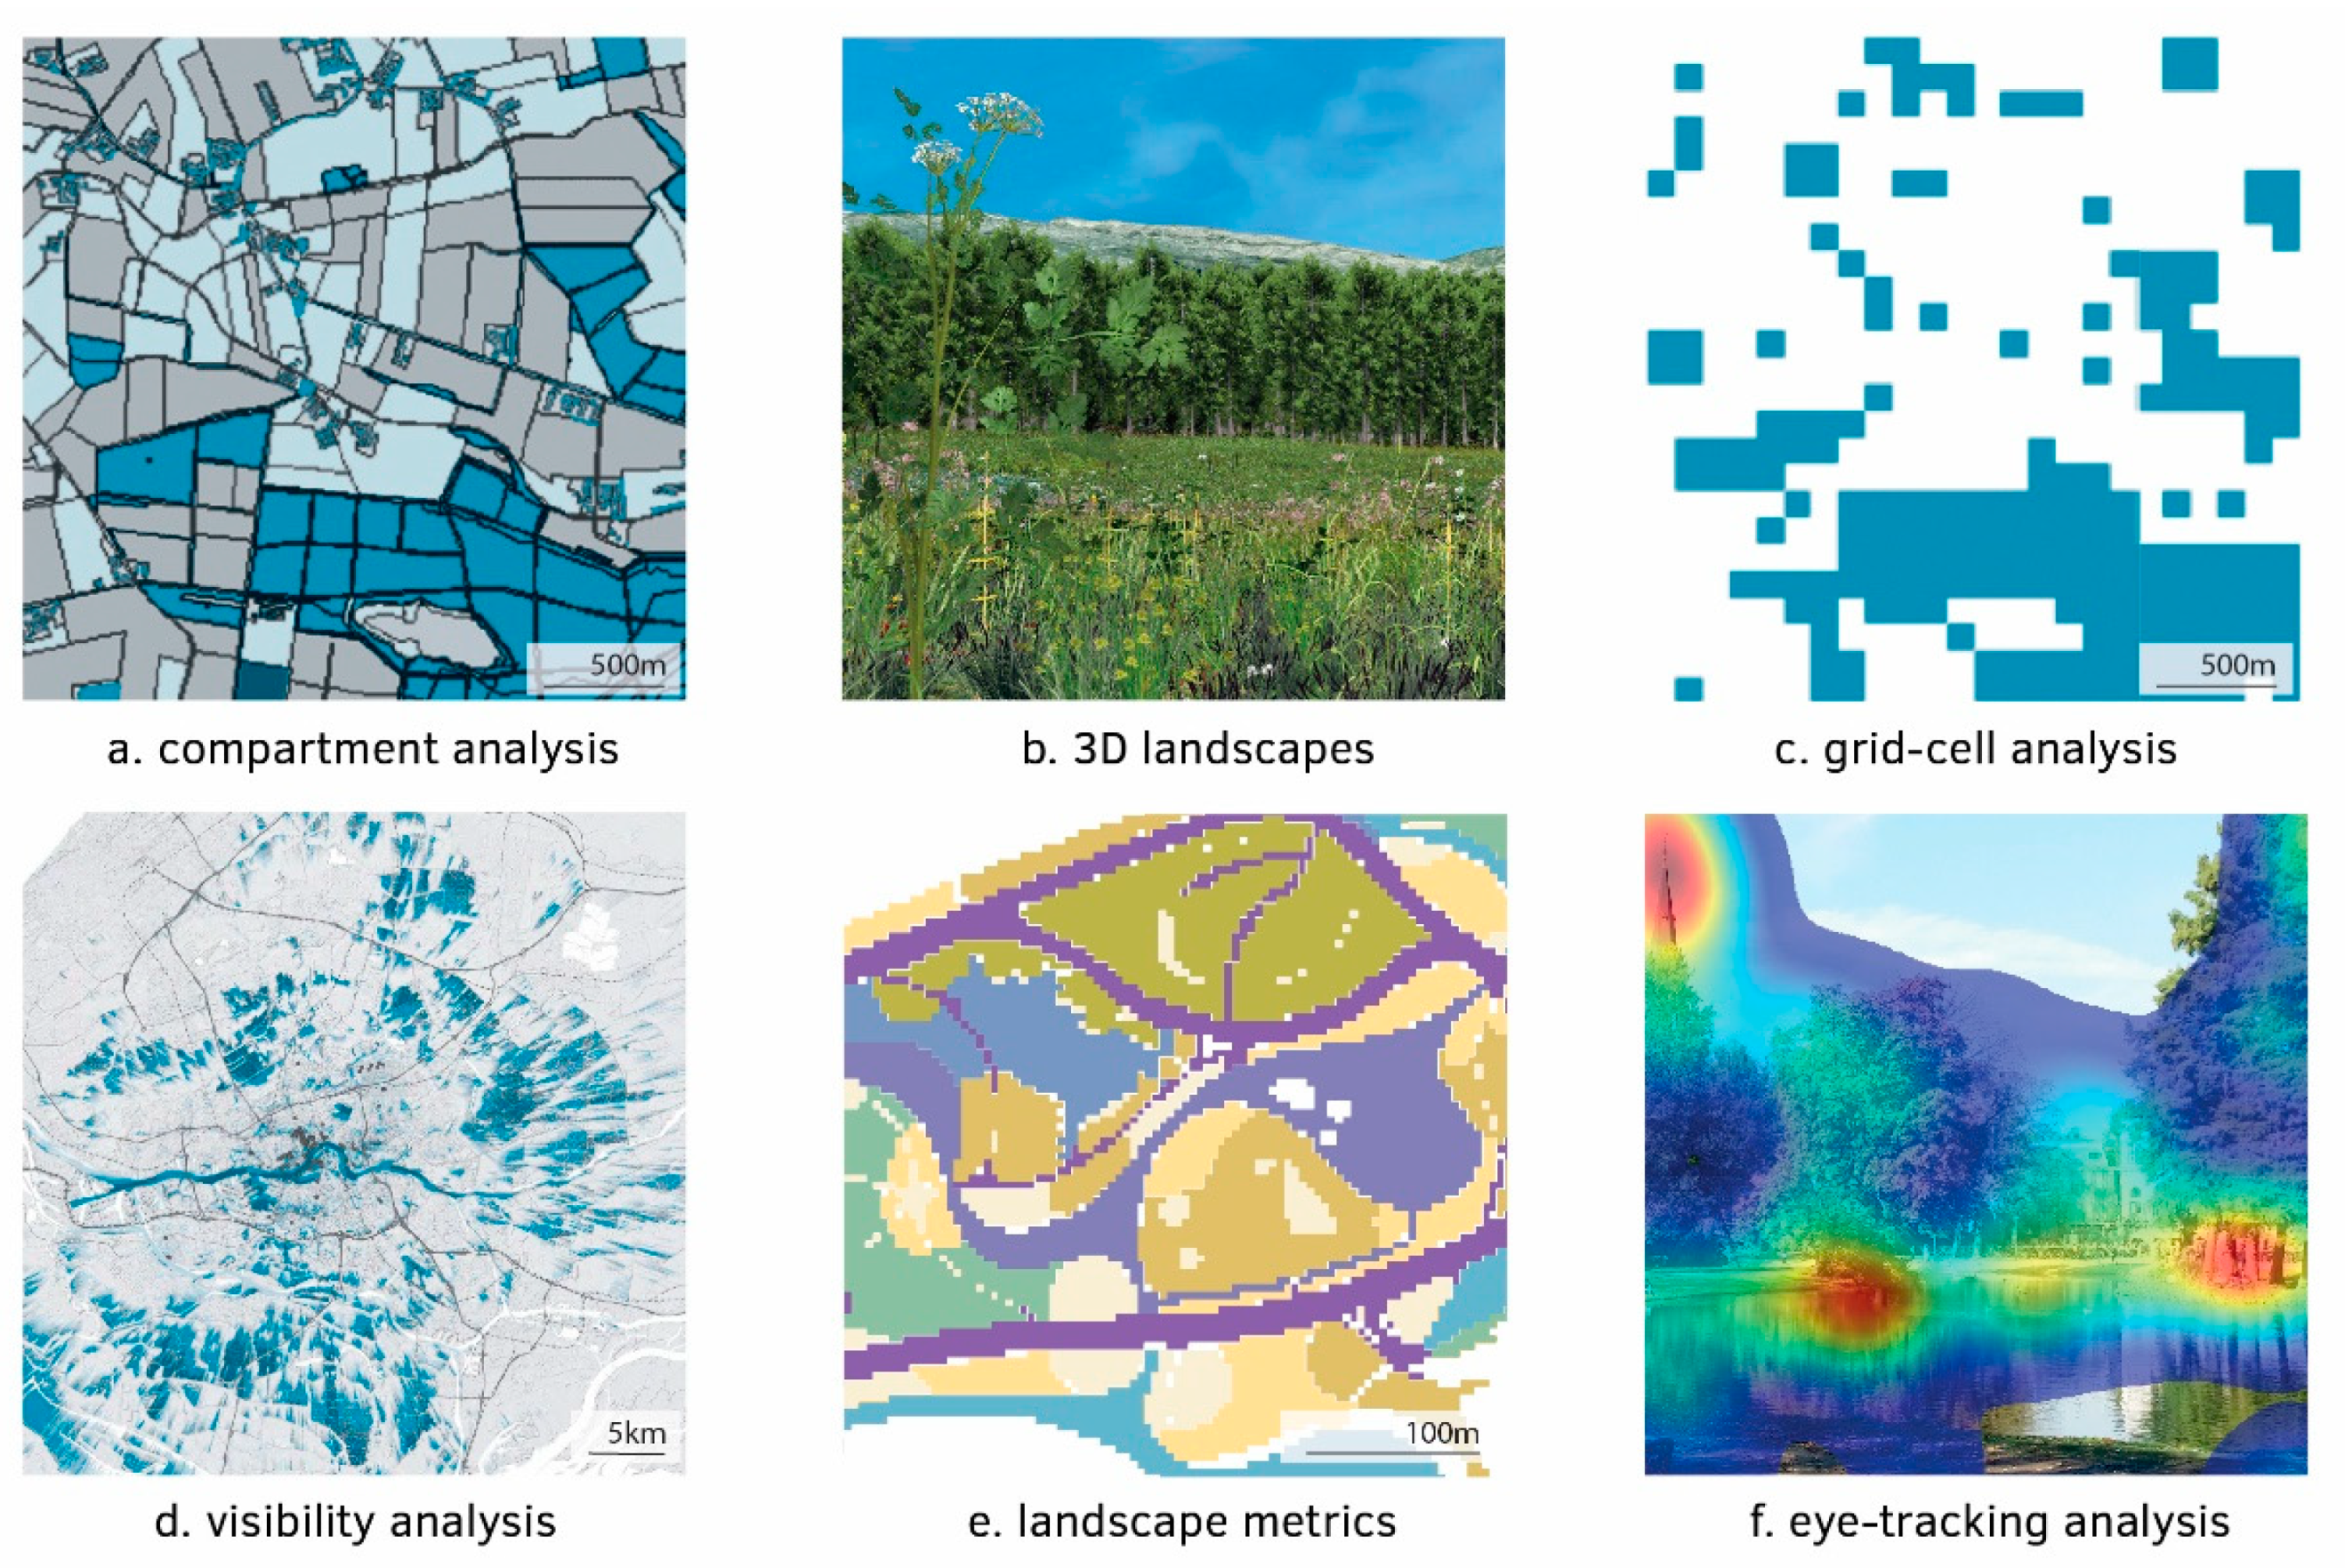
  • Compartment analysis considers the visible landscape as a set of concave compartments and the maps are used to distinguish the relationship between space and mass from a vertical perspective;
  • 3D landscapes identify the visual landscape from an observer’s point of view, which utilises two- to three-dimensional visualisations and addresses spatial–visual characteristics horizontally;
  • Grid-cell analysis evaluates the landscape by calculating different spatial properties by means of grid-shaped polygons or raster cells;
  • Visibility analysis is a three-dimensional visibility calculation based on raster analysis, which shows the geographical area visible from a given position from the observer’s perspective;
  • Landscape metrics conducts a spatial analysis of land-use patches in landscape ecology, which quantifies potential metrics of landscape compositions and configurations vertically via raster or vector;
  • Eye-tracking analysis is a system that records eye movements and fixations while observing scenes in situ to interpret spatial–visual characteristics.
These advanced methods and tools, mainly digital and inter-subjective (i.e., both objective and subjective), can help to reveal spatial constructions and visual manifestations of landscape spaces, such as a spatial sequence, the opening of a landscape panorama, or the production of optical illusions. Though recognised as a useful tool for mapping and planning in landscape academia, the potential of these advanced mapping methods is often underutilised in landscape architecture practice due to a lack of awareness and prejudice [9]. Hence, to break down barriers of using advanced mapping methods for spatial–visual analysis in the practice of landscape architecture, this paper presents the outcome of semi-structured open-ended interviews with 11 practitioners with a design background in landscape architecture to get more detailed knowledge of the problem. The paper discusses the relevance of advanced mapping methods and tools with practitioners in order to gain a better understanding of the methods they use to describe and experience space in their daily work, as well as to find out the critical bottlenecks of implementing advanced digital mapping methods in their daily practices and how they think about the implementation of advanced mapping methods in the future. This paper does not provide conclusive answers but paves the way to more in-depth studies.

2. Methods and Materials

2.1. Interview Design

A semi-structured interview was employed for this study to collect information and communicate ideas with 11 practitioners from various positions within the field of landscape architecture in terms of the role of advanced mapping methods and tools across professional boundaries. A free-flowing interview framework with predetermined open-ended questions was prepared to allow the interviewees opportunities to fully express their thoughts and clarify their answers [10,11]. The interview sought to capture the following main themes: (1) the mapping methods and tools used by professionals in their daily work; (2) their knowledge of advanced mapping techniques, mainly digital and quantitative mapping methods and tools; (3) the perspectives of implementing advanced mapping methods and tools for spatial–visual analysis; and (4) the outlook of mapping landscape space in future landscape practices. The interviews were undertaken one on one and audio recorded, taking place between May 2019 and August 2019. Each interview started with an introduction of the research background. All the interviews were initiated with the five key questions arrayed without any leading position (Table 1). The interviewer directed the conversation to cover the main themes and could have asked probing questions to verify the interpretation of answers [12].
In case not every interviewee was familiar with the availability of advanced mapping methods and tools, representative examples were shown beforehand to provide an intuitive idea about how these mapping methods and tools had been used to describe landscape spaces. The three selected examples, as ideal landscape architectonic design cases, were well known by landscape/urban practitioners around the world. The creation of these spaces effectively employed rich spatial–visual design principles (e.g., the concealment of boundaries, the illusion of endless water bodies, spatial sequences, and continuous views). Thus, implementing advanced mapping methods and tools to conduct spatial–visual analysis based on these examples made it possible for the interviewees to comprehend the validity, capacity, and accuracy these techniques can provide.
The Piazza San Marco (Venice, Italy), famous for its serial vision through the articulation of space, was used as an example for the analysis of an urban landscape space surrounded by buildings. Isovist analysis was applied to explore the spatial–visual impact of the bell tower based on a sequence of viewpoints. Stourhead (Wiltshire, UK), famous for its framed pictorial views, was used as an example for the analysis of a space designed mainly with vegetation and relief. The application of vertical visibility analysis was for studying the composed foreground, middle ground, and background determined by the specific visual angles and the length of the sightline. Vondelpark (Amsterdam, the Netherlands), well known for its spatial sequence, was used as an example to showcase the creation of an internal-oriented urban park with a rich sequential experience. Grid-cell analysis was implemented to demonstrate these spatial–visual characteristics at eye level along specific routes (Figure 2).

2.2. Interviewed Professionals

Since the interview was to focus on the uses of mapping methods and tools in terms of the spatial–visual analysis of a landscape, the actors of interest for collecting interview data were practitioners with a design background. A list of potential interviewees was put forward in discussion among the co-authors, and then for further extension snowball sampling methods (i.e., a sampling method in qualitative research, in which one interviewee names more interviewees) was utilised to encompass experts from different branches of landscape practices [13]. The constraints of time and finances did not allow a large number of interviewees to be interviewed. Taking the diversity of working scopes into account, the final sample contained 11 interviewees, including five landscape architects from design firms; two public servants from the municipal and provincial government, respectively; three researchers/educators from universities who provide consulting services to the government; and one interviewee from a third-party consultancy agency (i.e., a national institute providing strategic policy analysis of environment, nature, and spatial planning issues). They were asked for their perspectives on the daily application of mapping methods and tools for spatial–visual analysis, as well as their attitudes towards using advanced mapping technology in their professions (see Appendix A for details).

2.3. Interview Analysis

Discourse analysis, as a method of studying interview data, was used to organise and summarise the qualitative information. It is an approach applied to concentrate on contextual meanings of the entire conversation instead of paying attention to certain words and phrases. Discourse analysis, surpassing the dichotomy between subjective meaning and objective reality, focuses on the interpretation of interviewees’ responses in relation to their social and practical contexts [11]. All the interview audios were transcribed into texts and documented in Atlas.ti v.9.0.24 for analysis. To structure the results, the interviewees’ responses were gathered and categorised according to the similar central ideas, highlights, and prominent points that were deemed most relevant. By careful replaying of individual in-depth interviews, coding was conducted in terms of themes and specific points, and then presented in a summary form. Thus, 169 specific codes within eight main categories of information emerged through the interviews. The following sections thoroughly present the categories listed below. Statistics and interpretation of the codes are elaborated together with illustrative quotations consolidating the subjects.
(1)
Mapping methods and tools used in their daily work;
(2)
Purposes of using specific/multiple mapping techniques;
(3)
Roles of the applied mapping methods and tools (i.e., analytical/creative/evaluation tools);
(4)
Scale at which the mentioned mapping techniques are used;
(5)
Attitudes towards an advanced mapping toolbox (responses to the representative examples shown by the interviewer);
(6)
Advantages of advanced mapping methods and tools;
(7)
Weakness of advanced mapping methods and tools;
(8)
Further recommendations about the implementation of advanced mapping methods and tools.

3. The Status Quo of Mapping in Landscape Practices

3.1. Mapping Methods and Tools Applied in Landscape Practices

Landscape practitioners applied various kinds of mapping methods and tools to understand and represent spatial issues in their daily work (Table 2). Throughout the transcripts, five interviewees mentioned using hand-drawn maps/sketches as the main mapping methods to test design ideas. These conventional mapping methods can effectively achieve dynamic design intentions and an instantaneous realisation of design concepts. They are still the operative ways to express creativity during the design process at both regional-scale and local-scale landscape planning and design projects.
As for the digital mapping techniques, almost every interviewee mentioned using landscape visualisation to show 3D perspectives of spatial organisation and quality, including the landscape modelling software SketchUp, Revit, Rhino, and Lumion. To address the complex landscape projects with multidisciplinary approaches, 10 interviewees, either from design industries or academia, referred to GIS techniques that had been directly and/or indirectly implemented in their daily work. Over 50% of the mentioned mapping applications based on GIS (e.g., ArcGIS, QGIS) were to analyse natural conditions, such as landforms, ecological effects, and hydrological simulations of the sites at large-scale rural/urban landscape planning projects. These approaches provide ex-ante descriptions of the present or ex-post evaluations of the design interventions. These analytical mapping methods efficiently help designers and planners gain specific knowledge, foresee problems, and identify spatial potentialities of the sites. A few interviewees also mentioned some advanced mapping methods they had not used but had heard of being employed in the field of landscape architecture. Five interviewees, two from design firms and the others from academia, passionately talked about point cloud models (i.e., high-level precision 3D models produced by LiDAR scanners or by photogrammetry software), which can offer more precise simulations of reality and future design interventions. Furthermore, interviewees working in government sectors said they make use of other distinct types of mapping methods, such as photos, VR devices, and data animation platforms, for visual representation and communication during the participation process. Front-end equipment (e.g., GPS, sensors, drones) to collect data applicable for analysing and visualising spatial compositions were indicated to a small extent.
The specific subjects these mapping methods applied to were also analysed, and were categorised into three main groups: (1) spatialising certain landscape/environment properties, such as air-quality map, soil map, habitat map, noise map; (2) mapping landscape architectonic compositions, for example, the openness of space, spatial experience, visual variety, the orientation of a route, etc.; and (3) measuring and visualising the effects of spatial organisation, including viewshed analysis, ecological sensitivity analysis, flood-risk analysis, etc. (Table 3).
Mapping, compiling, and formulating information into a representative image is used by professionals for all types of subjects throughout the process of landscape planning and design projects. The interview results showed that in the field of landscape architecture, the application of mapping methods plays an important role as (1) ex-ante analytical tools to understand site conditions, (2) design tools to spatialise and visualise design ideas, and (3) ex-post-evaluation tools to test the effectiveness of the design interventions. They showcase the broader analytical, generative, and evaluative effectiveness of describing and communicating space in a practical way, which enables both practitioners and researchers to gain a better understanding of landscape and make changes and refinements to the proposed design interventions accordingly (Figure 3).

3.2. Mapping as a Design Tool

Conventional mapping methods for operationalising landscape include hand-drawn maps, sketches, and schematic diagrams. These methods are powerful tools for describing, interpreting, and polishing landscape characteristics in real time to realise a designer’s creation of the space [14]. Many practitioners mentioned that, nowadays, even though more and more digital mapping techniques are used in their day-to-day work, hand-drawn maps and sketches are still fundamental and are the primary way to understand and represent design ideas.
“As designers, the way we depict space is actually quite primitive, automatic, like a child, without much consciousness. Drawing is definitely very helpful. The mechanism of design always starts from some abstraction/intuitive feeling/approximation of the space and changes all the time. Thus, through the design, you make the line while you evaluate and elaborate the line as well. The mapping technique is not just the means for representation, but an instrument to develop your thinking and the whole process of invention within the design process itself” (transcript of an interview with an urban designer).
These instantaneous drawings can effectively describe visible objects but also evoke the intangible experience of space [15,16]. The idea of using hand drawings to convey a thought is due to the iterative and dynamic process of design thinking. Relying on professional knowledge and experience, designers tend to use selective elements to express the core of the design idea without unnecessary detail. The combination of multi-dimensional mapping approaches, such as bird’s-eye view plans, schematic diagrams, sections, and section elevations, as well as perspective views, are helpful for designers to gain a comprehensive overview of the space (Figure 4). Thus, most of the landscape practitioners interviewed in this study considered traditional hand-drawn mapping approaches to be more easily used than digital mapping methods to explore alternatives and test ideas.
Nevertheless, some practitioners are eager to apply and explore advanced mapping methods to interpret spatial landscape characteristics and effects in order to understand site conditions and guide design decisions. For example, an initial measurement through preliminary viewshed analysis was brought up in the study, showing how a high-rise building adjacent to the Green Heart of the Randstad in Zuid Holland (The Netherlands) would influence people’s perception of openness. Moreover, GIS-based visibility analysis was mentioned throughout the interviews. This method helps to identify proper vista points, and provided better visual interfaces during the design and planning of a rural forestry park in China. Measurements through GIS terrain models are also partly applied in city-scale urban design and planning projects, mainly for the analysis of factors such as geomorphology, site suitability, flood risk. These mapping outcomes effectively provide precise and scientific clues for landscape architects/planners to understand spatial attributes and guide design interventions during the generative process.
To sum up, traditional mappings, especially those done by hand, are still the most common means of representing design thinking because of their fluidity and flexibility to test and represent interventions during the design process. Only a few attempts using advanced mapping methods are applied to help practitioners understand site contexts and identify spatial challenges precisely. To gain a comprehensive description of landscape space, it is worthwhile to merge descriptive and data-generated mapping methods together in order to fulfil the narrative inter-subjectively from a design perspective.

3.3. Mapping as Representation and Communication Tools

In landscape design and planning practices, practitioners rely on a variety of performative visualisations to simulate and communicate design and planning ideas. Visual representation tools were mentioned frequently by the interviewees, for example, 3D modelling/rendering and photorealistic collages. These mapping methods and tools can effectively show how landscape practitioners read space and understand spatial characteristics, such as the volumes and compositions of spatial elements, and the relationship between landscape structures and the surrounding environment. Today, innovation in mapping approaches is thriving; real-time interactive presentations and virtual reality (VR) environments are tentatively being put into action, and are helpful for mimicking and presenting existing or future landscape realities in an immersive way [19]. Moreover, the implementation of data visualisation techniques and the current state-of-the-art functioning of GIS technology show great potential for illustrating the relationship between spatial information and different types of global data (e.g., energy flow data, tourism data, migration flow data); they also display real-time changes.
“In the project of Atelier 2050—An energetic Odyssey, a large amount of data is mapped and shown through an animation of 15 mins and illustrated via Dreamweaver, which includes maps of depths, maps of shipping routes, maps of designated natural areas, maps of coastal times, maps of migrating birds of the North Sea, maps with oil and gas infrastructure, and the rigs on the north, but also the pipes under the North Sea etc” (transcript of an interview with a landscape architect).
These evocative and vivid mapping techniques have been mainstreamed in the fields of landscape architecture, urban design, and urban planning for many years [20,21,22]. As representation and communication instruments, they are predominantly used to integrate scientific knowledge, narrate a story, and implement collaborative planning and design approaches. Knowing how well these illustration tools can function, two interviewees simultaneously mentioned they had started to become somewhat tired of over-developed, rendered images. Increasingly, design offices and educational institutions are emphasising the interpretation of spatial–visual characteristics via the use of concise illustrations that are more artistic and tangible (Figure 5).
In order to communicate with experts, major progress in the visual representation of mapping approaches has enabled interactive sharing and participatory collaboration with different stakeholders and the public in both urban/landscape design and planning projects (Figure 6). For instance, 3D landscapes are commonly used to model spatial–temporal climate scenarios in local planning and to effectively enable public participation in landscape management. In addition, a virtual reality model applied in the NDSM project (Amsterdam) promotes communication between the municipality and developers to evaluate and modify the design plan in order to keep its value as national heritage and meet the requirements of a vibrant urban neighbourhood. Most of these examples focus on inter-subjective knowledge and representation transfer and achieve effective landscape–human interaction.
“In stakeholder participation or the public process, the composition of people and learning preferences are quite diverse; therefore it is best to provide various mapping media and different formats so as to meet different needs. Laymen (i.e., the public without detailed knowledge of relevant professions like landscape architecture, urban design, cartography, or geography) have problems reading maps, thus it is better to have 3D models or landscape visualisation with simplified information and present one after another, while for the experts, maps with a high density of information is much more preferred” (transcript of an interview with a professor from academia).
Landscape practitioners from the authorities and consultancy services, especially the younger generations, have employed advanced mapping methods (e.g., space syntax, landscape metrics, and eye-tracking analysis) in a few projects to explore topography, land habitats, land use, user behaviours, etc., in order to get scientific and accurate information about the space. These applications mostly link measurement, spatial description, and performance of landscape transformation together to address planning and policy-oriented landscape issues related to agricultural, ecological, and urban sustainability. As exemplified, these advanced mapping approaches are generally used in larger-scale projects to gather information; however, they are not interactive enough to layer different information to enable everybody to collaborate.
To sum up, it is important for practitioners to involve visual representation/communication techniques to capture and spatialise the qualities of landscape space [27]. The different mapping methods and tools mentioned above (e.g., 3D modelling, photo collage, VR, and GIS) have the power to provide persuasive visualisations of proposed landscape scenarios or representations of specific landscape characteristics. All these applications are helpful to achieve effective communication among designers in the creative design stage, but also inspire audiences and sell ideas in participatory landscape management and planning processes.

4. Strengths and Weaknesses of Advanced Mapping Methods and Tools

4.1. Raising Awareness of Spatial–Visual Characteristics

Providing brief examples of the application of advanced mapping methods and tools to examine and understand landscape positively increased the interviewees’ awareness of spatial–visual characteristics in landscape practices. As the examples demonstrated, using advanced mapping methods to explore the spatial–visual mechanism of these 19th-century monumental urban/rural landscapes enables landscape practitioners to gain scientific insights in the form and functioning of landscape spaces in order to become more conscious about fundamental spatial–visual aspects relevant to landscape design.
To complement the conventional mapping approaches, which are helpful for translating abstract design concepts into landscape forms, advanced mapping methods involving measurements and representations offer extra possibilities to explore spatial features and visualise them in a more inter-subjective way. Some interviewees mentioned that nowadays in many circumstances, landscape practitioners must deal with problems from multiple subjects at the same time, such as functional requirements from different stakeholders, current fashion trends, and aesthetic preferences of the users. Being overwhelmed by these kinds of tasks results in a lack of sufficient consideration about spatial compositions and visual experiences, which are of fundamental importance during the process of landscape design.
“People have common sense during the understanding of space unconsciously. Because they are looking to ‘the same/objective’ objects, the same spaces, and the same measurements. Designers have to develop their own preferences with empathy for understanding what they know from the observers and help them to see by making an interpretation of what are the most important elements in the drawing” (transcript of an interview with an urban designer).

4.2. Data, Information, Knowledge, Design

A few interviewees mentioned the Data, Information, Knowledge, and Wisdom (DIKW) pyramid: “Information is defined in terms of data; knowledge in terms of information; wisdom in terms of knowledge”. The essence of landscape architecture is about gaining knowledge from various types of data and information, and then interpreting and converting it into design interventions [28,29]. The interviews revealed that landscape practitioners normally do not directly use raw data (i.e., primary data are not processed as maps), instead using generated data (i.e., data derived/post-processed from raw data, for example a ready-made soil map, an urban green-space map). They use mapping approaches to process and organise data in terms of initial analysis and model construction to explore additional knowledge and insights about landscape architectonic compositions. Based on the practitioners’ specialties and practical experiences, these internalised forms of knowledge can be transformed into design wisdoms evaluating and refining design proposals [9] (Figure 7).
As shown by the examples, advanced mapping approaches merge design thinking into data-generated mapping methods and attempts to explore integrated possibilities to describe landscape spaces inter-subjectively. In the second representative example, GIS elevation data were used to create a digital terrain model of Stourhead to conduct visibility analysis, which aimed to explore the layers of landscape architectonic compositions from certain viewpoints. The application of advanced mapping methods shows great potential for landscape practitioners to connect the data, information, knowledge, and design approaches, enhancing the advancement of landscape architecture and extending the toolbox of knowledge-based landscape design.

4.3. Limitations of Advanced Mapping Methods

Overall, using advanced mapping methods and tools towards spatial–visual analysis plays a notable role in building a bridge between data processing and design intervention, which provide more precise and verifiable clues for understanding and addressing landscape space. However, there are also major concerns about the limitations and deviations of these mapping methods and tools, which result in prejudice and a refusal to implement them in daily practice (Figure 8).

4.3.1. Time- and Cost-Consuming

Based on their personal experiences and viewpoints, the interviewees set out several reasons for the hysteretic nature of advanced mapping methods (digital and quantitative) in the daily work of landscape architecture. First, landscape design is a subject that incorporates systematic understanding, logical thinking, and strategic design in order to achieve reasonable design solutions to problems; however, the creative process of design always starts from abstraction, intuitive feelings, and approximations. To capture these fleeting design inspirations, designers rely on mapping, especially hand-drawn maps and sketches, which are more “fluid” than dealing with data and able to express their ideas in a quick way. Nowadays, most design firms and institutions have a standardised workflow and scheduling approach for each project, with the aim of increasing efficiency and guaranteeing performance quality. Even though the application of advanced mapping techniques is helpful for providing extra knowledge about the site situations, problems, and potentials from a spatial–visual point of view and giving clues for design interventions, it cannot replace the creative process of design. Thus, considering them as complementary tools, it is rather time-consuming to prepare data and build models (e.g., digital terrain model of the landscape). The effectiveness and financial gain of using advanced analysis tools are less directly obvious. Neither designers nor customers see the results within a short period of time.

4.3.2. The Scope of Advanced Mapping Methods and Tools

Landscape design is a not only a dynamic matter shaped by physical materials and architectonic compositions, but also involves the more subjective aspects of landscape based on personal agendas, including scenic beauty, visual landscape assessment, interactive emotions, symbolic connotations, aesthetic preference, etc. [2,30,31]. Most of the current advanced mapping methods (e.g., GIS, space syntax, landscape metrics) only employ a normative measurement and interpretation of a single aspect of the landscape or its specific characteristics. They still have trouble thoroughly describing spatial qualities, such as colour, smell, etc. Each medium, in and of itself, has restrictions; thus, it is essential to combine different mapping methods (e.g., physiological and phenomenological approaches that enable the essential expression of the emotional and sensorial awareness of individuals) in order to form the whole story and provide integral knowledge to inform design decisions.

4.3.3. Technical Barriers and Communication Problems

Interviewees from the municipality and the province pointed to the fact that the government has a large number of valuable open data sources, including social, economic, ecological, geographic, energy, and health departments; GPS; climate sensors; the physical environment; and transportation data. Some of the data are spatially accurate and geo-located with attributes that have the potential to help identify, understand, and analyse spatial problems or to evaluate the effectiveness of proposed design plans to strengthen design thinking. Only detailed GIS-based 3D models have been prepared and implemented to provide accurate spatial evidence for some projects. When multidisciplinary teams are collaborating, practitioners with design background are not familiar with advanced mapping methods enabling these data to be transformed into spatial solutions, whereas technicians with expertise in areas such as geography and hydrology cannot precisely understand the real problems from a design point of view and produce appropriate analyses.
The interviews generated an in-depth discussion about the reasons why practitioners do not formally apply advanced mapping methods or measurements in their daily design work. Both objective limitations (time and cost, the restrictions of data and software) and subjective explanations (lack of knowledge to edit and analyse data) have been summarised and deliberated on. To address these concerns, recommendations to guide future development and implementation are needed, which will be discussed in the next section.

5. Recommendations for Practical Implementation and Future Outlook

Mapping methods and tools have progressively aligned with the development of big data and technology, which provide realistic visualisations of landscape scenarios, accurate simulations of spatial patterns, precise analyses of landscape characteristics, and rational assessments of design proposals. Landscape practitioners are increasingly involved in the discussion and experimentation of how landscape architecture should further implement digital, advanced, quantitative, and inter-subjective mapping techniques (e.g., GIS, landscape metrics, virtual reality, augmented reality, drones, 3D lancer, and algorithm landscapes) to help understand real-world dynamics and act on design decisions.
Having introduced the strengths and weaknesses of advanced mapping approaches with examples, a set of challenges for landscape professionals will now be put forward based on the positive feedback of the interviewees. These include the necessity to understand new technologies and gain new skills and to understand how to combine mapping methods and tools, and knowing when, how, and in what cases to integrate an advanced mapping toolbox into landscape design and planning (Figure 9).

5.1. Applying Design Thinking to the Manipulation of Data

New techniques are not just a means for representation and communication, but also have the potential to develop design thinking and the whole process of invention within the design procedure itself. Landscape practitioners should apply design thinking appropriately to the manipulation of data in order to be more targeted and to reveal the essence of spatial–visual organisation, while providing additional information to possibly change the quality of design. Inspired by the representative examples and interview reflections, raising awareness and exploring spatial–visual landscape characteristics from both quantitative and quantitative perspectives, as well as developing mapping techniques that can measure and visualise them, would be a good approach to enriching design principles and achieving integral spatial knowledge of landscape within everyday design practices.

5.2. When, Which, What, and How

Though data preparation and model building are time- and cost-consuming tasks, well-structured databases can be effective for carrying out a variety of analyses via different advanced mapping techniques. To promote implementation, it is crucial to integrate an advanced mapping toolbox into the whole design process and clarify which method is appropriate to employ at which particular design stage. Steinitz identified six steps typical for the design process [32]. As analytical tools, both conventional (e.g., field surveys, hand-drawn maps, schematic sketches) and advanced mapping methods (e.g., GIS-based topography, visibility, sensitivity analyses) can be employed in Step 2 to understand the context and identify the spatial–visual characteristics that are most likely to be addressed. Then, through the iterated process between Step 4 and Step 5, conventional mapping methods are applied first to spatialise design ideas, and then advanced mapping methods are used to evaluate the spatial effectiveness of design interventions (Figure 10). In addition, landscape designers should be familiar with the capacity and dimensions of each mapping method and tool, identifying which instrument is the most appropriate for use by taking different aspects into consideration (e.g., scale, particular issues, urban or rural landscape). Furthermore, the combination of different mapping methods and tools could work together to describe the landscape more comprehensively.

5.3. Development of Real-Time Mapping Techniques

When forecasting the future development and implementation of advanced mapping techniques, almost all the interviewees mentioned the expectation for real-time presentation and analysis. Prophase analysis, design invention, evaluation, and assessment could be conducted simultaneously. For example, the Augmented Reality Sandbox, invented by the University of California, Davis, is an exhibit combining a sandbox with GIS analysis in an interactive SD topographic map showing the dynamic spatial changes and effects through design. In addition, a 3D point cloud accumulated via a laser scanner can offer more precise simulations of reality and future design interventions, but also generate different types of spatial analysis, such as viewsheds, geometric changes, and water catchments. These synthesised real-time mapping techniques and platforms could perform spatial analysis immediately after the creation of space, which increases the efficiency of the iterated design process.

6. Conclusions

In this paper, practical perspectives on spatial–visual mapping methods and tools in landscape practices have been provided through semi-structured interviews with experts. The discussion is underpinned by valuable information and knowledge from different parts of the design industry, from describing landscape spaces in daily work, the practical use of different mapping methods and tools, and dialectical opinions on advanced mapping methods and tools during their application, to recommendations on how to effectively implement technology in the design process. It does not provide conclusive answers but paves the way to more in-depth studies.
The interviews highlighted that most of the digital mapping techniques widely used in current landscape/urban design practices are regarded as representation tools to show landscape scenarios in a more realistic and performative way; they also support designers in communicating with stakeholders and the public. Mapping methods that use quantitative measurements and spatial–visual analyses, which broaden the perception of landscape spaces, are still not fully applied and are often ignored in practice. However, almost all the interviewees showed interest in the integration and implementation of spatial–visual mapping methods in the future development of landscape architecture. Merging traditional and advanced mapping methods to describe landscape space advocates for a multidisciplinary approach towards landscape design, while at the same time extracting, translating, and adapting theories and technologies to gain new insights into landscape spaces.
In the interviews, recurring concerns about combining data and design thinking were discussed in depth. Considering the limited capacities of technology, it is important to clarify the strengths and limitations of each mapping method and tool. Further investigation is needed to explore how to combine advanced and conventional processes and elucidate the compatibility of the mapping toolbox in a standard design situation. In addition, the interviews indicate that introducing advanced mapping methods with further analyses and measurements into landscape education is indispensable for training new generations of landscape architects. With the development of this integrated mapping toolbox, designers can engage in issues of landscape development, transformation, and preservation while providing realistic and instrumental clues for interventions in urban landscapes.

Author Contributions

Conceptualization, M.L. and S.N.; methodology, M.L. and S.N.; formal analysis, M.L.; investigation, M.L.; resources, M.L.; writing—original draft preparation, M.L., writing—review and editing, M.L. and S.N.; visualization, M.L.; supervision, S.N.; project administration, M.L. and S.N. All authors have read and agreed to the published version of the manuscript.

Funding

This research was partly funded by the China Scholarship Council (CSC No. 201506120085).

Informed Consent Statement

Informed consent was obtained from all subjects involved in the study.

Acknowledgments

The authors would like to acknowledge the language editing by James Nelson and Katie Finnegan of the earlier and revised drafts of this paper.

Conflicts of Interest

The authors declare no conflict of interest.

Appendix A. Identity of Interviewees

  • Dirk Sijmons: landscape architect (H+N+S), Professor of Landscape Architecture at TU Delft (The Netherlands);
  • Frits Palmboom: urban designer (Palmbout Urban Landscapes), Professor of Urban Design at TU Delft (The Netherlands);
  • Eric van der Kooij: Head of Knowledge and Quality Assurance in the Spatial Planning Department in the Municipality of Amsterdam, urban designer, former professor at TU Delft (landscape architecture) (The Netherlands);
  • Han Lorzing: landscape architect, former spatial quality consultant for the province of Utrecht, former project leader of urban development and cultural history studies in the Planning Bureau (PBL) (The Netherlands);
  • Bas Horsting: urban designer, architect, SWECO (The Netherlands);
  • Mark Eker: regional designer in Noord-Holland province, landscape architect (The Netherlands);
  • Jaap van der Salm: landscape architect (H+N+S) (The Netherlands);
  • Olaf Schroth: Professor of Geodesign and Landscape Informatics at Weihenstephan-Triesdorf University of Applied Science (Germany);
  • Phillip Urech: teaching/research assistant to the Chair of Landscape Architecture at ETH Zurich, PhD research at the Future Cities Laboratory in Singapore (Switzerland);
  • Eckart Lange: Professor of Landscape Architecture at the University of Sheffield (UK);
  • Cui Honglei: landscape architect in Shenzhen Urban Planning and Design Institute of Design (China).

References

  1. Jellicoe, G.; Jellicoe, S. The Landscape of Man: Shaping the Environment from Prehistory to the Present Day; Thames and Hudson: London, UK, 1987. [Google Scholar]
  2. Vroom, M.J. Lexicon of Garden and Landscape Architecture; Birkhäuser: Basel, Switzerland, 2006. [Google Scholar]
  3. Loidl, H.; Bernard, S. Open(ing) Spaces: Design as Landscape Architecture; Walter de Gruyter: Berlin, Germany, 2003. [Google Scholar]
  4. Abrams, J.; Hall, P. Else/Where Mapping new Cartographies of Networks and Territories; University of Minnesota: Minneapolis, MN, USA, 2006. [Google Scholar]
  5. Liu, M.; Nijhuis, S. Mapping landscape spaces: Methods for understanding spatial-visual characteristics in landscape design. Environ. Impact Assess. Rev. 2020, 82, 106376. [Google Scholar] [CrossRef]
  6. Nijhuis, S.; van Lammeren, R.; Antrop, M. Exploring visual landscapes: An introduction. Res. Urban. Ser. 2011, 2, 15–39. [Google Scholar]
  7. Nijhuis, S. GIS-based landscape design research: Stourhead landscape garden as a case study. Architect. Built Environ. 2015, 13, 1–338. [Google Scholar]
  8. Liu, M. Mapping landscape spaces. Architect. Built Environ. 2020, 20, 1–248. [Google Scholar]
  9. Nijhuis, S. Applications of GIS in landscape design research. Res. Urban. Ser. 2016, 4, 43–56. [Google Scholar]
  10. Deming, M.E.; Swaffield, S. Landscape Architectural Research: Inquiry, Strategy, Design; John Wiley & Sons: Hoboken, NJ, USA, 2011. [Google Scholar]
  11. Secor, A. Social surveys, interviews, and focus groups. In Research Methods in Geography: A Critical Introduction; Gomez, B., Jones, J.P., Eds.; Jones Wiley: Hoboken, NJ, USA, 2010. [Google Scholar]
  12. Aira, M.; Kauhanen, J.; Larivaara, P.; Rautio, P. Factors influencing inquiry about patients’ alcohol consumption by primary health care physicians: Qualitative semi-structured interview study. Fam. Pract. 2003, 20, 270–275. [Google Scholar] [CrossRef] [PubMed] [Green Version]
  13. Kirchherr, J.; Charles, K. Enhancing the sample diversity of snowball samples: Recommendations from a research project on anti-dam movements in Southeast Asia. PLoS ONE 2018, 13, e0201710. [Google Scholar] [CrossRef] [PubMed] [Green Version]
  14. Pinzon Cortes, C.E.; Bekkering, H.C.; Meyer, V.J. Mapping Urban Form: Morphology Studies in the Contemporary Urban Landscape; Delft University of Technology: Delft, The Netherlands, 2009. [Google Scholar]
  15. Corner, J. Representation and landscape: Drawing and making in the landscape medium. Word Imaging 1992, 8, 243–275. [Google Scholar] [CrossRef]
  16. Stapleton, E. Intangible Landscapes: An Argument for the Realignment of Landscape Representation and Theory through Network Visualization. Master’s Thesis, University of Oregon, Eugene, OR, USA, 2016. [Google Scholar]
  17. de Bruin, D.; Hamhuis, D.; Van Nieuwenhuijze, L.; Sijmons, D. Ooievaar: De Toekomst van het Rivierengebied (The Future of the River); Stichting Gelderse Milieufederatie: Arnhem, The Netherlands, 1987. [Google Scholar]
  18. Palmboom, F.J. Reflection. Research, design, making something. In Delta Interventions: Design and Engineering in Urban Water Landscapes; Nillesen, A.L., Kothuis, B., Meyer, H., Palmboom, F., Eds.; Delft University Publishers: Delft, The Netherlands, 2016; pp. 122–123. [Google Scholar]
  19. Nothhelfer, U. Landscape Architecture in the Reality-Virtuality. In Trends in GIS and Virtualization in Environmental Planning and Design, Proceedings at Anhalt University of Applied Sciences Seminar GIS Trends in Environmental Planning: Internet GIS and Web Mapping, Mobile and Virtual GIS; Buhmann, E., Ed.; Wichmann: Lotte, Germany, 2002; pp. 1–5. [Google Scholar]
  20. Fricker, P.; Munkel, G. Data Mapping: Interactive Big Data Visualization in Landscape Architecture. Peer-Rev. Proc. Digit. Lands. Architect. 2015, 141–150. [Google Scholar]
  21. Ensari, E.; Kobas, B. Web scraping and mapping urban data to support urban design decisions. AZ ITU J. Fac. Architect. 2018, 15, 5–21. [Google Scholar] [CrossRef]
  22. Shen, Z.; Miaoyi, L. Big Data Support of Urban Planning and Management: The Experience in China; Springer: Berlin, Germany, 2017. [Google Scholar]
  23. Qu, L. Redefine the Border of Water: Exploring the Potential of the Grand Canal as a Backbone for Adaptive and Resilient Urban Development in Tongzhou. Master’s Thesis, Delft University of Technology, Delft, The Netherlands, 2020. [Google Scholar]
  24. Lan, J. The Regeneration of Reserved Market. Master’s Thesis, University College London, London, UK, 2021. [Google Scholar]
  25. Sheppard, S.R. Landscape visualisation and climate change: The potential for influencing perceptions and behaviour. Environ. Sci. Pol. 2005, 8, 637–654. [Google Scholar] [CrossRef]
  26. BASTA Urbanism. NDSM Docklands Amsterdam. 2018. Available online: https://www.basta-urbanism.nl/ndsm-docklands-amsterdam (accessed on 19 May 2021).
  27. Entwistle, T.; Edwin, K. Visual Communication for Landscape Architecture; Bloomsbury Publishing: London, UK, 2013. [Google Scholar]
  28. Adler, M.J. A Guidebook to Learning: For a Lifelong Pursuit of Wisdom; Macmillan: New York, NY, USA, 1986. [Google Scholar]
  29. Rowley, J.; Hartley, R. Organizing Knowledge: An Introduction to Managing Access to Information; Ashgate Publishing: London, UK, 2006. [Google Scholar]
  30. Sijmons, D.F.; van Dorst, M.J. The Emotional Landscape. In Landscape and Energy, Designing Transition; Sijmons, D.F., Hugtenburg, J., van Hoorn, A., Feddes, F., Eds.; NAi010 Publishers: Rotterdam, The Netherlands, 2014. [Google Scholar]
  31. Zube, E.H.; Sell, J.L.; Taylor, J.G. Landscape perception: Research, application and theory. Lands. Plan. 1982, 9, 1–33. [Google Scholar] [CrossRef]
  32. Steinitz, C. A Framework for Theory and Practice in Landscape Planning. Ekistics 1994, 61, 4. [Google Scholar]
Figure 1. Schematic diagrams showing the examples of advanced mapping approaches in terms of spatial–visual analysis: (a) compartment analysis showing the relationship between visible space and mass (e.g., depthMapX) [6], (b) 3D landscapes simulating scenarios from eye-level perspective (e.g., 3D modelling and illustration software) [7], (c) grid-cell analysis measuring the proportion of different landscape elements (e.g., Segnet, ArcGIS) [6], (d) visibility analysis (e.g., ArcGIS) [6], (e) landscape metrics indicating landscape use changes (e.g., Fragstats) [8], and (f) eye-tracking analysis exploring visual perception of landscape spaces (e.g., eye-tracker and processing platform) [8] (copyright permission obtained).
Sustainability 13 07952 g001
Figure 2. Three selected representative examples were shown to the interviewees to elaborate how advanced mapping methods work in interpreting the landscape architectonic compositions. For detailed case interpretation, see Nijhuis et al. (case 1, 2) [6]; Liu, (case 3) [8] (copyright permission obtained).
Sustainability 13 07952 g002
Figure 3. Roles of mapping techniques mentioned by the interviewees in the design process. The bracketed numbers refer to the frequency of the codes in the transcripts (compiled by Atlas.ti).
Sustainability 13 07952 g003
Figure 4. (Left) a hand-drawn Plan Ooievaar (Stork) map, as the basis of the “Room for the River” project, indicating the development of a river area in the Netherlands proposed by De Bruin et al. (image courtesy of Dirk Sijmons) [17]; (right) a hand-drawn cross-section with eye-level perspectives to show the relations between land and water by Palmboom (2016) [18] (copyright permission obtained).
Sustainability 13 07952 g004
Figure 5. (Left) highly developed and rendered landscape perspective showing the designed bank of the river in a photorealistic collage by an MLA student from TU Delft [23]; (right) concise illustration showing a designed roof space of the designed road via monotonous 3D modelling together with a collage by an MLA student from UCL [24] (copyright permission obtained).
Sustainability 13 07952 g005
Figure 6. Left: white areas show the safe snow elevations for skiing in Sorenberg, Switzerland, after 50 years of climate change through 3D landscape visualisations [25]; right: NDSM 2030 interactive 3D VR model [26] (copyright permission obtained).
Sustainability 13 07952 g006
Figure 7. Positions of the conventional and advanced mapping methods in the Data, Information, Knowledge, and Wisdom (Invention) pyramid in the landscape mapping context.
Sustainability 13 07952 g007
Figure 8. Concerns, barriers, and limitations of the application of advanced mapping techniques in interviewees’ landscape practices. The bracketed numbers refer to the frequency of the codes in the transcripts (compiled by Atlas.ti).
Sustainability 13 07952 g008
Figure 9. Recommendations for further applications of advanced mapping techniques in everyday landscape practices mentioned by the interviewees. The bracketed numbers refer to the frequency of the codes in the transcripts (compiled by Atlas.ti).
Sustainability 13 07952 g009
Figure 10. The stages using mapping methods and tools in the landscape design process.
Sustainability 13 07952 g010
Table 1. Interview questions.
Interview Questions
Question 1Looking through your practical work, have you ever used advanced mapping methods or tools to explore landscape spaces in any planning or design projects, such as GIS, space syntax, landscape metrics, or eye-tracking techniques?
If you have no experience using advanced mapping techniques, what kinds of methods and tools do you commonly use to understand and communicate space in design practices?
Please give some examples.
Question 2What purposes are they exactly used for in the design process?
What is the scale of the project?
Question 3In what respect or how do these different mapping techniques affect the design (as analytical, design, or evaluation tools)?
Representative examples implementing advanced mapping methods and toolsfor spatialvisual analysis of landscape were shown.
Question 4Based on the representative examples I’ve just shown, if it is possible to describe spatial–visual landscape as such, do you think these advanced mapping approaches have potential to be part of the design tools used in future landscape design processes?
Question 5If yes, what do we need to do in order to implement them in the design world?
If no, what are the difficulties and limitations of applying these mapping methods and tools in practice?
Table 2. Mapping methods and tools mentioned throughout the interview transcriptions (compiled by Atlas.ti).
Mapping Methods and Tools
Mentioned by the Practitioners (Code)
fMapping Methods and Tools
Mentioned by the Practitioners (Code)
f
Landscape visualisation
(Sketchup/Lumion/Revit/Rhino)
14Physical models1
GIS (ArcGIS, QGIS)10Grasshopper1
Hand-drawn maps/sketches5GPS1
Point clouds5Sensors1
Virtual reality devices3Google glasses1
Photos2Drones (photos/point clouds)1
Data visual animation software23D printing1
Photoshop1Map table1
f means the frequency of the word in the transcripts.
Table 3. Objects and goals of the interviewees’ application of the mapping toolbox (compiled by Atlas.ti).
Purposes of Using Mapping TechniquesfPurposes of Using Mapping TechniquesfPurposes of Using Mapping Techniquesf
Spatial compositions and configurations4Spatial experiences1Landforms1
Scenic routes 4Land-use maps1Development adaptation (spatial)1
Viewshed analysis 3Infinity1Earthwork calculation1
Enclosure 3Noise maps1Spatial performance (measurement)1
Foreground, middle ground, background 2Perception of safety1Shading/tree canopy (urban)1
Ecological sensitivity analysis 2Accessibility1Climate effects1
Flood-risk analysis 3Environmental impact assessment1Heat stress1
Light and shadow contrast2Horizontal views1Urban health (sports data)1
Air-quality maps (via sensors) 2Potential use of a dyke1Social factors1
Forms and volumes (urban) 2Slope of a dyke1Creating terrain models1
Architectural volumes2Variety1Travelling behaviour1
Wildlife habitats and tourism areas 2Direction1Traffic volume monitoring1
Soil maps 2Profile of a street1Dyke reinforcement1
Sequential experiences 2Diagonal axis1
Characteristics of natural resources1Wholeness1Groundwater distribution1
Latent dynamics of landscape1Intimacy1Microclimate1
Visual impact of wind turbines1Forest fire spread model and maps1Biosphere reserve1
Spatial characteristics of border cities/regions1Biological migration1Bird habitat1
Shipping routes (global scale)1Planned future terrains1Landscape construction (point clouds)1
Infrastructure configurations1Hydrological modelling1Terrain changes1
Heritage landscapes1Skyline analysis1Visual impact of a tower1
Street levels (elevation)1Selection of viewpoints1
f means the frequency of the word in the transcripts.
Publisher’s Note: MDPI stays neutral with regard to jurisdictional claims in published maps and institutional affiliations.

