
Ecosystem Water Use Efficiency in the Three-North Region of China Based on Long-Term Satellite Data


Abstract
:1. Introduction
2. Data and Methods
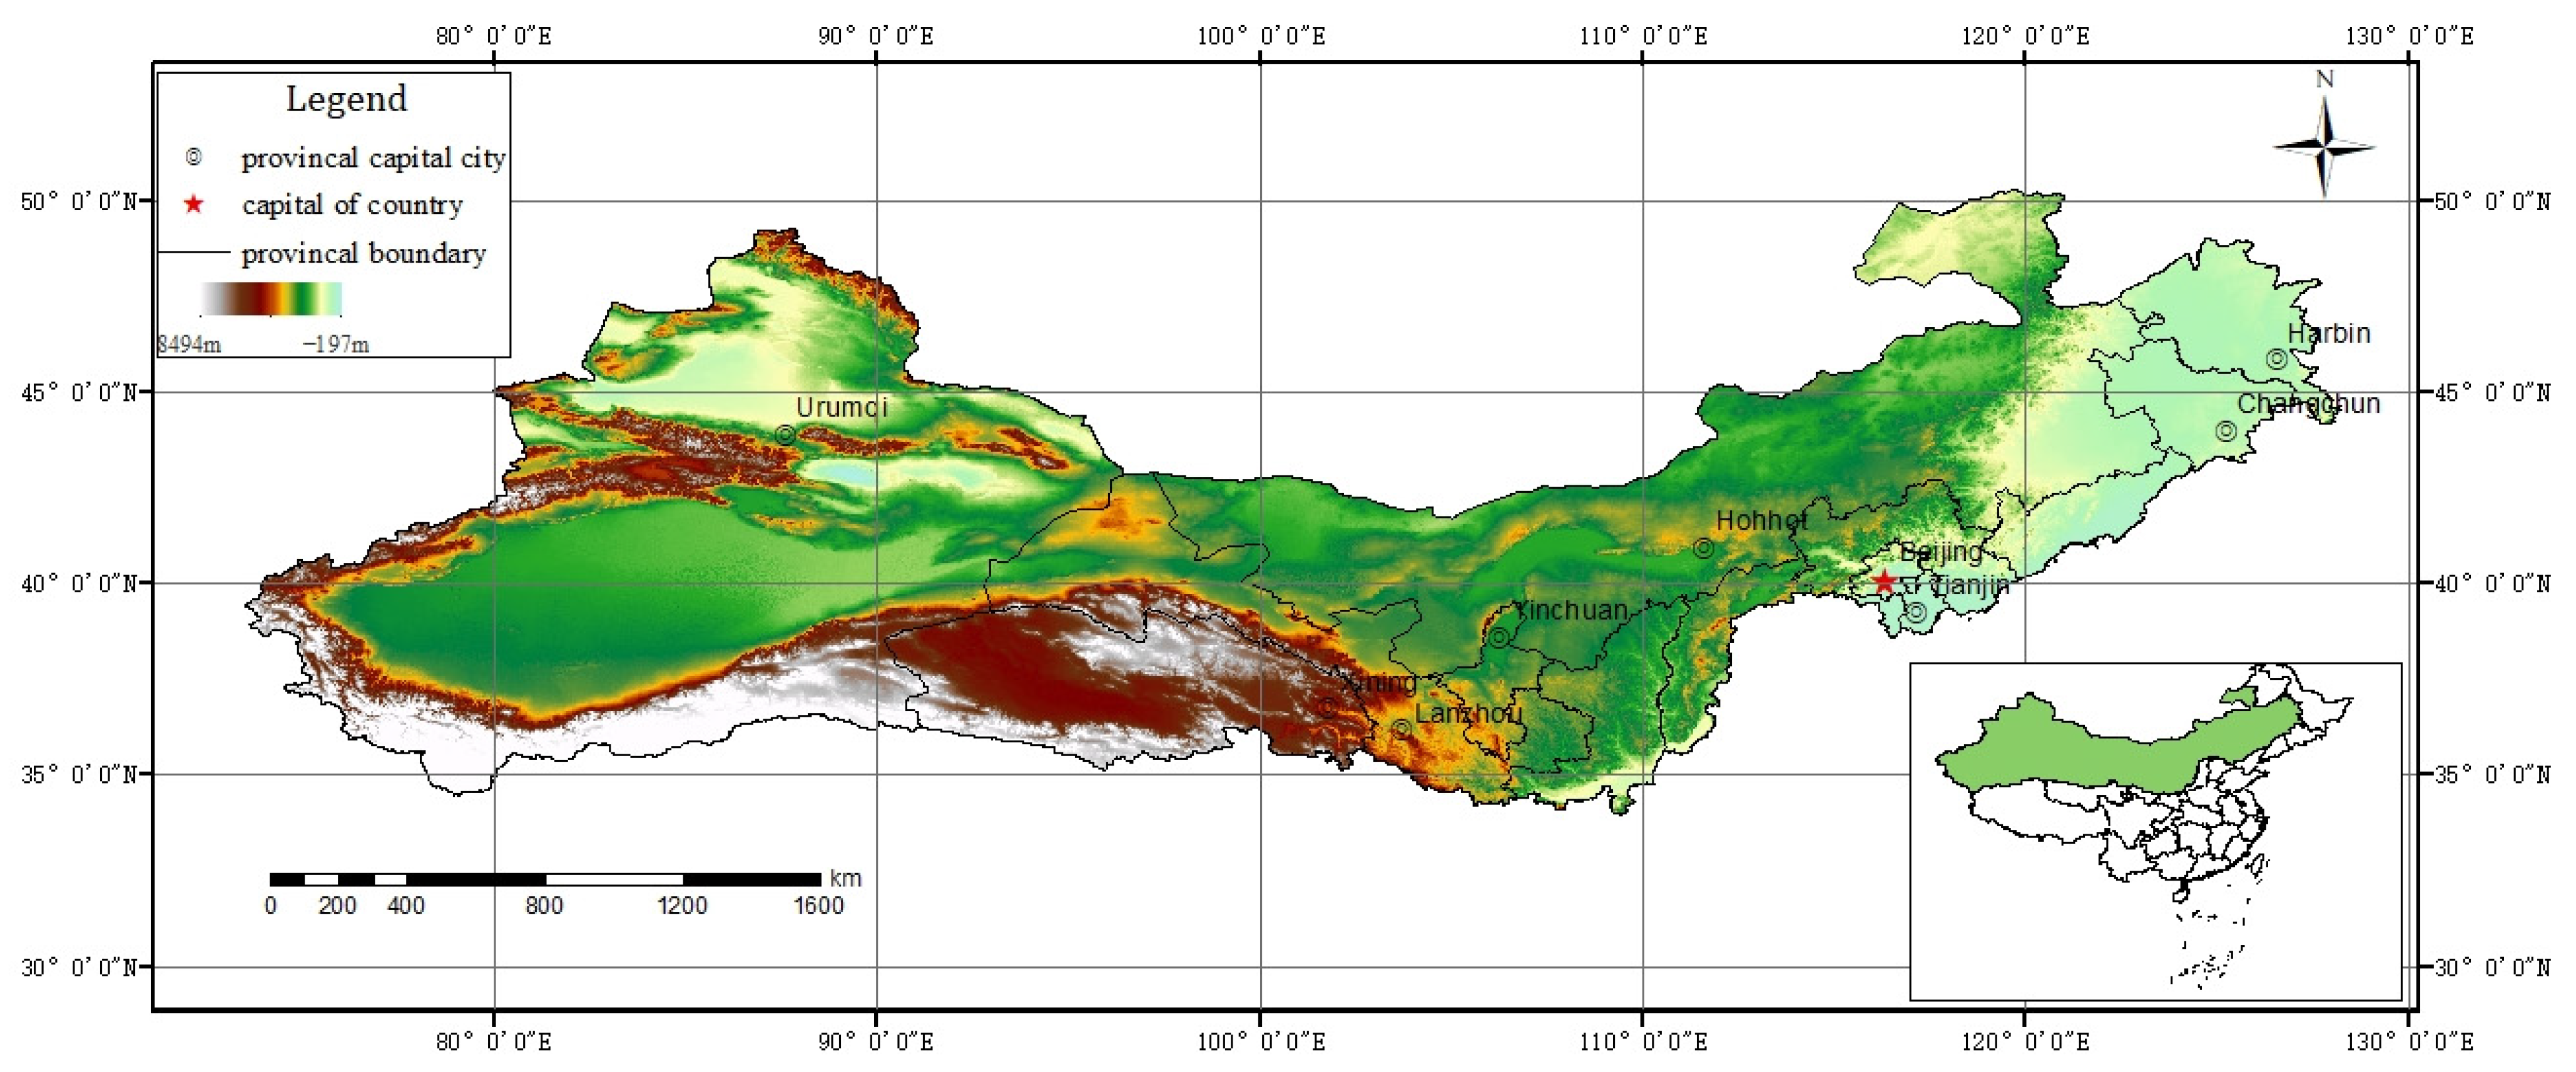
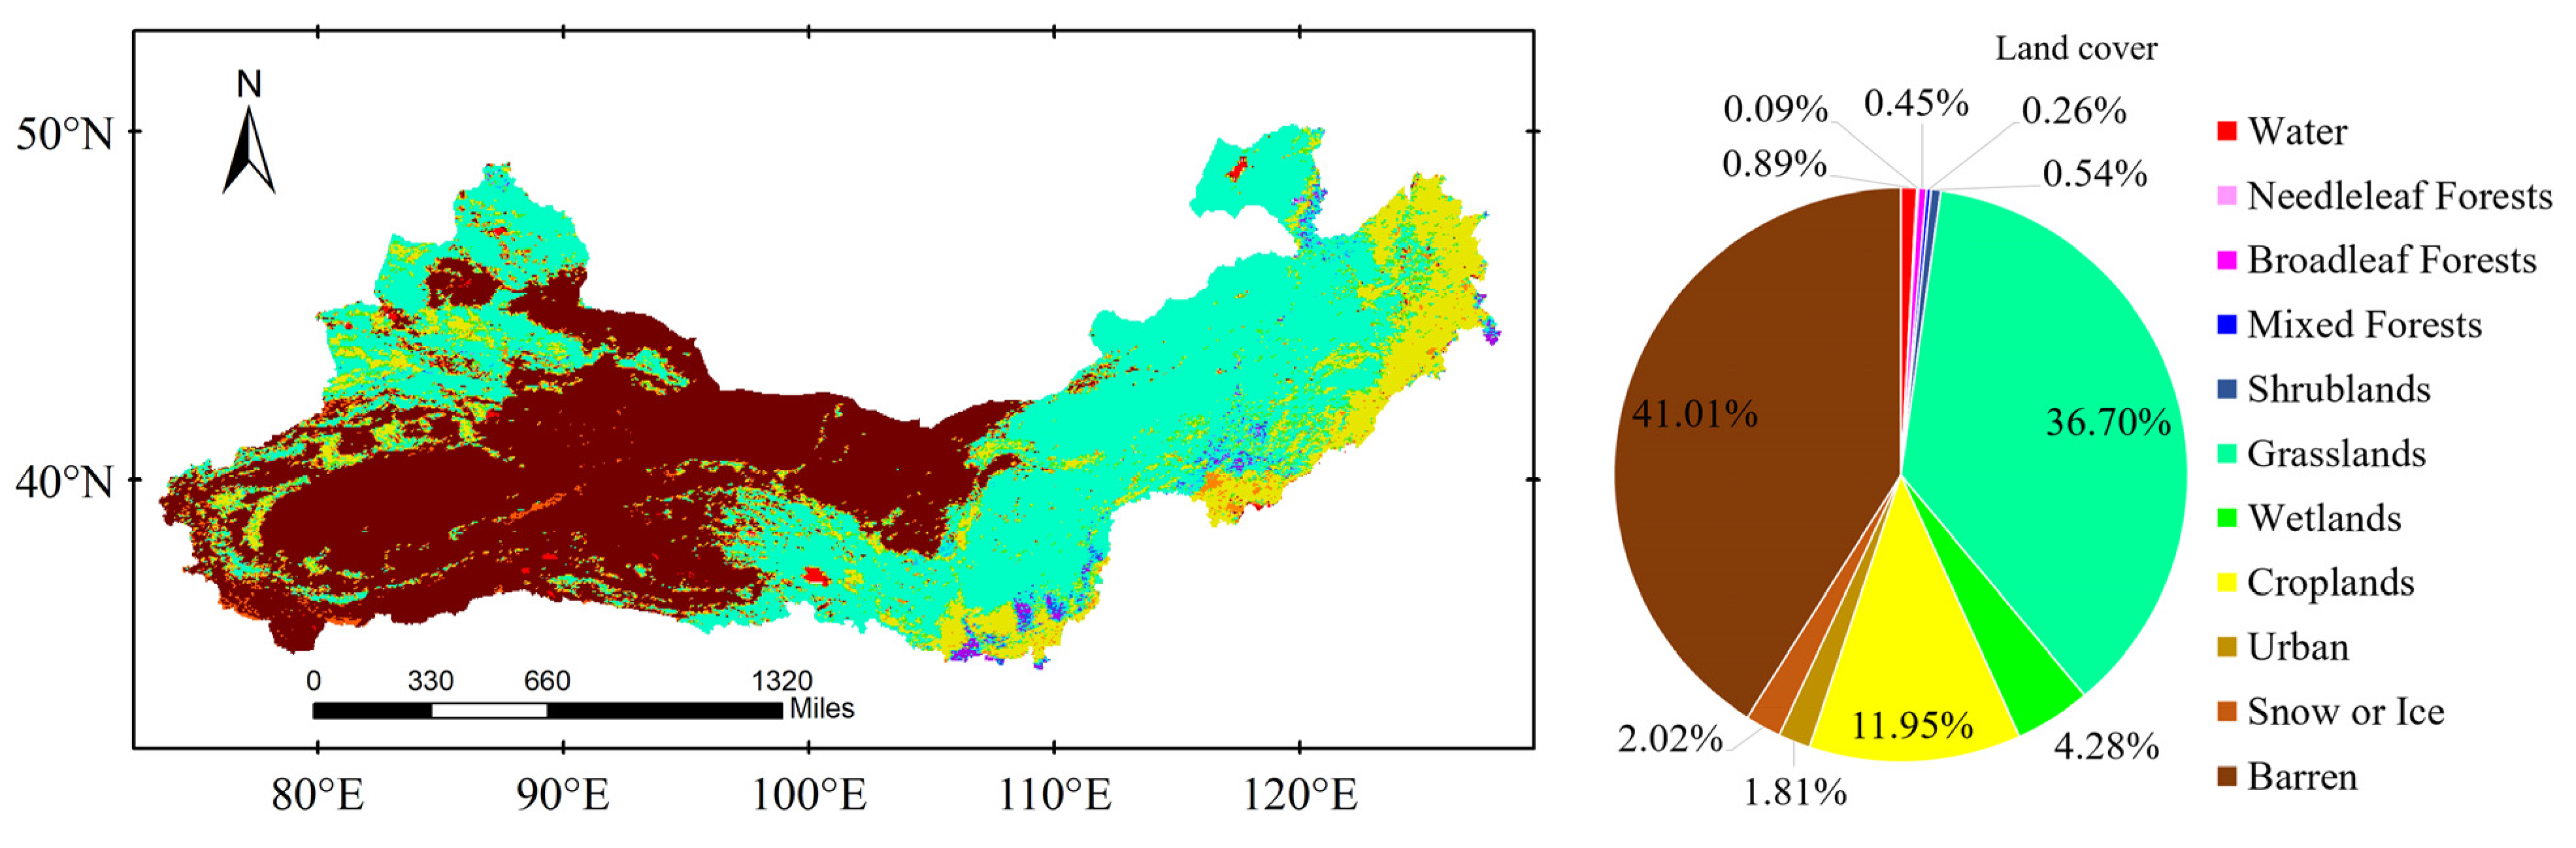
2.1. Study Area
2.2. Data
2.3. Analytical Methods
2.3.1. Calculation of WUE
2.3.2. Trend Analytical Methods
2.3.3. Variation Coefficients
2.3.4. Hurst Exponent (Sustainability Trend)
- (1)
- Obtain the annual average WUE time series,
- (2)
- Calculate the average WUE over the time range,
- (3)
- Calculate the accumulated deviation of WUE over the time range,
- (4)
- Create the range sequence ,
- (5)
- Create the standard deviation sequence ,
- (6)
- Calculate the Hurst exponent,
2.3.5. Correlation Analysis
2.3.6. Impacts of Climate Factors and Human Activities
3. Results
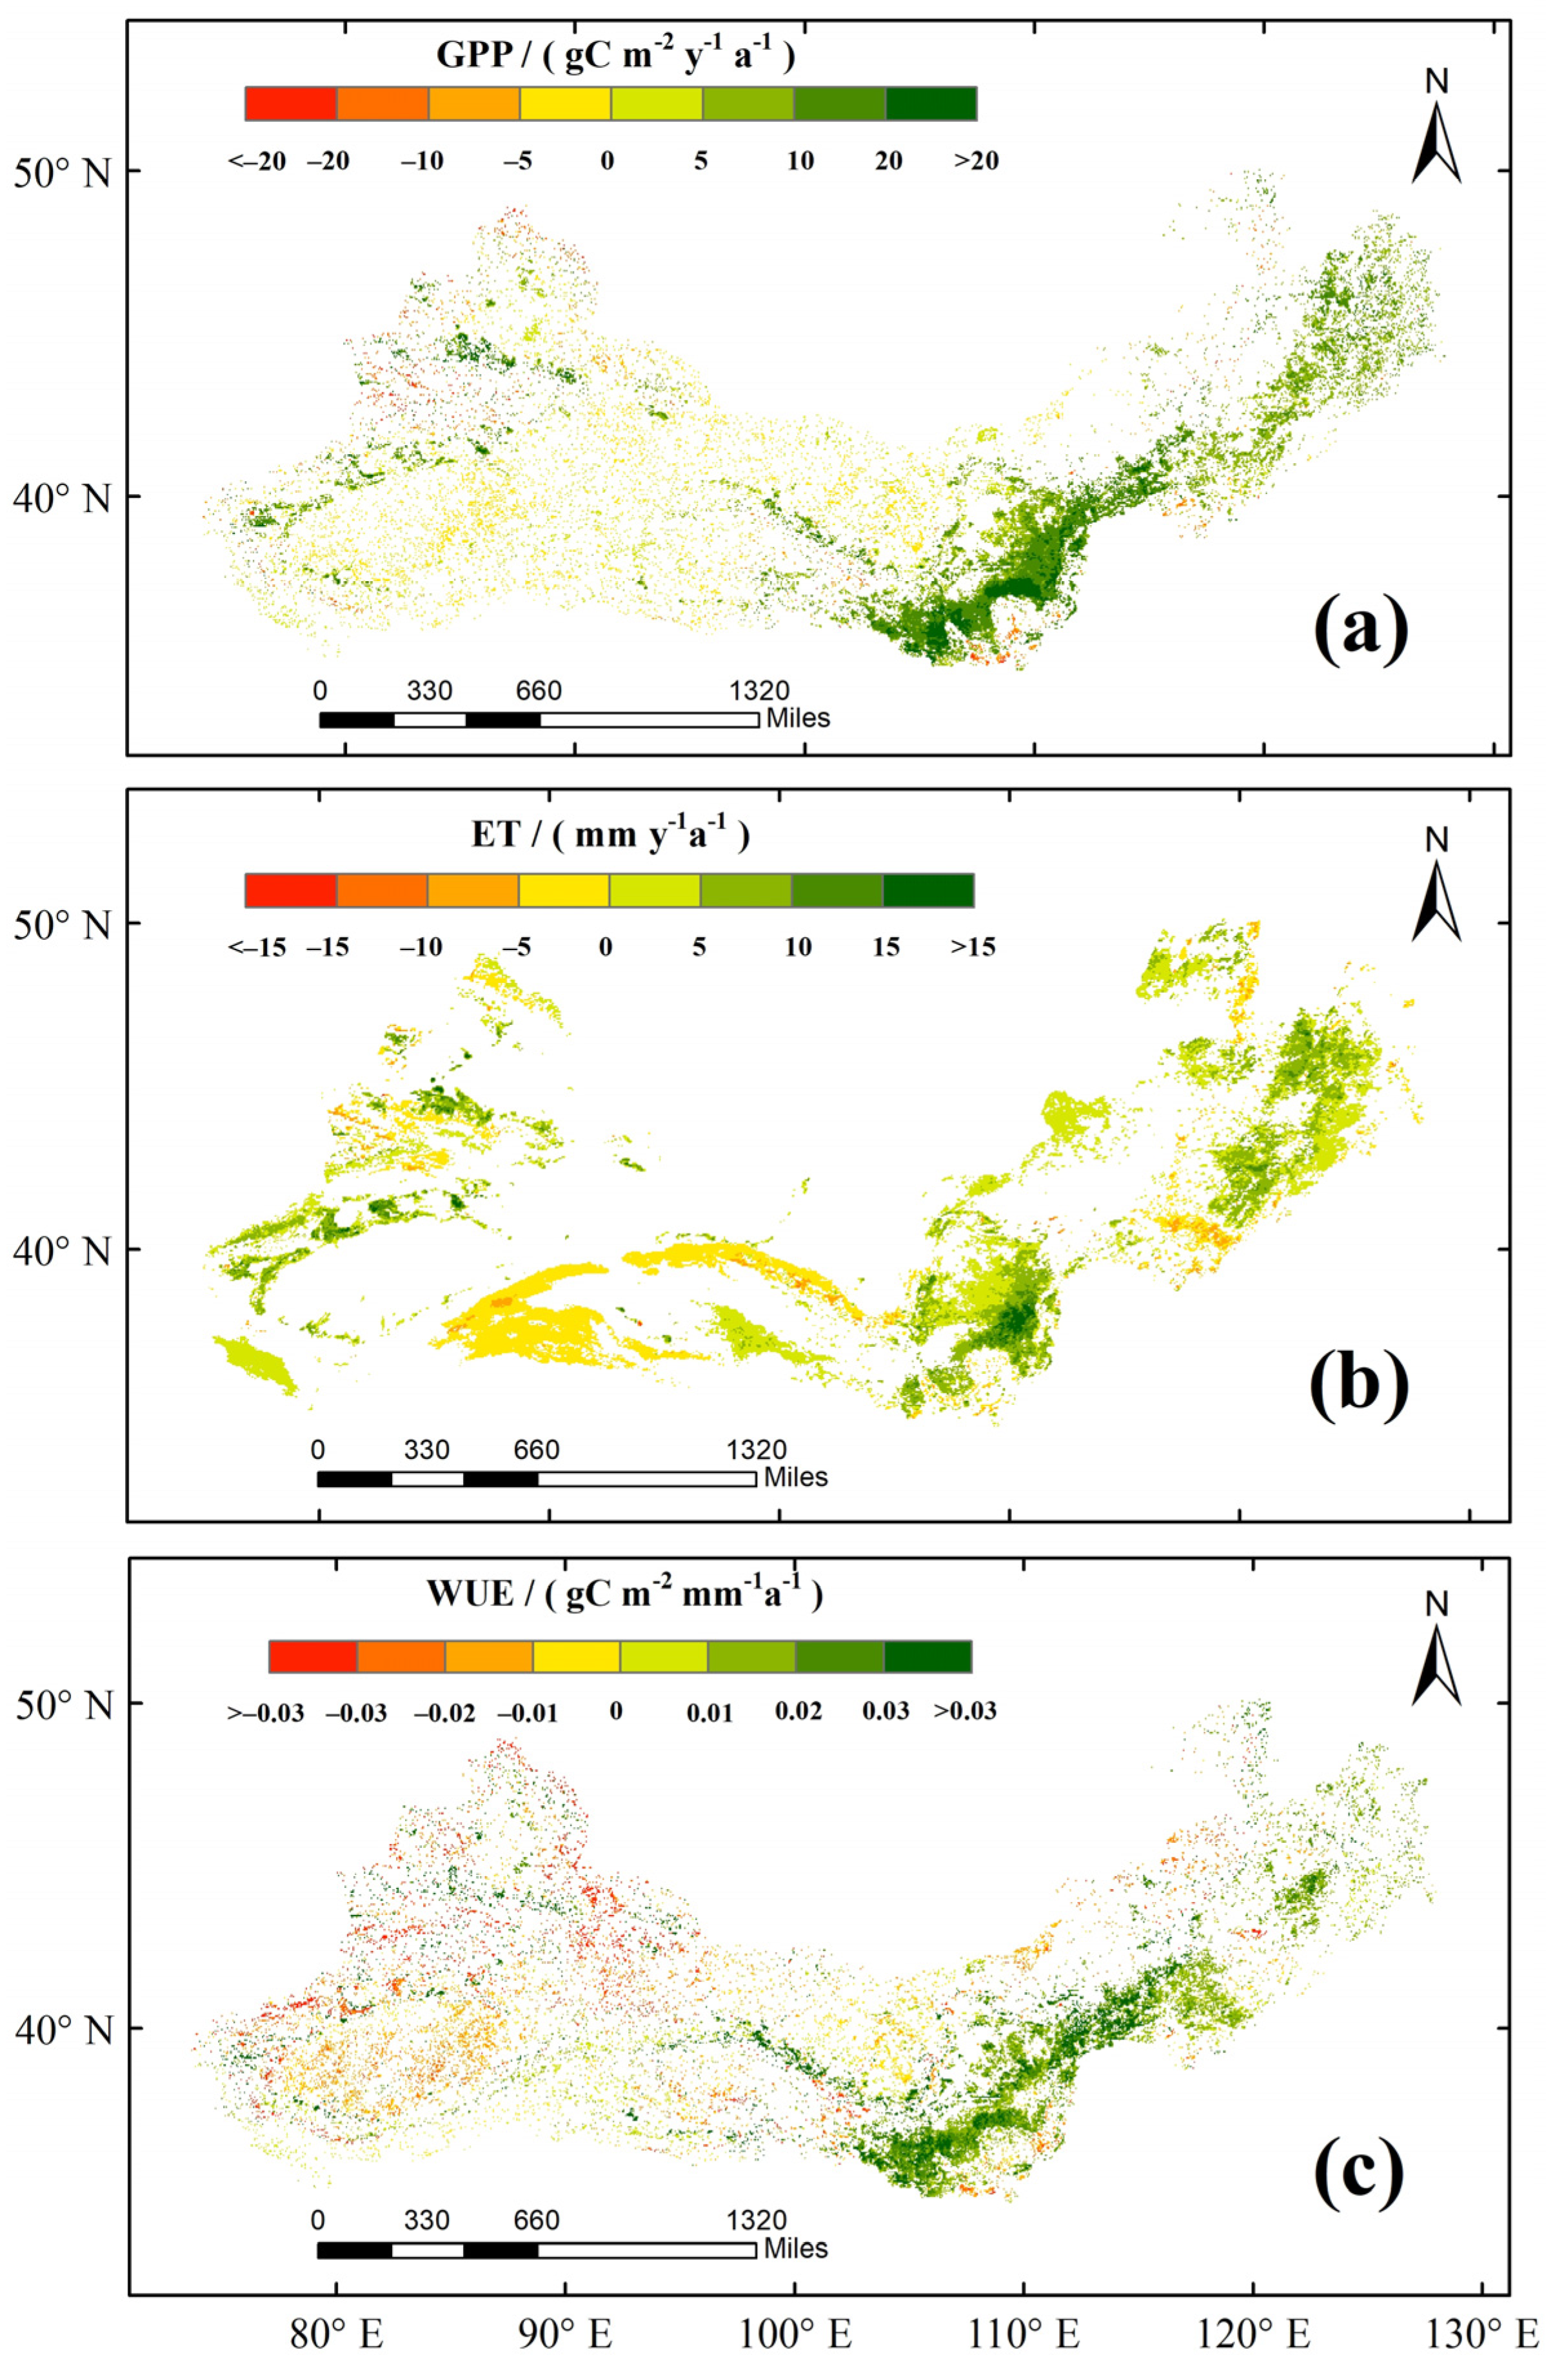
3.1. Spatial Distributions of GPP, ET, and WUE
3.2. Spatiotemporal Variations in GPP, ET, and WUE
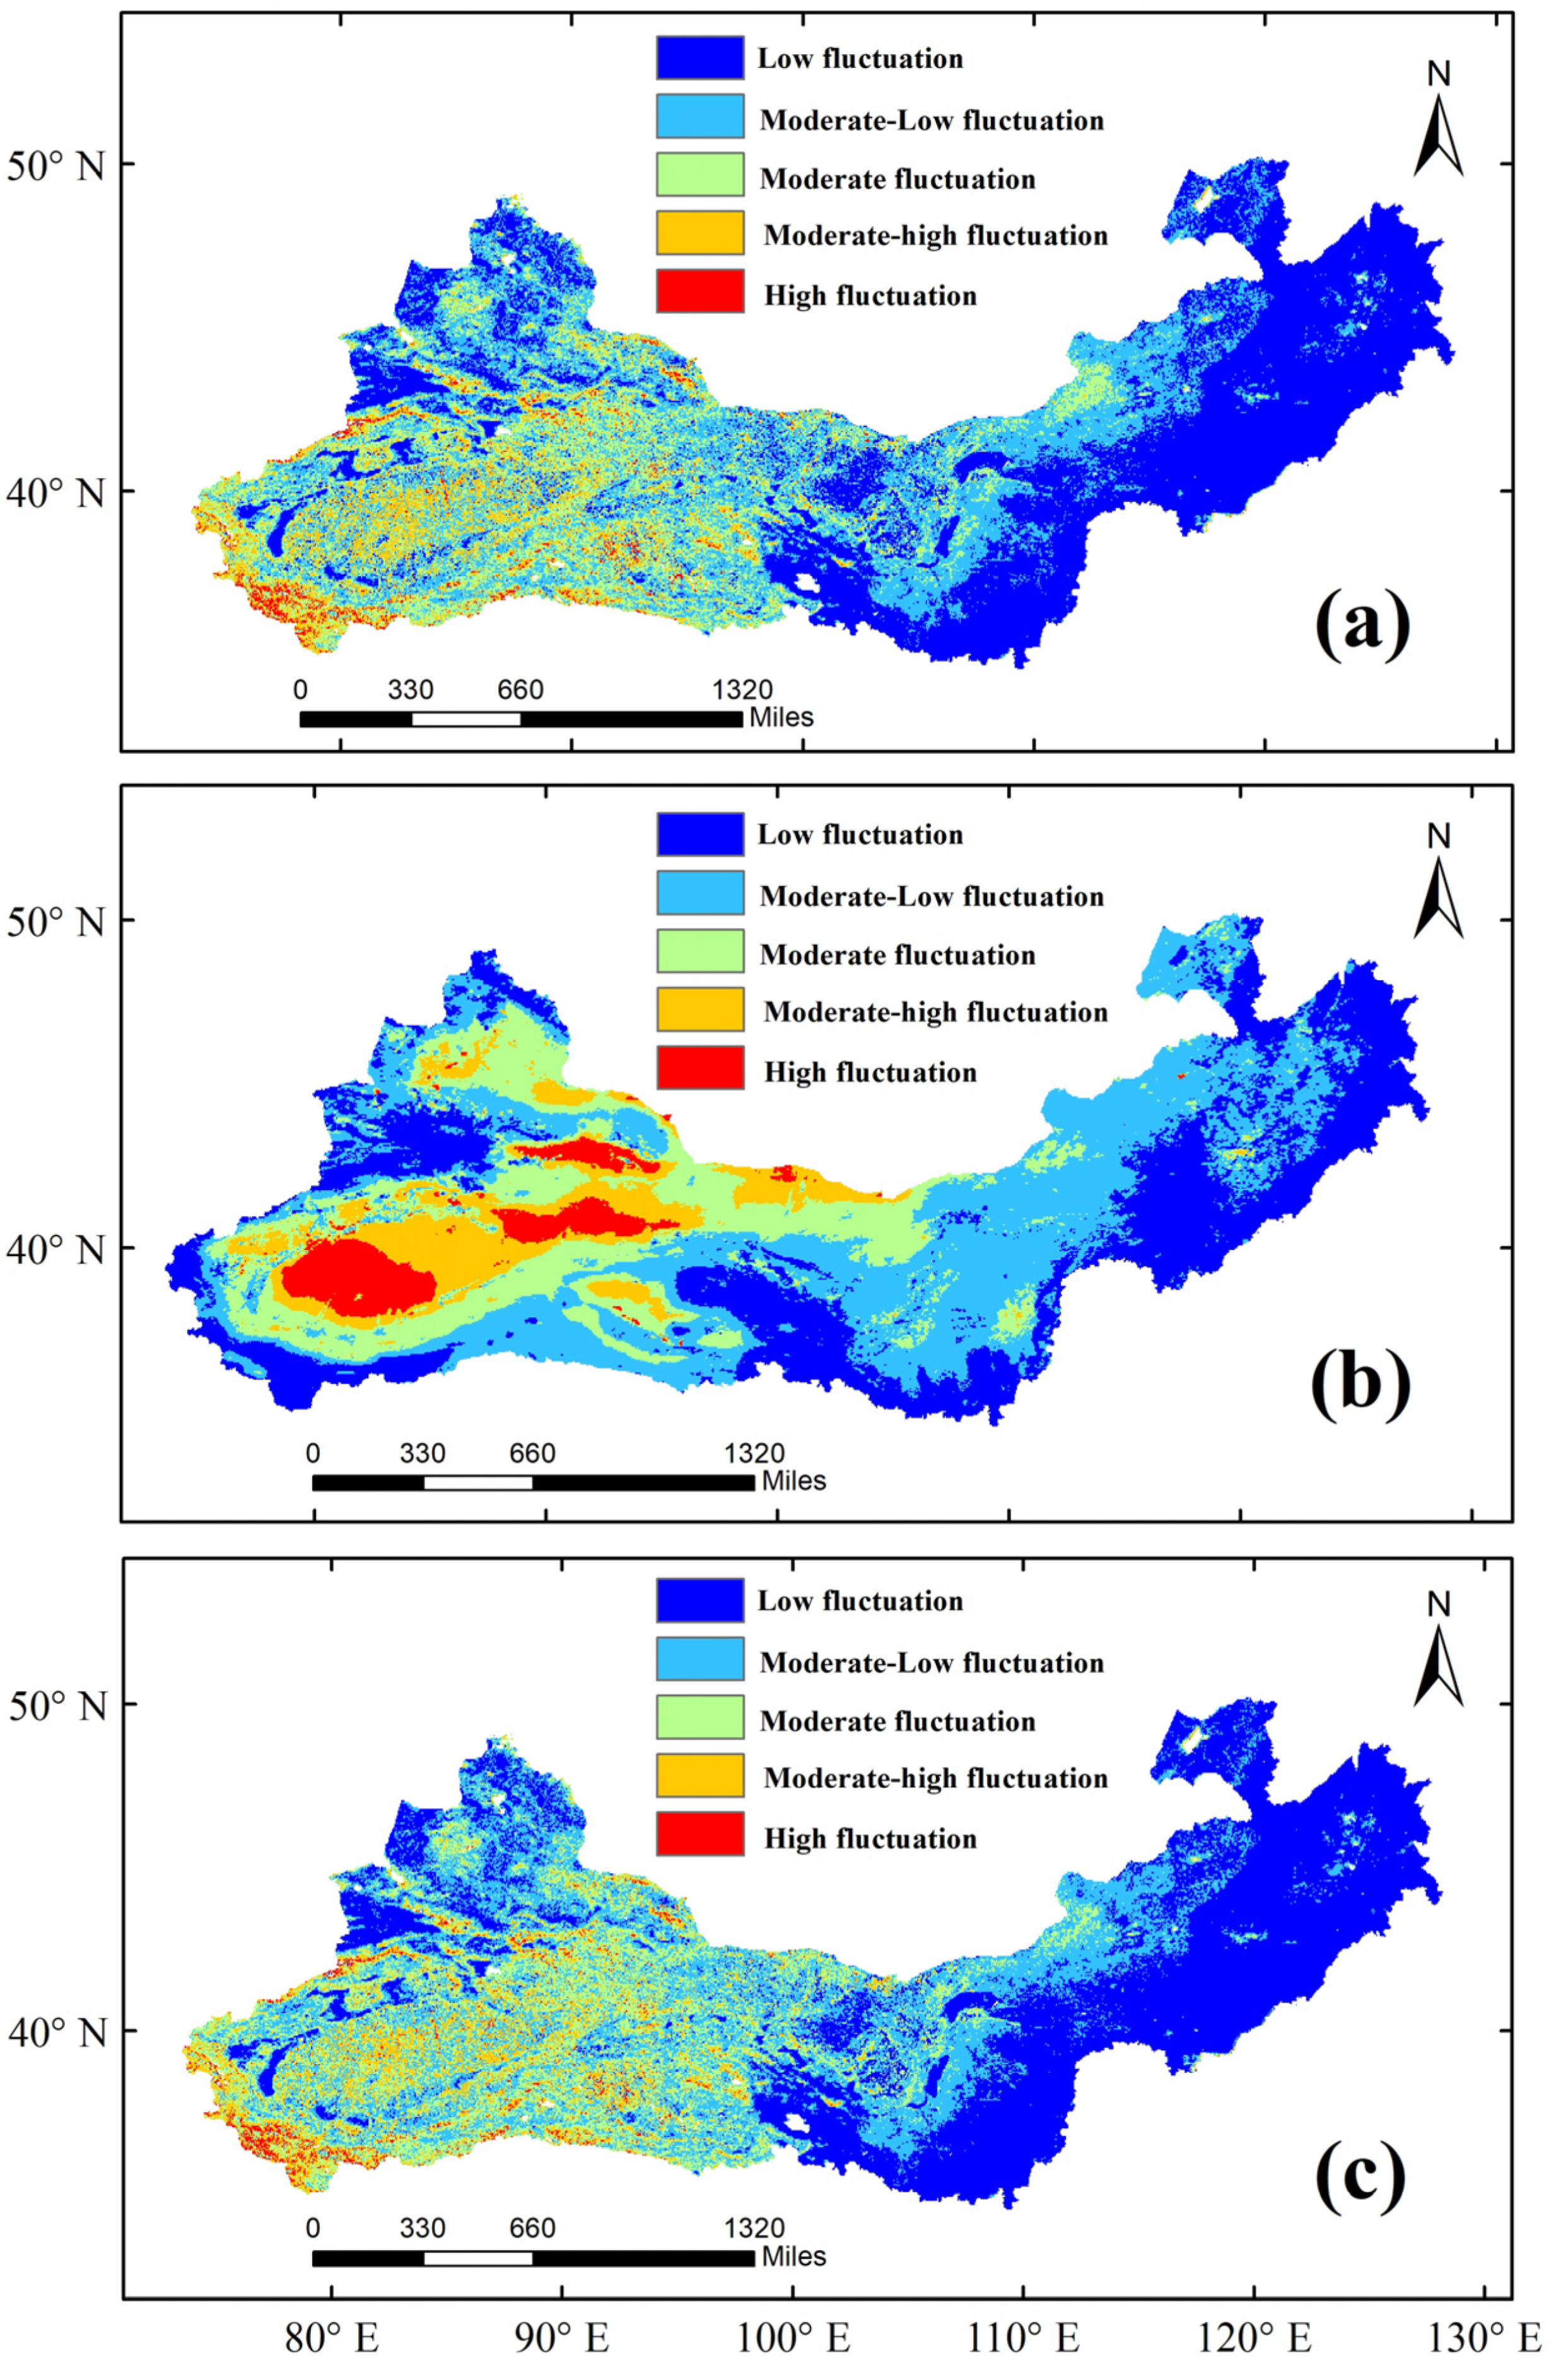
3.3. The Fluctuation Analysis of GPP, ET, and WUE
3.4. The Sustainability Analysis of GPP, ET, and WUE
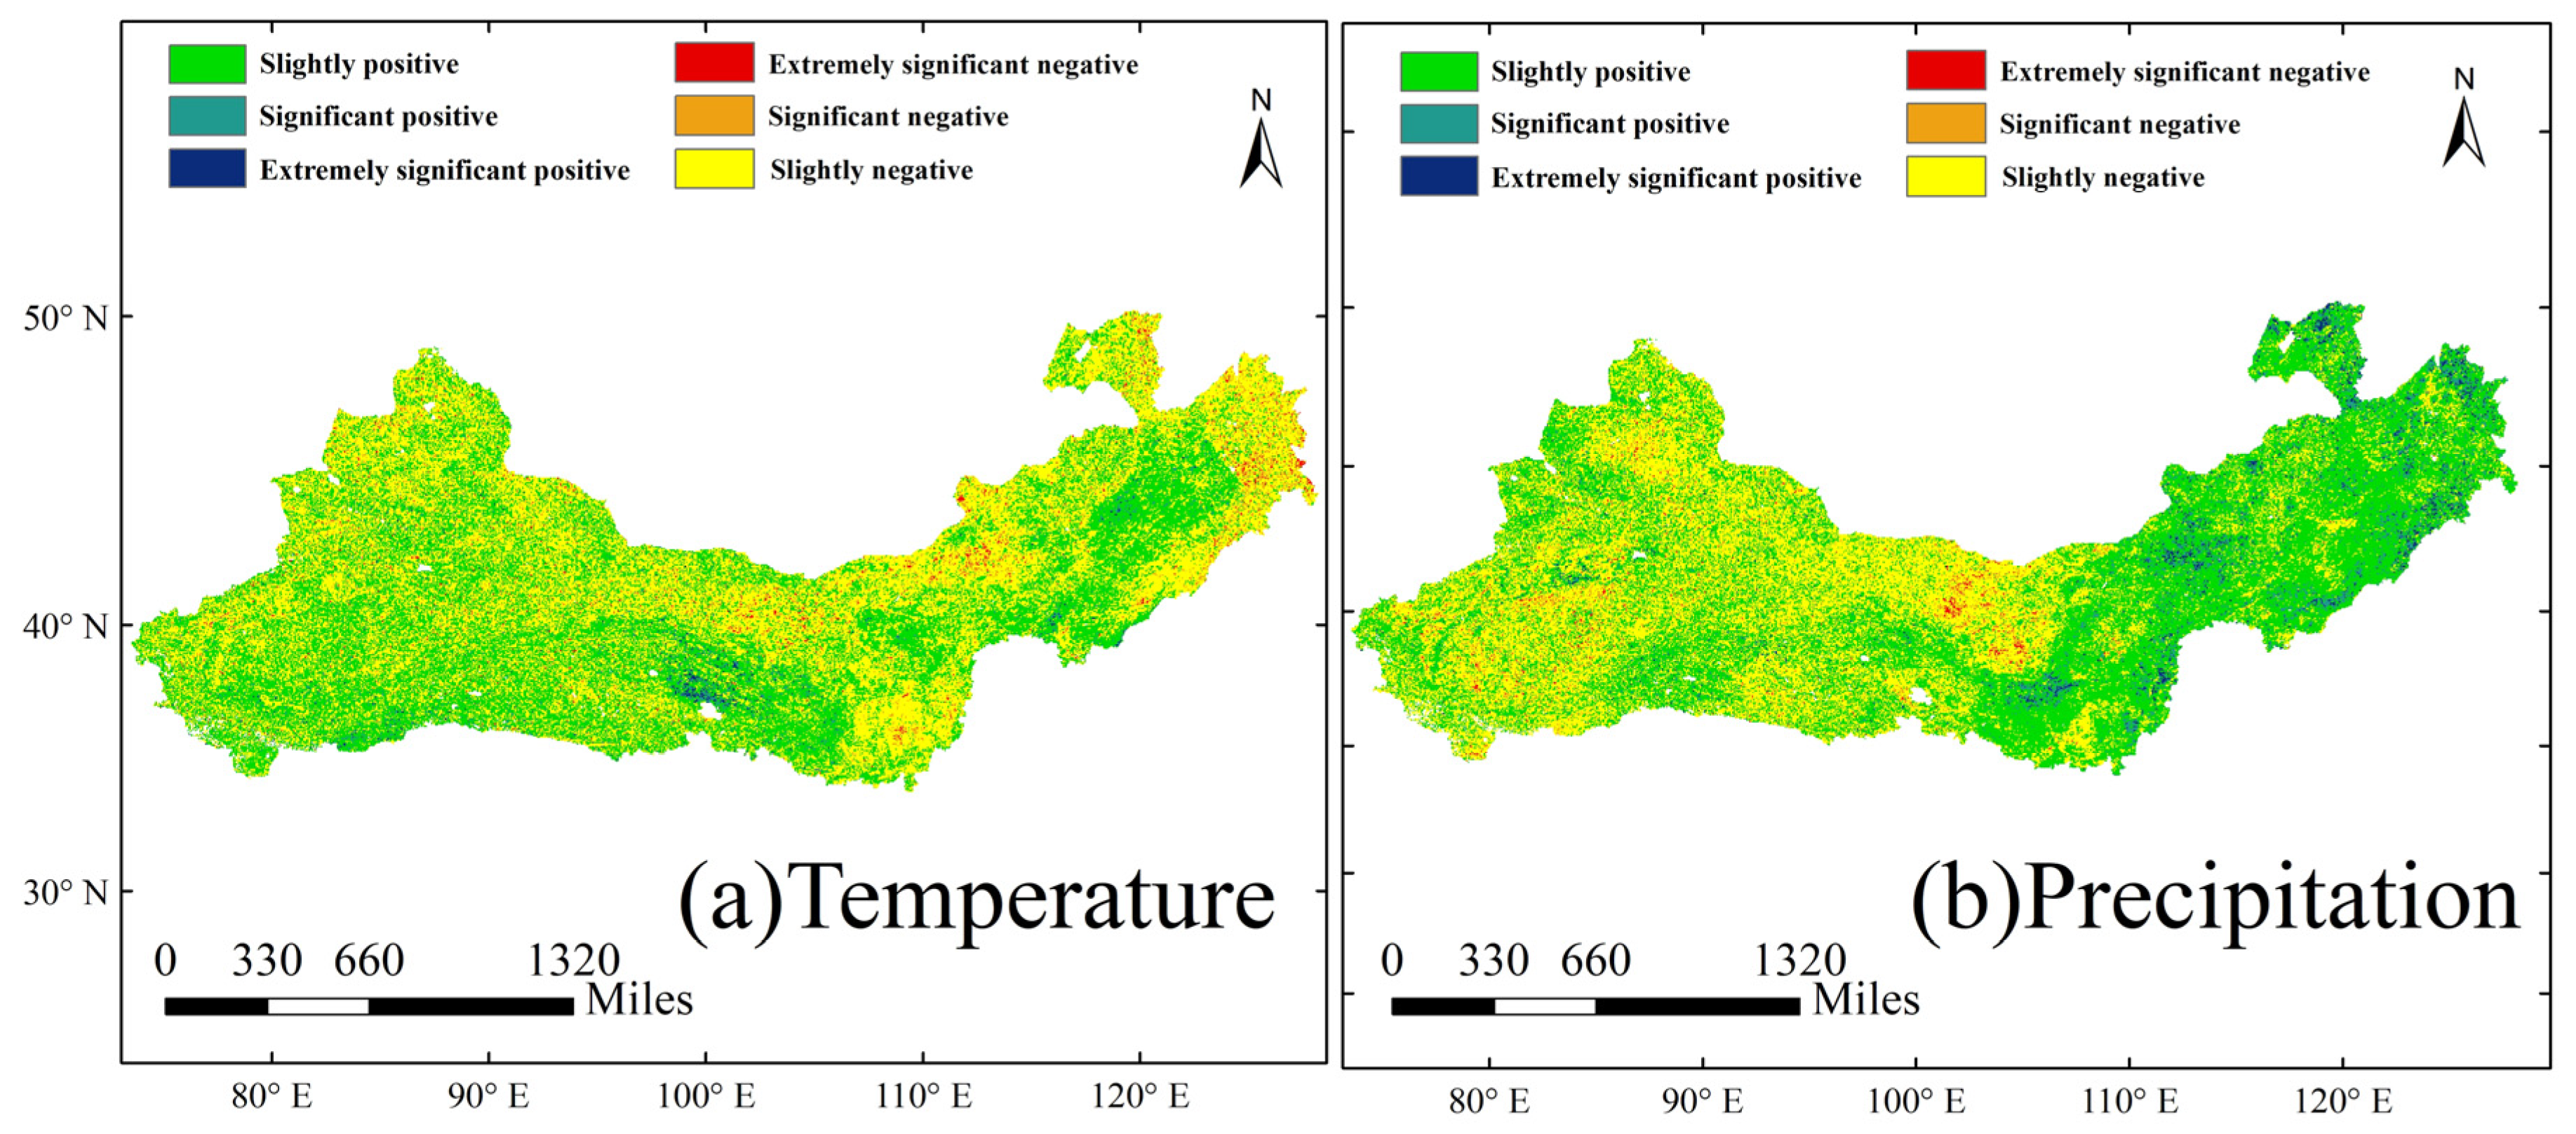
3.5. Analysis of Influencing Climate Factors of Vegetation WUE Change
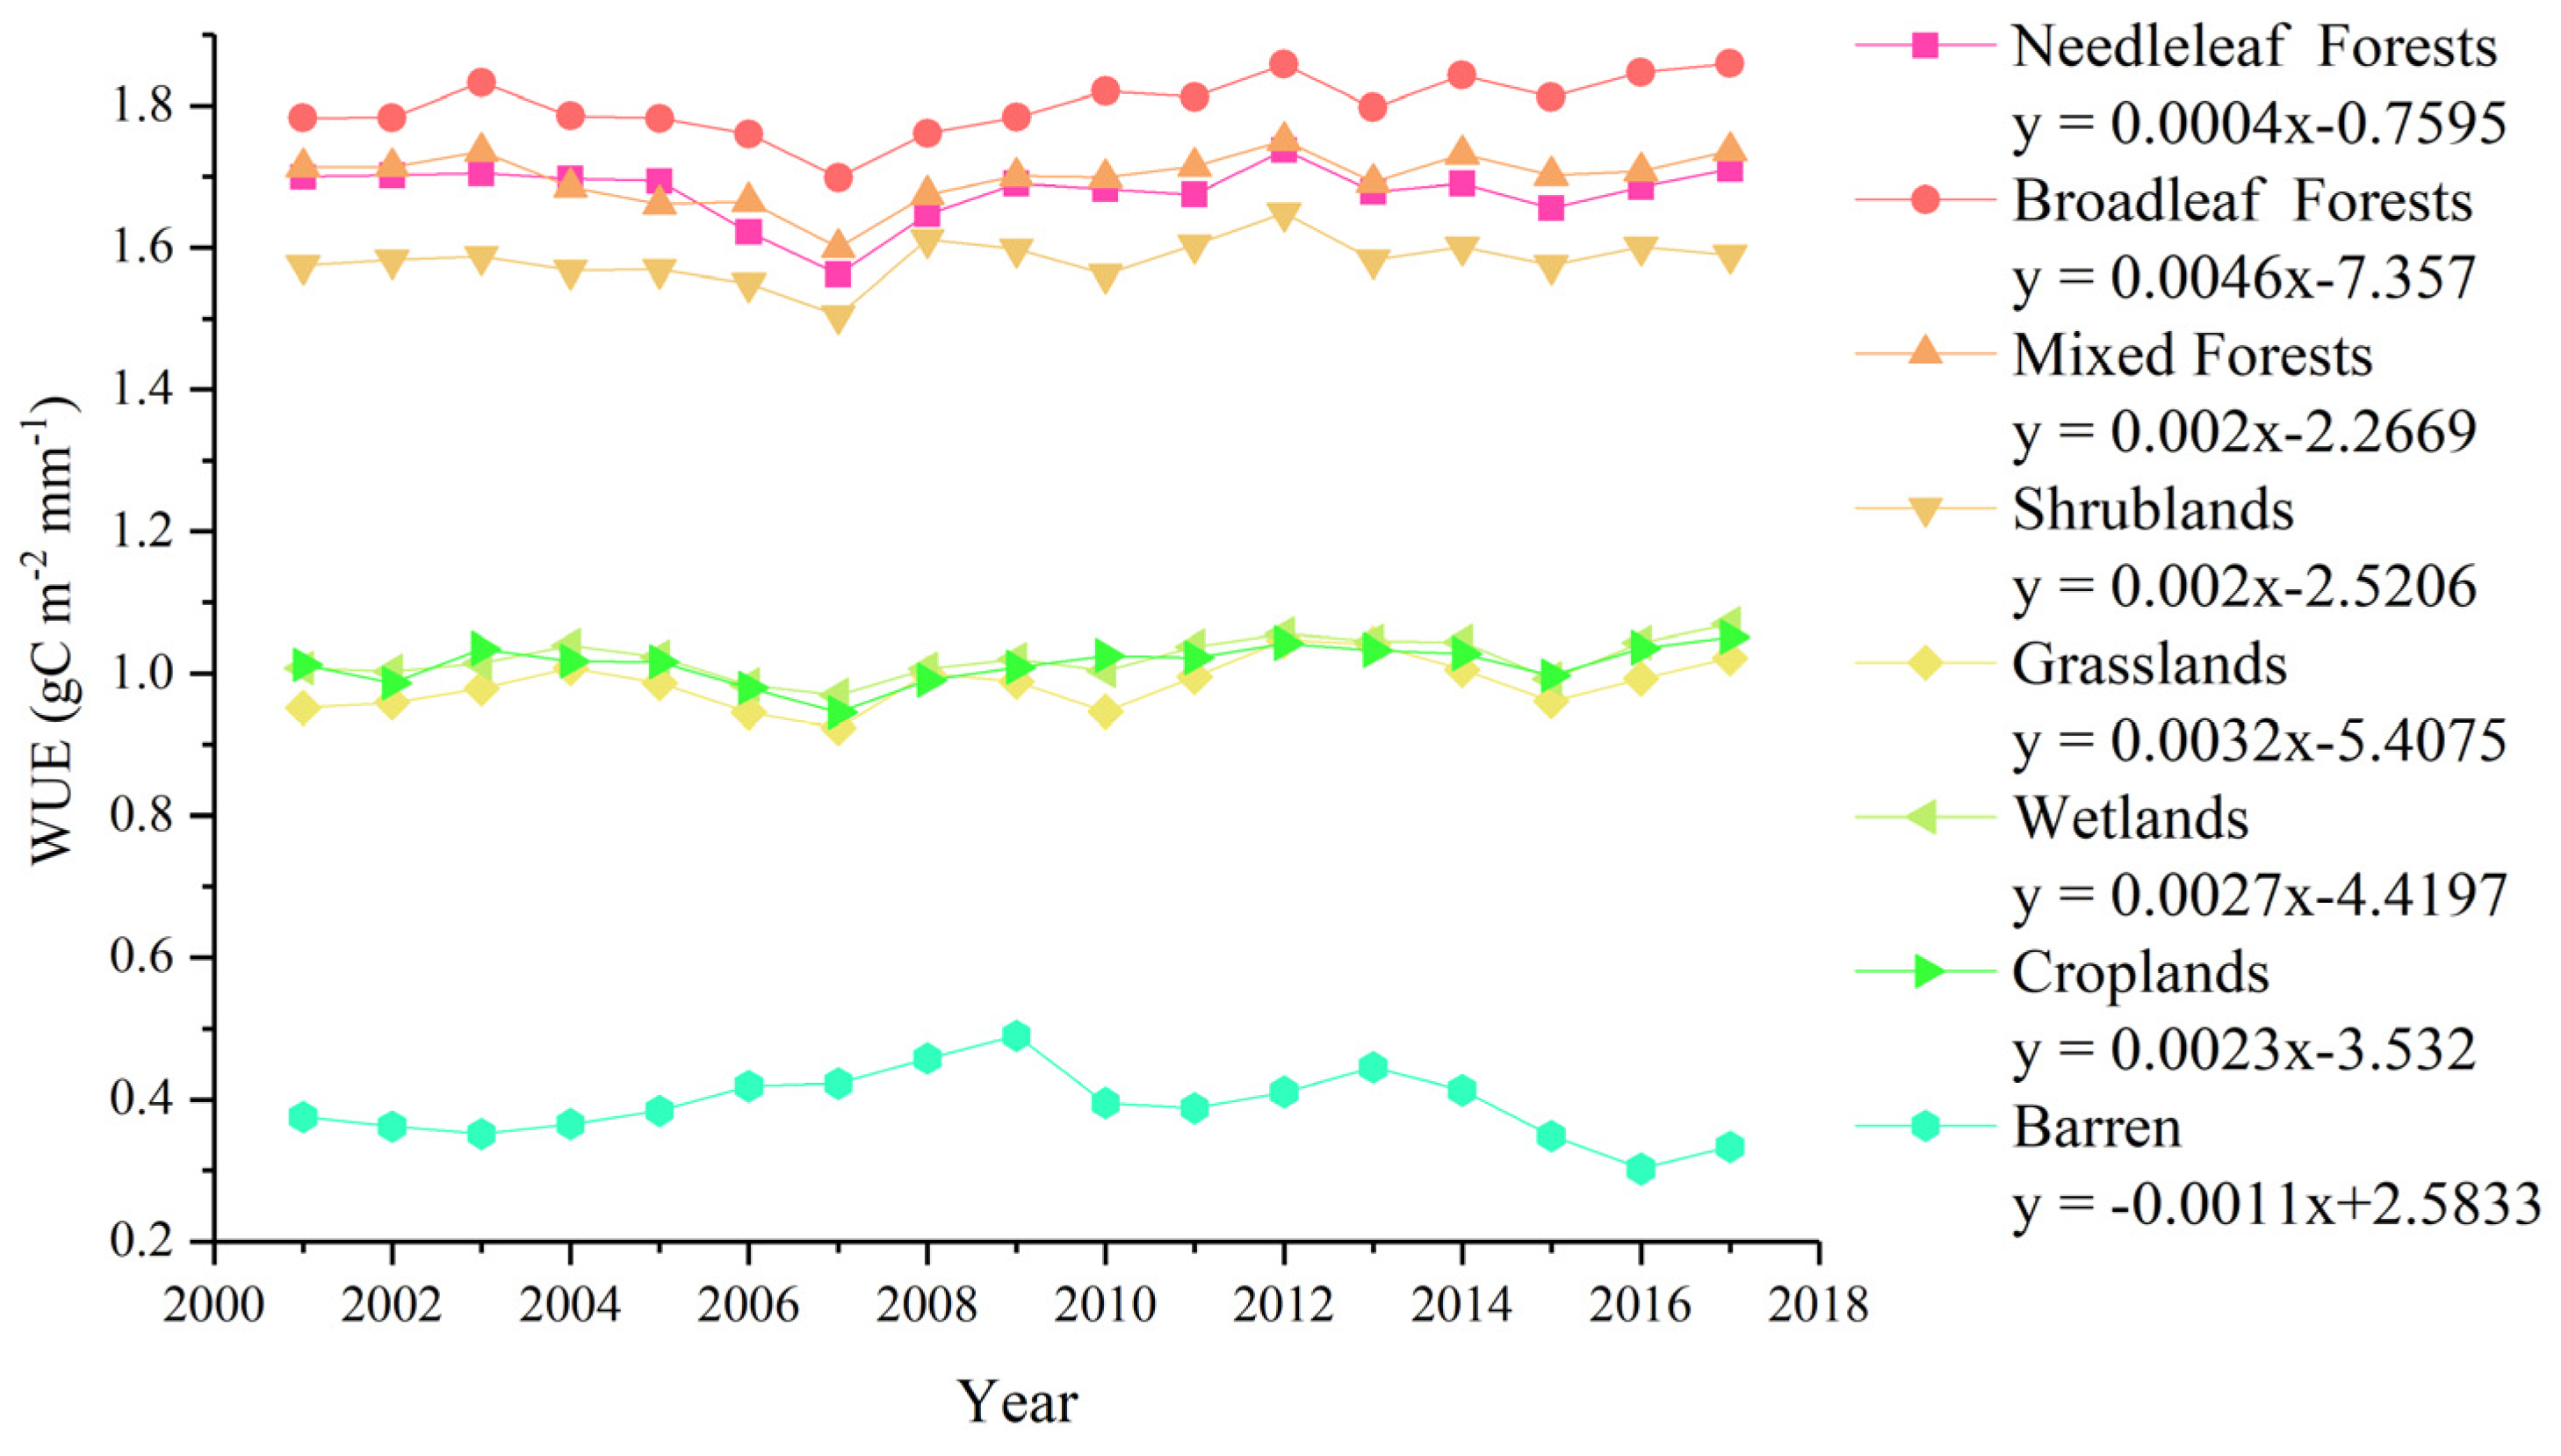
3.6. WUE Variations in Different Vegetation Covers
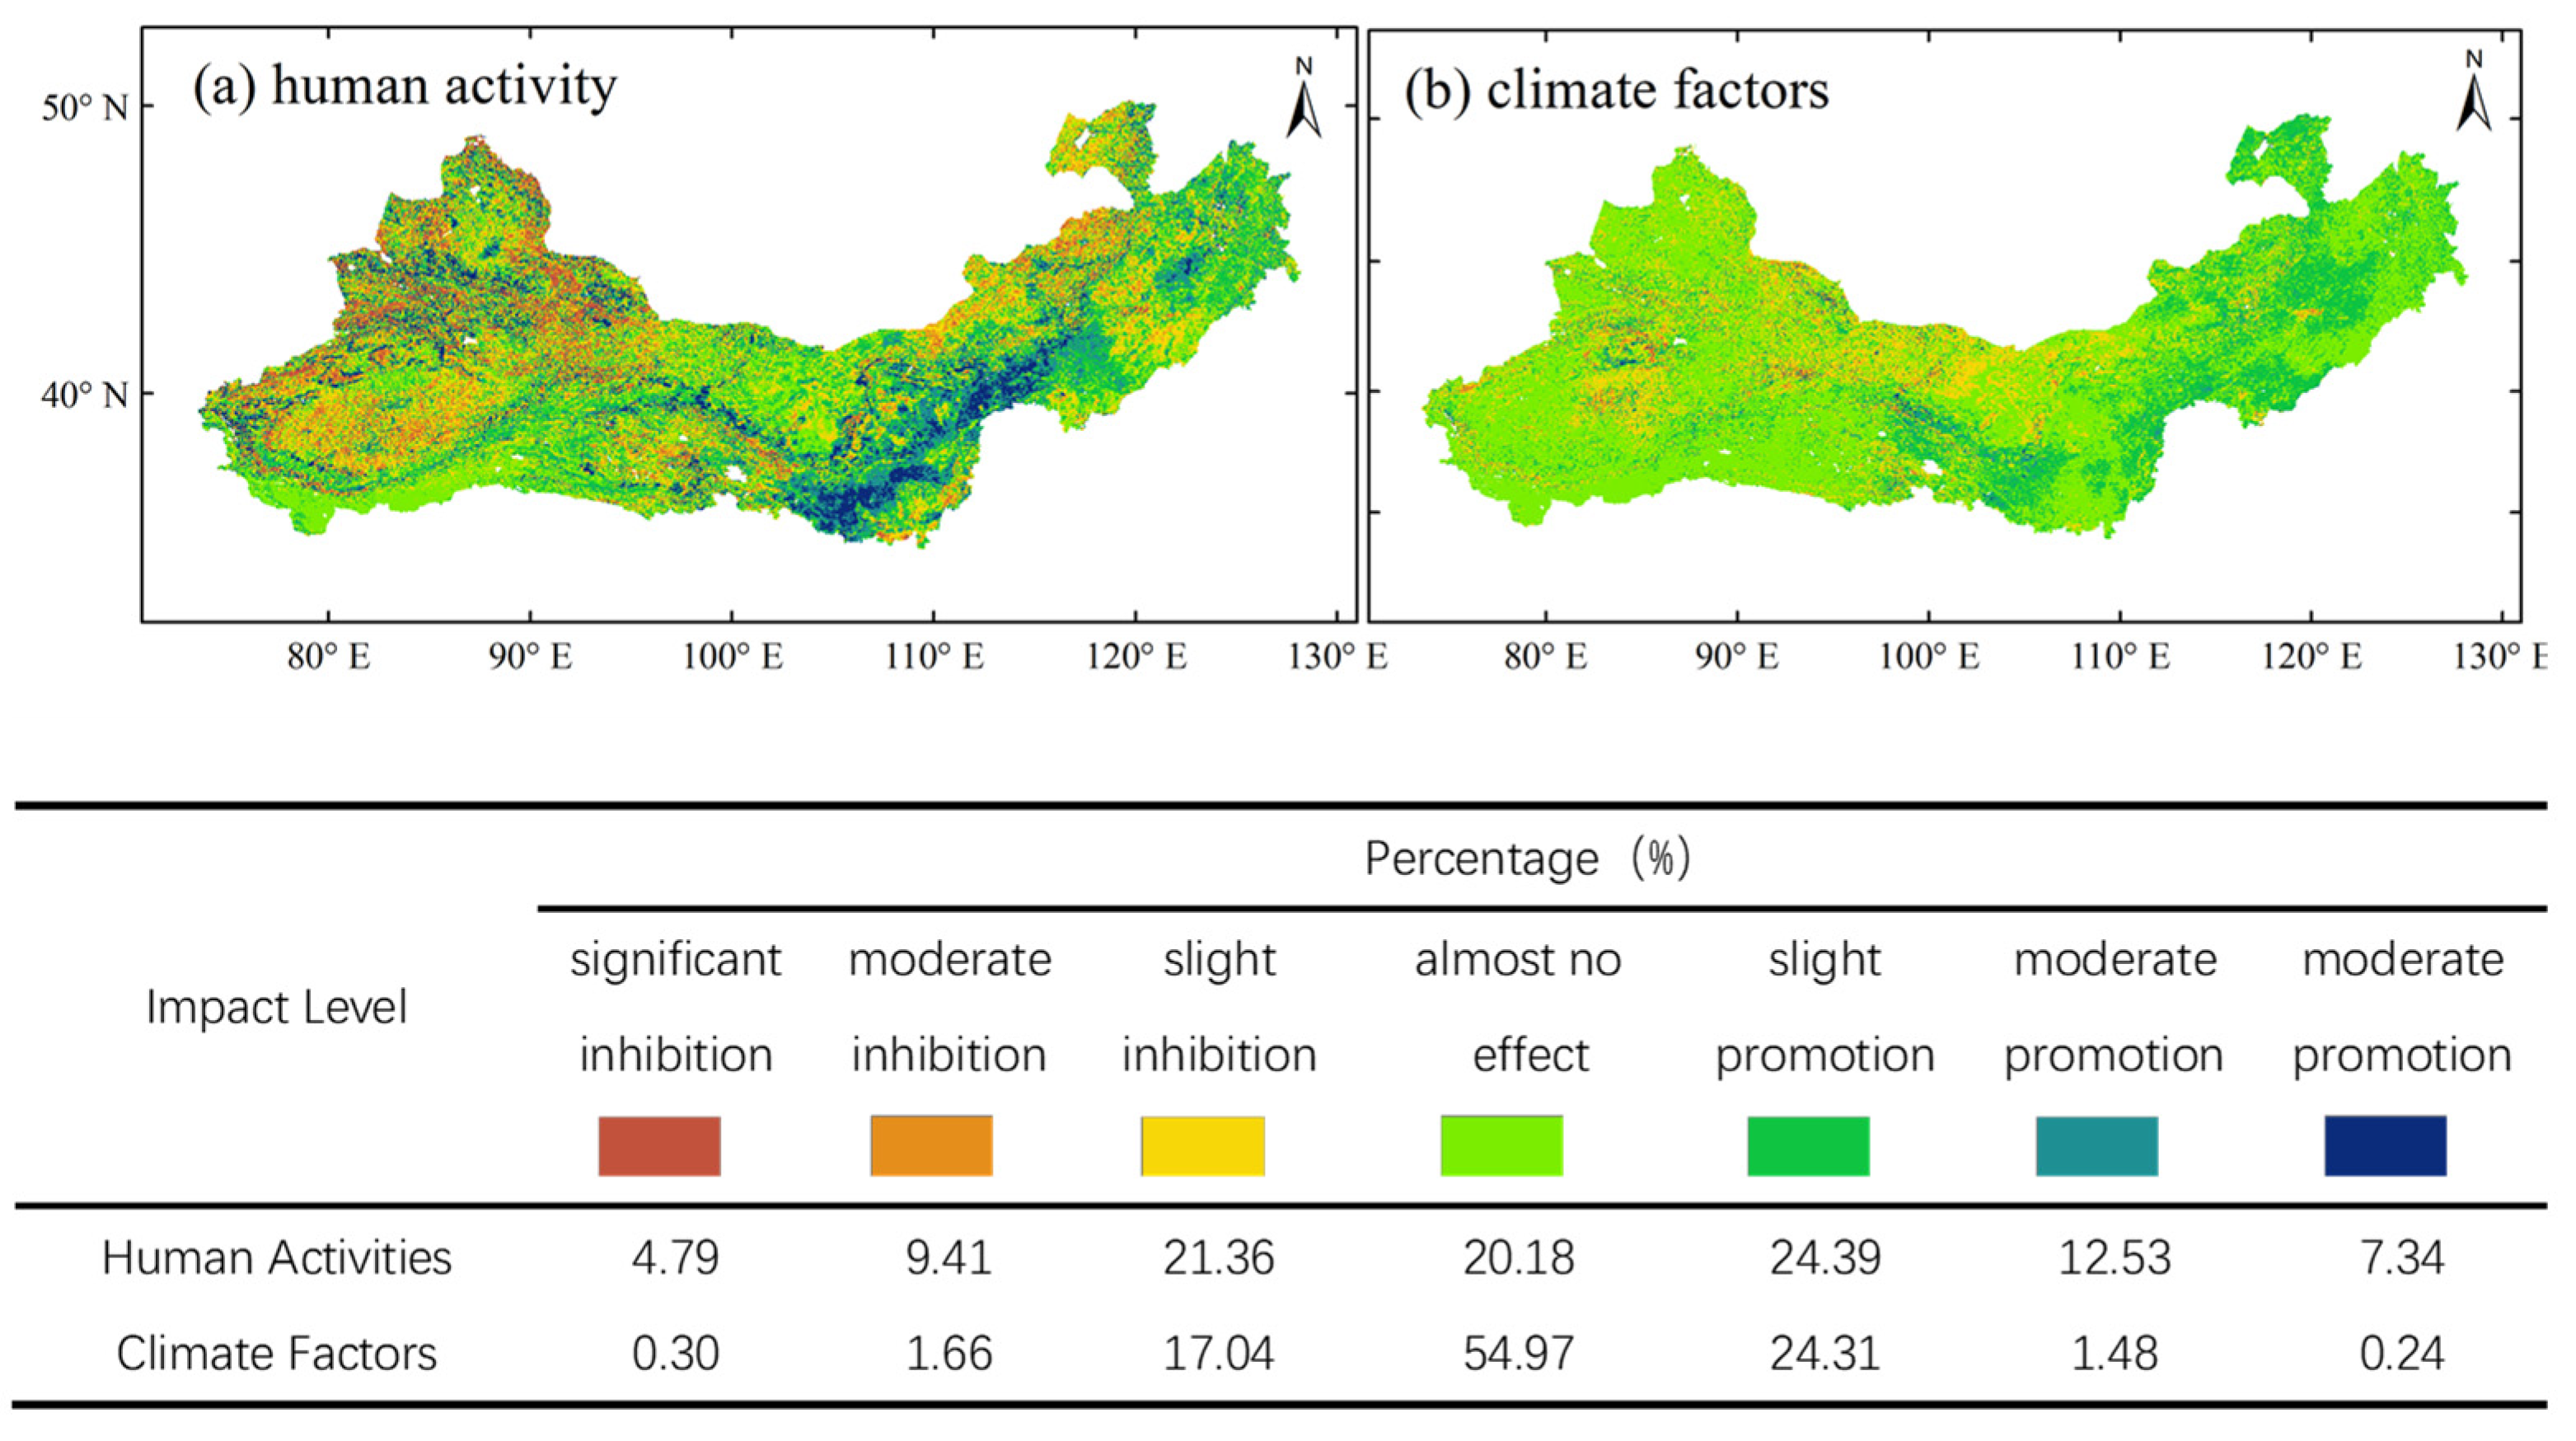
3.7. Effects of Human Activities and Climate Factors on WUE
4. Discussion
4.1. Comparisons of WUE over China
4.2. Potential Link to Sustainable Management of Environment
4.3. Limitations and Future Perspectives
5. Conclusions
Author Contributions
Funding
Institutional Review Board Statement
Informed Consent Statement
Data Availability Statement
Conflicts of Interest
References
- Jin, Z.; Liang, W.; Yang, Y.; Zhang, W.; Yan, J.; Chen, X.; Li, S.; Mo, X. Separating Vegetation Greening and Climate Change Controls on Evapotranspiration trend over the Loess Plateau. Sci. Rep. 2017, 7, 8191. [Google Scholar] [CrossRef]
- Chen, C.; Park, T.; Wang, X.; Piao, S.; Xu, B.; Chaturvedi, R.K.; Fuchs, R.; Brovkin, V.; Ciais, P.; Fensholt, R.; et al. China and India lead in greening of the world through land-use management. Nat. Sustain. 2019, 2, 122–129. [Google Scholar] [CrossRef] [PubMed]
- Ge, J.; Guo, W.; Pitman, A.J.; De Kauwe, M.G.; Chen, X.; Fu, C. The Nonradiative Effect Dominates Local Surface Temperature Change Caused by Afforestation in China. J. Clim. 2019, 32, 4445–4471. [Google Scholar] [CrossRef]
- Huang, M.; Piao, S.; Zeng, Z.; Peng, S.; Ciais, P.; Cheng, L.; Mao, J.; Poulter, B.; Shi, X.; Yao, Y.; et al. Seasonal responses of terrestrial ecosystem water-use efficiency to climate change. Glob. Chang. Biol. 2016, 22, 2165–2177. [Google Scholar] [CrossRef] [PubMed]
- Delgado, R.C.; Pereira, M.G.; Teodoro, P.E.; dos Santos, G.L.; de Carvalho, D.C.; Magistrali, I.C.; Vilanova, R.S. Seasonality of gross primary production in the Atlantic Forest of Brazil. Glob. Ecol. Conserv. 2018, 14, e00392. [Google Scholar] [CrossRef]
- He, B.; Chen, A.; Wang, H.; Wang, Q. Dynamic Response of Satellite-Derived Vegetation Growth to Climate Change in the Three North Shelter Forest Region in China. Remote Sens. 2015, 7, 9998–10016. [Google Scholar] [CrossRef] [Green Version]
- Li, Y.; Wang, X.; Chen, Y.; Wang, M. Land surface temperature variations and their relationship to fractional vegetation coverage in subtropical regions: A case study in Fujian Province, China. Int. J. Remote Sens. 2019, 41, 2081–2097. [Google Scholar] [CrossRef]
- Song, Q.H.; Fei, X.H.; Zhang, Y.P.; Sha, L.Q.; Liu, Y.T.; Zhou, W.J.; Wu, C.S.; Lu, Z.Y.; Luo, K.; Gao, J.B.; et al. Water use efficiency in a primary subtropical evergreen forest in Southwest China. Sci. Rep. 2017, 7, 43031. [Google Scholar] [CrossRef] [Green Version]
- Wang, Y.; Ma, Y.; Li, H.; Yuan, L. Carbon and water fluxes and their coupling in an alpine meadow ecosystem on the northeastern Tibetan Plateau. Theor. Appl. Climatol. 2020, 142, 1–18. [Google Scholar] [CrossRef]
- Yang, Y.; Guan, H.; Batelaan, O.; McVicar, T.R.; Long, D.; Piao, S.; Liang, W.; Liu, B.; Jin, Z.; Simmons, C.T. Contrasting responses of water use efficiency to drought across global terrestrial ecosystems. Sci. Rep. 2016, 6, 23284. [Google Scholar] [CrossRef] [Green Version]
- Martin, B.; Thorstenson, Y.R. Stable Carbon Isotope Composition (delta-c-13), Water Use Efficiency, and Biomass Productivity of Lycopersicon esculentum, Lycopersicon pennellii, and the F1 Hybrid. Plant Physiol. 1988, 88, 213–217. [Google Scholar] [CrossRef] [Green Version]
- Donovan, L.A.; Dudley, S.A.; Rosenthal, D.M.; Ludwig, F. Phenotypic selection on leaf water use efficiency and related ecophysiological traits for natural populations of desert sunflowers. Oecologia 2007, 152, 13–25. [Google Scholar] [CrossRef]
- Wang, H.; Li, X.; Tan, J. Interannual Variations of Evapotranspiration and Water Use Efficiency over an Oasis Cropland in Arid Regions of North-Western China. Water 2020, 12, 1239. [Google Scholar] [CrossRef]
- Wang, Y.; Zhou, L.; Ping, X.; Jia, Q.; Li, R. Ten-year variability and environmental controls of ecosystem water use efficiency in a rainfed maize cropland in Northeast China. Field Crop. Res. 2018, 226, 48–55. [Google Scholar] [CrossRef]
- Gang, C.; Wang, Z.; Zhou, W.; Chen, Y.; Li, J.; Chen, J.; Qi, J.; Odeh, I.; Groisman, P.Y. Assessing the Spatiotemporal Dynamic of Global Grassland Water Use Efficiency in Response to Climate Change from 2000 to 2013. J. Agron. Crop. Sci. 2016, 202, 343–354. [Google Scholar] [CrossRef]
- Jiang, Y.; Still, C.J.; Rastogi, B.; Page, G.F.M.; Wharton, S.; Meinzer, F.C.; Voelker, S.; Kim, J.B. Trends and controls on water-use efficiency of an old-growth coniferous forest in the Pacific Northwest. Environ. Res. Lett. 2019, 14, 074029. [Google Scholar] [CrossRef] [Green Version]
- Liu, X.; Chen, X.; Li, R.; Long, F.; Zhang, L.; Zhang, Q.; Li, J. Water-use efficiency of an old-growth forest in lower subtropical China. Sci. Rep. 2017, 7, 42761. [Google Scholar] [CrossRef] [PubMed]
- Tang, X.; Li, H.; Xu, X.; Luo, J.; Li, X.; Ding, Z.; Xie, J. Potential of MODIS data to track the variability in ecosystem water-use efficiency of temperate deciduous forests. Ecol. Eng. 2016, 91, 381–391. [Google Scholar] [CrossRef]
- Xie, J.; Chen, J.; Sun, G.; Zha, T.; Yang, B.; Chu, H.; Liu, J.; Wan, S.; Zhou, C.; Ma, H.; et al. Ten-year variability in ecosystem water use efficiency in an oak-dominated temperate forest under a warming climate. Agric. For. Meteorol. 2016, 218–219, 209–217. [Google Scholar] [CrossRef]
- Guo, L.; Sun, F.; Liu, W.; Zhang, Y.; Wang, H.; Cui, H.; Wang, H.; Zhang, J.; Du, B. Response of Ecosystem Water Use Efficiency to Drought over China during 1982–2015: Spatiotemporal Variability and Resilience. Forests 2019, 10, 598. [Google Scholar] [CrossRef] [Green Version]
- Tang, X.; Ma, M.; Ding, Z.; Xu, X.; Yao, L.; Huang, X.; Gu, Q.; Song, L. Remotely Monitoring Ecosystem Water Use Efficiency of Grassland and Cropland in China’s Arid and Semi-Arid Regions with MODIS Data. Remote Sens. 2017, 9, 616. [Google Scholar] [CrossRef] [Green Version]
- Wang, L.; Li, M.; Wang, J.; Li, X.; Wang, L. An analytical reductionist framework to separate the effects of climate change and human activities on variation in water use efficiency. Sci. Total Environ. 2020, 727, 138306. [Google Scholar] [CrossRef]
- Zhao, J.; Xu, T.; Xiao, J.; Liu, S.; Mao, K.; Song, L.; Yao, Y.; He, X.; Feng, H. Responses of Water Use Efficiency to Drought in Southwest China. Remote Sens. 2020, 12, 199. [Google Scholar] [CrossRef] [Green Version]
- Zheng, H.; Lin, H.; Zhou, W.; Bao, H.; Zhu, X.; Jin, Z.; Song, Y.; Wang, Y.; Liu, W.; Tang, Y. Revegetation has increased ecosystem water-use efficiency during 2000–2014 in the Chinese Loess Plateau: Evidence from satellite data. Ecol. Indic. 2019, 102, 507–518. [Google Scholar] [CrossRef]
- Sun, S.; Song, Z.; Wu, X.; Wang, T.; Wu, Y.; Du, W.; Che, T.; Huang, C.; Zhang, X.; Ping, B.; et al. Spatio-temporal variations in water use efficiency and its drivers in China over the last three decades. Ecol. Indic. 2018, 94, 292–304. [Google Scholar] [CrossRef]
- Lu, Y.; Zhang, X.; Chen, S.; Shao, L.; Sun, H. Changes in water use efficiency and water footprint in grain production over the past 35 years: A case study in the North China Plain. J. Clean Prod. 2016, 116, 71–79. [Google Scholar] [CrossRef]
- Liu, N.; Kala, J.; Liu, S.; Haverd, V.; Dell, B.; Smettem, K.R.J.; Harper, R.J. Drought can offset potential water use efficiency of forest ecosystems from rising atmospheric CO2. J. Environ. Sci. 2020, 90, 262–274. [Google Scholar] [CrossRef]
- Lu, X.; Chen, M.; Liu, Y.; Miralles, D.G.; Wang, F. Enhanced water use efficiency in global terrestrial ecosystems under increasing aerosol loadings. Agric. For. Meteorol. 2017, 237–238, 39–49. [Google Scholar] [CrossRef]
- El Masri, B.; Schwalm, C.; Huntzinger, D.N.; Mao, J.; Shi, X.; Peng, C.; Fisher, J.B.; Jain, A.K.; Tian, H.; Poulter, B.; et al. Carbon and Water Use Efficiencies: A Comparative Analysis of Ten Terrestrial Ecosystem Models under Changing Climate. Sci. Rep. 2019, 9, 14680. [Google Scholar] [CrossRef] [Green Version]
- Sterling, S.M.; Ducharne, A.; Polcher, J. The impact of global land-cover change on the terrestrial water cycle. Nat. Clim. Chang. 2012, 3, 385–390. [Google Scholar] [CrossRef]
- Du, X.; Zhao, X.; Zhou, T.; Jiang, B.; Xu, P.; Wu, D.; Tang, B. Effects of Climate Factors and Human Activities on the Ecosystem Water Use Efficiency throughout Northern China. Remote Sens. 2019, 11, 2766. [Google Scholar] [CrossRef] [Green Version]
- Guo, L.; Shan, N.; Zhang, Y.; Sun, F.; Liu, W.; Shi, Z.; Zhang, Q. Separating the effects of climate change and human activity on water use efficiency over the Beijing-Tianjin Sand Source Region of China. Sci. Total Environ. 2019, 690, 584–595. [Google Scholar] [CrossRef]
- Huang, S.W.; Kong, J.M. Assessing Land Degradation Dynamics and Distinguishing Human-Induced Changes from Climate Factors in the Three-North Shelter Forest Region of China. Isprs Int. J. Geo. Inf. 2016, 5, 158. [Google Scholar] [CrossRef] [Green Version]
- Yang, F.; Yang, M. Greening the one belt and one road initiative. Mitig Adapt. Strat Gl. 2019, 24, 735–748. [Google Scholar] [CrossRef]
- Ahmad, F.; Draz, M.U.; Su, L.; Ozturk, I.; Rauf, A. Tourism and Environmental Pollution: Evidence from the One Belt One Road Provinces of Western China. Sustainability 2018, 10, 3520. [Google Scholar] [CrossRef] [Green Version]
- Li, F.; Zhang, S.W.; Yuan, K.Y. Land use change in farming-pastoral ecotone and its effects on ecosystem services value: A case study in West Jilin, China. Hum. Ecol Risk Assess. 2018, 24, 551–566. [Google Scholar]
- Xie, X.; Liang, S.; Yao, Y.; Jia, K.; Meng, S.; Li, J. Detection and attribution of changes in hydrological cycle over the Three-North region of China: Climate change versus afforestation effect. Agric. For. Meteorol. 2015, 203, 74–87. [Google Scholar] [CrossRef]
- Cao, S. Why large-scale afforestation efforts in China have failed to solve the desertification problem. Environ. Sci. Technol. 2008, 42, 1826–1831. [Google Scholar] [CrossRef] [Green Version]
- Cao, S. Impact of Spatial and Temporal Scales on Afforestation Effects: Response to Comment on “Why Large-Scale Afforestation Efforts in China Have Failed to Solve the Desertification Problem”. Environ. Sci. Technol. 2008, 42, 7724–7725. [Google Scholar] [CrossRef]
- Cao, S. Response to Comment on “Why Large-Scale Afforestation Efforts in China Have Failed to Solve the Desertification Problem”. Environ. Sci. Technol. 2008, 42, 8166. [Google Scholar] [CrossRef]
- Liu, X. Comment on “Why Large-Scale Afforestation Efforts in China Have Failed to Solve the Desertification Problem”. Environ. Sci. Technol. 2008, 42, 8165. [Google Scholar] [CrossRef]
- Yang, X.; Ci, L. Comment on “Why Large-Scale Afforestation Efforts in China Have Failed To Solve the Desertification Problem”. Environ. Sci. Technol. 2008, 42, 7722–7723. [Google Scholar] [CrossRef]
- Yuan, W.P.; Liu, S.G.; Yu, G.R.; Bonnefond, J.M.; Chen, J.Q.; Davis, K.; Desai, A.R.; Goldstein, A.H.; Gianelle, D.; Rossi, F.; et al. Global estimates of evapotranspiration and gross primary production based on MODIS and global meteorology data. Remote Sens. Environ. 2010, 114, 1416–1431. [Google Scholar] [CrossRef] [Green Version]
- Yao, Y.; Liang, S.; Li, X.; Hong, Y.; Fisher, J.B.; Zhang, N.; Chen, J.; Cheng, J.; Zhao, S.; Zhang, X.; et al. Bayesian multimodel estimation of global terrestrial latent heat flux from eddy covariance, meteorological, and satellite observations. J. Geophys. Res. Atmos. 2014, 119, 4521–4545. [Google Scholar] [CrossRef]
- Peng, S.; Ding, Y.; Liu, W.; Li, Z. 1 km monthly temperature and precipitation dataset for China from 1901 to 2017. Earth Syst. Sci. Data 2019, 11, 1931–1946. [Google Scholar] [CrossRef] [Green Version]
- Liu, X.; Feng, X.; Fu, B. Changes in global terrestrial ecosystem water use efficiency are closely related to soil moisture. Sci. Total Environ. 2020, 698, 134165. [Google Scholar] [CrossRef] [PubMed]
- Zhang, Y.; Song, C.; Sun, G.; Band, L.E.; McNulty, S.; Noormets, A.; Zhang, Q.; Zhang, Z. Development of a coupled carbon and water model for estimating global gross primary productivity and evapotranspiration based on eddy flux and remote sensing data. Agric. For. Meteorol. 2016, 223, 116–131. [Google Scholar] [CrossRef] [Green Version]
- Sun, Y.; Piao, S.; Huang, M.; Ciais, P.; Zeng, Z.; Cheng, L.; Li, X.; Zhang, X.; Mao, J.; Peng, S.; et al. Global patterns and climate drivers of water-use efficiency in terrestrial ecosystems deduced from satellite-based datasets and carbon cycle models. Glob. Ecol. Biogeogr. 2016, 25, 311–323. [Google Scholar] [CrossRef] [Green Version]
- Yang, S.; Zhang, J.; Zhang, S.; Wang, J.; Bai, Y.; Yao, F.; Guo, H. The potential of remote sensing-based models on global water-use efficiency estimation: An evaluation and intercomparison of an ecosystem model (BESS) and algorithm (MODIS) using site level and upscaled eddy covariance data. Agric. For. Meteorol. 2020, 287, 107959. [Google Scholar] [CrossRef]
- Zhu, X.-J.; Yu, G.-R.; Wang, Q.-F.; Hu, Z.-M.; Zheng, H.; Li, S.-G.; Sun, X.-M.; Zhang, Y.-P.; Yan, J.-H.; Wang, H.-M.; et al. Spatial variability of water use efficiency in China’s terrestrial ecosystems. Glob. Planet. Chang. 2015, 129, 37–44. [Google Scholar] [CrossRef]
- Li, G.; Chen, W.; Li, R.; Zhang, X.; Liu, J. Assessing the spatiotemporal dynamics of ecosystem water use efficiency across China and the response to natural and human activities. Ecol. Indic. 2021, 126, 107680. [Google Scholar] [CrossRef]
- Zhao, A.; Zhang, A.; Cao, S.; Feng, L.; Pei, T. Spatiotemporal patterns of water use efficiency in China and responses to multi-scale drought. Appl. Clim. 2020, 140, 559–570. [Google Scholar] [CrossRef]
- Salazar-Moreno, R.; Rojano-Aguilar, A.; Lopez-Cruz, I.L. Water Use Efficiency in Controlled Agriculture. Tecnol. Cienc. Agua 2014, 5, 177–183. [Google Scholar]
- Stroosnijder, L.; Moore, D.; Alharbi, A.; Argaman, E.; Biazin, B.; van den Elsen, E. Improving water use efficiency in drylands. Curr. Opin. Environ. Sust. 2012, 4, 497–506. [Google Scholar] [CrossRef]
- Rufi-Salis, M.; Petit-Boix, A.; Villalba, G.; Sanjuan-Delmas, D.; Parada, F.; Ercilla-Montserrat, M.; Arcas-Pilz, V.; Munoz-Liesa, J.; Rieradevall, J.; Gabarrell, X. Recirculating water and nutrients in urban agriculture: An opportunity towards environmental sustainability and water use efficiency? J. Clean Prod. 2020, 261, 121213. [Google Scholar] [CrossRef]
- Liu, Y.Q.; Song, W. Modelling crop yield, water consumption, and water use efficiency for sustainable agroecosystem management. J. Clean Prod. 2020, 253, 119940. [Google Scholar] [CrossRef]
- Onishi, A.; Sato, Y.; Watanabe, T.; Fukushima, Y.; Cao, X.; Imura, H.; Matsuoka, M.; Morisugi, M. Study on Sustainable Agricultural Production and Agricultural Water Use Efficiency in the Yellow River Basin of China; CRC Press Taylor & Francis Group: Kyoto, Japan, 2009; pp. 465–470. [Google Scholar]
- Ma, X.H.; Feng, Q.; Su, Y.H.; Yu, T.F.; Deo, R.C. Characteristics of ecosystem water use efficiency in a desert riparian forest. Environ. Earth Sci. 2018, 77, 358. [Google Scholar] [CrossRef]
- Emmerich, W.E. Ecosystem water use efficiency in a semiarid shrubland and grassland community. Rangel. Ecol. Manag. 2007, 60, 464–470. [Google Scholar] [CrossRef]
- Liu, Y.B.; Xiao, J.F.; Ju, W.M.; Zhou, Y.L.; Wang, S.Q.; Wu, X.C. Water use efficiency of China’s terrestrial ecosystems and responses to drought. Sci. Rep. 2015, 5, 13799. [Google Scholar] [CrossRef]
- Li, Y.; Shi, H.; Zhou, L.; Eamus, D.; Huete, A.; Li, L.; Cleverly, J.; Hu, Z.; Harahap, M.; Yu, Q.; et al. Disentangling Climate and LAI Effects on Seasonal Variability in Water Use Efficiency Across Terrestrial Ecosystems in China. J. Geophys Res. Biogeosci. 2018, 123, 2429–2443. [Google Scholar] [CrossRef]


| Sen (WUE × 10−2) | <−2 | −2~−1 | −1~−0.2 | −0.2~0.2 | 0.2~1 | 1~2 | >2 |
|---|---|---|---|---|---|---|---|
| Level | Significant inhibition | Moderate inhibition | Slight inhibition | Almost no effect | Slight promotion | Moderate promotion | Moderate promotion |
| Categories | Sen Standard | MK Test Standard | Hurst Exponent | GPP | ET | WUE |
|---|---|---|---|---|---|---|
| Sustainability and significant degradation | > 0 | |Z| > 1.96 | H > 0.5 | 3.75% | 7.79% | 5.28% |
| Sustainability and slight degradation | ≤ 0 | |Z| ≤ 1.96 | H > 0.5 | 34.29% | 22.41% | 38.54% |
| Sustainability and slight improvement | ≤ 0 | |Z| ≤ 1.96 | H > 0.5 | 42.77% | 49.92% | 40.00% |
| Sustainability and significant improvement | > 0 | |Z| > 1.96 | H > 0.5 | 13.79% | 18.10% | 11.15% |
| Undetermined future variation in trends | - | - | < H 0.5 | 5.40% | 1.78% | 5.03% |
Publisher’s Note: MDPI stays neutral with regard to jurisdictional claims in published maps and institutional affiliations. |
© 2021 by the authors. Licensee MDPI, Basel, Switzerland. This article is an open access article distributed under the terms and conditions of the Creative Commons Attribution (CC BY) license (https://creativecommons.org/licenses/by/4.0/).
Share and Cite
Zhang, Q.; Chen, W. Ecosystem Water Use Efficiency in the Three-North Region of China Based on Long-Term Satellite Data. Sustainability 2021, 13, 7977. https://doi.org/10.3390/su13147977
Zhang Q, Chen W. Ecosystem Water Use Efficiency in the Three-North Region of China Based on Long-Term Satellite Data. Sustainability. 2021; 13(14):7977. https://doi.org/10.3390/su13147977
Chicago/Turabian StyleZhang, Qi’ao, and Wei Chen. 2021. "Ecosystem Water Use Efficiency in the Three-North Region of China Based on Long-Term Satellite Data" Sustainability 13, no. 14: 7977. https://doi.org/10.3390/su13147977
APA StyleZhang, Q., & Chen, W. (2021). Ecosystem Water Use Efficiency in the Three-North Region of China Based on Long-Term Satellite Data. Sustainability, 13(14), 7977. https://doi.org/10.3390/su13147977