Abstract
Climate change has caused significant alterations in crop cultivation patterns and has affected crop suitability as well as its production. In this study, we investigated the changes in cultivation patterns and climate suitability of spring maize in Inner Mongolia from 1959 to 2018. We used the daily meteorological data from 50 weather stations and growth period data of spring maize from nine agrometeorological stations. In addition, the quantitative and interdecadal relationship between climate suitability of regions and climate-induced crop yield was analyzed using stepwise regression and cross wavelet transform. The results show that: (1) The planting boundaries of different spring maize maturity types extend to the north and east. In the middle part, early maturity maize has been replaced by medium maturity maize. The unsuitable planting areas in Northeast Inner Mongolia are decreasing, and the early maturity areas are increasing. (2) The climate suitability for spring maize planting areas is increasing. However, variations occur between different regions; the eastern region has the highest climate suitability (Sz = 0.67), but the overall trend is decreasing in this region. Whereas the central region has moderate suitability (Sz = 0.62), with a significantly increasing trend (p < 0.05). The western region is lower (Sz = 0.60) and the trend is not significant. (3) Climate suitability and climate-induced yields are generally positively correlated. The primary factors affecting climate-induced yields are sunshine hours, followed by climate suitability, rainfall, and temperature. The cross-wavelet transform shows that climate suitability and climate-induced yield have greater periodicity in the late growth period. Appropriate expansion of the planting range of medium-late maturity spring maize can fully adapt to the impact of climate warming. Therefore, it is necessary to study suitability trends of regions to adopt comprehensive maize production measures.
1. Introduction
Agriculture is one of the sectors that is most vulnerable to climate change [1,2,3,4]. In developing countries, the demand for food will increase in the next few decades due to population pressure [5], negatively affecting food security and the ecological environment [6,7]. Further, the frequent occurrence of extreme meteorological disasters, such as high temperatures, droughts, and floods caused by climate change, has seriously affected agricultural production and economic development [8,9,10]. Therefore, understanding the impact of climate change on agricultural production is important to ensure sustainable agricultural development and food security [11,12].
Climate is one of the main factors affecting crop production [13]. As the climate changes, suitable areas for specific crops may change [14]. A recent report predicted a northward shift for thermophilic crops such as maize and grapevine in Europe due to changing climate [15]. The impact of climate change may be more significant in China as it is a large agricultural country. The temperature of Inner Mongolia is rising at a rate of 0.3 °C per decade−1 under the influence of greenhouse gases [16]. This has impacted the utilization of agro-climatic resources, crop growth, and restrictions on planting conditions in the north [17,18,19]. Spring maize is the main food crop in Inner Mongolia and is significantly affected by climate change. Studies have shown that the planting area of spring maize in Inner Mongolia is expanding northward and its growth period is increasing [20]. These findings greatly help elucidate the effects of climate change. However, few studies have quantitatively evaluated the impact of past climate change on spring maize cultivation patterns in this region. Crop growth is the result of the combined effects of radiation, temperature, and rainfall [21]. The accumulation of biomass is achieved by temperature and light by participating in the physiological processes of crops (photosynthesis and respiration) [13]. A moderate temperature is conducive to the growth of crops, whereas low temperatures easily cause freezing injury, and high temperatures reduce the survival rate of pollen, resulting in crop yield reduction [22]. The availability of rainfall and soil moisture affects the water absorption of crop roots, which in turn affects leaf photosynthetic efficiency. Therefore, it is necessary to comprehensively evaluate the climate suitability of elements such as temperature, light, and rainfall. At present, at the station scale, climate suitability not only has a good correlation with meteorological yield, but can also be used to predict future yields [23,24]. However, the impact of climate on yield is not concentrated on the site scale. Furthermore, natural disasters, such as droughts and floods, can also affect crop production on a regional scale as well as temporal scales. Therefore, the relationship between climate suitability changes and yields on a regional scale is not yet known.
Crop models and statistical models are the main methods used to analyze the impact of climate change on yield. Crop models have been developed based on many years of experiments and use interdisciplinary integration of biology, agronomy, and soil science [25]. These models have unique advantages in describing crop growth and development dynamics on site scale. However, they require a large amount of field data, such as crop varieties, soil, and crop management data. The calibration of the model is very difficult, and the meteorological data is required strictly, usually in the step of day or hour [26]. Simulation with limited site data makes it difficult to support changes in the overall spatial area [27]. In contrast, statistical models have less dependence on meteorological elements and wide time scale, and the relationship between climate change and crop yield can be established only based on historical yield and basic climatic data [28]. Therefore, statistical models are more commonly used than crop models. The temporal variations of meteorological elements and yields are not smooth, and wavelet analysis can detect the intermittent characteristics of climate change and yield in time series. Such analysis will help enhance our understanding of the relationship between climate change and yield and enhance yield predictability. Thus far, wavelet analysis has been widely used to analyze the time series change characteristics of climate and hydrological information [29,30], and Tian et al. (2015) [31] assessed the impact of climate variability on yield. Rezaei et al. (2020) [32] applied wavelet analysis to the teleconnection of the ecological environment and large-scale climate models and concluded that the temperature of the Urmia Lake watershed depends on the Atlantic multidecadal oscillation. However, the current wavelet analysis methods used in climate suitability and yield research remain very limited.
To the best of our knowledge, the present study represents the first application of wavelet analysis to climate suitability and yield assessment. The main objectives of this study of Inner Mongolia were: (1) to explore the spatiotemporal changes in the cultivation patterns of spring maize varieties of different maturity (late, medium-late, medium, medium-early and early) from 1959 to 2018; (2) to evaluate the climate suitability changes in the spring maize planting areas based on the variety layout; and (3) to analyze the relationship between climate suitability and climate-induced yield based on the cross-wavelet transform (XWT).
2. Materials and Methods
2.1. Study Area
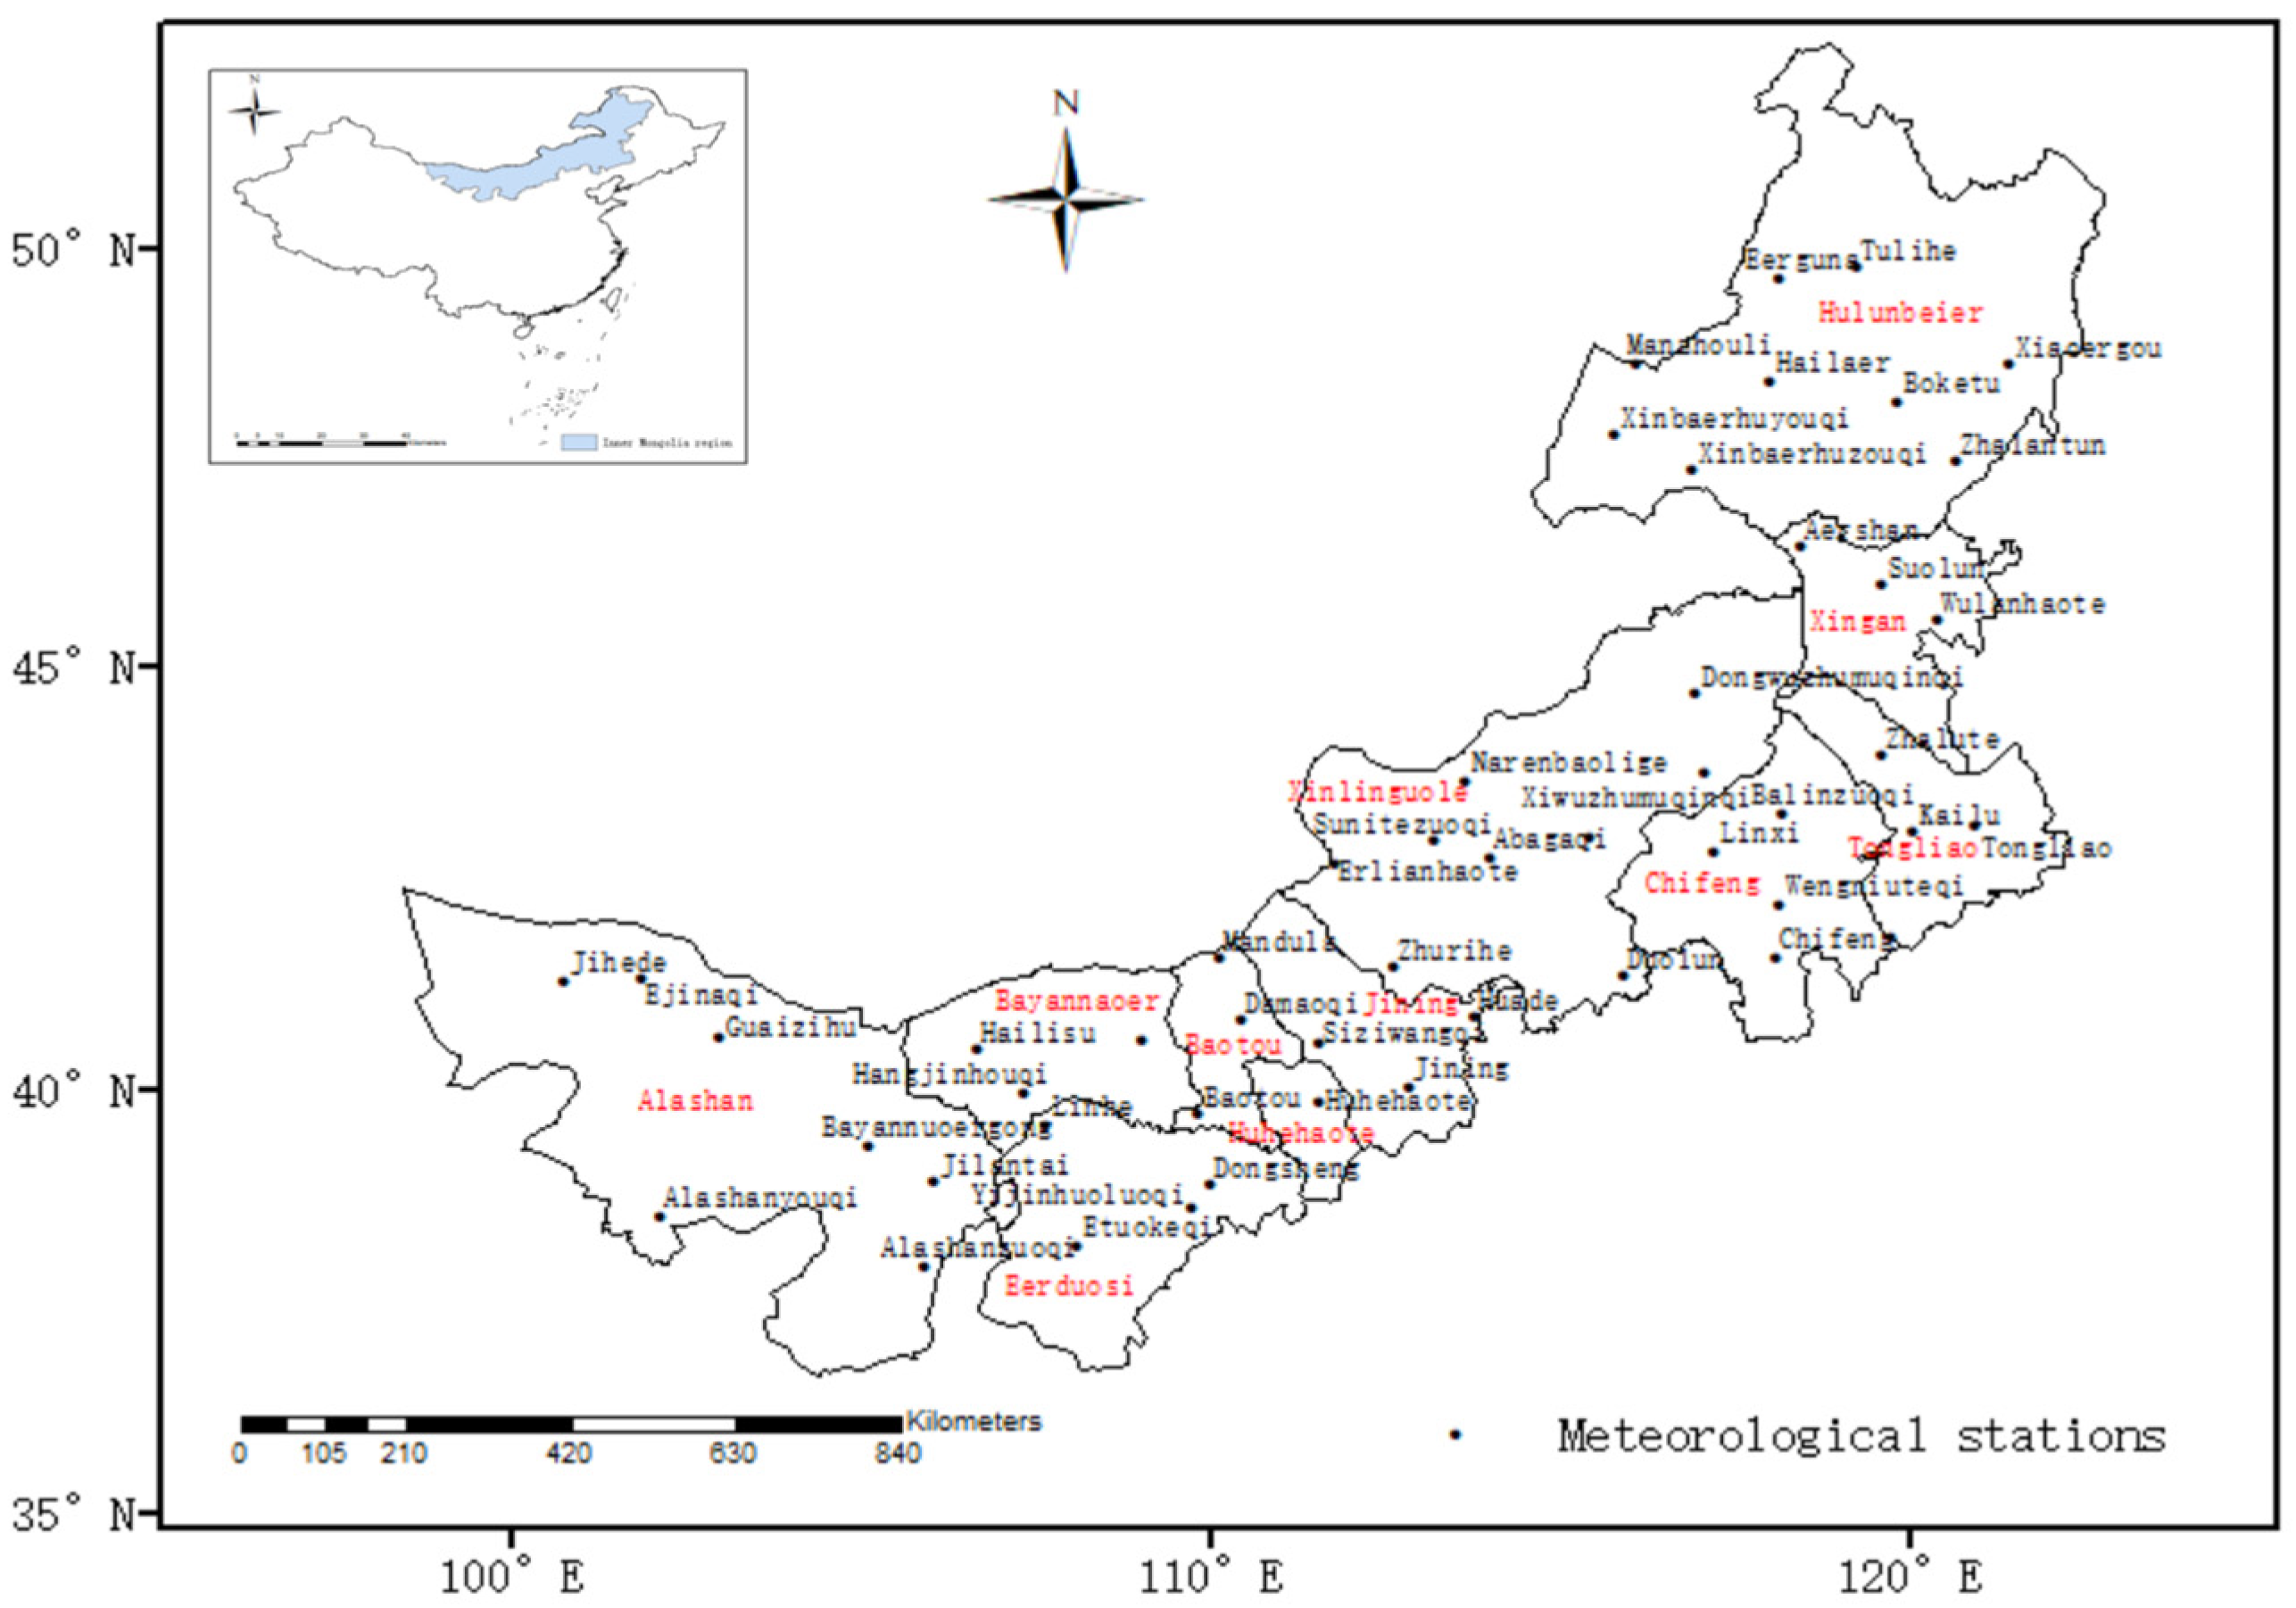
Inner Mongolia (37°24′–53°23′ N, 97°12′–126°04′ E) is a long and narrow province located at middle to high latitudes on the northern border of China (Figure 1). The terrain mostly belongs to the plateau region and stretches from the northeast to southwest. It has an area of 1.183 × 10⁶ km2, accounting for approximately 12.3% of the total area of China [33]. The topographic conditions create unique natural conditions and natural resources [34]. Controlled by the high pressures in Mongolia, this region has a typical temperate continental monsoon climate with four distinct seasons: a dry windy spring, short hot summer, a sharp decrease in temperature in the autumn and early frost, and cold and long winters [16].

Figure 1.
Study area and distribution of meteorological stations.
Many types of crops are planted in Inner Mongolia, mainly spring maize, spring wheat, potatoes, and soybeans. In recent years, maize has become the most widely planted crop in this region. In 2018, the total sown area of grain crops in Inner Mongolia was 6.79 million hectares, and the sown area of maize was 3.742 million hectares, accounting for approximately 55% of the grain crop area; the average yield of maize is 7215 kg/hm2.
2.2. Data
2.2.1. Meteorological Data
The meteorological data and agricultural observation data were obtained from the China Meteorological Administration (CMA). This database incorporates information from 50 meteorological stations and 9 agrometeorological observation stations. The main meteorological elements that were studied included the daily average temperature, maximum temperature, minimum temperature, sunshine hours, wind speed, elevation, latitude, and longitude from 1959 to 2018. The meteorological data undergo strict quality control before they are released, including error data correction, data supplementation, and numerical value averaging. The agricultural observation data included crop growth period dates, plant heights, and growth conditions from 1991 to 2008.
2.2.2. Crop Information
Based on data obtained from the agrometeorological observation stations and current research results [35], this study divides the growth period of spring maize into five stages: (1) from sowing to emergence, (2) from emergence to jointing, (3) from jointing to flowering, (4) from flowering to milk maturity, and (5) from milk maturity to maturity. The maize yield data (1983–2016) of the 12 regions of Inner Mongolia were mainly derived from “The fifty years of agrostock breeding economy in Inner Mongolia” and “Inner Mongolia Statistical Yearbook”, and the scope of maize planting was mainly derived from the statistics in “The survey yearbook of economic society in Inner Mongolia”. Xilinguole, Wuhai, and Alashan regions had relatively small planting areas and Wulanchabu, Xinganmeng, and Tongliao had considerable discontinuities in the output data. Therefore, we selected the other six regions (Bayannaoer, Eerduosi, Baotou, Huhehaote, Chifeng, and Hulunbeier) to analyze the relationship between climate suitability and yield.
2.3. Research Methods
2.3.1. Classification of Different Spring Maize Varieties in Inner Mongolia
Crops must meet certain heat conditions to complete their normal growth and development [28]. Maize is a thermophilic crop, and different maize varieties have different heat requirements owing to their distinct growth periods. The first and last days with temperatures ≥10 °C are generally regarded as the beginning and end of thermophilic crop growth. Therefore, an accumulated temperature ≥10 °C is required for maize growth [36]. In Inner Mongolia, scholars have conducted extensive research on the heat requirement of maize growth, albeit on a small scale [17,18,19]. In the present study, existing research data on the heat required by different maize varieties was combined with the planting range, and the spring maize planting area was roughly classified into six groups: early maturity, medium-early maturity, medium maturity, medium-late maturity, late maturity, and unsuitable planting cultivation areas (Table 1). The 5-day moving average method was used to calculate the first and last days and accumulated temperatures of the days with average temperatures ≥ 10 °C in each year. Specifically, the first (last) 5 days in the 5-day moving average temperature series that no longer appeared lower (higher) than 10 °C after (before) were selected. In the 5-day moving average temperature series, the first date ≥10 °C was selected as the start date (end date) of stably passing 10 °C, and the sum of the average temperatures between the start and end dates was the accumulated temperature of the period stably passing 10 °C.

Table 1.
Indicators for spring maize cultivation in Inner Mongolia.
2.3.2. Identifying the Meterological Trends
The Trends of Meteorological Elements were described using climate trends and were expressed using linear equations of the form [37].
where X is the fitting value of the relevant meteorological elements, b is the slope of change in climate, t is the year corresponding to X, and a is the intercept. For instance, b∙10 is the climate trend that represents the change rate of a meteorological element every 10 years.
The coefficient of variation (Cv) was used to describe the temporal variability of each meteorological element. The variation level was classified as weak, medium, or strong according to Cv ≤ 0.1, 0.1 < Cv < 1.0, and Cv ≥ 1.0, respectively.
2.3.3. Climate Suitability for Spring Maize Cultivation
Temperature, sunshine hours, and rainfall are important factors that restrict maize growth [25]. In this study, temperature [38], sunshine [39], and water suitability index [40] were assessed at different growth stages of spring maize. The comprehensive suitability index is the average of the three, which quantitatively reflects the climate suitability of spring maize planting in Inner Mongolia from 1959 to 2018. It can be calculated using Formula (2):
where SZ is the comprehensive suitability index, ST is the temperature suitability index, SW is the moisture suitability index, SH is the sunshine suitability index, and n is the growth period of spring maize. SZ is a dimensionless function with a value between 0 and 1. The higher the value, the higher the suitability of the climate resources.
- (i).
- Temperature suitability index
The temperature suitability index considers the upper limit temperature, lower limit temperature, and optimum temperature suitable for crop growth. Daily average temperatures higher than the upper limit or lower than the lower limit will inhibit the crop growth, whereas a temperature near the optimum temperature is beneficial to crop growth. The temperature suitability index is defined as follows:
where T is the daily average temperature during the maize growth period (°C), T1 is the minimum temperature threshold (°C), T0 is the optimum temperature (°C), and T2 is the maximum temperature threshold (°C). The range of ST was between 0 and 1. A value of 0 indicates unfavorable weather conditions, whereas a value of 1 indicates ideal weather conditions. Table 2 summarizes the three base temperatures of spring maize in Inner Mongolia [41].
Table 2.
Maximum temperature (T2), minimum temperature (T1) thresholds, and optimum temperature (T0) of spring maize during different growth stages of spring maize in Inner Mongolia.
- (ii).
- Water suitability index
The water suitability index indicates the degree to which rainfall meets the water supply requirements of the crops. Here, we only consider the degree of satisfaction of the crop water requirements by rainfall as insufficient or sufficient rainfall. Which is defined as follows:
where SW is the water suitability index, P is the cumulative rainfall during the growth stage of maize, and ETc is the crop water requirement, which is
where ET0 is the reference crop water requirement (mm), and Kc is the crop coefficient. The Penman-Monteith [42] method is recommended by Food and Agriculture Organization to calculate reference crop evapotranspiration (ET0):
where ET0 is the reference evapotranspiration (mm day−1), T is the air temperature at 2 m height (°C), Δ is the slope of the vapor pressure curve (KPa °C), Rn is the net radiation at the crop surface (MJ m−2 day−1), G is the soil heat flux density (MJ m−1 day−1), γ is the psychrometric constant (KPa °C−1), es is the saturation vapor pressure (KPa), ed is the actual vapor pressure (kPa), and U2 is the wind speed at 2 m height (m s−1).
- (iii).
- Sunshine hours suitability index.
The sunshine hours suitability SH is given by
Taking 70% sunshine as the critical point, when the percentage of sunshine is greater than 70%, SH is 1, whereas when it is less than 70%, SH is less than 1 and is given by H, the actual number of hours of sunshine (h), divided by H0, the number of hours for which the amount of sunshine is 70% (h).
2.3.4. Crop Yield Separation
Usually, crop yield is composed of the trend yield (Yt), climate-induced yield (Yc), and random error (Yr) [23,43]. The trend yield is mainly affected by the social production conditions and scientific development technology. Climate-induced yield is usually affected by climate change and is also called fluctuating production. The specific calculation is as follows:
In this study, the 5-year moving average method was used to separate the trend yield and climate-induced yield, in which the random error can be ignored. Because the 5-year moving average method causes data loss at the front and back ends of the data series, the climate-induced yield from 1985 to 2014 was finally obtained.
2.3.5. Wavelet Analysis
A wavelet is a function that has zero time and frequency, and the wavelet function can be expressed by localizing these quantities [44]. The key to localizing time and frequency lies in the construction of wavelet mother functions and related parameters. Ordinary wavelet transform mainly includes discrete wavelet transform (DWT) and continuous wavelet transform (CWT) [23]. Compared with DWT, CWT have the advantages of high displacement sensitivity, obvious phase relation, and good directivity [45]. In addition, a CWT can also reflect the main oscillation period of a time series [46]. Therefore, CWT was used in the present study. For wavelet mother functions, the orthogonal function is mainly used in DWT, and the non-orthogonal wavelet function is suitable for DWT or CWT [47]. The Morlet wavelet is a type of non-orthogonal function, developed on the basis of the window Fourier transform [48,49]; because the Morlet wavelet has an imaginary part, it can well reflect the phase relationship, hence the Morlet wavelet was selected as the generating function of the continuous wavelet change in this study. The formula is as follows:
where η is the dimensionless time factor, and ω0 is the dimensionless frequency.
CWT can decompose time series from the time domain to the time–frequency domain. For the time series xn (n = 1, 2, …, N), the CWT is defined as the convolution Wn(s) of xn after scaling:
where n is the local time index, s is the scale, n is the time conversion index, δt is the sampling period, N is the number of points in the time series, φ(t) is the mother wavelet function, and (*) denotes complex conjugation.
Because the mother wave cannot be completely localized in time, the cone of influence is introduced to represent the error region in the CWT process [28,50]. For time series xn, the wavelet power spectrum is defined as |Wn(s)|2. Generally, red noise can be used as the background spectrum to evaluate the statistical significance (95%) of the wavelet power spectrum.
In addition, the cross-wavelet based on continuous wavelet transform (XWT) was selected to analyze the resonance period and phase relationship of the two time series. For two time series xn and yn (1, 2, 3, …, N), their XWT is defined as Wxy = WxWy*, and their cross wavelet power is defined as |WXY|. The background power spectra of time series xn and yn are and ; the significance test formula with p as the probability is as follows:
where Zv(p) is the confidence level associated with probability p for a probability distribution function defined by the square root of the two χ2 distributions.
Finally, the Kriging method and inverse distance weighted interpolation method were used to interpolate the results of spring maize cultivation mode and climate suitability, and the cross-wavelet power spectrum was drawn using MATLAB (R2016a).
3. Results
3.1. Changes in Meteorological Elements
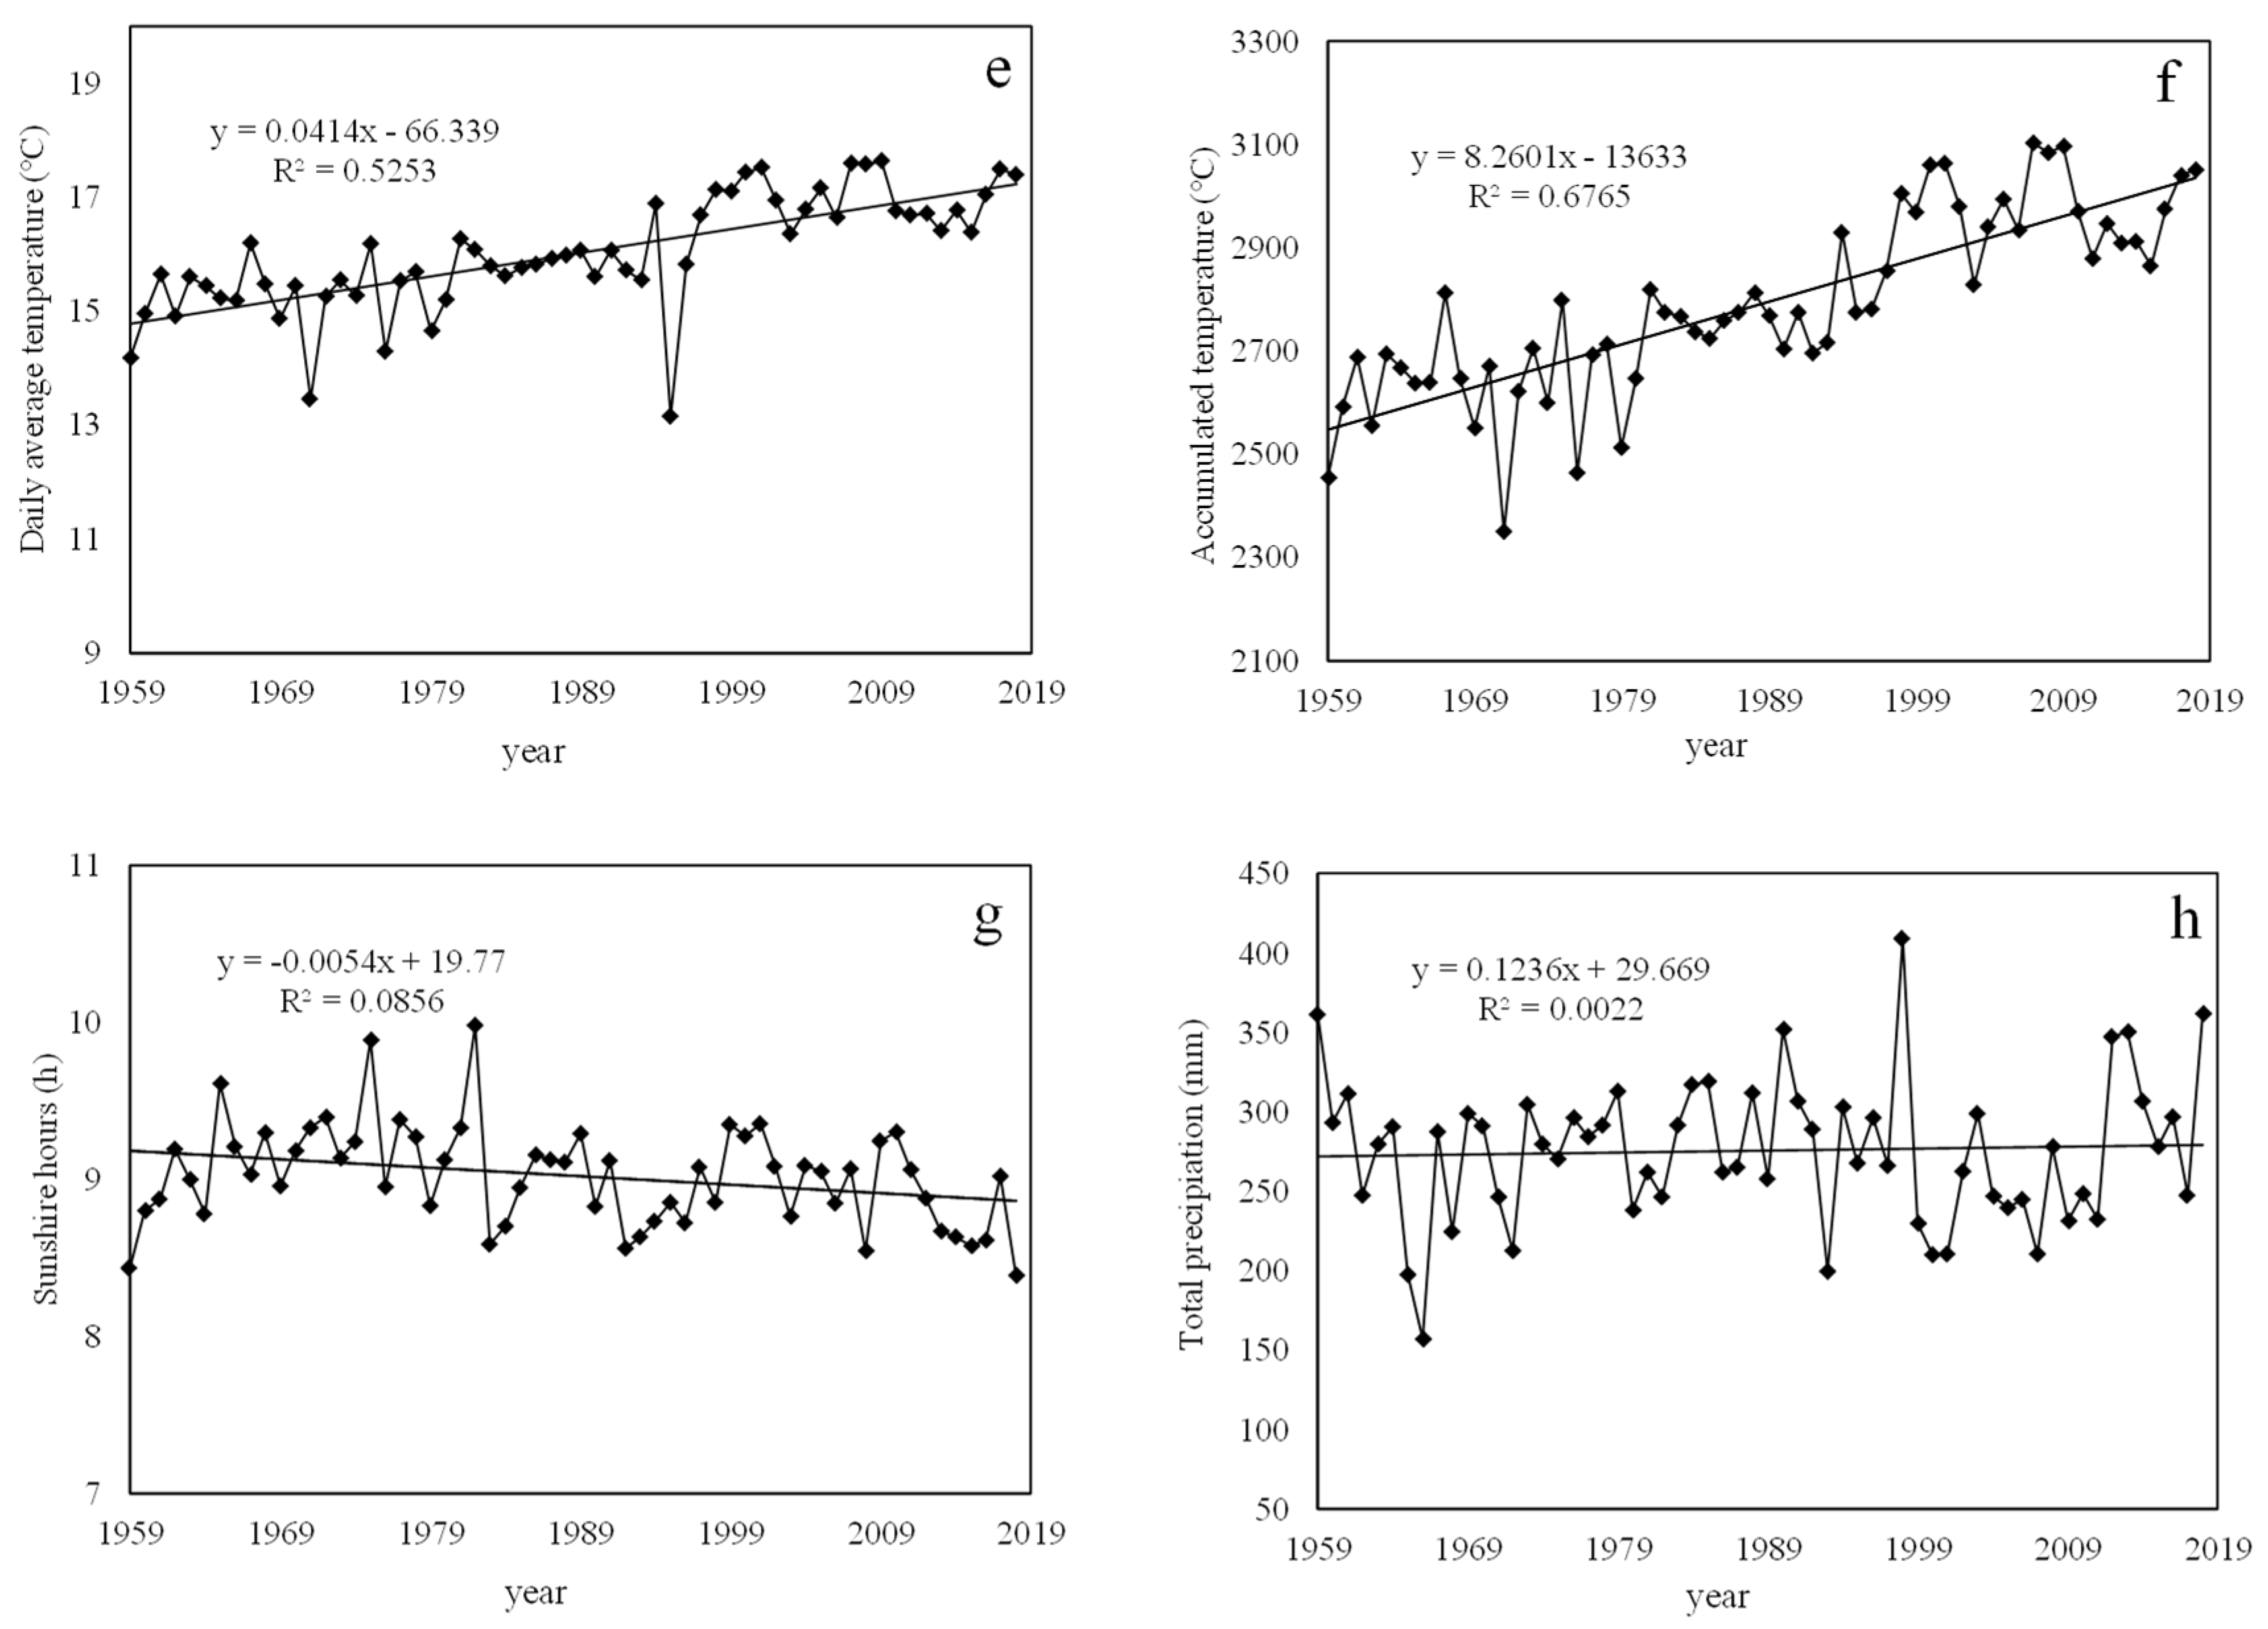
The average temperature during the spring maize growing period (April–September) was 9.9–21.7 °C between 1959 and 2018, and the high-value areas were mainly distributed in the west and southeast (Figure 2a). The average temperature was 16.2 °C, and the overall upward trend was 0.4 °C per decade−1 (Figure 2e). The spatial distribution of the accumulated temperature was similar to that of the average temperature, and the accumulated temperature range was 1549.6–3978.7 °C (Figure 2b). The average accumulated temperature from 1959 to 2018 was 2844.8 °C, which rose at a rate of 82 °C decade−1 (Figure 2f). The number of sunshine hours ranged from 6.3 h to 10.9 h (Figure 2c), showing a decreasing trend from west to east. From 1959 to 2018, the average number of sunshine hours was 9.02 h, and this number decreased at a rate of 0.054 h decade−1 (Figure 2g). The rainfall during the spring maize growth period ranged from 20.1 mm to 452.8 mm, showing an increasing trend from west to east. The high-value areas were mainly distributed in Xiaoergou and Zhalantun, and the low-value areas were mainly distributed in Jikede and Ejinanaqi (Figure 2d). The average amount of rainfall from 1959 to 2018 was 275.51 mm, with an overall upward trend of 1.2 mm decade−1 (Figure 2h).
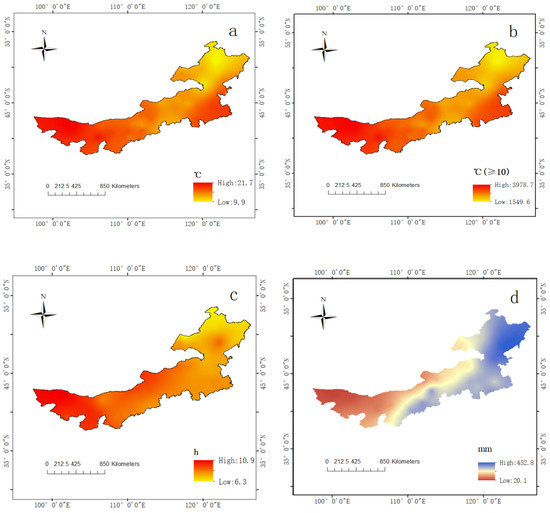
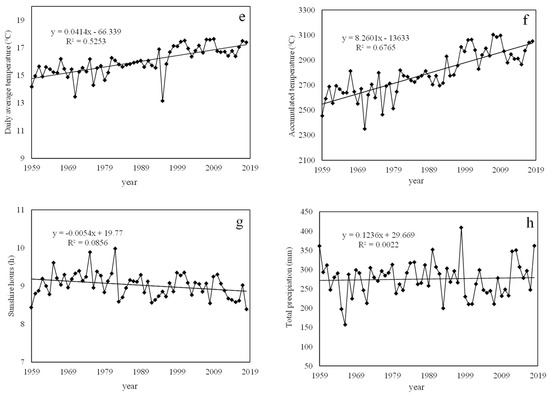
Figure 2.
Analysis of climate resources in the spring maize growing season in Inner Mongolia from 1959 to 2018. (a): Spatial distribution of daily average temperature, (b): Spatial distribution of accumulated temperature (≥10 °C), (c): Spatial distribution of sunshine hours, (d): Spatial distribution of total rainfall, (e): Temporal change in daily average temperature, (f): Temporal change in accumulated temperature (≥10 °C), (g): Temporal change in sunshine hours, (h): Temporal change in total rainfall.
3.2. Temporal and Spatial Changes of Spring Maize Cultivation Patterns in Inner Mongolia
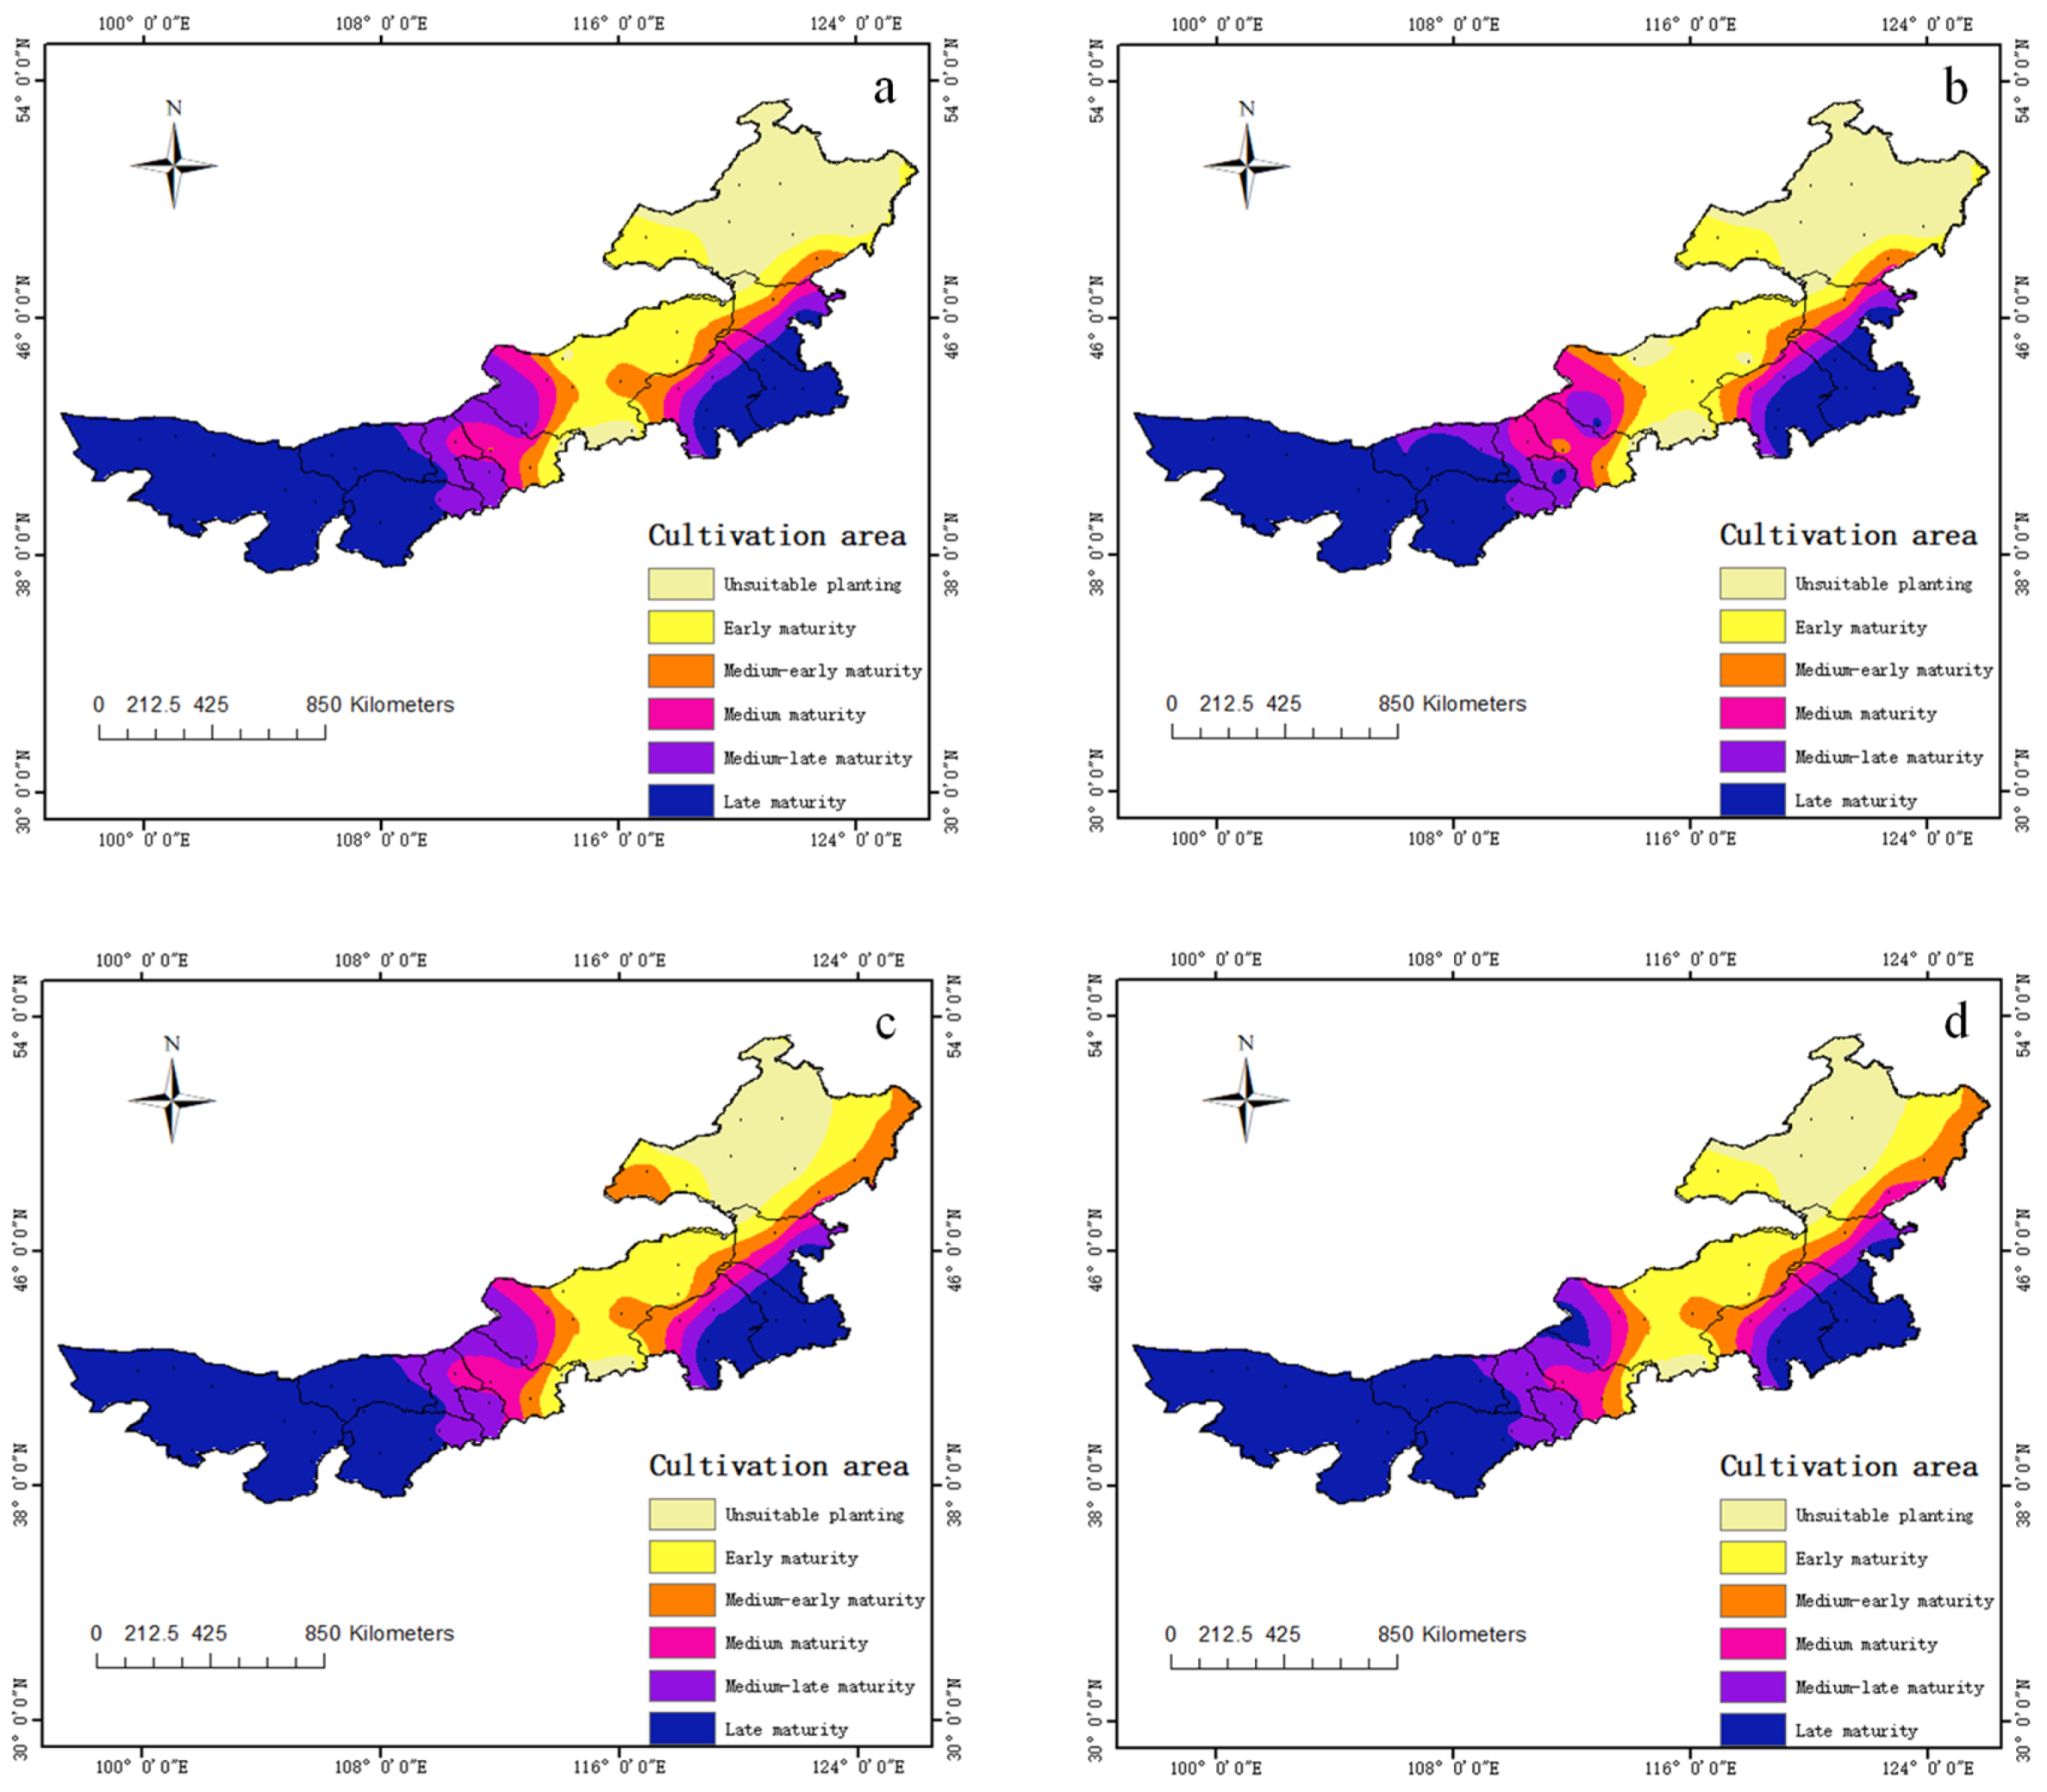
During 1959–2018, significant changes took place in the cultivation patterns of spring maize in Inner Mongolia (Figure 3). The unsuitable planting areas gradually decreased, early maturity planting areas were gradually replaced by medium maturity and medium-late maturity maize areas, and the late maturity varieties accounted for the largest proportion. The planting boundaries of different maize maturity types moved northward and gradually expanded to the northeast, and the most obvious change appeared after 1999.
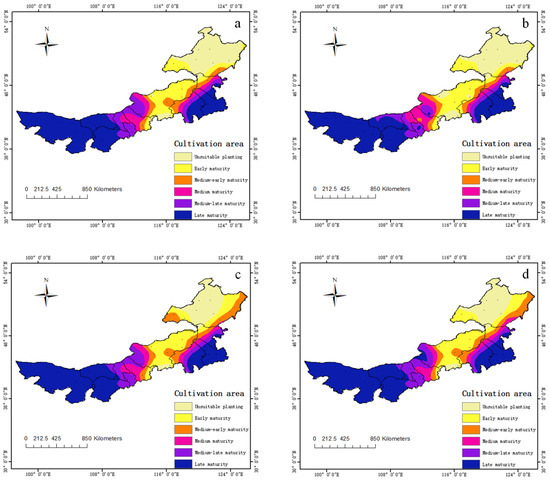
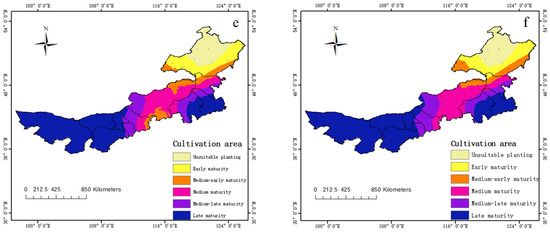
Figure 3.
Changes in the cultivation patterns of spring maize varieties of different maturities (late, medium-late, medium, medium-early, and early) from 1961 to 2010 in Inner Mongolia. (a): 1959–1968, (b): 1969–1978, (c): 1979–1988, (d): 1989–1998, (e): 1999–2008, (f): 2009–2018.
From 1959 to 1978, early maturity spring maize was mainly concentrated in the central and eastern regions. The boundary of northeast Inner Mongolia was mainly near Xinbaerhuyouqi, Xinbaerhuzuoqi, and Zhalantun in Hulunbeier. During the period from 1979 to 1998, the western border moved slightly, and the northeast planting border moved gradually from Zhalantun to Boketu. From 1999 to 2018, the planting area of early maturity maize decreased significantly. The planting boundary extends further to the northeast, and the central and western regions changed from early maturity planting areas to medium maturity and medium-early maturity planting areas.
From 1959 to 1978, the medium-early maturity maize varieties were mainly distributed in the western and eastern regions of the early maturity maize varieties and were distributed in strips. From 1960 to 1970, the eastern boundary gradually extended to the northeastern region near Xiaoergou. Between 1999 and 2008, part of the early maturity area was transformed into a medium-early maturity area. From 2009 to 2018, the boundary between the western and eastern regions of the medium-early maturity zone gradually shifted to the northeastern region.
From 1959 to 1978, the medium maturity maize planting area was adjacent to the medium-early maturity area. From 1979 to 1998, the boundary of the medium maturity maize planting area changed relatively little. In contrast, it changed significantly from 1999 to 2008; specifically, the medium maturity area in the west expanded eastward and began to occupy the early maturity area, and the border of the southeast area gradually moved northward. From 2009 to 2018, the medium maturity maize area in the central region occupied the early maturity area.
From 1959 to 1987, the medium-late maturity maize planting areas were mainly distributed between the late and medium maturity types. The western region is mainly distributed in Dongsheng, Erlianhaote, and other places. The eastern part is mainly located in the area of Balinzuoqi. From 1989 to 1998, the change range of the eastern part of the medium-late maturing planting area was small, while the range of the western part decreased during the process of change. From 1999 to 2018, the western boundary line moved to the east and extended to Damaoqi and Jining. Late maturity maize planting areas are mainly distributed in the western and southeastern regions of Inner Mongolia. From 1959 to 1978, the eastern region was distributed across the entire area of Alashan, Eerduosi, and most of Bayannaoer. The western region is mainly distributed in Chifeng, Tongliao, and southeast of Xinganmeng. From 1979 to 1998, the range of changes in the southeast region of late-maturity maize was relatively small. From 1999 to 2018, the boundary line of the western region moved to Baotou, Hohhot, and the northwest of Jining.
3.3. Changes in Climate Suitability of Spring Mazie Planting Areas in Inner Mongolia from 1959 to 2018
3.3.1. Temporal Changes in Climate Suitability
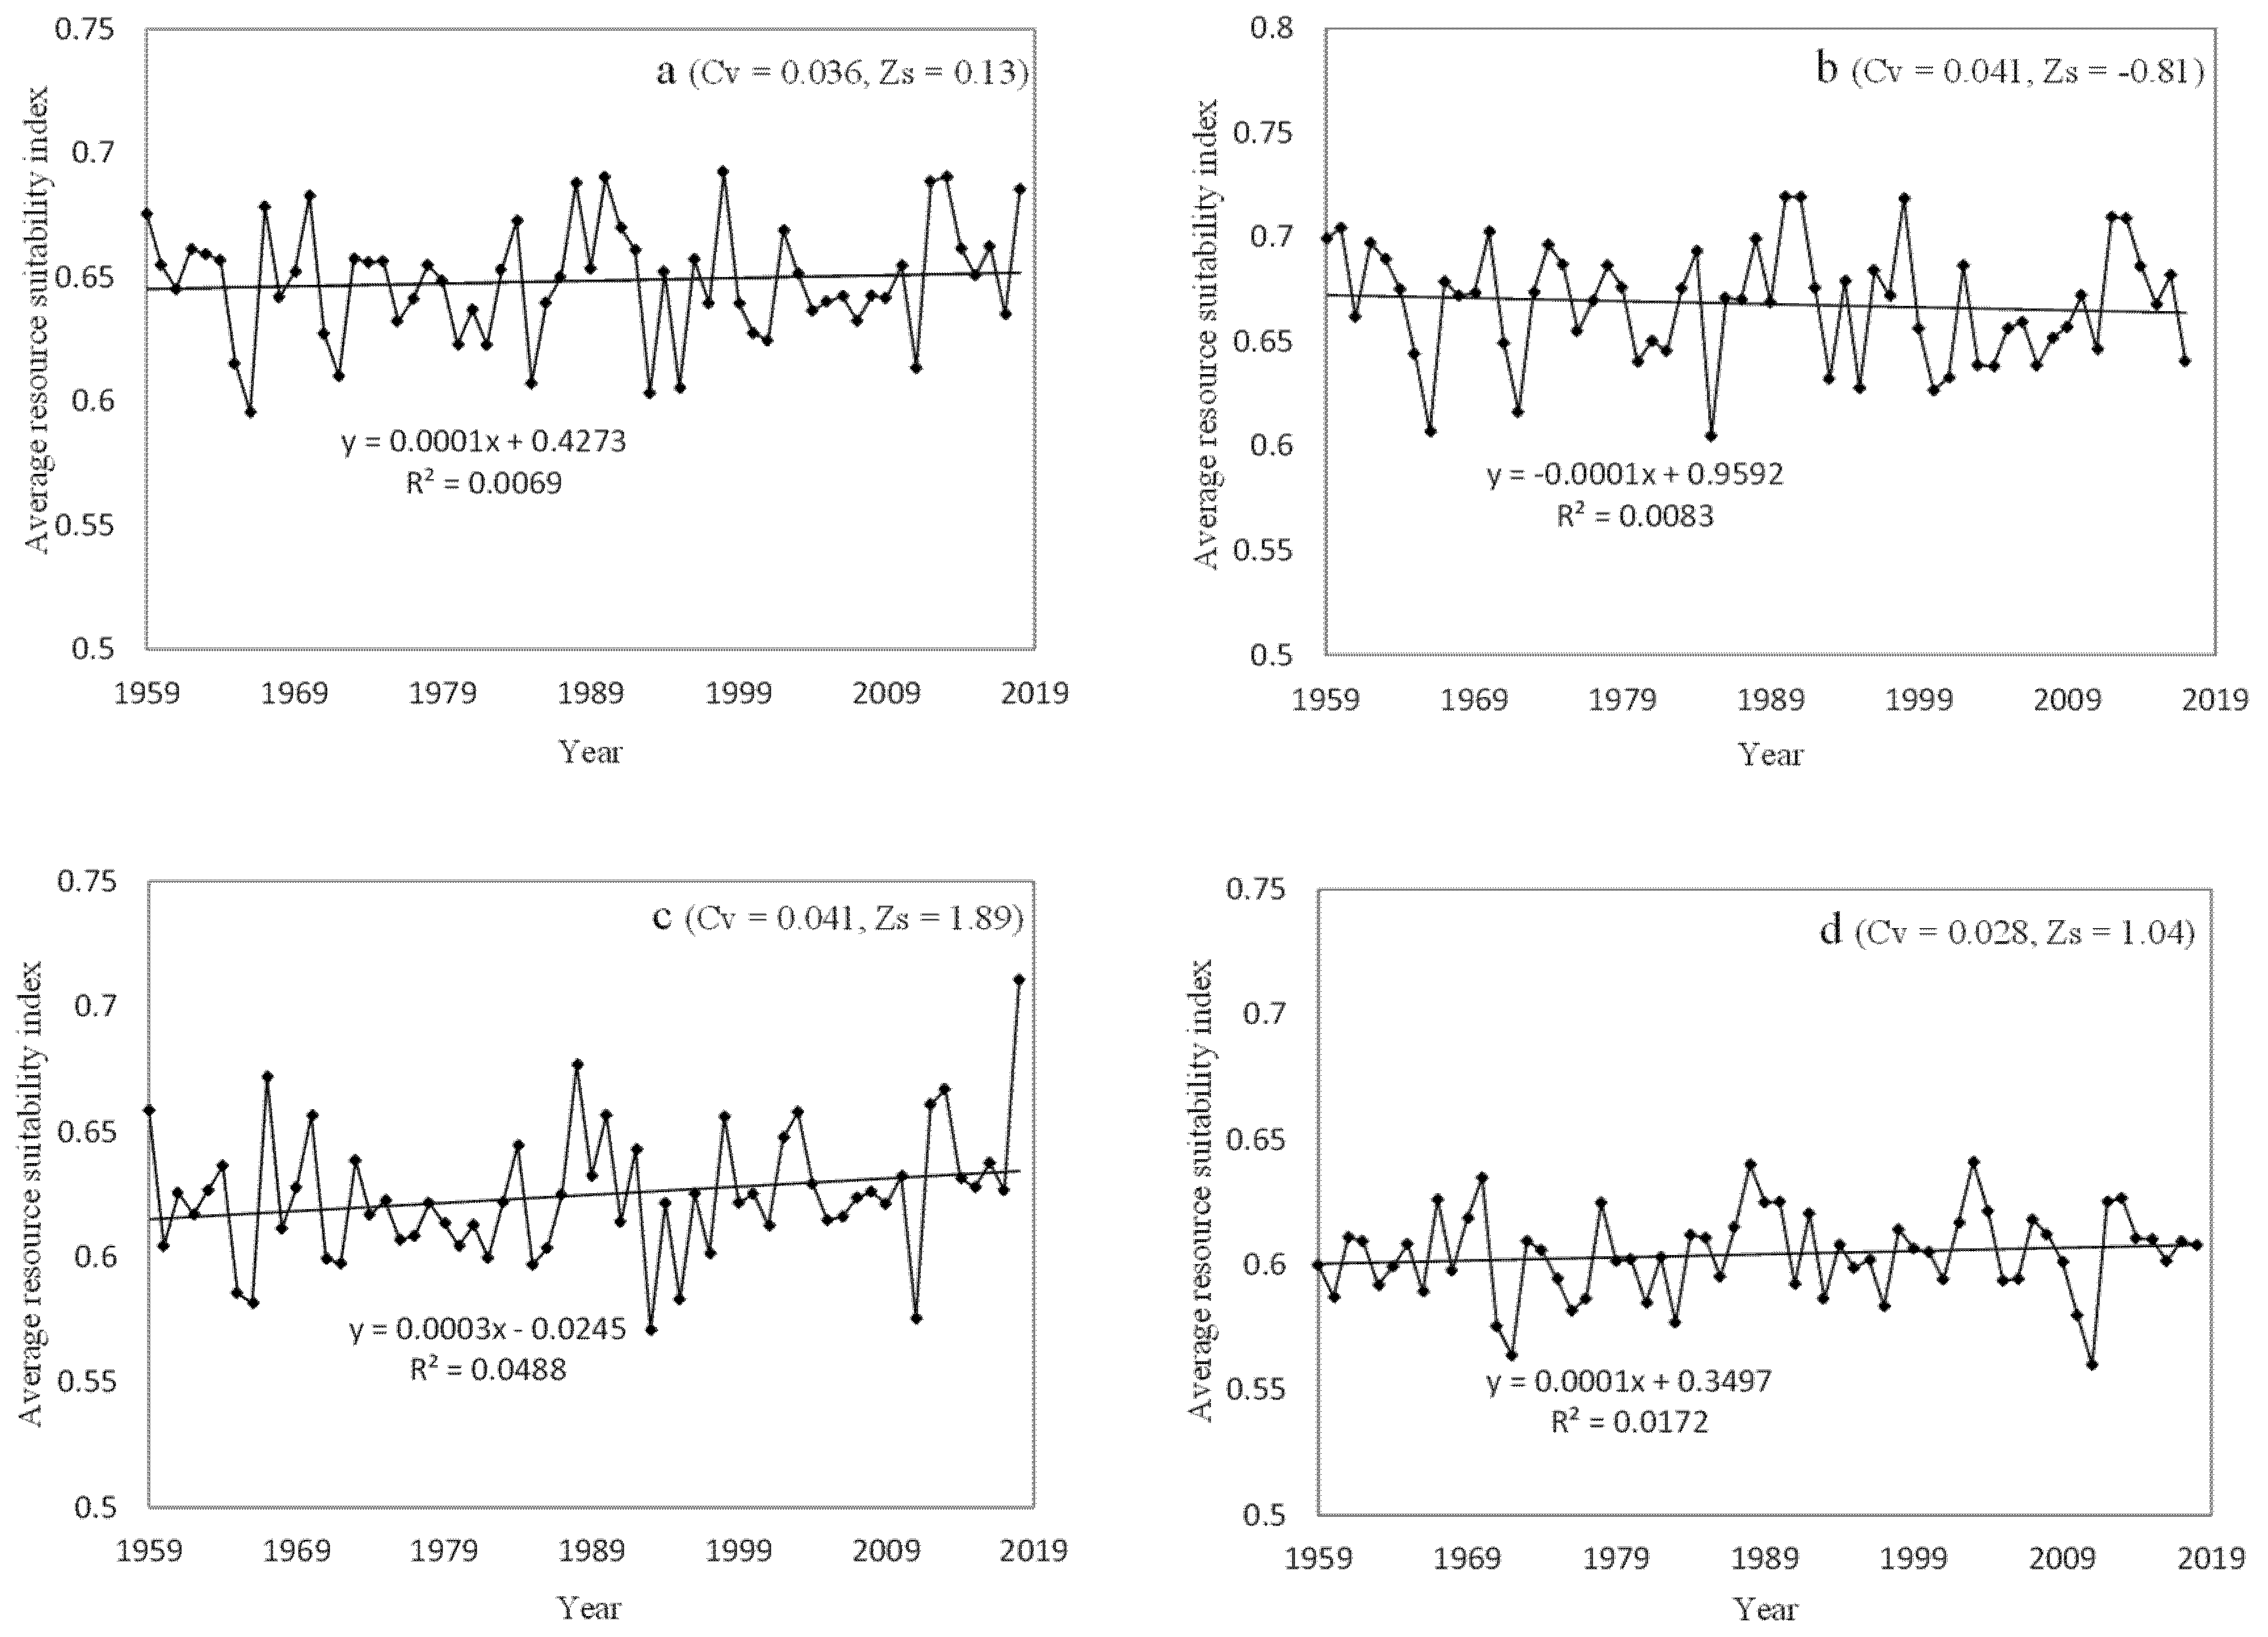
From 1959 to 2018, the climate suitability of Inner Mongolia showed an overall but insignificant upward trend; the climate suitability was between 0.59 and 0.69, and the average suitability was 0.65 (Figure 4a). Among the regions, the eastern part of Inner Mongolia had the highest suitability for spring maize, with an average suitability of 0.67 and a range of 0.60–0.72, showing an overall but insignificant downward trend (Figure 4b). The climate suitability of the central region was moderate, with an overall and significant upward trend (p < 0.05), and ranged from 0.60 to 0.66, with an average value of 0.62 (Figure 4c). The western region had the lowest climate suitability, with an average value of 0.6, and a range between 0.56 and 0.67, showing an overall but insignificant upward trend (Figure 4d). The rainfall in Inner Mongolia was mainly concentrated in the central and eastern regions (Figure 2d). The change in the occurrence of maize varieities with rising temperature was most remarkable in the central region, leading to a significant increase in climate suitability of this region. The eastern part of Inner Mongolia has had the highest climatic suitability due to abundant sunlight, temperature, and rainfall. However, as the temperature rises, and some unsuitable maize planting areas in at high latitudes are transformed into early maturity, a downward trend was observed in the overall suitability in the eastern area. Meanwhile, the climatic suitability of spring maize was low in the western region due to low latitude, high solar radiation, and temperature in the western region, where rainfall was the main limiting factor. The climate suitability changes in all regions of Inner Mongolia showed weak variability (CV < 0.042). In general, as the temperature rises, the synergistic effect of light, heat, and water in the spring maize planting areas will increase, and all regions of Inner Mongolia will become more conducive for the growth and development of spring maize.
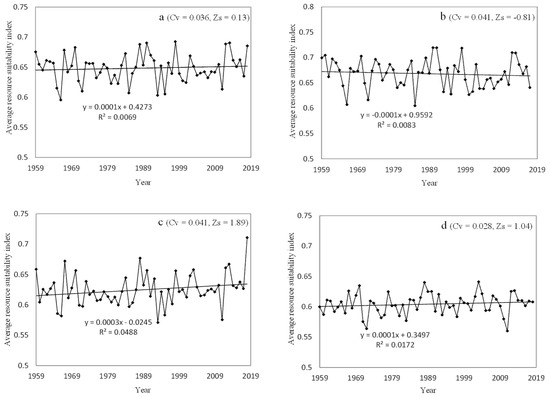
Figure 4.
Temporal changes in climate suitability of spring maize in Inner Mongolia from 1959 to 2018. (a): All regions of Inner Mongolia, (b): Eastern region, (c): Central region, (d): Western region.
3.3.2. Spatial Changes in Climate Suitability
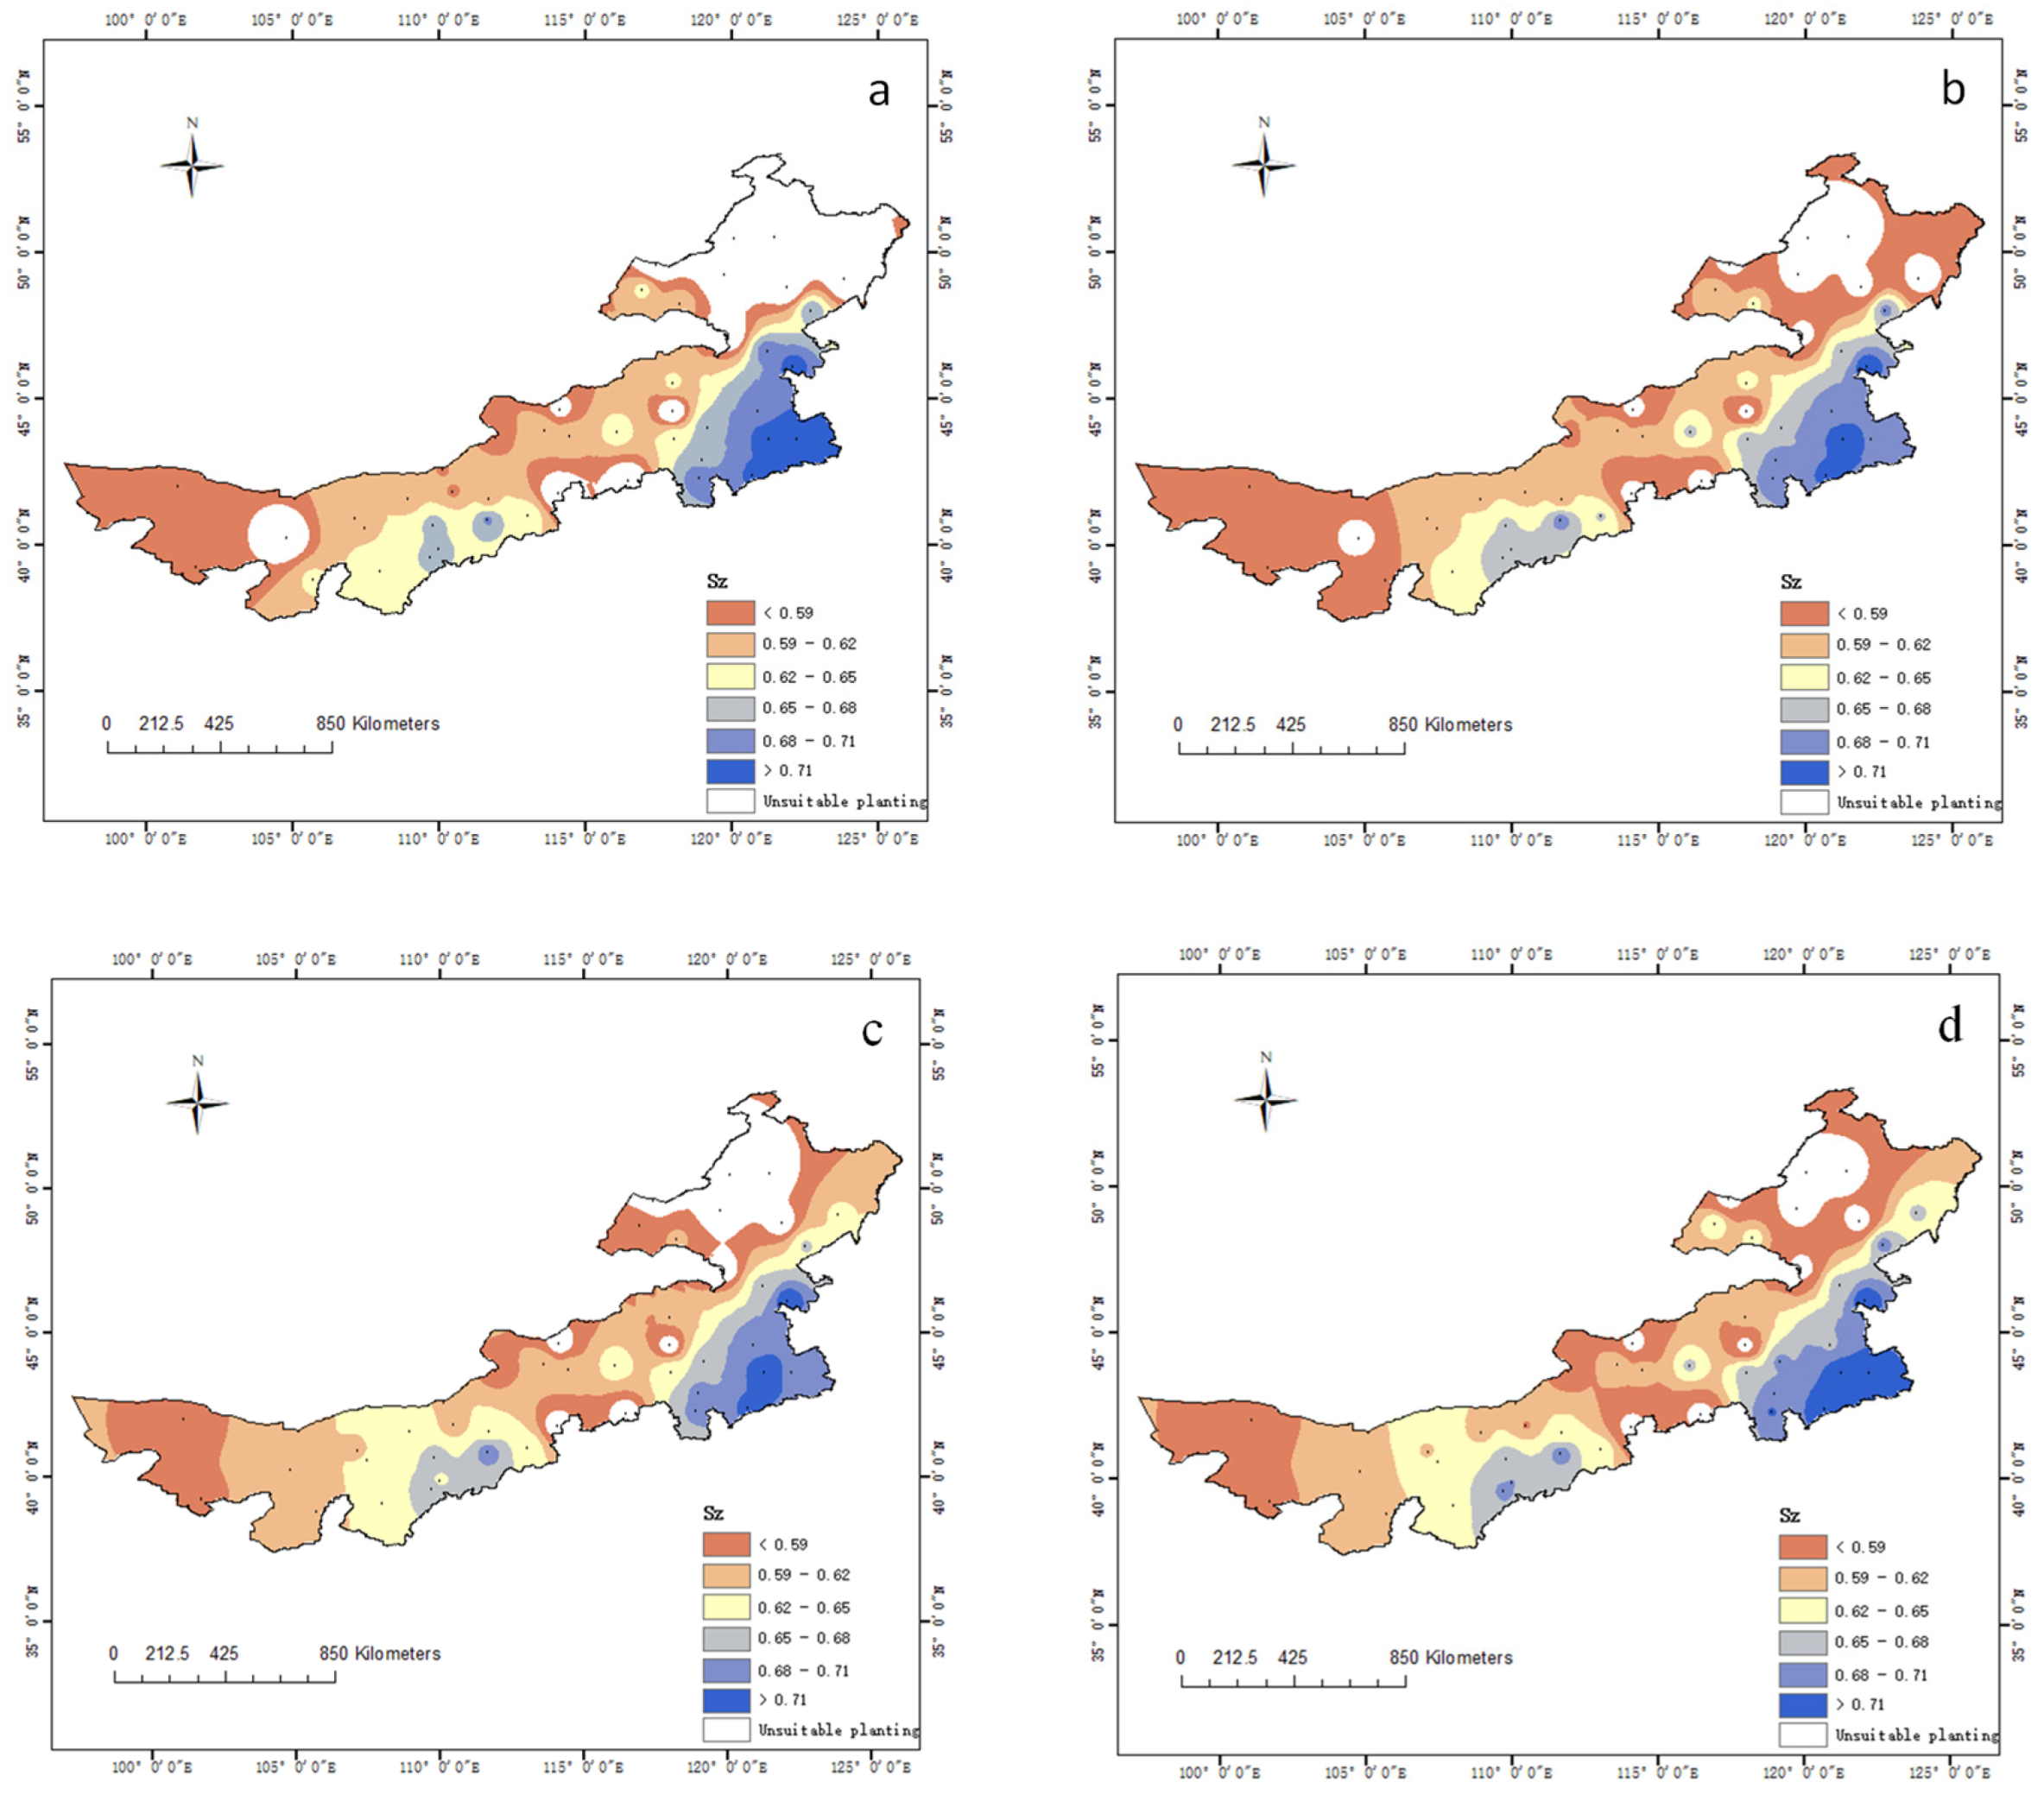
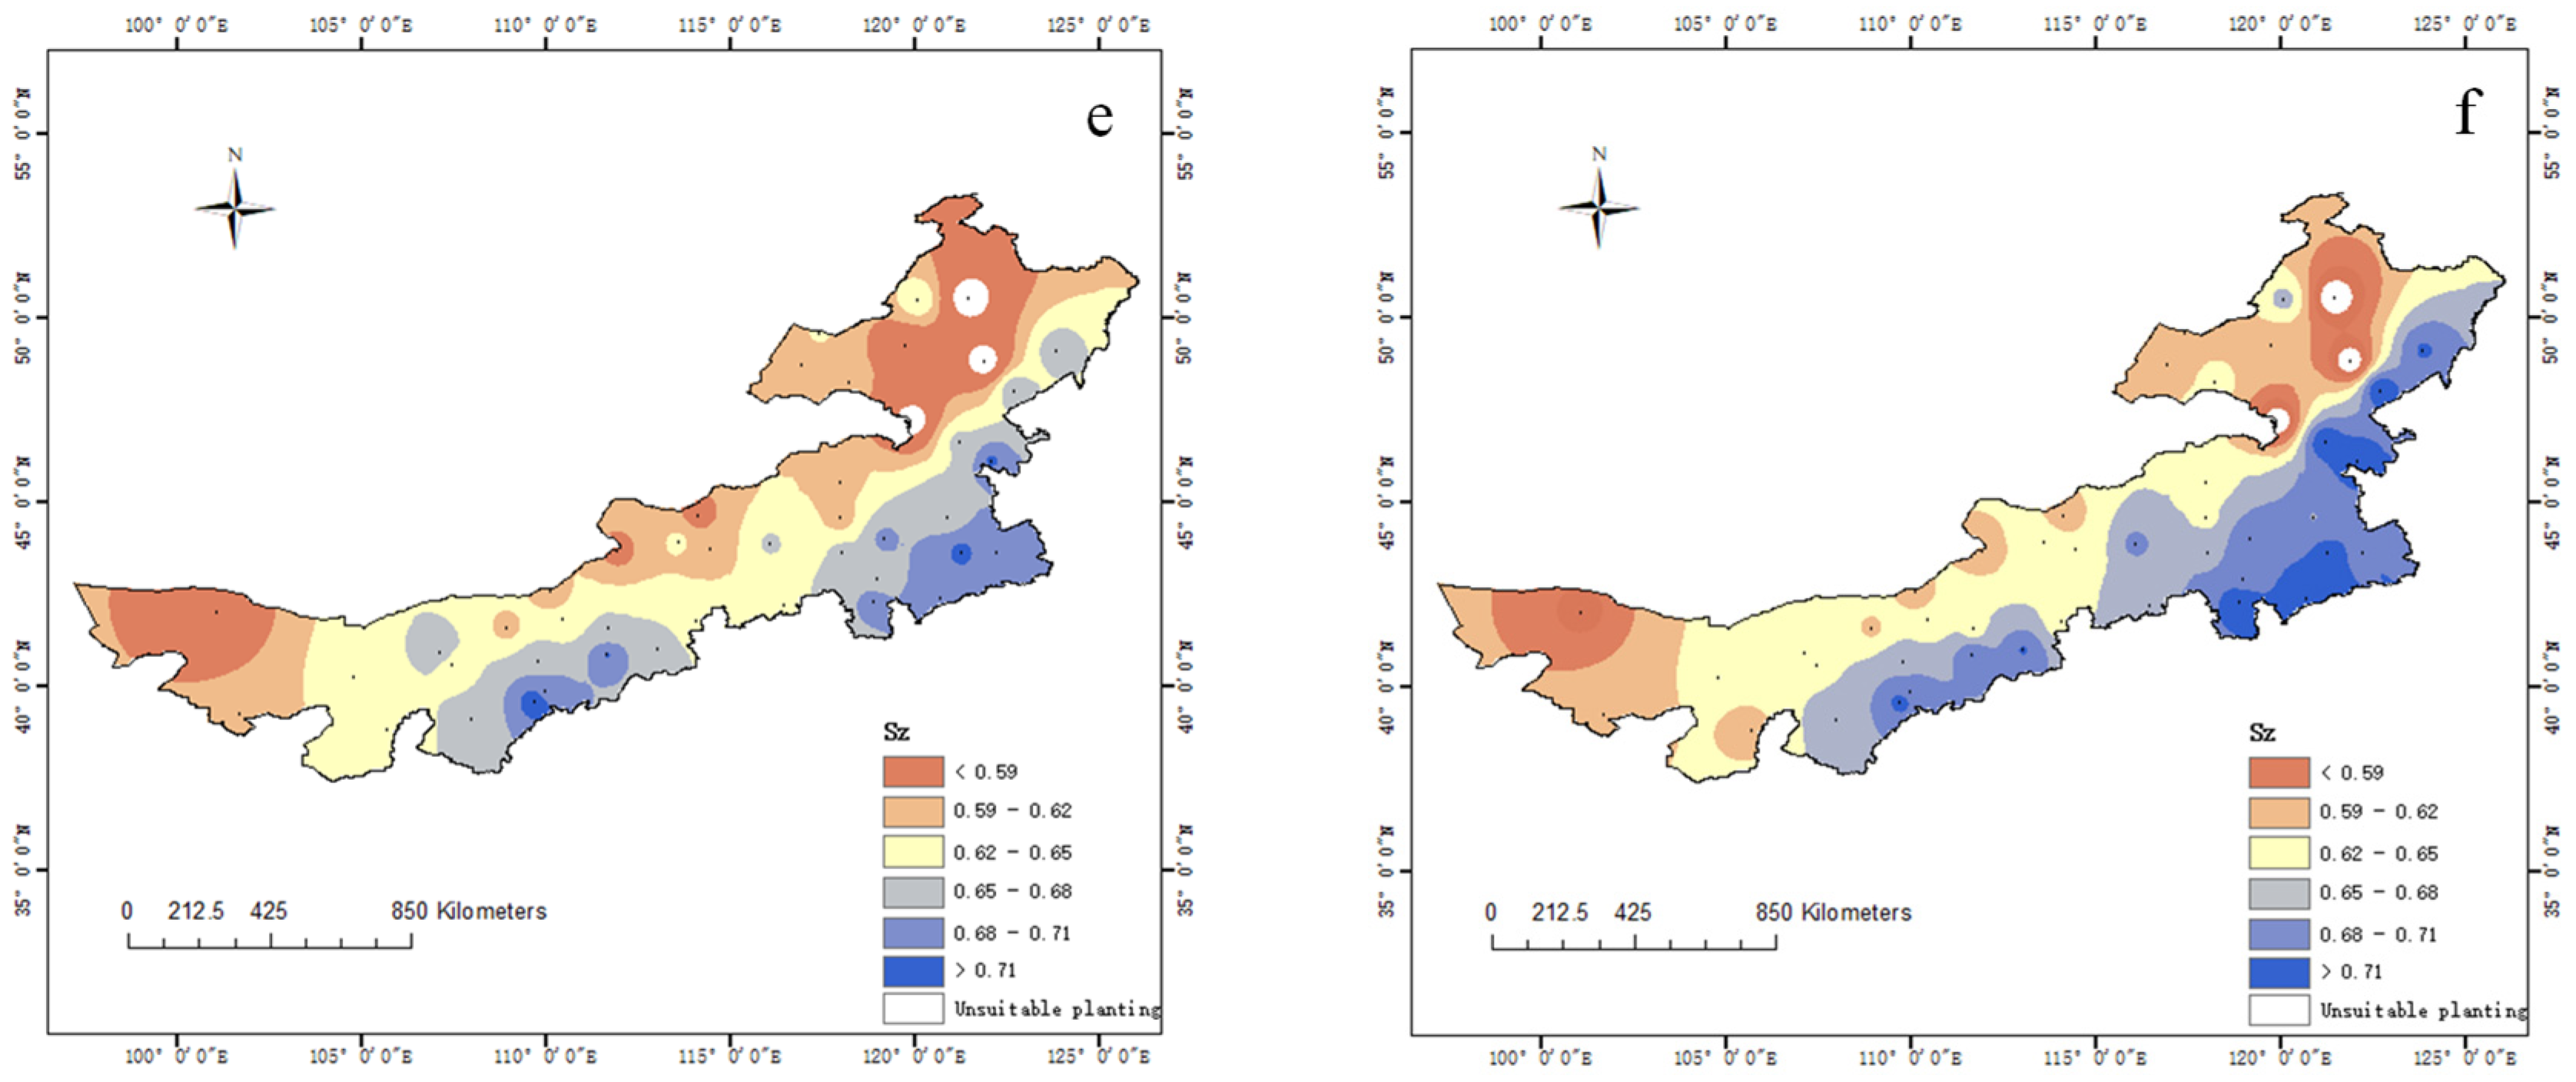
The spatial distribution of the average climatic suitability of the spring maize planting area in Inner Mongolia is shown in Figure 5. From 1959 to 1968, areas with high climate suitability (SZ ≥ 0.68) were mainly distributed in the southeastern and midwest regions of Inner Mongolia. Among them, Baoguotu, Ulanhot, Kailu, and Tongliao had climate suitability above 0.71. The areas with the medium-values of climate suitability (0.62 ≤ SZ < 0.68) were close to the high-value area and were distributed in the midwest and southeast regions and sporadically across other regions. The areas with SZ between 0.65 and 0.68 included Dongsheng, Yijinhuoluo Banner, Baotou, Wengniute Banner, Zhalantun, and Balinzuo Banner. The areas with low climate suitability (SZ < 0.62) were mainly distributed in the western region, central region, and upper half of the medium-value region. From 1969 to 1978, the areas with low climate suitability expanded further to the northeast, and unsuitable planting areas in the northeast gradually decreased. The median climate suitability zone (0.65 ≤ SZ < 0.68) showed a slight increasing trend in the central and western regions but changed little in the remaining regions. From 1979 to 1999, the medium climate suitability region (0.62 ≤ SZ < 0.65) began to expand northward and northeast. The climate suitability of Linhe and Wulatzhongqi in the midwest regions changed from low to medium. Xiaoergou in the northeast region changed from an unsuitable area for maize planting to a moderately suitable area, resulting in an extension of the median climate suitability area to the northeast. The high suitability areas in Northeast China shrank slightly. The reason is that Wengniuteqi and Zhaluteqi changed from high to medium suitability areas. The high suitability areas in central and western increased, and part of the median suitability area changed to a high suitability area. The boundaries of the medium suitability areas in the midwest and southeast regions extended to the northwest, and the two ends of the medium suitability areas began to connect. The low climate suitability area in the central region gradually changed into a medium suitability area, and the boundary line extended to the western and eastern regions. From 2009 to 2018, the boundary of the high climate suitability zone further expanded to the north, and the southeast part further extended to the northeast. Among the regions, Xiaoergou changed from a medium suitability area to a high suitability area. Further, the central region changed from a low suitability area to a medium suitability area. In the end, low suitability areas were concentrated in the western and northeastern regions of Inner Mongolia and scattered in the central region.
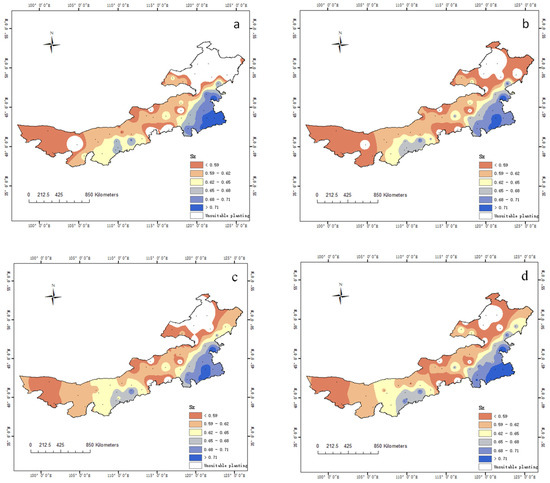

Figure 5.
Spatial distribution of average climate suitability of spring maize in Inner Mongolia from 1959 to 2018. (a): 1959–1968, (b): 1969–1978, (c): 1979–1988, (d): 1989–1998, (e): 1999–2008, (f): 2009–2018.
In summary, there were obvious differences in climate suitability among the regions of Inner Mongolia. In the past 60 years, the climate suitability of the western region has always been low, whereas the southeast region has always had a high suitability area. The unsuitable areas for planting in the northeast have gradually been covered by low suitability areas. The climate suitability of the central region has changed from low to medium and high, with the largest range of changes. Therefore, in the context of climate change, to obtain higher production efficiency, attention should be paid to regional differences.
3.4. Relationship between Climate Suitability and Yield
The relationship between climate suitability and meteorological yield varied between regions but is positive overall (Table 3). The climate suitability of Chifeng, Eerduosi, Huhehaote, and Hulunbeier is positively correlated with climate-induced yield, whereas the climatic suitability of Baotou and Bayannaoer is negatively correlated with climate-induced yield. In order to establish the qualitative relationship between climate suitability and climate-induced yield, stepwise regression equations were established for climate elements, climate suitability, and yield (Table 3). Sunshine hours are the key factors affecting the climatic-induced yield of Spring Maize in Baotou. In Bayannaoer, rainfall and sunshine hours are the key factors, whereas climate suitability and sunshine hours are the key factors in Chifeng. Climate suitability is a key factor in Huhehaote and Eerduosi. In Hulunbeier, the climate-induced yield mainly depends on light and temperature.
Table 3.
Influence of climate suitability and meteorological elements on climate-induced yield.
In general, in the above six regions, the number of sunshine hours is the key factor affecting climate-induced yield, followed by climate suitability, rainfall, and temperature. Although the analysis shows that climate suitability is not the most important factor affecting spring maize yield, the meteorological conditions that it depends on are the key, and it is expected that it will have a significant impact on crop production in the future.
3.5. XWT of Climate-Induced Yield and Climate Suitability
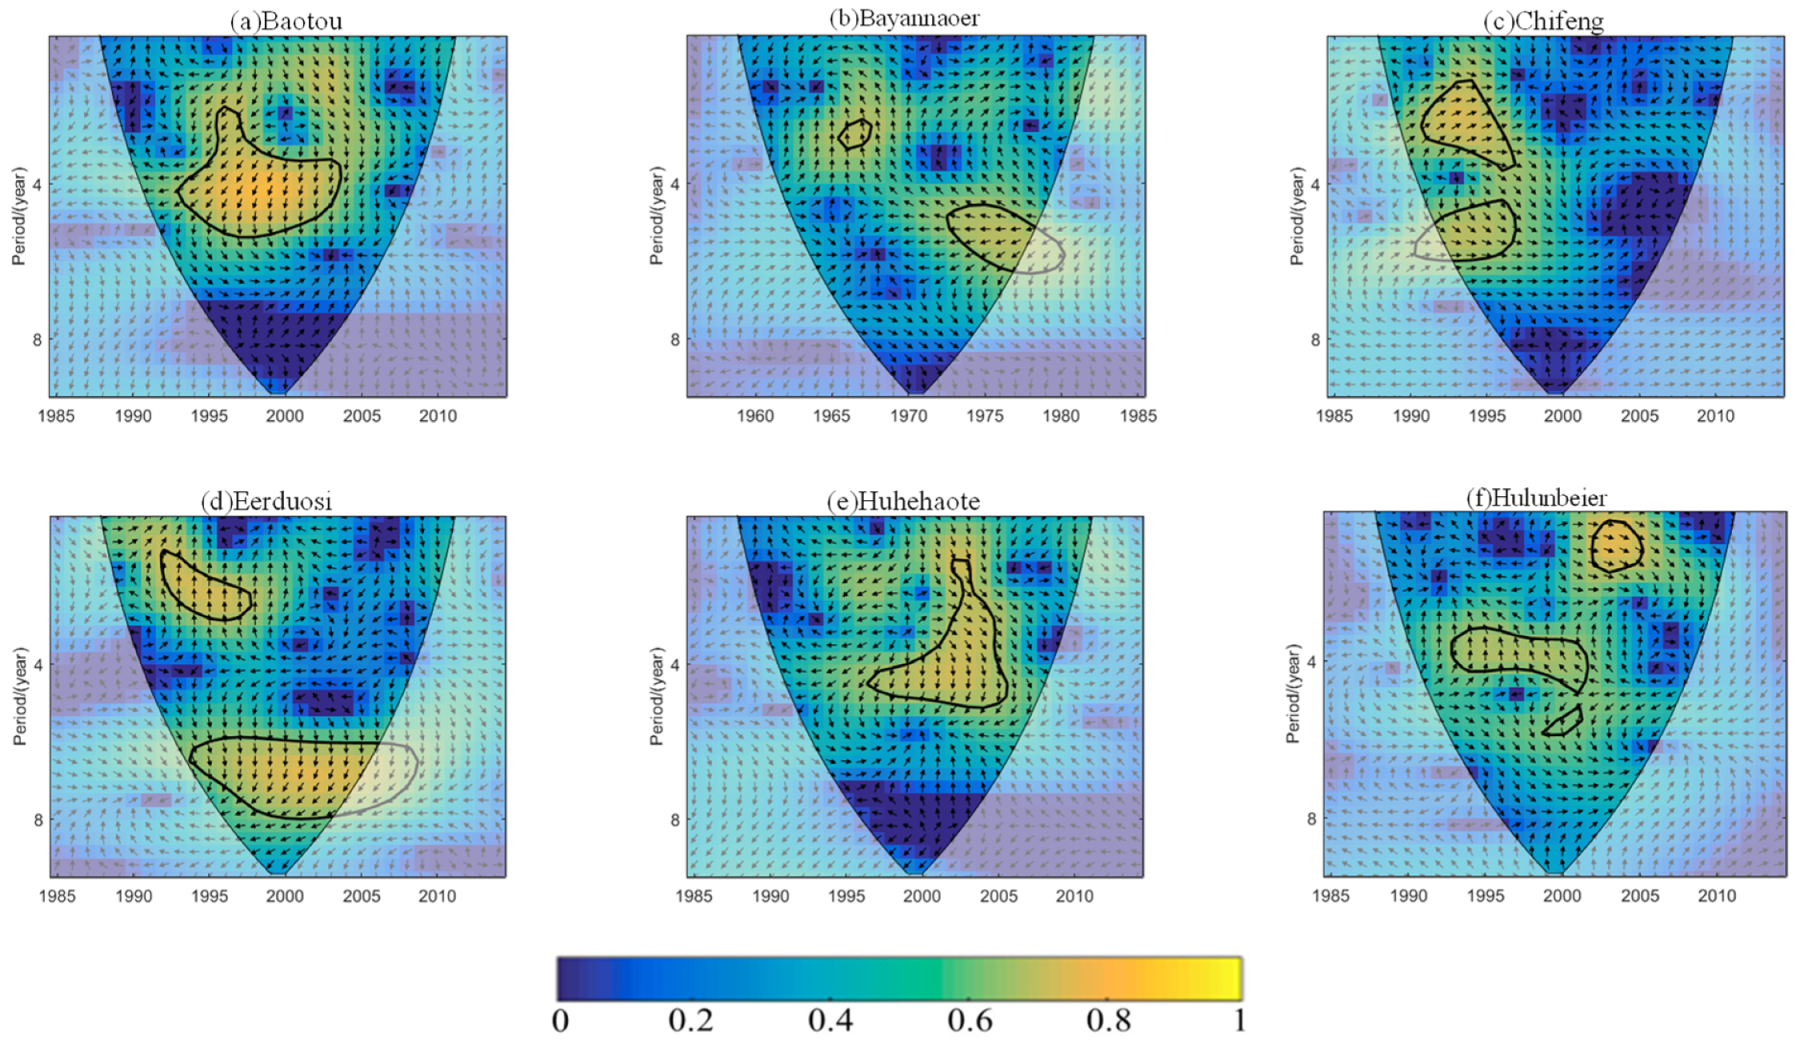
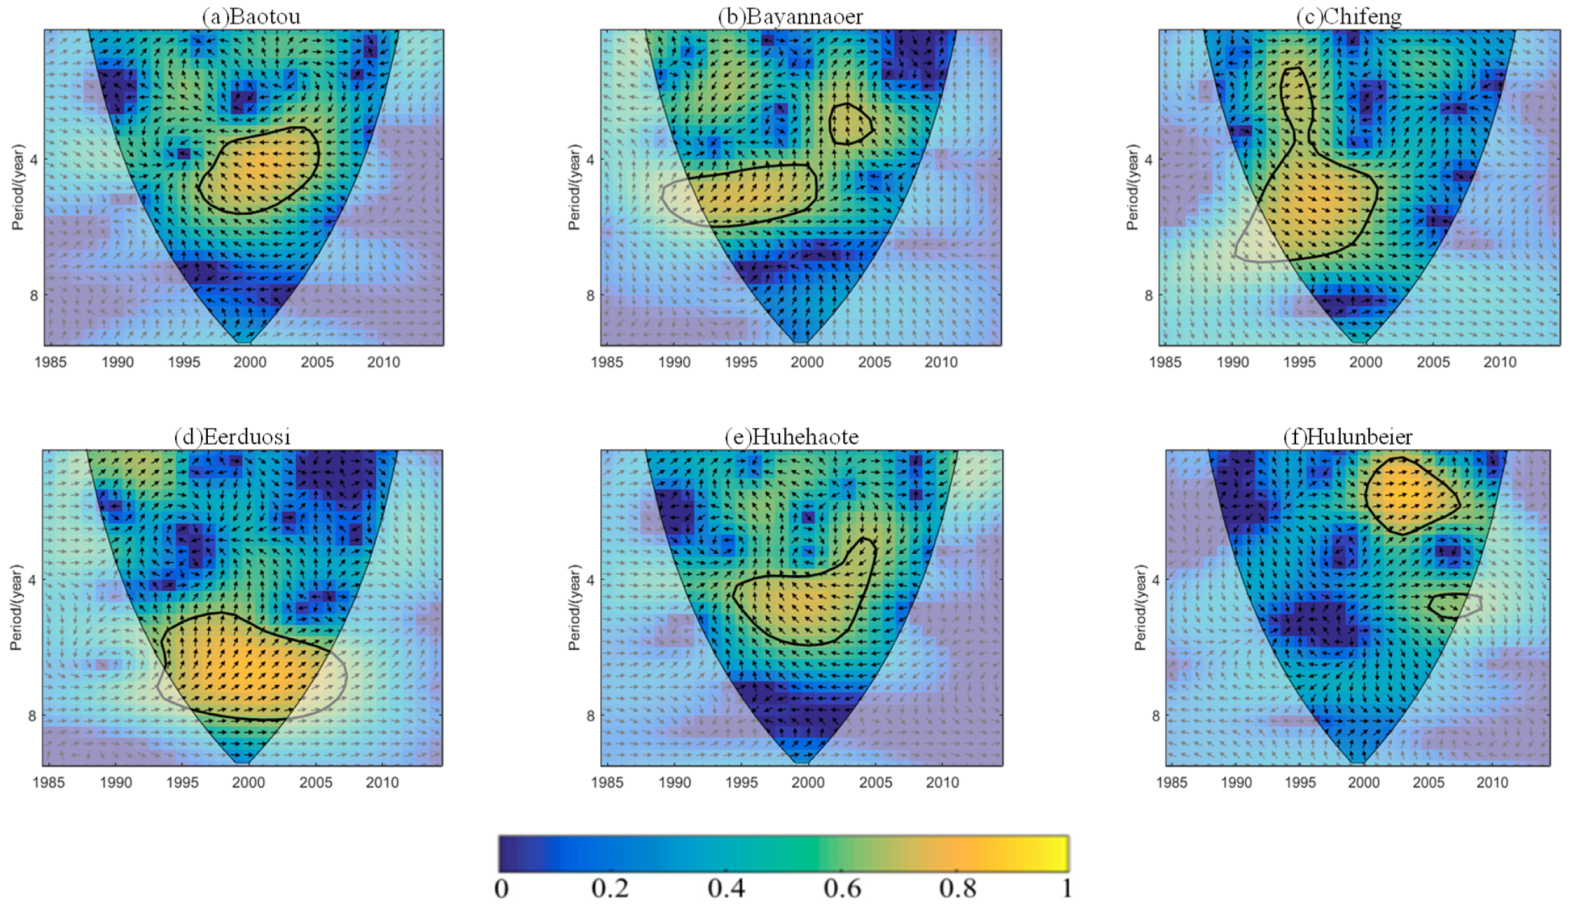
Correlation analysis of climate suitability and climate-induced yield cannot derive the interdecadal relationship between these quantities. However, cross-wavelet analysis can solve this problem effectively. The coherence characteristics of the waves demonstrate that when the periods of the waves are the same and the phase difference meets certain conditions, there is a coherence effect between the waves. Through the XWT of climate suitability and climate-induced yield, the response relationship between them can be discussed. Figure 6 shows the cross-wavelet power spectrum of climate suitability and climate-induced yield for the six regions selected in the first stage. In Baotou, the climate suitability and climate-induced yield have a resonance period of 3–6 years (Figure 6a), mainly concentrated between 1996–2005. In Bayannaoer area, the resonance periods of 2–4 years from 2001 to 2006 and 4–6 years from 1989 to 2001 are shown respectively (Figure 6b). In Chifeng, there is a resonance period of 2–7 years, mainly from 1990 to 2001 (Figure 6c). In Eerduosi, there is a resonance period of 5–8 years, which is embodied in 1993–2007 (Figure 6d). In Huhehaote, there is a 3–6 years resonance period from 1995 to 2005 (Figure 6e). In Hulunbeier, there are resonance periods of 1–3 and 4–5 years from 2000 to 2007 and 2004 to 2009, respectively (Figure 6f). Similar results were obtained by analyzing the cross-wavelet power spectrum of climate suitability and climate-induced yield during the other four periods of spring maize planting (Figure A1, Figure A2, Figure A3 and Figure A4 in the Appendix A). On multiple scales, different phase relationships were found between climate suitability and climate-induced yield in different regions. Baotou and Hohhot showed opposite phase changes, whereas the other areas exhibited positive phase changes. Among the different growth stages, Huhehaote only showed a positive phase relationship in the fifth stage, whereas the other four stages had negative phase relationships. In the fourth stage, Bayannaoer and Hulunbeier did not present statistically significant correlations on the scale of the eight signals. In addition, there was large periodicity in the fourth and fifth stages.
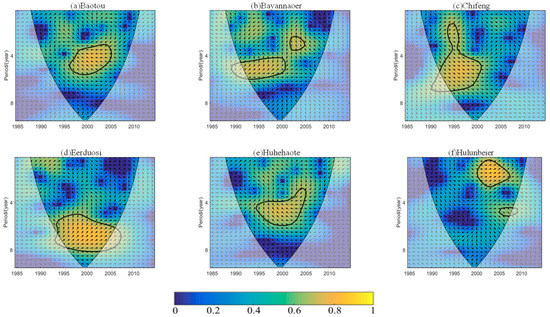
Figure 6.
Cross-wavelet power spectra between climate suitability and climate-induced yields in different regions in the first stage. Note: The areas surrounded by black rough contours had red noise passing the 95% confidence level. Outside the black cone contour is the region with cone of influence. The arrows indicate the relative phase relationships (in phase to the left, in phase to the right). The color bar at the bottom denotes wavelet energy.
The wavelet power spectrum analysis revealed significant interannual variability between the climate suitability for and meteorological yield of spring maize at different growth stages in different regions from 1985 to 2014. The results provide effective basic information for exploring the relationship between climate and spring maize yield.
4. Discussion
The shift of planting boundaries and replacement of crop varieties are important indicators of changes in the cultivation pattern of a region. The present study reports showed that the boundaries of spring maize planting areas with different maturity types moved significantly to the east and north in Inner Mongolia, and that the areas unsuitable for planting in the northeastern region gradually decreased. A similar situation was found in Northeast China (Heilongjiang, Jilin, and Liaoning) at the same latitude as Inner Mongolia. Liu et al. (2013) [51] noted that the accumulated temperature in Northeast China increased at a rate of 60 °C per decade−1 from 1961 to 2007. Zhao et al. (2015) [25] found that from 1961 to 2010, the planting boundaries of maize varieties of different maturity types moved north and expanded east and that the area of medium-late maturity was expanding. Ji et al. (2012) [52] also reported that from 1971 to 2008, the suitable planting range in Northeast China increased. The largest change in the cultivation pattern of spring maize in Inner Mongolia occurred in 1999–2008, and the early maturity planting area was directly replaced by a medium maturity area, which indicated that the heating rate of the province was inconsistent from 1959 to 2018. During 1961–2012, the heating rate of Inner Mongolia was 0.3 °C per decade−1 and that the time of mutation was 1996, which is similar to the division of the basic research periods in the Intergovernmental Panel on Climate Change evaluation report (IPCC, 2013). The change in planting pattern resulted from the extension of each growth period and increases in accumulated temperature during the entire growth period and annual accumulated temperature. Based on the analysis of previous planting data in Inner Mongolia, the results show that climate change has greatly changed the development process of wheat and spring maize in Inner Mongolia. Hou et al. (2013) [32] used meteorological data from 1955 to 2005 and growth period data from 1981 to 2007 to explore the influence of climate change on the phenological period and planting area of the main crops. Among them, the main production area of Inner Mongolia increased by ≥10 °C accumulated temperature at 350–570 °C, and the growth period of spring maize increased by 10–20 days. Xiao et al. (2015) [17] also pointed out that the climate warming has led to an average lengthening of 4.5 days per decade−1 of spring maize in Inner Mongolia. The prolonged growth period resulted in the transition from the early maturing maize planting area in Inner Mongolia to the medium and late maturity areas.
Rising temperatures will increase the comprehensive climate suitability of Inner Mongolia, which will promote the growth of spring maize, indicating that the range of spring maize planting can be appropriately expanded in Inner Mongolia. As maize is a crop with high water consumption, rising temperatures often cause adverse effects in western regions where light and temperature are sufficient and rainfall is the limiting factor. This area is always a late maturity area, with a large amount of evapotranspiration during the growth period of spring maize. Therefore, while considering the scope of crop cultivation, the development of drought-resistant varieties and deployment of water-saving measures should also be considered. The eastern region is a warm and cool area with sufficient rainfall. Rainfall during the growth period of spring maize can reach more than 160 mm, and the coupling degree of rainfall and crop water requirement is relatively high [53]. The northward shift of the planting boundary led to a change in unsuitable planting area to an early maturity area, which reduced the overall climate suitability of the maize planting area. However, the overall climate suitability of Northeast China is always high, and the high climate suitability area is gradually extending toward northeast. The increase in temperature compensates for the lack of accumulated temperature in the eastern region, which causes the light, temperature, and water to have better synergy. Therefore, the eastern region is a potential area for spring maize production in Inner Mongolia, which can expand the scope of maize planting in this region. For the central region, rising temperatures not only lead to the cross-variety phenomenon, but also cause the maize climate suitability to shift from low to medium. Therefore, the planting range of spring maize can be expanded appropriately. It is necessary to consider the impact of future climate change on spring maize in Inner Mongolia. Wang et al. (2015) [34] noted that under the Representative Concentration Pathways (RCP4.5) scenario, in the two decadal time periods from 2021 to 2040, the rate of northeastward expansion of spring maize growing areas in Northeast China will be faster than that during the previous 50 years. Ji et al. (2012) [52] stated that based on WOFOST7.1 crop growth model simulation, the maize yield in Northeast China from 2011 to 2050 will be 9.5% lower than that in 1961–1990. Xiao et al. (2020) [54] simulated the yield and water demand of winter wheat and summer maize in the North China Plain in the future using the APSIM (agricultural production systems simulator) model and concluded that climate change in the future will be favorable for winter wheat production but will have a negative impact on maize.
Li et al. (2014) [55] analyzed the relationships between yield and meteorological elements and found that whether in areas with high or low rainfall, sunshine duration is always the main factor affecting spring maize yield. With different sowing dates of spring maize, Tao et al. (2013) [56] reported that the strongest positive relationship between sunshine hours and yield was in April. Similar to the previous works, this study established regression models between meteorological elements and yield. Inner Mongolia spring maize yield mainly depends on sunshine hours and climate suitability, followed by temperature and rainfall. The influence of sunshine hours on yield is reflected in the early and late stages of growth. The climate suitability of different regions has different effects on yield. Most regions have positive correlations between climate suitability and climate-induced yield. Based on the wavelet power spectra of climate suitability and climate-induced yield at different growth stages, it can be concluded that except in Bayannaoer and Hulunbeier, where no significant correlation was detected in the fourth stage, there are resonance periods of different scales in different growth stages in other regions. Especially in the fourth and fifth stages, the periodicity is more obvious. Zhou et al. (2020) [23] also found that the correlation between the drought index and maize yield was good in the middle and late growth stages of spring maize, and there were multiple resonance cycles in the middle and late growth stages. The late growth stage of maize is a critical period for grain formation. Water stress has a greater impact on yield during the tasselling and spinning stages. Considering waterlogging disasters, the seedling and jointing stages have greater impacts on yield [57]. Therefore, climate suitability can be appropriately strengthened by changing the production conditions during the late growth period to ensure normal growth and development of maize.
Based on the summary of the heat requirements of spring maize varieties of different maturity types in Inner Mongolia, the interdecadal change in the cultivation mode of spring maize from 1959 to 2018 was revealed. On this basis, the climate suitability index of the spring maize planting area was established, and the climate suitability and the relationships between climate conditions and yield were analyzed. Inner Mongolia is also prone to meteorological disasters, with the three most common being floods, lightning, and drought according to statistics. Among these disasters, drought has the widest impact and causes the greatest losses, and the place with the most disasters is also the place with the highest climate suitability [58]. However, the impacts of meteorological disasters and their relationships with climate suitability were not considered in this study. Maize is also affected by crop varieties, nitrogen fertilizer, soil, and management measures [59]. To ensure sustainable development, it is necessary to consider maize production measures comprehensively.
5. Conclusions
(1) The planting boundaries of different-maturity maize (early, medium-early, medium, medium-late, and late) markedly extended northward and eastward over the past 60 years. The planting boundary of medium-late maturity and late maturity types gradually shifted to the middle. The early maturity maize planting area was replaced by a medium maturity area and finally only remained in the northeast. Among all varieties, late maturity maize had the largest planting area, followed by medium maturity maize.
(2) From 1959 to 2018, climate warming increased the climate suitability of spring maize, and climate suitability changed significantly in different regions. The eastern region was the potential maize production area, and the climate suitability was between 0.6 and 0.72, so the planting range in the eastern region could be appropriately expanded. The climate suitability of central China ranged from 0.60 to 0.66, with a significant upward trend, whereas that in the western region ranged from 0.56 to 0.67. In the context of climate change, it is necessary to establish a future climate suitability model.
(3) Cross-wavelet analysis showed that climate suitability and climate-induced yield had significant interannual cycles in different growth stages, especially in the fourth and fifth stages. The meteorological factors affecting yield were found to be sunshine hours, climate suitability, rainfall, and temperature. The quantitative and interdecadal relationships between meteorological elements and climate-induced yield in different regions will be valuable for future crop management and spatial layout.
Author Contributions
Conceptualization, J.S. and X.Y.; methodology, S.Q.; software, S.Q.; validation, J.S., X.Y. and B.Z.; formal analysis, S.Q.; investigation, H.B.; resources, X.F.; data curation, S.W.; writing—original draft preparation, X.Y.; writing—review and editing, X.Y.; visualization, S.Q.; supervision, J.S.; project administration, J.G.; funding acquisition, J.G. All authors have read and agreed to the published version of the manuscript.
Funding
This study was funded by National Key Research and Development Program of China (2017YFD0300802), Inner Mongolia Scientific and Technological Achievements Transformation Project of Inner Mongolia Autonomous Region(2020CG0030), the Maize Industrial Technology System Construction of Modem Agriculture of China (CARS-02-63) and the Fund of Crop Cultivation Scientific Observation Experimental Station in North China Loess Plateau of China (25204120).
Institutional Review Board Statement
Not applicable.
Informed Consent Statement
Informed consent was obtained from all subjects involved in the study.
Data Availability Statement
Not applicable.
Acknowledgments
We would like to thank the Maize High-yield and High-efficiency Cultivation Team for field and data collection.
Conflicts of Interest
The authors declare no conflict of interest.
Appendix A

Figure A1.
Cross-wavelet power spectra between climate suitability and climate-induced yield in different regions in the second stage.
Figure A1.
Cross-wavelet power spectra between climate suitability and climate-induced yield in different regions in the second stage.
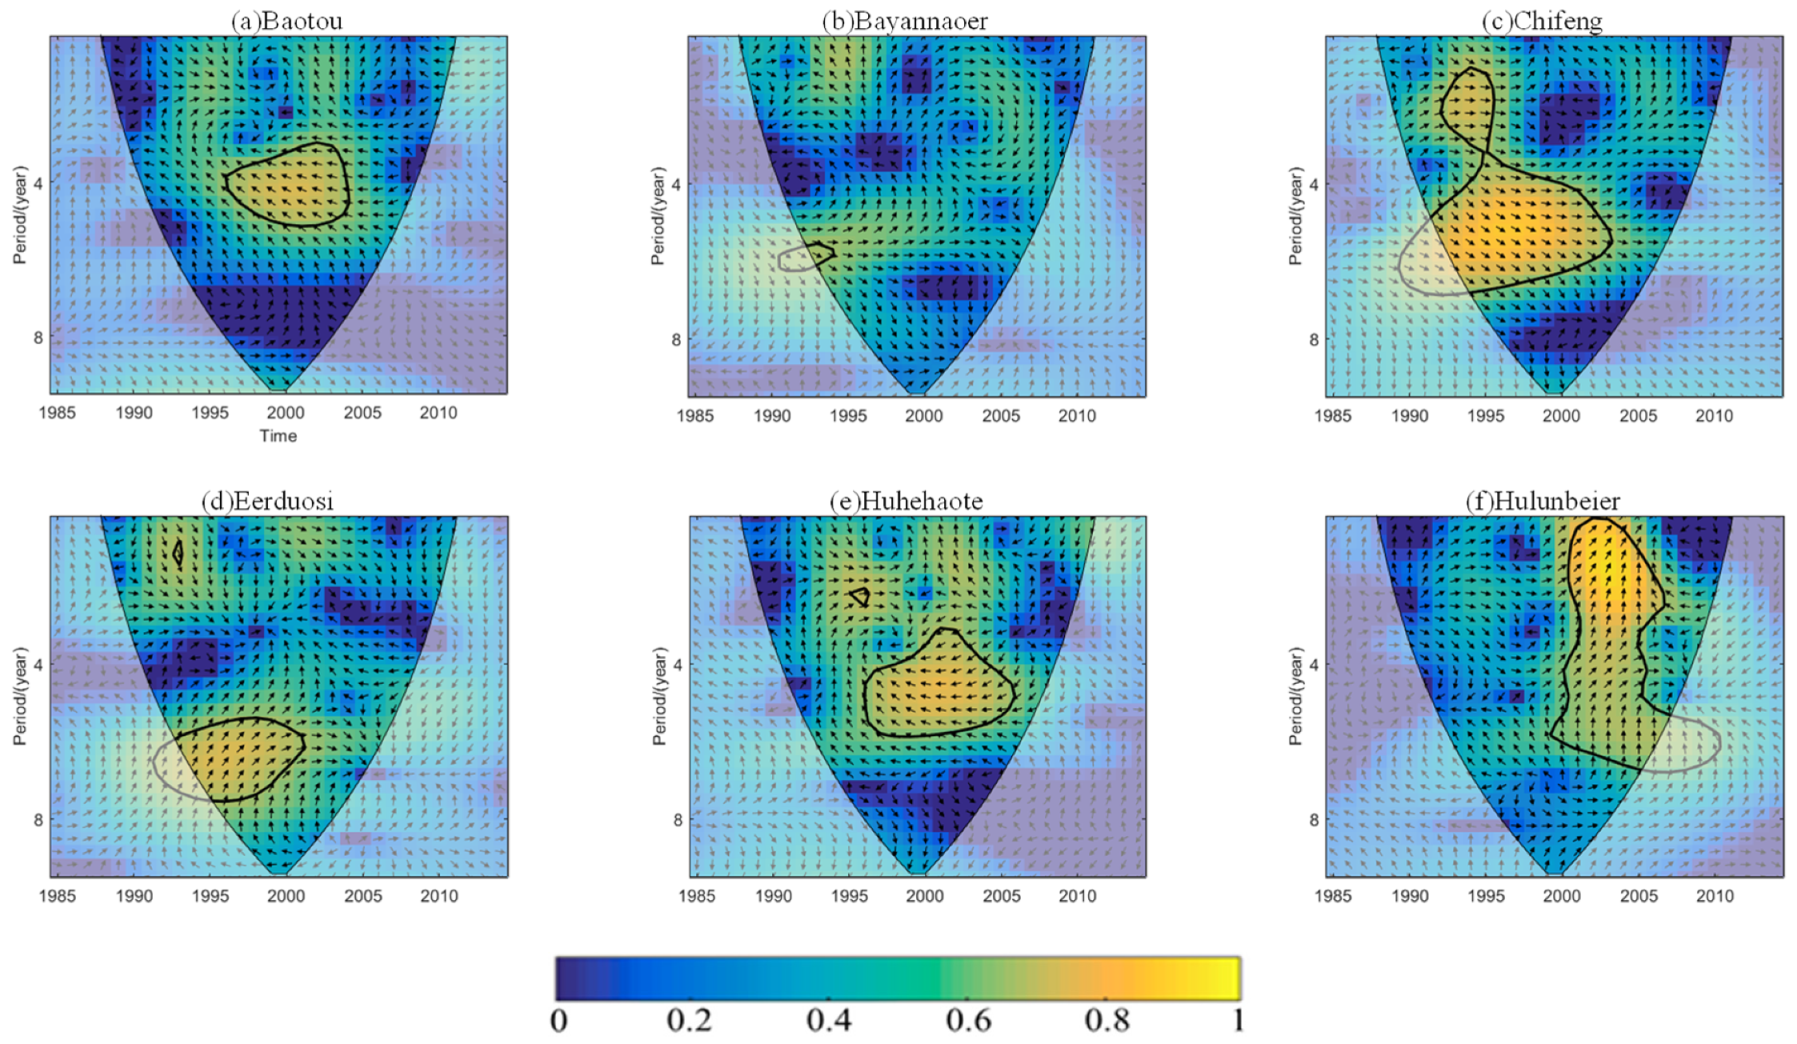
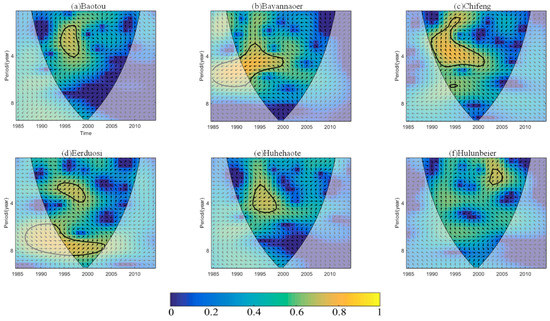
Figure A2.
Cross-wavelet power spectra between climate suitability and climate-induced yield in different regions in the third stage.
Figure A2.
Cross-wavelet power spectra between climate suitability and climate-induced yield in different regions in the third stage.
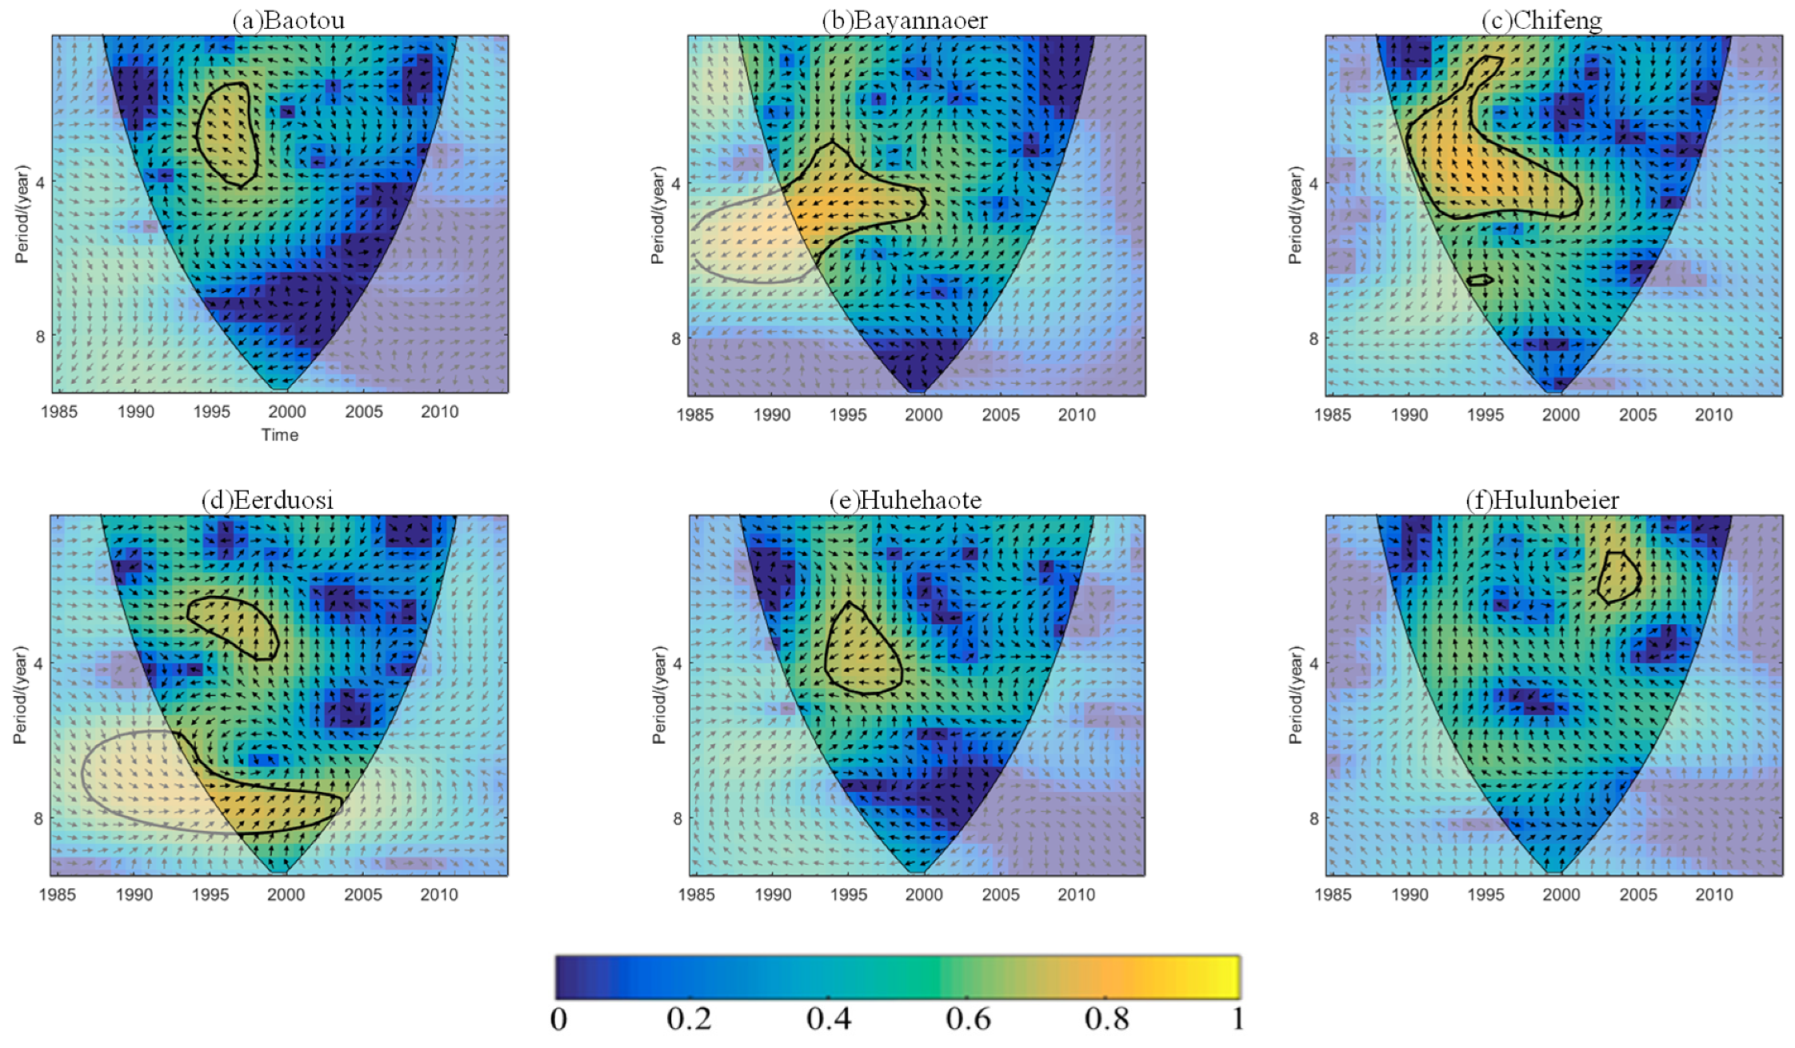
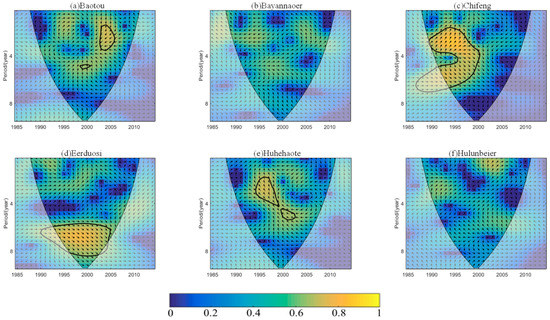
Figure A3.
Cross-wavelet power spectra between climate suitability and climate-induced yield in different regions in the fourth stage.
Figure A3.
Cross-wavelet power spectra between climate suitability and climate-induced yield in different regions in the fourth stage.


Figure A4.
Cross-wavelet power spectrum between climate suitability and climate-induced yield in different regions in the fifth stage.
Figure A4.
Cross-wavelet power spectrum between climate suitability and climate-induced yield in different regions in the fifth stage.
References
- Moeletsi, M.E.; Moopisa, S.G.; Walker, S.; Tsubo, M. Development of an agroclimatological risk tool for dryland maize production in the Free State Province of South Africa. Comput. Electron. Agric. 2013, 95, 108–121. [Google Scholar] [CrossRef]
- IPCC. Climate Change 2014: Impacts, Adaptation, and Vulnerability; IPCC Working Group II: Bremen, Germany, 2014. [Google Scholar]
- Lal, R. Adaptation and mitigation of climate change by improving agriculture in India. In Climate Change and Agriculture in India. Impact and Adaptation; Springer: Cham, Switzerland, 2019; pp. 217–227. [Google Scholar]
- Abd-Elmabod, S.-K.; Muñoz-Rojas, M.; Jordán, A.; Anaya-Romero, M.; Phillips, J.-D.; Laurence, J.; de la Rosa, D. Climate change impacts on agricultural suitability and yield reduction in a Mediterranean region. Geoderma 2020, 374, 114453. [Google Scholar] [CrossRef]
- Tilman, D.; Cassman, K.G.; Matson, P.A.; Naylor, R.; Polasky, S. Agricultural sustainability and intensive production practices. Nature 2002, 418, 671–677. [Google Scholar] [CrossRef] [PubMed]
- Hanjra, M.A.; Qureshi, M.E. Global water crisis and future food security in an era of climate change. Food Policy 2010, 35, 365–377. [Google Scholar] [CrossRef]
- Poppy, G.M.; Chiotha, S.; Eigenbrod, F.; Harvey, C.A.; Honzák, M.; Hudson, M.D.; Villa, F. Food security in a perfect storm: Using the ecosystem services framework to increase understanding. Philos. Trans. R. Soc. B Biol. Sci. 2014, 369, 20120288. [Google Scholar] [CrossRef] [PubMed] [Green Version]
- Spinoni, J.; Naumann, G.; Vogt, J.; Barbosa, P. European drought climatologies and trends based on a multi-indicator approach. Glob. Planet. Chang. 2015, 127, 50–57. [Google Scholar] [CrossRef]
- Kontgis, C.; Schneider, A.; Ozdogan, M.; Kuchairk, C.; Tri, V.D.; Duc, N.H.; Schatz, J. Climate change impacts on rice productivity in the Mekong River Delta. Appl. Geogr. 2019, 102, 71–83. [Google Scholar] [CrossRef]
- Tong, S.Q.; Li, X.Q.; Zhang, J.Q.; Bao, Y.H.; Bao, Y.B.; Na, L.; Si, A.L. Spatial and temporal variability in extreme temperature and precipitation events in Inner Mongolia (China) during 1960–2017. Sci. Total Environ. 2019, 649, 75–89. [Google Scholar] [CrossRef]
- Wang, X.H.; Peng, L.Q.; Zhang, X.P.; Yin, G.D.; Zhao, C.; Piao, S.L. Divergence ofclimate impacts on maize yield in Northeast China. Agric. Ecosyst. Environ. 2014, 196, 51–58. [Google Scholar] [CrossRef]
- Aggarwal, P.; Vyas, S.; Thornton, P.; Campbell, B.M.; Kropff, M. Importance of considering technology growth in impact assessments of climate change on agriculture. Glob. Food Secur. 2019, 23, 41–48. [Google Scholar] [CrossRef]
- Holzkämper, A.; Calanca, P.; Fuhrer, J. Identifying climatic limitations to grain maize yield potentials using a suitability evaluation approach. Agric. For. Meteorol. 2013, 168, 149–159. [Google Scholar] [CrossRef]
- Kenny, G.J.; Ye, W.; Flux, T.; Warrick, R.A. Climate variations and New Zealand agriculture: The CLIMPACTS system and issues of spatial and temporal scale. Environ. Int. 2001, 27, 189–194. [Google Scholar] [CrossRef]
- Carter, T.R.; Parry, M.L.; Porter, J.H. Climatic change and future agroclimatic potential in Europe. Int. J. Climatol. 1991, 11, 251–269. [Google Scholar] [CrossRef]
- Dong, Z.; Pan, Z.; He, Q.; Wang, J.; Huang, L.; Pan, Y.; Chen, Y. Vulnerability assessment of spring wheat production to climate change in the Inner Mongolia region of China. Ecol. Indic. 2018, 85, 67–78. [Google Scholar] [CrossRef]
- Guo, Y.; Xiao, Y.; Li, C.; Gao, Y.; Jiang, X. Analysis on heat conditions of maize production in Tongliao. Meteorol. J. Inn. Mong. 2011, 3, 28–30. [Google Scholar]
- Tang, H.; Niu, B. Climate division of spring maize based on GIS technology in Xing’an League, Inner Mongolia. Chin. Agric. Sci. Bull. 2011, 25, 447–450. [Google Scholar]
- Lv, M. Gis-based precision zoning of heat resources for corn in Hulunbeier City from 1985 to 2014. Meteorol. J. Inn. Mong. 2017, 4, 37–40. [Google Scholar]
- Xiao, D. Changes of crop phenology in Inner Mongolia under the background of climate warming. Chin. Agric. Sci. Bull. 2015, 31, 216–221. [Google Scholar]
- Olesen, J.E.; Bindi, M. Consequences of climate change for European agricultural productivity, land use and policy. Eur. J. Agron. 2002, 16, 239–262. [Google Scholar] [CrossRef]
- Decker, W.L.; Jones, V.K.; Achutuni, R. Impact of Climate Change from Increased Atmospheric Carbon Dioxide on American Agriculture; (No. DOE/NBB-0077); Missouri University, Department of Atmospheric Science: Columbia, MO, USA, 1986. [Google Scholar]
- Liu, W.; Chen, H.; Yu, W.; Liu, Z. Dynamic output forecast research for winter wheat based on climatic suitability index. Meteorol. Environ. Sci. 2008, 31, 21–24. [Google Scholar]
- Sun, X.; Yan, W.; Wu, R.; Li, P. Simulation model for maize developmental stages in Hetao Irrigation Area based on climate suitability. Chin. J. Agrometeorol. 2014, 35, 62–67. [Google Scholar]
- Lobell, D.B.; Burke, M.B. The importance of temperature relative to precipitation. Environ. Res. Lett. 2008, 3, 034007. [Google Scholar] [CrossRef]
- Zhou, Z.; Shi, H.; Fu, Q.; Li, T.; Liu, S. Assessing spatiotemporal characteristics of drought and its effects on climate-induced yield of maize in northeast China. J. Hydrol. 2020, 588, 125097. [Google Scholar] [CrossRef]
- Ding, Y.; Wang, W.; Song, R.; Shao, Q.; Jiao, X.; Xing, W. Modeling spatial and temporal variability of the impact of climate change on rice irrigation water requirements in the middle and lower reaches of the Yangtze River, China. Agric. Water Manag. 2017, 193, 89–101. [Google Scholar] [CrossRef]
- Zhao, J.; Guo, J.; Mu, J. Exploring the relationships between climatic variables and climate-induced yield of spring maize in northeast China. Agric. Ecosyst. Environ. 2015, 207, 79–90. [Google Scholar] [CrossRef]
- Charlier, J.B.; Ladouche, B.; Maréchal, J.C. Identifying the impact of climate and anthropic pressures on karst aquifers using wavelet analysis. J. Hydrol. 2015, 523, 610–623. [Google Scholar] [CrossRef] [Green Version]
- Rossi, A.; Massei, N.; Laignel, B.; Sebag, D.; Copard, Y. The response of the mississippi river to climate fluctuations and reservoirconstruction as indicated by wavelet analysis of streamflow and suspended-sediment load, 1950–1975. J. Hydrol. 2009, 377, 237–244. [Google Scholar] [CrossRef]
- Tian, D.; Asseng, S.; Martinez, C.J.; Misra, V.; Cammarano, D.; Ortiz, B.V. Does decadal climate variation influence wheat and maize production in the southeast USA? Agric. For. Meteorol. 2015, 204, 1–9. [Google Scholar] [CrossRef]
- Rezaei, A.; Gurdak, J.J. Large-scale climate variability controls on climate, vegetation coverage, lake and groundwater storage in the Lake Urmia watershed using SSA and wavelet analysis. Sci. Total Environ. 2020, 724, 138273. [Google Scholar] [CrossRef]
- Zhang, X.; Pan, X.; Xu, L.; Wei, P.; Yin, Z.; Shao, C. Analysis of spatio-temporal distribution of drought characteristics based on SPEI in Inner Mongolia during 1960–2015. Trans. Chin. Soc. Agric. Eng. 2017, 33, 190–199. [Google Scholar]
- Wang, X.; Pan, X.; Gu, S. Trend in reference crop evapotranspiration and meteorological factors affecting trends in Inner Mongolia. Trans. Chin. Soc. Agric. Eng. 2015, 31, 142–152, (In Chinese with English abstract). [Google Scholar]
- Hou, Q.; Zhang, Q. Study on dynamic monitoring index of maize chilling damage in Inner Mongolia. Chin. J. Agrometeorol. 2013, 34, 588–594. [Google Scholar]
- Meng, Y.; Yin Shu Yang, F.; Zhou, Y. Spatial and temporal distribution of accumulated temperature above 10 °C in Shanxi-Shaanxi-Inner Mongolia Region. Chin. J. Agrometeorol. 2016, 37, 615–622. [Google Scholar]
- Wei, F. Statistic Diagnose and Foreshadow Technology in Present Climate; Meteorological Press: Beijing, China, 2007; pp. 69–72. [Google Scholar]
- Guo, J.; Tian, Z.; Zhang, J. Forecasting models of heat index for corn in Northeast China. J. Appl. Meteorol. Sci. 2003, 14, 626–633. [Google Scholar]
- Huang, H. A study on the climatic ecology adaptability of the crop production in the red and yellow soils region of China. J. Nat. Resour. 2013, 11, 340–346. [Google Scholar]
- Song, Y.; Wang, J.; Li, H. Exploration to the method for determining diagnostic indicators of suitable climate for winter wheat. Meteorol. Mon. 2013, 39, 768–773. [Google Scholar]
- Liu, X.; Zhao, Y.; Liu, L.; Gao, Z.; You, L. Climate suitability of maize and its changes in Inner Mongolia. J. Arid Meteorol. 2018, 36, 1020. [Google Scholar]
- Allen, R.G.; Pereira, L.S.; Raes, D.; Smith, M. Crop Evapotranspiration.Guidelines for Computing Crop Water Requirements; FAO Irrigation and Drainage: Roma, Italy, 1998; p. 56. [Google Scholar]
- EI-Maayar, M.; Lange, M.A. A methodology to infer crop yield response to climate variability and change using long-term observations. Atmosphere 2013, 4, 365–382. [Google Scholar] [CrossRef] [Green Version]
- Feng, X. Multi-Scale Analysis of Time-Lag between Net Ecosystem Carbon Exchange and Environmental Factors in a Popullus × Euramericana Plantation; Beijing Forestry University: Beijing, China, 2019. [Google Scholar]
- Altunkaynak, A.; Ozger, M. Comparison of discrete and continuous wavelet-multilayer perceptron methods for daily precipitation prediction. J. Hydrol. Eng. 2016, 21, 04016014. [Google Scholar] [CrossRef]
- Grinsted, A.; Moore, J.C.; Jevrejeva, S. Application of the cross wavelet transform and wavelet coherence to geophysical time series. Nonlinear Process. Geophys. 2004, 11, 561–566. [Google Scholar] [CrossRef]
- Schaller, C.; Göckede, M.; Foken, T. Flux calculation of short turbulent events—Comparison of three methods. Atmos. Meas. Tech. 2017, 10, 869–880. [Google Scholar] [CrossRef] [Green Version]
- Ouyang, Z.; Chen, J.; Becker, R.; Chu, H.; Xie, J.; Shao, C.; John, R. Disentangling the confounding effects of PAR and air temperature on net ecosystem exchange at multiple time scales. Ecol. Complex. 2014, 19, 46–58. [Google Scholar] [CrossRef]
- Jia, X.; Zha, T.; Gong, J.; Zhang, Y.; Wu, B.; Qin, S.; Peltola, H. Multi-scale dynamics and environmental controls on net ecosystem CO2 exchange over a temperate semiarid shrubland. Agric. For. Meteorol. 2018, 259, 250–259. [Google Scholar] [CrossRef]
- Torrence, C.; Compo, G.P. A practical guide to wavelet analysis. Bull. Am. Meteorol. Soc. 1998, 79, 61–78. [Google Scholar] [CrossRef] [Green Version]
- Liu, Z.; Yang, X.; Chen, F.; Wang, E. The effects of past climate change on the northern limits of maize planting in Northeast China. Clim. Chang. 2013, 117, 891–902. [Google Scholar] [CrossRef]
- Ji, R.; Zhang, Y.; Jiang, L.; Zhang, S.; Feng, R.; Chen, P.; Mi, N. Effect of climate change on maize production in Northeast China. Geogr. Res. 2012, 31, 290–298. [Google Scholar]
- Qiao, S.; Qu, Z.; Gao, X.; Yang, X.; Feng, X. Spatial and temporal distribution characteristics of water requirements for maize in inner mongolia from 1959 to 2018. Water 2020, 12, 3080. [Google Scholar] [CrossRef]
- Xiao, D.; Liu, D.L.; Wang, B.; Feng, P.; Bai, H.; Tang, J. Climate change impact on yields and water use of wheat and maize in the North China Plain under future climate change scenarios. Agric. Water Manag. 2020, 238, 106238. [Google Scholar] [CrossRef]
- Li, H.; Yao, F.; Zhang, J.; Hao, C. Analysis on climatic maize yield and its sensitivity to climate change in Northeast China. Chin. J. Agrometeorol. 2014, 35, 423–428. [Google Scholar]
- Tao, Z.; Chen, Y.; Li Chao Yuan, S.; Shi, J.; Gao, W.; Sui, P. Path analysis between yield of spring maize and meteorological factors at different sowing times in North China Low Plain. Acta Agron. Sin. 2013, 39, 1628–1634. [Google Scholar] [CrossRef]
- Liu, Z.; Liu, Z.; Xiao, J.; Nan j Gong, W. Waterlogging at seedling and jointing stages inhibits growth and development, reduces yield in summer maize. Trans. Chin. Soc. Agric. Eng. 2013, 29, 44–52. [Google Scholar]
- Li, D.; Li, Y.; Liu, P. Temporal and spatial variation characteristics of meteorological disasters in Inner Mongolia from 1983 to 2013. J. Arid Meteorol. 2016, 34, 663–669. [Google Scholar]
- Rezaei, E.E.; Lashkari, A. The consequences of change in management practices on maize yield under climate warming in Iran. Theor. Appl. Climatol. 2019, 137, 1001–1013. [Google Scholar] [CrossRef]


Publisher’s Note: MDPI stays neutral with regard to jurisdictional claims in published maps and institutional affiliations. |
© 2021 by the authors. Licensee MDPI, Basel, Switzerland. This article is an open access article distributed under the terms and conditions of the Creative Commons Attribution (CC BY) license (https://creativecommons.org/licenses/by/4.0/).