Article

A Method to Include Life Cycle Assessment Results in Choosing by Advantage (CBA) Multicriteria Decision Analysis. A Case Study for Seismic Retrofit in Peruvian Primary Schools

by
Ian Vázquez-Rowe
1,*,
Cristina Córdova-Arias
2,
Xavier Brioso
2 and
Sandra Santa-Cruz
3
1
Peruvian Life Cycle Assessment and Industrial Ecology Network (PELCAN), Department of Engineering, Pontificia Universidad Católica del Perú, Lima 15088, Peru
2
GETEC Research Group, Department of Engineering, Pontificia Universidad Católica del Perú, Lima 15088, Peru
3
GERDIS Research Group, Department of Engineering, Pontificia Universidad Católica del Perú, Lima 15088, Peru
*
Author to whom correspondence should be addressed.
Sustainability 2021, 13(15), 8139; https://doi.org/10.3390/su13158139
Submission received: 2 May 2021 / Revised: 16 June 2021 / Accepted: 23 June 2021 / Published: 21 July 2021

Abstract

:
Building information modeling (BIM) is an emerging technology that improves visualization, understanding, and transparency in construction projects. Its use in Latin America and the Caribbean (LA&C), while still scarce, is developing in combination with multi-criteria decision-making (MCDM) methods, such as the choosing by advantages (CBA) method. Despite the holistic nature of MCDM methods, the inclusion of life cycle environmental metrics is lagging in construction projects in LA&C. However, recent studies point toward the need to optimize the synergies between BIM and life cycle assessment (LCA), in which a method like CBA could allow improving the quality of the decisions. Therefore, the main objective of this study is to integrate LCA and CBA methods to identify the effect that the inclusion of environmental impacts can have on decision-making in public procurement, as well as comparing how this final decision differs from an exclusively LCA-oriented interpretation of the results. Once the LCA was performed, a set of additional criteria for the CBA method were fixed, including transparency, technical, and social indicators. Thereafter, a stakeholder participative workshop was held in order to gather experts to elucidate on the final decision. The methodology was applied to a relevant construction sector problem modelled with BIM in the city of Lima (Peru), which consisted of three different construction techniques needed to retrofit educational institutions. Results from the LCA-oriented assessment, which was supported by Monte Carlo simulation, revealed a situation in which the masonry-based technique showed significantly lower environmental impacts than the remaining two options. However, when a wider range of technical, social, and transparency criteria are added to the environmental indicators, this low-carbon technique only prevailed in those workshop tables in which environmental experts were present and under specific computational assumptions, whereas teams with a higher proportion of government members were inclined to foster alternatives that imply less bureaucratic barriers. Finally, the results constitute an important milestone when it comes to including environmental factors in public procurement in LA&C.

1. Introduction

Building information modeling (BIM) technology arises as a prominent approach that improves visualization, understanding, and transparency in construction projects [1,2], through the automatization of construction operations owing to the development of accurate virtual models for buildings [3]. Several studies highlight that BIM currently allows a reasonable integration of the initial stages of project development [3,4,5]. To a great extent, this is due to the development of systems that are able to generate complex models that integrate time (i.e., planning and scheduling), budgets, construction, and design parameters to simulate and coordinate the execution of the project [6].
Despite the multiple benefits of BIM, in many cases it is necessary to couple its results with multi-criteria decision-making (MCDM) methods in order to allow decision-makers or even policy-makers to consider the best alternative of an array of options based on multiple factors [7]. Some commonly used MCDM methods applied in the building sector, which may be used individually or through hybridization with other methods, include the analytical hierarchy process (AHP), the Technique for Order of Preference by Similarity to Ideal Solution (TOPSIS), or fuzzy sets—FSs [8]. However, in recent years, choosing by advantages (CBA) has emerged as a popular alternative to these methods [9,10]. The methodological framework of the CBA approach is based exclusively on the advantages rather than advantages and disadvantages, preventing double counting [11], and it has been shown to improve collaboration between designers, builders, and users [12]. In addition, it has also proved to reduce decision times, fostering consensus building throughout stakeholders, enhancing the transparency of the system [9,13], and helping include environmental policy design aspects [14].
A second limitation of the use of BIM and complementary MCDM methods is the fact that it is yet to be universalized in the construction sector. In fact, an important correlation has been observed between countries in which public procurement requires the use of BIM techniques and its implementation in the private sector [15,16]. Whereas New Zealand, the United Kingdom, the United States, and Finland present high adoption rates [17,18], countries in the LA&C region still appear in an early phase of implementation [15,19]. In the specific case of Peru, for instance, the government has only recently passed legislation to gradually include BIM in public procurement in the period 2020–2025 [20].
A third issue of concern in the automatization of processes in the building sector is that, despite efforts to include environmental sustainability information in the modelling, there is still a lack of interoperability of BIM with the life cycle assessment (LCA) software, the main environmental assessment methodology that allows the computation of project-specific environmental impacts throughout the life-cycle of infrastructure [21,22,23,24,25]. Although an increasing number of studies have delved into coupling BIM and LCA directly [26,27], most studies to date have opted to include isolated environmental indicators in MCDM methods to complement BIM [28,29,30,31].
In this context, the main objective of this study is to integrate LCA and CBA methods to identify the effect that the inclusion of environmental impacts can have on decision-making in public procurement, as well as comparing how this final decision differs from an exclusively LCA-oriented interpretation of the results. The methodology was applied to a relevant construction sector problem modelled with BIM in the city of Lima (Peru). The case study selected is linked to the development of a seismic retrofit strategy for primary schools at a high risk of suffering damage in the event of a high magnitude earthquake. The results of this study are expected to be of utility for public policy support, as well as in terms of showing the applicability of environmental information in the building and construction sector.

2. Materials and Methods

2.1. Description of the Case Study

Educational institutions, namely schools, are critical for the economic and social development of nations. In fact, beyond preparing future generations, these infrastructures are used for other purposes, such as polling stations or recreational areas for the local community outside the official timetable. Therefore, these infrastructures need to be continuously monitored for refurbishment to adapt to new technologies and to maintain their utility for society. In certain areas of the world, these buildings are also considered critical in the event of natural disasters (e.g., floods or earthquakes), being the pivotal centers for initial disaster response [32].
In the specific case of Lima (Peru), which is located in an area subject to devastating earthquakes due to the subduction of the Nazca plate [33], schools are considered essential buildings by seismic legislation [34]. In this context of high seismicity, the population of Lima has nevertheless increased abruptly owing to massive immigration from rural areas ever since the mid-1970s, especially in the years of terrorism, greater life expectancy, a sharp reduction in infant mortality, and the lack of major seismic events in this period [35]. This led to an augmentation of the city’s population from 3.1 million people in 1972 to 9.2 million in 2017 [36]. This increase in turn led to a tumultuous urban sprawl, in which new districts were created from scratch with scarce public services. Consequently, from an educational perspective, the government of Alberto Fujimori in the period 1992–1998 developed an ambitious policy to build over 15,000 schools in the metropolitan area of Lima. At least one school was inaugurated every day in that period, allowing the Peruvian capital to lower its infrastructure deficit, with positive effects in terms of school attendance for children [37]. However, most of these schools, which are still currently operational, show critical deficiencies in their structure, far from meeting the standards of current Peruvian anti-seismic regulations [38]. More specifically, these buildings suffer from short-column shear failure, a structural failure that consists of slender columns partially restrained by infill walls [39]. In other words, in the event of a magnitude 8.0 Mw earthquake, most of these schools would suffer significant structural damage, with some even collapsing, posing a threat to infants’ and teachers’ lives [40,41]. Moreover, an event of these characteristics would seriously damage the disaster response system of the city, which relies on schools for sheltering [32,34].
Recent efforts by the Peruvian government, however, are trying to reduce the vulnerability of these infrastructures by drawing up an ambitious plan to retrofit these schools to withstand big earthquakes [42]. For this, three different low-cost incremental seismic rehabilitation (ISR) techniques (i.e., steel, concrete and masonry) were developed, all of which were validated in previous studies in terms of seismic resistance and economic values [38,43]. The retrofitting techniques applied aim at avoiding the fragile failure mechanism of short column, while increasing stiffness, strength, and ductility of the structure in the longitudinal direction in the event of an earthquake. The strategy adopted did not consider the use of seismic insulators, but rather a retrofit based on strengthening with conventional materials. This implies that the ISR techniques selected do not necessarily comply with the current seismic standards, but do allow to reinforce a wide range of older buildings and constructions. The rationale behind this exclusion was the need for the retrofit strategy to be massive, targeting thousands of schools (>15,000) throughout the nation at competitive prices and in a relatively short window of time. Therefore, there is a need to implement a building strategy that is well-known in the construction sector. In addition, ISR techniques allow avoiding full detainment of school activities and the use of temporal classrooms.
The original 780-PRE schools consist of reinforced concrete frames with infill masonry panels in the longitudinal direction (0.13-m thick) and confined masonry walls with reinforced concrete frames in the transversal direction. All these schools have a similar structure: two-story building, with 3 classrooms in the lower level, and another 3 classrooms in the upper level [38].

2.1.1. Reinforcement of Columns and Infill Masonry Walls with Steel Mesh (MARM)

The first retrofitting technique consists in placing confined masonry walls on each side of a principal column by jacketing these elements through welded steel mesh, creating a compound wall [38]. The retrofit is performed in two stages. First, the strengthening of four columns is done in both stories. Thereafter, two more columns are retrofitted to finalize the process.

2.1.2. Incorporation of Steel Bracings (ACMAC)

The second retrofit technique implies the use of steel frames with concentric bracings, which are added to the structure. The bracings are welded to the frames, which are connected to the reinforced concrete through shear connectors. In a first stage of the retrofit, two steel beams are place in each axes of the first story. Accomplishing this action, however, does not improve the strength of the second story, so the retrofitted structure barely gains resistance. Therefore, a second stage is executed which consists of placing a final steel frame in the second story, which improves the overall performance of the structure [38].

2.1.3. Frame Reinforcement and Incorporation of Reinforced Concrete Walls (IMACA)

The third retrofit technique, referred to as IMACA, consists in strengthening three continuous columns of the longitudinal axes, increasing the central column size and turning adjacent columns into concrete walls. This technique requires the reinforcement of the footings of the columns due to the increase of axial forces for the seismic action. In the first phase, only one frame will be strengthened, and the back frame will be strengthened in a second phase [38].

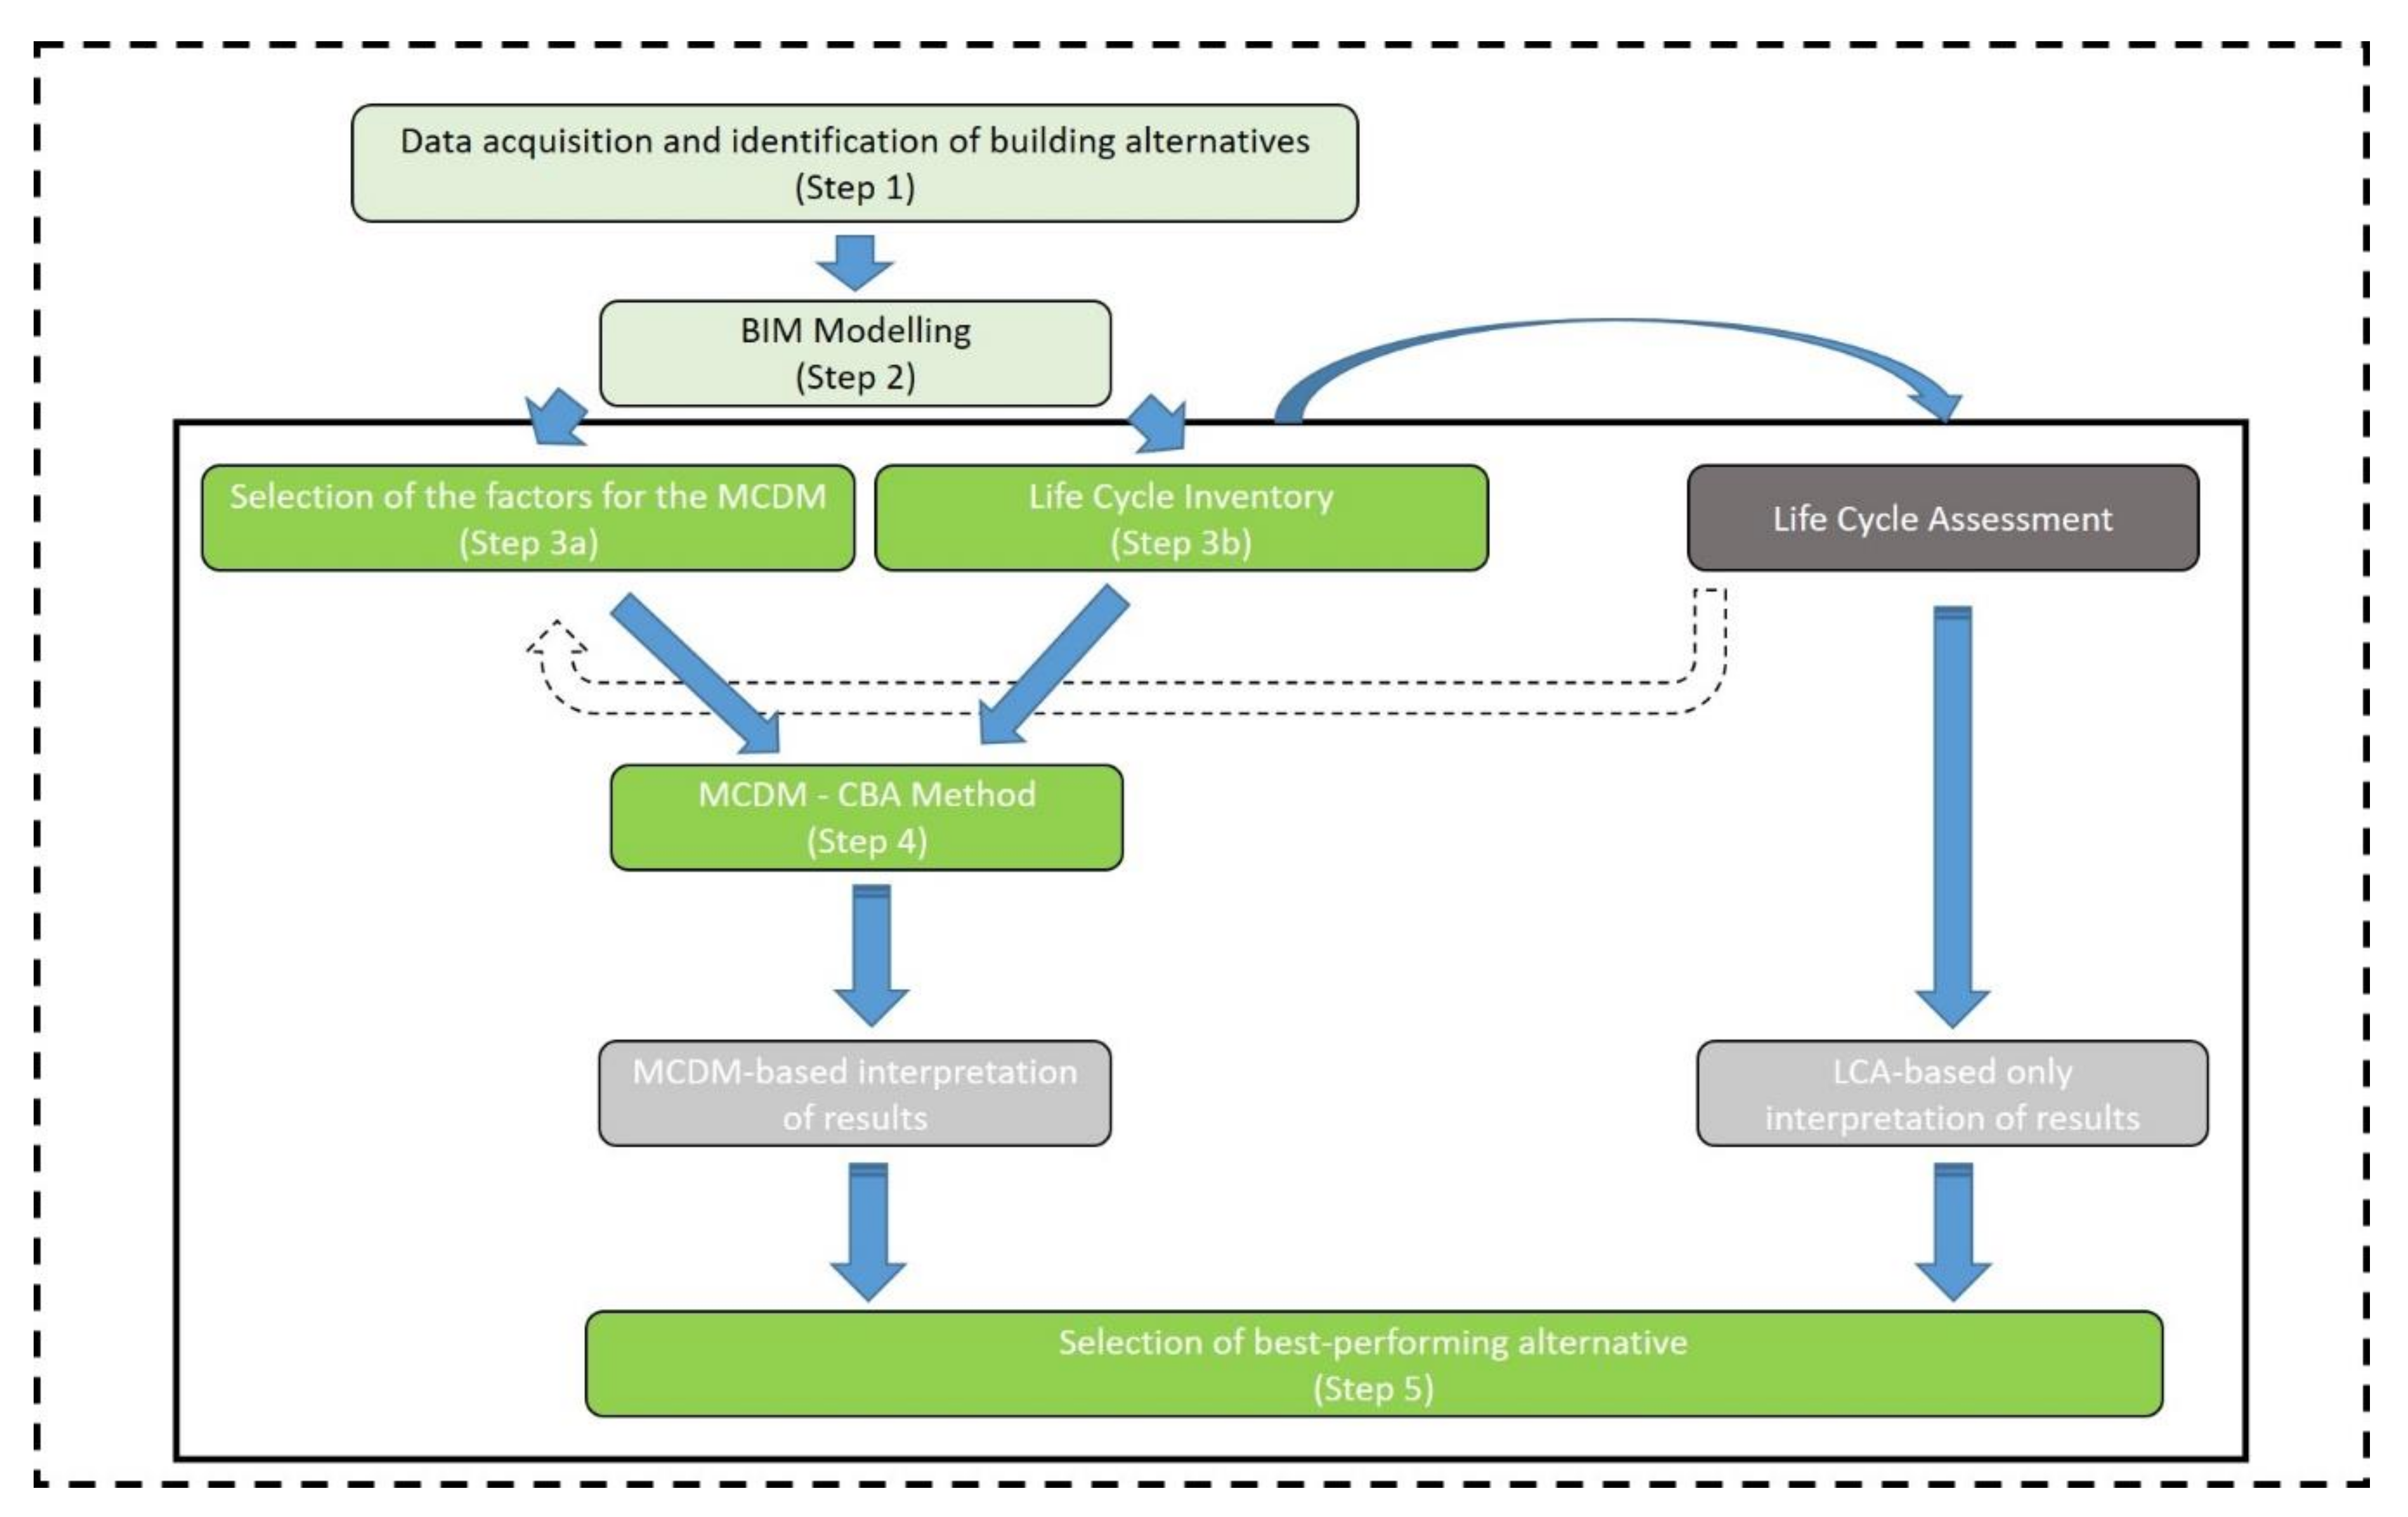
2.2. Methodological Framework

Guaranteeing the safety of primary students during a seismic event should the event occur in school hours is critical. However, there are additional benefits from this action, including the importance that these venues have in sheltering citizens in the aftermath of a seismic event [44]. Considering that the main parameter that must be enforced in retrofitting these schools is covered by the ISR techniques abovementioned, the question that remains to be answered is linked to the choice of one of these three techniques based on auxiliary parameters, which can include economic, logistic, social, and environmental indicators, among others.
In this sense, Figure 1 presents a graphical representation of the methodological framework used in the current study. Step 1 is a preliminary step in which information is collected and the different building techniques are identified. Thereafter, a second preliminary step (i.e., Step 2) was conducted that consisted of the BIM modelling. The BIM modelling, which is described in Santa Cruz et al. [42], served as the benchmark to obtain the quantity take-off (i.e., bill of materials) that was used in the study. This leads, already within the current operational framework, to the definition of additional criteria in the MCDM (Step 3a) through the participation of stakeholders, but also to a clear computation of the foreground system in the life cycle inventory (LCI) in the LCA (see Step 3b).
Once Step 3b is finalized, the life cycle impact assessment (LCIA) can be conducted through the LCA software selected in order to perform an exclusively LCA-oriented interpretation of results. In contrast, the LCA results can be used in Step 3a to expand the number of additional criteria in the CBA method. The amount of environmental indicators, usually referred to as impact categories, will depend on the choice of LCA practitioners, but can be presented in different ways, as will be discussed below.
Finally, the CBA method is modelled in a decision matrix in order to identify the most appropriate building technique (Step 4), allowing an alternative decision process that not only includes environmental criteria, but also a wider range of parameters.

2.3. BIM Modelling

BIM is defined as the digital representation of the physical and functional characteristics of any built object, constituting a reliable basis for making decisions (ISO, 2018). It is used to describe tools, processes, and technologies that provide documentation and digital construction models of a project, including its entire life cycle [45,46]. Hence, BIM allows the management of these digital representations, creating long-term value and promoting innovation [47].
In parallel, the definition of virtual reality is based on concepts that refer to the sensation of being in an environment, generated by natural or mediated means [1,48]. In this context, immersive virtual reality (IVR) and non-immersive are mainly differentiated by the level of presence or immersion that is enhanced through stereoscopic visualization and other resources [49]. IVR and BIM models have proven to be appropriate tools to improve visualization and understanding [49,50]. In fact, in recent years, successful meetings with stakeholders have been implemented in Peru to analyze the construction processes and select the best alternative by coupling BIM and CBA [51,52], and also integrating IVR, BIM, and CBA [53,54].
As aforementioned, although BIM automates and connects the stages of the design process, providing information for data storage, there are still limitations with other databases (e.g., life-cycle databases), since it is necessary to manually enter the embedded life cycle impacts of the construction materials [55]. Despite this constraint, certain studies have shown that coupling LCA and BIM makes it possible to identify environmental critical points and their mitigation, demonstrating that an automated link between LCA and BIM can be achieved when technical, organizational, and informational issues are overcome [56]. Considering that studies coupling BIM and LCA have mainly focused on manual or semi-automatic solutions in the initial design phases, there is a growing trend toward automatic compilation of data exchange [57]. Consequently, it is necessary to develop comprehensive frameworks to assess different sources of uncertainty and variability for BIM-LCA models.
In the current study, as detailed below, the LCA and CBA workflow that supports BIM construction is presented and analyzed in detail as applied to a retrofitting project in Peruvian schools.

2.4. Life Cycle Assessment

2.4.1. Goal and Scope

LCA is an internationally standardized methodology to analyze the life-cycle environmental impacts that occur in a production system [21,22]. Its use in the building sector has grown substantially in recent years [58,59], and has proved to be of great use in understanding the case-specific environmental profile of building projects [60]. In contrast, its application to policy is lagging given the heterogeneity of the sector, as well as the multiple methodological perspectives that can be applied within LCA [61]. In the current study, the use of LCA was considered to be the most appropriate environmental management tool to establish a comparative evaluation of the environmental profile of three alternative retrofit techniques with similar seismic performance.
The function of the production system was considered as an anti-seismically prepared school building that complies with the current Peruvian anti-seismic code for this type of infrastructure. Therefore, the functional unit (FU) was fixed as the demolition and construction intervention to retrofit a 780-PRE school in the city of Lima (Peru). The system boundaries, as shown in Figure 2, included two main stages. On the one hand, the demolition stage, which included the disposal of the demolition waste in a sanitary landfill in the region of Lima. On the other hand, the retrofit phase, which included all the operations needed to upgrade the schools until they met the seismic standards enforced, as well as all the upstream processes in terms of transport, machinery, or raw materials.

2.4.2. Data Collection and Life Cycle Inventory

Data were gathered from an array of bibliographical sources. Having said this, an important portion of the primary data were obtained from the BIM 3D model, as described in Santa-Cruz et al. [42]. This allowed using automated and auditable high-accuracy estimations of the quantity take-off needed for the three ISR techniques.
On the one hand, for the demolition stage, the main data linked to the demolition process were taken from BIM. These data, which can be observed in Table 1, included the demolition volumes, which were highest for the IMACA technique. Transport of the demolition waste was modelled considering an approximate distance of 50 km from a given educational institution to the landfilling site, and heavy duty tipper trucks with a capacity of 6 m3 of waste. Moreover, particulate matter formation (PMF) due to the demolition, loading and unloading, as well as the transport of the demolition waste, were modelled based on the AP-42 standard of US EPA [62].
On the other hand, inventory data for the retrofit stage included the main raw materials used in the construction process, the energy needed in the construction process (both obtained from BIM), as well as the transport distances from the local suppliers of these products. Background data for the modeling of upstream flows in the production system were retrieved from the ecoinvent v3.4 database [63]. However, the production of cement and concrete was based on the data provided by Peru LCA, the Peruvian LCA database [64,65]. Electricity production life cycle modelling was obtained from [66].

2.4.3. Life Cycle Impact Assessment

The life cycle impact assessment (LCIA) stage was conducted by selecting three different metrics to report environmental burdens. First, greenhouse gas (GHG) emissions were computed using the IPCC 2013 assessment method. The selection of this impact category was based on the importance of climate change metrics in current environmental decision-making [67], especially considering the commitment of Peru to mitigating its GHG emissions by 2030 in the frame of the Paris Agreement [68].
Second, a second impact category considered in the study was fine particulate matter formation (FPMF), using the ReCiPe 2016 v1.02 midpoint method. This category was selected considering the urban conditions in which the schools are located, as well as the hyper-dry climate conditions in Lima, where annual average rainfall is below 15 mm [69], fostering a greater prevalence of particulate matter in the lower air column.
Finally, given the holistic nature of this study, an endpoint impact category, human health damage, was applied using the ReCiPe method aforementioned [70]. It should be noted that this endpoint category includes the damage caused by the environmental impacts of climate change, FPMF, and six additional impact categories: stratospheric ozone depletion, ionizing radiation, ozone formation, human toxicity (carcinogenic and on-carcinogenic), and water consumption.
All life-cycle modellings were carried out using the SimaPro v8.5.2 software [71].

2.5. Choosing by Advantages

The CBA method, as aforementioned, is an MCDM method that has gained relevance in recent years, owing to its perspective of differentiating the available alternatives by summarizing their advantages [7]. Moreover, CBA introduces the subjective decision-making part at the end of the pipeline through weighing the importance of the advantages identified [13].
For a CBA to be applied, a set of alternatives must be present in the decision-making process. In the current study, these alternatives are represented by the three retrofit techniques. Thereafter, a set of factors are identified, which are defined as the parameters of each alternative that influence the decision. These factors may be of completely different nature, including social or environmental issues, among others. Table 2 presents the factors that were selected in the study, which include social, transparency, and environmental dimensions. It should be noted that seismic performance was not included within the factors considering that all three ISR techniques perform similar and no advantages would be established between them. A following step within the CBA method is to define a criterion that describes how a particular factor should be interpreted. Thereafter, a fourth step implies the quantification of each factor, and what their attributes are named, which will lead to the definition of the respective advantages in each factor [7].
The final step needed to obtain the results to compare the alternatives consisted of a collaborative workshop with the participation of stakeholders from the different stages of a construction project. As described in Santa-Cruz et al. [42], invited stakeholders included representatives from professional societies (e.g., National Associations of Engineers and Architects), local governments (e.g., municipal authorities), education boards as users of these constructions, academia and authorities responsible for supervising risk management policies and plans. Workshop participants were, thereafter, divided into four groups of 8–10 people. These groups were not homogeneous, and based on the individual profile of the group member, three different group profiles were identified, as shown in Table 3.
Each group was led by a moderator linked to the research study to clarify doubts regarding the workshop dynamic, explain the details of the project, and articulate the methodology to quantify each factor. Consequently, each group provided consensual weights for each factor, which eventually led to the definition of the respective advantages in each sector. The weighting of the importance of advantages (IoAs) corresponds to a value that is given for each factor for each alternative. By adding the IoA for all factors considered, the decision-maker obtains the total importance of a given alternative and can compare the result to that of other alternatives [7]. It was left to the discretion of each working group to decide on the specific value that represented the differences between the two alternatives.

2.6. Sensitivity and Uncertainty Analysis

It should be noted that the data quality utilized made it possible to use primary data for the production of cement and concrete in Peru [64], whereas no local data were available for the other two materials. Hence, considering the variability of data quality in terms of geographical correlation, a stochastic assessment was conducted using the Monte Carlo (MC) simulation. For this, pseudo-random values (1000 iterations) for each data point present in each of the three production systems were generated following their probability distribution calculated with the Pedigree matrix [72,73]. The MC simulation function in the SimaPro software was used to carry out this computation.
A sensitivity analysis was conducted in the CBA method to identify to what extent the decision-making process is susceptible to changes in the final decision based on methodological choices. For this, regardless of the baseline scenario, which represents the modelling process undergone by workshop participants, three additional scenarios were simulated in which certain environmental factors were eliminated (see Table 4). Moreover, it should be noted that beyond the IoAs values used in the workshop, two alternative computational processes were modelled. On the one hand, weighting was performed considering the advantages per category rather than per factor. On the other hand, a final perspective considered the calculation of the IoA values applying a linearity principle of the advantages.

3. Results and Discussion

3.1. Environmental Impacts of the Three Retrofit Techniques

The deterministic environmental impact results obtained for the three retrofit techniques show that, regardless of the environmental indicator analyzed, MARM appeared to be the best performing alternative. For instance, in the case of GHG emissions, the total emissions per FU for this alternative were 24.33 t CO2eq (see Table 5), 49% lower than for IMACA (47.63 t CO2eq) and 77% as compared to ACMAC (101.2 t CO2eq). Interestingly, ACMAC proved to be the best-performing alternative when the demolition stage was analyzed independently, given the lower interventions needed in this process. In contrast, reinforced steel frames and bracings appeared to be the material with the highest environmental impact, representing 84% of total GHG emissions in ACMAC.
Results from the stochastic assessment of MC simulation, as shown in Figure 3, strengthen the tendencies that were presented above from a deterministic approach, since ACMAC appeared as the least favorable option when compared to MARM and IMACA, respectively, in 100% of the iterations. Moreover, when MARM and IMACA were compared, 100% of the iterations showed a better environmental performance for MARM, which demonstrates the stratified results of this study from an environmental perspective.
If the results are analyzed on a global scale, considering the approximately 15,000 schools that are in need of these retrofit operations, the benefits of selecting the MARM technique rather than the ACMAC option would translate into a mitigation of up to 1.13 Mt CO2eq, which is ca. 1.5% of the target reductions in 2030, a remarkable amount for a country that is currently revising its strategies to improve its commitments in the frame of the Paris Agreement [68]. In fact, the nationally determined contributions (NDCs) presented by Peru already consider certain climate mitigation actions linked to the building sector (i.e., reduction of GHG emissions in the cement industry). Hence, we argue that end-of-pipe mitigation actions in the construction process that do not only consider the production of building materials, but also the appropriateness of selecting certain materials instead of others, could be an important strategy to enhance climate policies in the Peruvian construction sector, especially at a moment in which, despite the long tail of the pandemic, major international actors (e.g., the United States or the European Union) are pushing for further cuts in GHG emissions by 2030 [74]. All in all, from an environmental perspective, it appears that the benefits of selecting the MARM option over the other two techniques imply substantial gains provided that significant trade-offs do not occur in other impact categories, an issue that does not seem to occur when other human health-related categories are assessed (see Table 5).
In this context, the two additional impact categories assessed do not show any trade-offs with similar patterns across the three retrofit techniques. On the one hand, in the case of FPMF, the results follow a similar trend to those observed for climate change, with ACMAC showing the worst performance of the three alternatives with a total emission of 167.5 kg PM2.5eq per FU. For IMACA the emissions of particulate matter were substantially lower, adding up to 54.51 kg PM2.5eq per FU, whereas the lowest values were obtained for MARM (28.01 kg PM2.5eq per FU). Interestingly, the greater portion of the FPMF emissions occur in the retrofit stage, mainly due to upstream processes in the production of the materials used during the construction process, as well as the emissions linked to transport. Therefore, although on-site particulate matter due to demolition and loading of demolition waste was found to be lowest for the ACMAC scenario, from a life-cycle perspective results showed this technique as the least recommended. However, the lack of appropriate models to estimate the particulate matter emitted in the demolition stage may be underestimating the relative contribution of this intervention within the system boundaries of the three techniques assessed [75,76]. On the other hand, for damages to human health similar trends were identified, as seen in Table 5, with disability-adjusted life years being 85% lower for MARM than that for ACMAC, strengthening the fact that by aggregating a wider range of midpoint impact categories in this endpoint category, the decision would remain unchallenged from an LCA perspective.

3.2. Integrating Environmental Impacts in CBA

When the LCA results are integrated in the CBA method, a set of weights are given to the different factors (see Table 2). More specifically, three of these factors represent each of the impact categories used in the LCA. The weights, as observed in Table 6, vary depending on the average values given by the members of each workshop group. Groups 1 and 3, whose members present an environmental profile (see Table 3), showed an increased importance of environmental factors (42% and 52%, respectively), as compared to groups 2 and 4, in which environmental factors represented the lowest aggregated weights as compared to the economic and transparency categories.
Once the IoAs are included in the decision matrix, as shown in Table 7, it is observed that the IMACA technique ranks lowest in all the scenarios that were performed. In contrast, there are two different tendencies when the other two techniques are compared. On the one hand, final results for the baseline scenario in groups 1 and 3 provide a final advantage to the MARM technique, although the advantage with respect to ACMAC for Group 1 is very low, which does not allow a clear interpretation of the results. On the other hand, the results for groups 2 and 4, show a clear advantage for ACMAC.

3.3. Comparison of the Two Decision-Making Perspectives

When the two perspectives are compared, the decision that is taken differs substantially. In this sense, when an LCA-only perspective is considered based on the environmental metric selected, MARM appears as the clear choice to be taken, which ultimately leads to an important mitigation of environmental impacts. In contrast, the CBA method presents two possible decisions depending on the profile of the experts that participated in the workshop. On the one hand, when experts in environmental sciences were present in the workshop tables, a higher weighting was given to the environmental criteria, which led these groups to select the same decision as the LCA-only perspective (i.e., the MARM retrofit technique). However, teams with a higher proportion of government members were inclined to foster alternatives that imply less bureaucratic barriers. In this case, the best performing option, ACMAC, happens to be also the choice with the highest environmental impacts, four-fold more than MARM.
Considering the total number of factors included in the MCDM matrix, it could be argued that the number of environmental factors included in the study (3) is relatively high. Therefore, the fact that MARM performs well in workshop tables with environmental specialists could be due to two different reasons: either the prioritization of environmental aspects in these tables, or the fact that a large number of environmental indicators were included in the MCDM procedure in the first place. To answer this question, a sensitivity analysis (see Table 4 in Section 2.5) was conducted in order to assess how the elimination of certain environmental criteria could affect the overall interpretation of the results.
The opposing results observed in Table 8 lead to an interesting situation in which the two divergent views lead to the selection of either the best or worst environmental option out of the three assessed. On the one hand, it is interesting to observe that in Scenario 1, in which human health damage is left as the only environmental indicator, ACMAC is the preferred option for all groups. This occurs for Group 1 also in scenarios 2 and 3, regardless of the computational process modelled. In contrast, results in Group 3 show a better performance of MARM in scenarios 2 and 3.
When these results are crossed with the weights shown in Table 6 a high disparity is visible between groups, with a two- or three-fold increase in total weight in environmentally prone groups as compared to groups 2 and 4. We argue that these divergences are, to a certain extent, linked to the lack of a robust framework in which environmental indicators should be included in public procurement in Peru [77]. Although green public procurement (GPP) is being steadily incorporated to promote the definition of environmental requirements in public procurement [78], by using scientific and verifiable criteria [79], its proliferation in LA&C countries is still scarce.
The Peruvian Government has recently begun to promote the use of GPP in a process steered by the Ministry of Environment [80], in which environmental requirements are established and included in product- or service-based guidelines for public procurement. The idea of these mechanisms, which are named Fichas de Homologación, is to provide a set of homogeneous technical criteria for a given product. Based on the results obtained in Table 8, however, it appears that environmental advice in these guidelines could collide with transparency, economic, and social factors.
Hence, we argue that different approaches can be followed to include environmental criteria in GPP strategies. First, results shown in Section 3.1 would steer the decision towards the use of the MARM alternative. While LCA practitioners and other environmental scientists would be eager for this approach to be used, it would imply an important shock to the way public procurement is currently being implemented in a country like Peru. Moreover, a series of barriers, such as lack of environmental knowledge and awareness, capacity building [78], and other motivational, operational, or economic factors [81], would probably reduce the effectivity of this approach, despite the succulent GHG emission reductions that have been theoretically modelled for this particular case study.
A second approach, as shown in Section 3.2, can be seen as a more hierarchic and balanced perspective, in which environmental criteria are integrated in a wider decision-making scheme. This mechanism enhances communication between different stakeholders and provides a less abrupt path toward including environmental aspects in public procurement. However, if environmental stakeholders are not correctly represented, or environmental factors included in the MCDM are not clear or excessively complex, the success of this pathway could be limited. For instance, as seen in the current case study, the profile of the stakeholders in each group or the addition or elimination of criteria can have an important impact on the final results.
A final option, which can be combined with the previous one, implies that rather than using LCA directly to select the alternative with the lowest environmental impact, environmental impact reductions may be attained through a higher level of transparency in the procurement process, in which suppliers demonstrate that they are reporting their environmental impacts and pushing forward actions to reduce their environmental footprint. Under these premises, suppliers would be nudged to implement environmental impact improvement actions regardless of the construction alternative chosen to retrofit the schools. While this alternative does not guarantee that the most environmentally favorable options are considered in the decision process, it may foster research and innovation mechanisms [82,83] that allow attaining environmental improvements in all construction processes.
In any case, the inclusion of environmental impacts and indicators in (green) public procurement must be promoted based on the common standards and/or guidelines that can allow the implementation of environmental policy to public purchases [84]. Beyond the scope of the case study presented, an interesting option to explore, which is being endorsed by the European Commission, is the creation of Product Environmental Footprint Category Rules (PEFCRs). These aim at delivering a comprehensive selection of environmental impacts that adequately and consistently represent the environmental profile of a given product or process [85,86]. Unfortunately, these guidelines are yet to be implemented on a wider scale in LA&C, and cannot be coupled with public procurement unless the product category exists [87]. Consequently, it is plausible to assume that the implementation of these environmental reporting and verification mechanisms in LA&C will be delayed. Hence, in the meantime, we argue that the methodological mindset suggested in this study can serve as an interesting proxy to offer governmental agencies robust environmental data and results through which they can include environmental considerations in (green) public procurement.

4. Conclusions

Including environmental assessment metrics in the decision-making process to compare a set of three retrofit techniques for schools allowed the visualization of substantial differences in terms of environmental burdens between them. An initial LCA-oriented assessment, which was supported by MC simulation, revealed a situation in which the masonry-based technique (i.e., MARM) showed significantly lower environmental impacts than the remaining two options. However, when a wider range of technical, social, and transparency criteria are added to the environmental indicators, this ISR technique only prevailed in those workshop tables in which environmental experts were present and under specific computational assumptions (The Ministry of Education decided to implement the ACMAC technique as a pilot study to reinforce a school in Lima in August 2020 [88], considering that it proved to be the best-weighted regarding auditability and transparency criteria). Either way, we have aimed to establish a method that allows stakeholders to mitigate risk by adding better environmental impact practices in the decision-making process. In fact, considering low-carbon alternatives in seismic retrofitting activities is expected to have an important role in mitigating environmental impacts in high seismic activity areas, such as most of the Peruvian territory.
We argue that the results from the case study constitute an important milestone when it comes to including environmental factors in public procurement in Peru and more generally in LA&C. However, for LCA-oriented results to make their way consistently into policy decision-making in Peru, legislation and standardization guidelines are necessary. Bearing in mind that the window of time for these legislative actions to be in place could be considerable, the two alternative methodologies proposed in the current study (i.e., direct LCA results or LCA results included in an MCDM matrix) appear as appealing options to push policy decisions based on environmental factors forward. Therefore, we suggest that future research should focus on improving the governance that would allow more robust legislation to foster GPP, especially for projects in the construction sector that use BIM, since its use will slowly become compulsory in Peru and other countries in LA&C in upcoming years.

Author Contributions

Conceptualization, X.B. and I.V.-R.; methodology, I.V.-R.; software, C.C.-A. and S.S.-C.; validation, X.B., I.V.-R. and S.S.-C.; formal analysis, I.V.-R.; investigation, C.C.-A.; resources, S.S.-C.; data curation, C.C.-A.; writing—original draft preparation, I.V.-R.; writing—review and editing, I.V.-R., X.B. and S.S.-C.; visualization, I.V.-R. and X.B.; supervision, X.B. and S.S.-C.; project administration, S.S.-C.; funding acquisition, S.S.-C. All authors have read and agreed to the published version of the manuscript.

Funding

This research was partially funded by the Consejo Nacional de Ciencia, Tecnología e Innovación Tecnológica del Perú, according to the Convenio de Gestión N 232-2015-FONDECYT.

Institutional Review Board Statement

Not applicable.

Informed Consent Statement

Not applicable.

Acknowledgments

Kurt Ziegler-Rodriguez is thanked for his support with the life cycle modelling.

Conflicts of Interest

The authors declare no conflict of interest.

References

  1. Azhar, S. Building information modeling (BIM): Trends, benefits, risks, and challenges for the AEC industry. Leadersh. Manag. Eng. 2011, 11, 241–252. [Google Scholar] [CrossRef]
  2. Zhao, X. A scientometric review of global BIM research: Analysis and visualization. Autom. Constr. 2017, 80, 37–47. [Google Scholar] [CrossRef]
  3. Calderón-Hernández, C.; Brioso, X. Lean, BIM and augmented reality applied in the design and construction phase: A literature review. Int. J. Innov. Manag. Technol. 2018, 9, 60–63. [Google Scholar] [CrossRef]
  4. Doumbouya, L.; Gao, G.; Guan, C. Adoption of the Building Information Modeling (BIM) for construction project effectiveness: The review of BIM benefits. Am. J. Civ. Eng. Archit. 2016, 4, 74–79. [Google Scholar]
  5. Ghaffarianhoseini, A.; Tookey, J.; Ghaffarianhoseini, A.; Naismith, N.; Azhar, S.; Efimova, O.; Raahemifar, K. Building information modelling (BIM) uptake: Clear benefits, understanding its implementation, risks and challenges. Renew. Sustain. Energy Rev. 2017, 75, 1046–1053. [Google Scholar] [CrossRef]
  6. Wang, X.; Love, P.E.; Kim, M.J.; Park, C.S.; Sing, C.P.; Hou, L. A conceptual framework for integrating building information modeling with augmented reality. Autom. Constr. 2013, 34, 37–44. [Google Scholar] [CrossRef]
  7. Arroyo, P.; Mourgues, C.; Flager, F.; Correa, M.G. A new method for applying choosing by advantages (CBA) multi-criteria decision to a large number of design alternatives. Energy Build. 2018, 167, 30–37. [Google Scholar] [CrossRef]
  8. Jato-Espino, D.; Castillo-López, E.; Rodríguez-Hernández, J.; Canteras-Jordana, J.C. A review of application of mul-ti-criteria decision making methods in construction. Autom. Constr. 2014, 45, 151–162. [Google Scholar] [CrossRef]
  9. Arroyo, P.; Fuenzalida, C.; Albert, A.; Hallowell, M.R. Collaborating in decision making of sustainable building design: An experimental study comparing CBA and WRC methods. Energy Build. 2016, 128, 132–142. [Google Scholar] [CrossRef]
  10. Kpamma, Z.; Adjei-Kumi, T.; Ayarkwa, J.; Adinyira, E. Choosing by advantages incorporated framework for a user-involved design process. Arch. Eng. Des. Manag. 2018, 14, 194–217. [Google Scholar] [CrossRef]
  11. Suhr, J. The Choosing by Advantages Decision Making System. Greenwood Publishing Group, 1999. Available online: https://products.abc-clio.com/ABC-CLIOCorporate/product.aspx?pc=C3865C (accessed on 1 June 2021).
  12. Schöttle, A.; Arroyo, P.; Georgiev, C.H. Applying choosing by advantages in the public tendering procedure. In Proceedings of the 25th Annual Conference of the International Group for Lean Construction, Heraklion, Greece, 9–12 July 2017; pp. 45–52. [Google Scholar]
  13. Arroyo, P.; Tommelein, I.D.; Ballard, G. Selecting globally sustainable materials: A case study using choosing by ad-vantages. J. Constr. Eng. Manag. 2015, 142, 05015015. [Google Scholar] [CrossRef]
  14. Pérez, C.; Arroyo, P.; Richards, C.; Mourgues, C. Residential curbside waste collection programs design: A multicriteria and participatory approach using choosing by advantages. Waste Manag. 2021, 119, 267–274. [Google Scholar] [CrossRef]
  15. Jung, W.; Lee, G. The status of BIM adoption on six continents. Int. J. Civ. Environ. Struct. Constr. Archit. Eng. 2015, 9, 444–448. [Google Scholar]
  16. Ermolli, S.R.; De Toro, P. Process innovations for the digitalization of public procurement: Synergies between BIM and multi-criteria analysis. J. Technol. Archit. Environ. 2017, 13, 313–321. [Google Scholar]
  17. Tran, V.; Tookey, J.E.; Roberti, J. Shaving BIM: Establishing a framework for future BIM research in New Zealand. Int. J. Constr. Supply Chain Manag. 2012, 2, 66–79. [Google Scholar] [CrossRef]
  18. Eadie, R.; Browne, M.; Odeyinka, H.; McKeown, C.; McNiff, S. BIM implementation throughout the UK construction project lifecycle: An analysis. Autom. Constr. 2013, 36, 145–151. [Google Scholar] [CrossRef]
  19. Machado, F.A.; Delatorre, J.P.M.; Ruschel, R.C. BIM in Latin American Countries: An Analysis of Regulation Evolution. In International Conference on Computing in Civil and Building Engineering; Springer: Cham, Switzerland, 2020; Volume 98, pp. 425–451. [Google Scholar] [CrossRef]
  20. Decreto supremo No. 289-2019-EF: Aprueban disposiciones para la incorporación progresiva de BIM en la inversión pública. El Peruano, 8 September 2019. (In Spanish)
  21. International Organization for Standardization: ISO 14040—Environmental Management: Life Cycle Assessment; Principles and Framework. 2006. Available online: http://www.cscses.com/uploads/2016328/20160328110518251825.pdf (accessed on 20 June 2020).
  22. International Organization for Standardization: ISO 14044—Environmental Management: Life Cycle Assessment: Requirements and Guidelines. 2006. Available online: https://www.iso.org/obp/ui/#iso:std:iso:14044:ed-1:v1:en (accessed on 20 June 2020).
  23. Basbagill, J.; Flager, F.; Lepech, M.; Fischer, M. Application of life-cycle assessment to early stage building design for reduced embodied environmental impacts. Build. Environ. 2013, 60, 81–92. [Google Scholar] [CrossRef]
  24. Cavalliere, C.; Dell’Osso, G.R.; Pierucci, A.; Iannone, F. Life cycle assessment data structure for building information modelling. J. Clean. Prod. 2018, 199, 193–204. [Google Scholar] [CrossRef]
  25. Panteli, C.; Kylili, A.; Fokaides, P.A. Building information modelling applications in smart buildings: From design to commissioning and beyond: A critical review. J. Clean. Prod. 2020, 265, 121766. [Google Scholar] [CrossRef]
  26. Röck, M.; Hollberg, A.; Habert, G.; Passer, A. LCA and BIM: Integrated assessment and visualization of building ele-ments’ embodied impacts for design guidance in early stages. Procedia CIRP 2018, 69, 218–223. [Google Scholar] [CrossRef]
  27. Sharif, S.A.; Hammad, A. Developing surrogate ANN for selecting near-optimal building energy renovation methods considering energy consumption, LCC and LCA. J. Build. Eng. 2019, 25, 100790. [Google Scholar] [CrossRef]
  28. Arroyo, P.; Herrera, R.; Salazar, L.; Giménez, Z.; Martínez, J.; Calahorra, M. A new approach for integrating environmental, social and economic factors to evaluate asphalt mixtures with and without waste tires. Rev. Ing. De Construcción 2019, 33, 301–314. [Google Scholar] [CrossRef] [Green Version]
  29. Arroyo, P.; Molinos-Senante, M. Selecting appropriate wastewater treatment technologies using a choosing-by-advantages approach. Sci. Total Environ. 2018, 625, 819–827. [Google Scholar] [CrossRef] [PubMed]
  30. Reza, B.; Sadiq, R.; Hewage, K. Sustainability assessment of flooring systems in the city of Tehran: An AHP-based life cycle analysis. Constr. Build. Mater. 2011, 25, 2053–2066. [Google Scholar] [CrossRef]
  31. Hu, M. Building impact assessment—A combined life cycle assessment and multi-criteria decision analysis framework. Resour. Conserv. Recycl. 2019, 150, 104410. [Google Scholar] [CrossRef]
  32. Mutch, C. The role of schools in disaster settings: Learning from the 2010–2011 New Zealand earthquakes. Int. J. Educ. Dev. 2015, 41, 283–291. [Google Scholar] [CrossRef]
  33. Somoza, R.; Ghidella, M.E. Late cretaceous to recent plate motions in western South America revisited. Earth Planet. Sci. Lett. 2012, 331–332, 152–163. [Google Scholar] [CrossRef]
  34. Decreto supremo No. 003-2016-VIVIENDA: Decreto supremo que modifica la norma técnica E.030 “Diseño Sismorresistente” del reglamento naxcional de edificiaciones, aprobada por decreto supremo No. 011-2006-VIVIENDA, modificada con decreto supremo No. 002-2014-VIVIENDA. El Peruano, 24 January 2016. (In Spanish)
  35. Buytaert, W.; De Bièvre, B. Water for cities: The impact of climate change and demographic growth in the tropical Andes. Water Resour. Res. 2012, 48. [Google Scholar] [CrossRef] [Green Version]
  36. INEI. Provincia de Lima. Compendio Estadístico 2017. Available online: https://www.inei.gob.pe/media/MenuRecursivo/publicaciones_digitales/Est/Lib1477/libro.pdf (accessed on 25 November 2018). (In Spanish)
  37. Paxson, C.; Schady, N.R. The allocation and impact of social funds: Spending on school infrastructure in Peru. World Bank Econ. Rev. 2002, 16, 297–319. [Google Scholar] [CrossRef]
  38. Loa, G.; Munñoz, A.; Santa-Cruz, S. Seismic evaluation of incremental seismic retrofitting techniques for typical Peruvian schools. In Proceedings of the Structures Congress 2017, Denver, CO, USA, 6–8 April 2017; pp. 101–110. [Google Scholar]
  39. Promis, G.; Ferrier, E.; Hamelin, P. Effect of external FRP retrofitting on reinforced concrete short columns for seismic strengthening. Compos. Struct. 2009, 88, 367–379. [Google Scholar] [CrossRef]
  40. Muñoz, A.; Quiun, D.; Tinman, M. Repair and seismic retrofitting of hospital and school buildings in Peru. In Proceedings of the Thirteenth World Conference on Earthquake Engineering, Vancouver, BC, Canada, 1–6 August 2004. [Google Scholar]
  41. Irfanoglu, A. Performance of template school buildings during earthquakes in Turkey and Peru. J. Perform. Constr. Facil. 2009, 23, 5–14. [Google Scholar] [CrossRef] [Green Version]
  42. Santa-Cruz, S.; Córdova-Arias, C.; Brioso, X.; Vázquez-Rowe, I. Transparency-based protocol for decision-making regarding seismic rehabilitation projects of public buildings. Int. J. Disaster Risk Reduct. 2021, 55, 102116. [Google Scholar] [CrossRef]
  43. Building Seismic Safety Council (BSSC). Engineering Guideline for Incremental Seismic Rehabilitation; FEMA P-420; Federal Emergency Management Agency: Washington, DC, USA, 2009; Available online: https://wbdg.org/ffc/dhs/criteria/femap420 (accessed on 1 June 2021).
  44. Di Ludovico, M.; Digrisolo, A.; Moroni, C.; Graziotti, F.; Manfredi, V.; Prota, A.; Dolce, M.; Manfredi, G. Remarks on damage and response of school buildings after the Central Italy earthquake sequence. Bull. Earthq. Eng. 2018, 17, 5679–5700. [Google Scholar] [CrossRef]
  45. Volk, R.; Stengel, J.; Schultmann, F. Building information modeling (BIM) for existing buildings—Literature review and future needs. Autom. Constr. 2014, 38, 109–127. [Google Scholar] [CrossRef] [Green Version]
  46. Sacks, R.; Eastman, C.; Lee, G.; Teicholz, P. BIM Handbook: A Guide to Building Information Modeling for Owners, Designers, Engineers, Contractors, and Facility Managers; Wiley: Hoboken, NJ, USA, 2018. [Google Scholar]
  47. Project Management Institute. Construction extension to the PMBOK® guide (2016). In Project Management Institute, 3rd ed.; Project Management Institute: Newtown Square, PA, USA, 2016. [Google Scholar]
  48. Steuer, J. Defining virtual reality: Dimensions determining telepresence. J. Commun. 1992, 42, 73–93. [Google Scholar] [CrossRef]
  49. Paes, D.; Arantes, E.; Irizarry, J. Immersive environment for improving the understanding of architectural 3D models: Comparing user spatial perception between immersive and traditional virtual reality systems. Autom. Constr. 2017, 84, 292–303. [Google Scholar] [CrossRef]
  50. Calderon-Hernandez, C.; Paes, D.; Irizarry, J.; Brioso, X. Comparing virtual reality and 2-Dimensional drawings for the visualization of a construction project. In Proceedings of the ASCE International Conference on Computing in Civil Engineering 2019, Atlanta, GA, USA, 17–19 June 2019; pp. 17–24. [Google Scholar]
  51. Murguia, D.; Brioso, X. Using “choosing by advantages” and 4D models to select the best construction-flow option in a residential building. Procedia Eng. 2017, 196, 470–477. [Google Scholar] [CrossRef]
  52. Suarez, J.C.; Zapata, J.; Brioso, X. Using 5D models and Cba for planning the foundations and concrete structure stages of a complex office building. In Proceedings of the 28th Annual Conference of the International Group for Lean Construction (IGLC), Berkeley, CA, USA, 6–10 July 2020; pp. 913–924. [Google Scholar]
  53. Brioso, X.; Calderón, C.; Aguilar, R.; Pando, M.A. Preliminary Methodology for the Integration of Lean Construction, BIM and Virtual Reality in the Planning Phase of Structural Intervention in Heritage Structures; RILEM Bookseries; Springer: Berlin, Germany, 2019; Volume 18, pp. 484–492. [Google Scholar]
  54. Brioso, X.; Calderon-Hernandez, C.; Irizarry, J.; Paes, D. Using immersive virtual reality to improve choosing by advantages system for the selection of fall protection measures. In Proceedings of the ASCE International Conference on Computing in Civil Engineering 2019, Atlanta, GA, USA, 17–19 June 2019; pp. 146–153. [Google Scholar]
  55. Carvalho, J.; Alecrim, I.; Bragança, L.; Mateus, R. Integrating BIM-based LCA and building sustainability assessment. Sustainability 2020, 12, 7468. [Google Scholar] [CrossRef]
  56. Potrč Obrecht, T.; Röck, M.; Hoxha, E.; Passer, A. BIM and LCA integration: A systematic literature review. Sustainability 2020, 12, 5534. [Google Scholar] [CrossRef]
  57. Safari, K.; AzariJafari, H. Challenges and opportunities for integrating BIM and LCA: Methodological choices and framework development. Sustain. Cities Soc. 2021, 67, 102728. [Google Scholar] [CrossRef]
  58. Cabeza, L.F.; Rincón, L.; Vilariño, V.; Pérez, G.; Castell, A. Life cycle assessment (LCA) and life cycle energy analysis (LCEA) of buildings and the building sector: A review. Renew. Sustain. Energy Rev. 2014, 29, 394–416. [Google Scholar] [CrossRef]
  59. Vilches, A.; Garcia-Martinez, A.; Sanchez-Montanes, B. Life cycle assessment (LCA) of building refurbishment: A lite-rature review. Energy Build. 2017, 135, 286–301. [Google Scholar] [CrossRef]
  60. Ingrao, C.; Messineo, A.; Beltramo, R.; Yigitcanlar, T.; Ioppolo, G. How can life cycle thinking support sustainability of buildings? Investigating life cycle assessment applications for energy efficiency and environmental performance. J. Clean. Prod. 2018, 201, 556–569. [Google Scholar] [CrossRef]
  61. Säynäjoki, A.; Heinonen, J.; Junnila, S.; Horvath, A. Can life-cycle assessment produce reliable policy guidelines in the building sector? Environ. Res. Lett. 2017, 12, 013001. [Google Scholar] [CrossRef] [Green Version]
  62. United States Environment Protection Agency. Air Emissions Factors and Quantification. Blasting Caps, Demolition Charges, and Detonators. Available online: https://www3.epa.gov/ttnchie1/ap42/ch15/related/c15s09.html (accessed on 14 January 2020).
  63. Ecoinvent. Ecoinvent v3 Database. Available online: https://www.ecoinvent.org/ (accessed on 2 June 2021).
  64. Vázquez-Rowe, I.; Ziegler, K.; Laso, J.; Quispe, I.; Aldaco, R.; Kahhat, R. Production of cement in Peru: Understanding carbon-related environmental impacts and their policy implications. Resour. Conserv. Recycl. 2019, 142, 283–292. [Google Scholar] [CrossRef]
  65. Vázquez-Rowe, I.; Kahhat, R.; Sánchez, I. Perú LCA: Launching the Peruvian national life cycle database. Int. J. Life Cycle Assess. 2019, 24, 2089–2090. [Google Scholar] [CrossRef]
  66. Vázquez-Rowe, I.; Reyna, J.L.; García-Torres, S.; Kahhat, R. Is climate change-centrism an optimal policy making strategy to set national electricity mixes? Appl. Energy 2015, 159, 108–116. [Google Scholar] [CrossRef]
  67. Weidema, B.P.; Thrane, M.; Christensen, P.; Schmidt, J.; Løkke, S. Carbon footprint: A catalyst for life cycle assessment? J. Ind. Ecol. 2008, 12, 3–6. [Google Scholar] [CrossRef]
  68. Vázquez-Rowe, I.; Kahhat, R.; Larrea-Gallegos, G.; Ziegler-Rodriguez, K. Peru’s road to climate action: Are we on the right path? The role of life cycle methods to improve Peruvian national contributions. Sci. Total Environ. 2019, 659, 249–266. [Google Scholar] [CrossRef] [PubMed]
  69. Servicio Nacional de Meteorología e Hidrología—SENAMHI. Mapa de Clasificación Climática del Perú. Servicio Nacional de Meteorología e Hidrología—Senamhi. Available online: https://idesep.senamhi.gob.pe/geonetwork/srv/spa/catalog.search#/metadata/9f18b911-64af-4e6b-bbef-272bb20195e4 (accessed on 28 April 2021). (In Spanish).
  70. Huijbregts, M.A.J.; Steinmann, Z.; Elshout, P.M.F.; Stam, G.; Verones, F.; Vieira, M.; Zijp, M.; Hollander, A.; van Zelm, R. ReCiPe2016: A harmonised life cycle impact assessment method at midpoint and endpoint level. Int. J. Life Cycle Assess. 2017, 22, 138–147. [Google Scholar] [CrossRef]
  71. PRé Sustainability. SimaPro Software. Available online: https://simapro.com/global-partner-network/pre-consultants/ (accessed on 1 June 2021).
  72. Weidema, B.P. Multi-user test of the data quality matrix for product life cycle inventory data. Int. J. Life Cycle Assess. 1998, 3, 259–265. [Google Scholar] [CrossRef]
  73. Ciroth, A.; Muller, S.; Weidema, B.; Lesage, P. Empirically based uncertainty factors for the pedigree matrix in ecoinvent. Int. J. Life Cycle Assess. 2016, 21, 1338–1348. [Google Scholar] [CrossRef]
  74. Tollefson, J. US pledges to dramatically slash greenhouse emissions over next decade. Nat. Cell Biol. 2021, 592, 673. [Google Scholar] [CrossRef]
  75. Fantke, P.; Jolliet, O.; Apte, J.S.; Cohen, A.J.; Evans, J.S.; Hänninen, O.O.; Hurley, F.; Jantunen, M.J.; Jerrett, M.; Levy, J.I.; et al. Health effects of fine particulate matter in life cycle impact assessment: Conclusions from the Basel guidance workshop. Int. J. Life Cycle Assess 2015, 20, 276–288. [Google Scholar] [CrossRef]
  76. Jolliet, O.; Antón, A.; Boulay, A.-M.; Cherubini, F.; Fantke, P.; Levasseur, A.; McKone, T.E.; Michelsen, O.; Canals, L.M.I.; Motoshita, M.; et al. Global guidance on environmental life cycle impact assessment indicators: Impacts of climate change, fine particulate matter formation, water consumption and land use. Int. J. Life Cycle Assess. 2018, 23, 2189–2207. [Google Scholar] [CrossRef] [Green Version]
  77. Biberos-Bendezú, K.; Cárdenas-Mamani, U.; Kahhat, R.; Vázquez-Rowe, I. Introducing environmental decision-making criteria to foster green public procurement in Peru. Integr. Environ. Assess. Manag. 2021. [Google Scholar] [CrossRef]
  78. Cheng, W.; Appolloni, A.; D’Amato, A.; Zhu, Q. Green Public Procurement, missing concepts and future trends–A critical review. J. Clean. Prod. 2018, 176, 770–784. [Google Scholar] [CrossRef]
  79. Tarantini, M.; Loprieno, A.D.; Porta, P.L. A life cycle approach to Green Public Procurement of building materials and elements: A case study on windows. Energy 2011, 36, 2473–2482. [Google Scholar] [CrossRef]
  80. Ministerio del Ambiente—MINAM. Proyecto “Estimulación de la Oferta y Demanda de Productos Sostenibles a Través de la Compras Públicas Sostenibles y Ecoetiquetado”—Proyecto SPPEL en Perú. Directorio de Proyectos y Centros de Atención. 2017. Available online: http://proyectos.minam.gob.pe/proyectos/proyecto-estimulacion-de-la-oferta-y-demanda-de-productos-sostenibles-a-traves-de-la-compras-publicas-sostenibles-y-ecoetiquetado-proyecto-sppel-en-peru/ (accessed on 9 April 2020).
  81. Delmonico, D.; Jabbour, C.J.C.; Pereira, S.C.F.; de Sousa Jabbour, A.B.L.; Renwick, D.W.S.; Thomé, A.M.T. Unveiling barriers to sustainable public procurement in emerging economies: Evidence from a leading sustainable supply chain initiative in Latin America. Resour. Conserv. Recycl. 2018, 134, 70–79. [Google Scholar] [CrossRef] [Green Version]
  82. Rigby, A. Spurring Innovation-Led Growth in Latin America and the Caribbean through Public Procurement PPI and PCP in Developed Economies: United States; Discussion Papers, No. IDB-DP-488; InterAmerican Development Bank: Washington, DC, USA, 2016. [Google Scholar]
  83. Wang, X.; Liu, Y.; Ju, Y. Sustainable public procurement policies on promoting scientific and technological innovation in China: Comparisons with the US, the UK, Japan, Germany, France, and South Korea. Sustainability 2018, 10, 2134. [Google Scholar] [CrossRef] [Green Version]
  84. Suikkanen, J.; Nissinen, A. Product Environmental Footprint (PEF) Method—Use for Evaluating the Climate Impacts of Public Procurement; Reports of the Finnish Environment Institute 15en/2020; Finnish Environment Institute: Helsinki, Finland, 2020. [Google Scholar]
  85. European Commission. Official Journal of the European Union: Commission Recommendation of 9 April 2013 on the Use of Common Methods to Measure and Communicate the Life Cycle Environmental Performance of Products and Organisations (2013/179/EU, 9.4.2013); European Commission: Brussels, Belgium, 2013; Volume 124, pp. 1–210. [Google Scholar]
  86. European Commission. PEFCR Guidance Document—Guidance for the Development of Product Environmental Footprint Category Rules (PEFCRs), Version 6.3, December 2017. Available online: https://eplca.jrc.ec.europa.eu/permalink/PEFCR_guidance_v6.3–2.pdf (accessed on 1 June 2021).
  87. Zampori, L.; Pant, R. Suggestions for Updating the Product Environmental Footprint (PEF) Method. Available online: https://ec.europa.eu/jrc/en/publication/suggestions-updating-product-environmental-footprint-pef-method (accessed on 1 June 2020).
  88. Santa-Cruz, S.; De Córdova, G.F.; Rivera-Holguin, M.; Vilela, M.; Arana, V.; Palomino, J. Social sustainability dimensions in the seismic risk reduction of public schools: A case study of Lima, Peru. Sustain. Sci. Pract. Policy 2016, 12, 34–46. [Google Scholar] [CrossRef]
Figure 1. Methodological framework combining the CBA method and life cycle assessment (LCA) for decision-making. The dotted black line represents the entire methodological framework that derives from BIM modelling, whereas the continuous black line shows the methodological process modelled in the present study.
Sustainability 13 08139 g001
Figure 2. Graphical representation of the system boundaries considered in the life cycle assessment of school retrofitting techniques in the city of Lima. The dotted line represents the system boundaries. Green boxes show the operations needed to retrofit the educational institutions. MARM = reinforcement of columns and infill masonry walls with steel mesh; ACMAC = incorporation of steel bracings; IMACA = frame reinforcement and incorporation of reinforced concrete walls.
Sustainability 13 08139 g002
Figure 3. Comparative Monte Carlo (MC) simulation for the three school retrofit alternatives modelled. The percentage indicates the relative number of runs in which one alternative showed improved global warming potential (GWP) results as compared to another alternative. MARM = reinforcement of columns and infill masonry walls with steel mesh; ACMAC = incorporation of steel bracings; IMACA = frame reinforcement and incorporation of reinforced concrete walls.
Sustainability 13 08139 g003
Table 1. Summarized life cycle inventory (LCI) of school retrofitting techniques in the city of Lima per functional unit (i.e., demolition and construction intervention to retrofit a 780-PRE school).
UnitMARMACMACIMACA
Demolition stage
Machineryp8.99 × 10−34.64 × 10−31.80 × 10−2
Dieselkg543.8271.9543.8
ElectricityMWh13.3010.8816.92
PM2.5 (demolition)kg3.79 × 10−32.10 × 10−34.69 × 10−3
PM2.5 (loading and unloading)kg6.86 × 10−23.80 × 10−28.48 × 10−2
PM2.5 (transport–full load)kg1.84 × 10−11.84 × 10−11.84 × 10−1
PM2.5 (transport–full load)kg4.10 × 10−14.10 × 10−14.10 × 10−1
Retrofit stage
Concretem322.9022.8966.42
Brickskg11,464394.24043
Reinforced steelkg137534,4533870
Glasskg191.45.80105.5
Woodm36.400.948.19
Waterm3100.96.1212.09
Epoxy resinkg156.5299.8113.6
Dieselkg64.8359.33146.9
Lubricant oilkg1.070.942.83
MARM = reinforcement of columns and infill masonry walls with steel mesh; ACMAC = incorporation of steel bracings; IMACA = frame reinforcement and incorporation of reinforced concrete walls.
Table 2. List of factors considered in the choosing by advantages (CBA) method for the retrofit of educational buildings in the city of Lima.
FactorsCriteriaUnit
Economic/socialExecution costs—C1Lower costs are betterPEN
Execution time—C2Lower time for executing operations is betterdays
TransparencyLevel of modulation—C3Higher modulation is better%
Level of standardization—C4Higher standardization is better%
Level of industrialization—C5Higher industrialization is better%
EnvironmentGlobal Warming Potential—C6Lower greenhouse gas (GHG) emissions is bettert CO2eq
Fine particulate Matter Formation—C7Lower PM2.5 emissions is betterkg PM2.5eq
Damage to Human Health—C8Lower damage to human health is betterDALYs
DALYs = disability-adjusted life years; PEN = Peruvian sol.
Table 3. Relationship between the stakeholder profiles and the working groups in the decision-making process.
Working GroupsProfileInterestsMost Valued Factors
1EnvironmentalPriority is given to human health and wellbeingEnvironmental factors
2EngineeringTechnical aspects, such as efficiency and productivity, are prioritizedExecution costs
Execution time
Transparency
3EnvironmentalPriority is given to human health and wellbeingEnvironmental factors
4HolisticHierarchist perspective, which aims to present an equilibrium among factorsExecution costs
Execution time
Transparency
Environmental factors
Table 4. Scenarios modelled for the sensitivity analysis of the CBA model applied to school retrofitting in Peru. Green boxes represent environmental factors that were included in each scenario modelled, whereas red boxes represent factors that were excluded from the computation.
ScenariosEnvironmental Metrics Included
Baseline scenarioGWPFPMFHH
Scenario 1GWPFPMFHH
Scenario 2GWPFPMFHH
Scenario 3GWPFPMFHH
GWP = global warming potential; HH = damage to human health; FPMF = fine particulate matter formation.
Table 5. Environmental impact results from the selected impact categories for the three retrofit techniques of educational buildings in the city of Lima. Results reported per functional unit (FU).
GWP(t CO2eq)FPMF(kg PM2.5eq)HH(DALYs)
Demolition7.157.833.7 × 10−2
Retrofit17.1820.171.27 × 10−2
MARM24.3328.015.01 × 10−2
Demolition4.725.448.58 × 10−3
Retrofit96.47162.013.16 × 10−1
ACMAC101.2167.53.25 × 10−1
Demolition8.749.031.55 × 10−2
Retrofit38.8945.498.70 × 10−2
IMACA47.6354.511.03 × 10−1
MARM = reinforcement of columns and infill masonry walls with steel mesh; ACMAC = incorporation of steel bracings; IMACA = frame reinforcement and incorporation of reinforced concrete walls; GWP = global warming potential; FPMF = fine particulate matter potential; HH = damage to human health; DALYs = disability-adjusted life years.
Table 6. Relative weights (%) given to economic, transparency, and environmental factors in each working group. Groups highlighted in light green represent those with an environmental profile.
Group 1Group 2Group 3Group 4
Economic factor
C217%43%19%29%
Transparency factors
C313%13%10%13%
C413%13%9%15%
C515%13%11%13%
Subtotal41%39%30%41%
Environmental factors
C611%7%16%10%
C79%7%15%8%
C822%4%21%11%
Subtotal42%18%52%29%
C1 = execution costs; C2 = execution time; C3 = level of modulation; C4 = level of standardization; C5 = level of industrialization; C6 = global warming potential—GWP; C7 = fine particulate matter formation—FPMF; C8 = damage to human health—HH.
Table 7. Aggregated results of the importance of advantages (IoAs) per working group and retrofit technique. Dark green boxes represent the preferred decision in each workshop group, whereas groups highlighted in light green represent those with an environmental profile.
MARMIMACAACMAC
Group 1275180270
Group 211044190
Group 3320185225
Group 4188105241
MARM = reinforcement of columns and infill masonry walls with steel mesh; ACMAC = incorporation of steel bracings; IMACA = frame reinforcement and incorporation of reinforced concrete walls.
Table 8. Aggregated results of the importance of advantages (IoAs) per working group and retrofit technique. Dark green boxes represent the preferred decision in each workshop group, whereas groups highlighted in light green represent those with an environmental profile. The blue shading of the retrofitting techniques represents lower environmental impact per FU with darker tonalities.
Group 1Group 2Group 3Group 4
MARMIMACAACMACMARMIMACAACMACMARMIMACAACMACMARMIMACAACMAC
IoA based on the evaluation of workshop participants
Baseline scenario27518027011044190320185225188105241
Scenario 118512527080261901758022512565241
Scenario 2225155270953619024513022515286241
Scenario 3235150270953419025013522516184241
IoA based on aggregating factors into categories
Baseline scenario27518027011044190320185225188105241
Scenario 118512527080261901758022512565241
Scenario 2225155270953619024513022515286241
Scenario 3235140270953419025013522516184241
IoA based on applying a linearity principle of the advantages
Baseline scenario27417727010850190317203225188102241
Scenario 1184116270782919017210422512560241
Scenario 2224147270934119024215822515280241
Scenario 3234147270933819025916227015996270
IoAs = importance of advantages; MARM = reinforcement of columns and infill masonry walls with steel mesh; ACMAC = incorporation of steel bracings; IMACA = frame reinforcement and incorporation of reinforced concrete walls.
Publisher’s Note: MDPI stays neutral with regard to jurisdictional claims in published maps and institutional affiliations.

