2. Background, Study Site, and Environmental Setting
While requirements for social distancing, the need for fresh air, and the proximity of health care facilities have become more pressing due to the pandemic, the recognition of the role of green infrastructure in the everyday exercise and psychological well-being of urban residents pre-dates the pandemic [
13]. Green streets that can be travelled safely on foot or by bicycle, allows, indeed encourages, sustainable personal mobility, with positive effects due to the presence of vegetation, shade, and cleaner air, stimulating better conditions for physical activity and safe socializing. In addition, contributing to public health, interconnecting isolated open spaces to form green networks improves habitat quality and contributes to biodiversity [
14]. In this context, the protection of these public spaces from the consequences of extreme weather phenomena, increased by climate change, becomes even more important. In this sense, nature-based solutions (NBS) constitute effective and multi-benefit tools [
15,
16] since they can mitigate stormwater floods, heat waves, and the urban heat island effects, improve air and water quality, reduce energy consumption of adjacent buildings, and increase the economic valuation of adjacent properties [
17,
18,
19,
20]. The current crisis may therefore offer an opportunity to strengthen policies for the implementation of sustainable green streets [
21].
2.1. A Case Study in Southern Italy
For these current reasons, as well as addressing the broader issue of urban regeneration, implementing cycling and walking routes forms an essential, critical component of urban management, planning, and design. In particular, immediate opportunities lie in peri-urban areas, such as this case study site, where the constraints imposed by the built-out city are fewer, social problems are greater, and the potential positive effects of intervention are broader. Adaptation to this “new normal” starts with street redesign, which can accommodate both essential urban functions and the tranquil use of public places by all social categories. Building from the study area’s morphologic and climatic data, an urban design approach emerges that respects the local social and cultural place identity and facilitates new ways of using public spaces and road networks.
The previous PRIN 2015 research project “Adaptive Design and Technological Innovations for the Resilient Regeneration of Urban Districts under Climate Change” [
22,
23] and specifically “Green street framework for marginal Mediterranean urban areas,” produced by the research unit of the University of Campania Luigi Vanvitelli [
23], develops project criteria and an integrated georeferenced GIS database to guide local administrators and planners in implementing NBS in the Neapolitan urban periphery to produce direct environmental benefits. The evaluative database analyses an integrated set of urban landscape characteristics (topography, urban morphology, hydrology, etc.), assesses suitable green street technologies, and quantifies potential environmental effects.
The study presented here utilizes the very detailed and comprehensive database developed in the “Green street framework for marginal Mediterranean urban areas,” to specifically evaluate extending bicycle and pedestrian pathways to revise local mobility patterns while integrating green infrastructure to reduce or eliminate flood risks, urban heat island effects, and CO
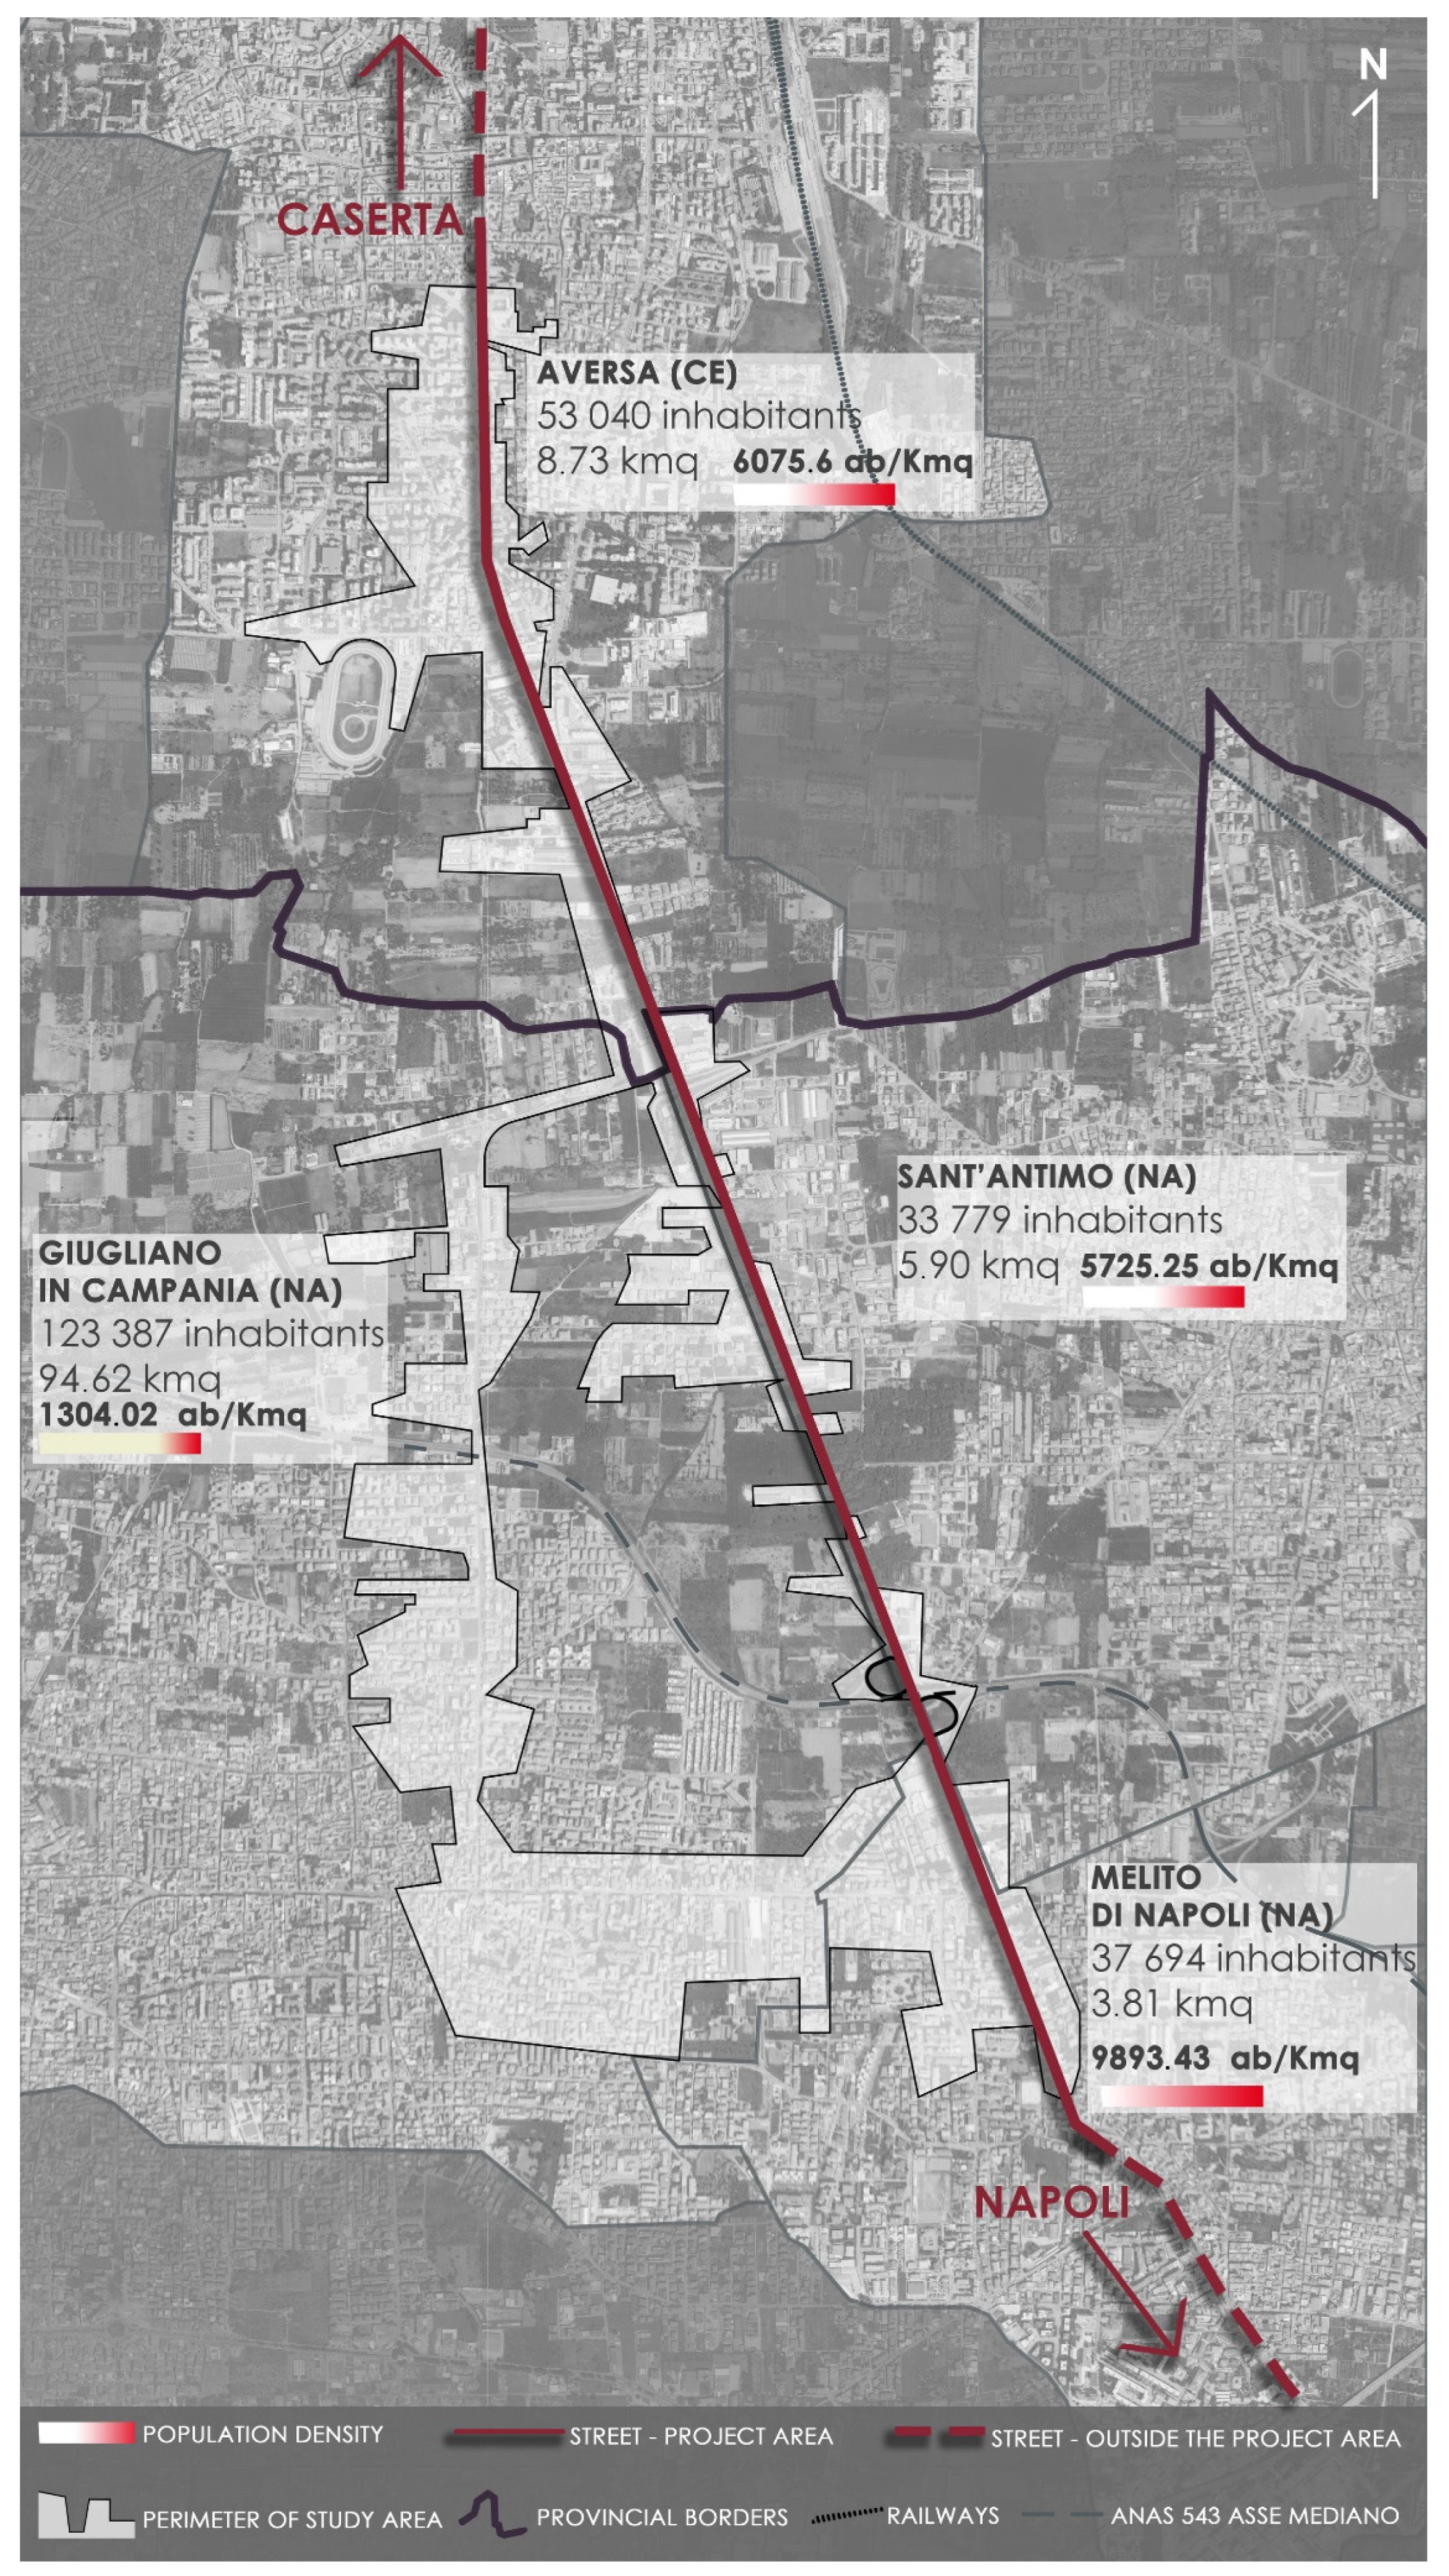
2 concentrations. The research case study comprises a stretch of the Italian State Road (Strada Statale) 7 bis connecting the two largest provinces of Campania, from Naples to Caserta, crossing the municipalities of Melito di Napoli, Giugliano in Campania, Sant’Antimo, and Aversa (
Figure 1). The State Road 7 bis traverses very different urban conditions, from historic centres to unregulated peri-urban expansion (
Figure 2), providing an assessment of a wide variety of conditions and complexities to test the feasibility and effects of road redesign to combine alternative mobilities and environmental amelioration. The University of Campania Luigi Vanvitelli resides in Aversa; the study addresses very apparent, if not urgent, local urban environment issues.
The study collects a wide array of data to record, synthesize, and analyse. Field studies provide photographic surveys, measurements of roads and road cross-sections, dimensions and materials of relevant structures, adjacent lands use, and existing vegetation. (
Figure 3 and
Figure 4) [
23]. The data analysis includes urban aspect ratio (UAR) values, sunshade maps, the urban centrality index, and demographic data. From limited data available from local governments, satellite maps (LIDAR, COPERNICUS), and extensive field-based surveys, the study develops a GIS platform that georeferenced the climatic, environmental, and landscape conditions for analysis. Software such as “i-Tree Street” and “ENVI-met,” quantifies and evaluates the benefits of alternative nature-based solutions (NBS) for different road sections. The evaluations utilise key environmental indicators, including the permeability index, rainfall data, and the quantity and quality of tall trees to determine the hydraulic, energy, and economic benefits of the NBS. Other parameters included the length of safe cycle routes, Reduced Buildings Impact (RIE) and Biotope Area Factor (BAF) values, Predicted Mean Vote (PMV), useful in quantifying aggregate CO
2 reduction and mitigation of average radiant and surface temperatures [
23].
The study considers both hydro-geomorphologic aspects (slope, the rectangular pattern of the constructed urban hydrographic network versus a natural dendritic one) and meteorological-climatic aspects (rainfall, peak runoff, flash floods, drought, soil aridity) to understand the potential adaption strategies and define the useful parameters for green infrastructure design. Beyond the hydro-geomorphologic and hydrographic aspects, the study considers urban form and settlement morphology, particularly the characteristics of the road cross sections within the study area. Finally, the study quantifies energy savings, air quality, stormwater management capacity, and predicted growth in property values. The value comparison of these quantifications form modelling experiments of climatic extremes based on the records of environmental stations, part of the existing local government data set.
A combined consideration of road cross-sections, urban morphology (i.e., dense historic town centres, dispersed unregulated structures, agricultural land, etc.), public parcels, and the location within urbanized hydrologic subbasins forms the study’s units of analysis and the redesign of the State Road 7 bis (
Figure 5). The data analysis recorded, assessed, and quantified existing environmental conditions of each unit (such as slope, existing vegetation, drainage and flood patterns, urban heat island, land use context, etc.) and assessed and quantified the effects of the proposed design interventions in order to demonstrate environmental amelioration (such as mitigation of flooding, improvement of urban heat island effects, etc.). The geo-referenced database compiled the base data and analysis of both the existing conditions and the proposed projects.
The research project focused on restructuring road sections to maximize extensions of bicycle and pedestrian paths and locating vegetated green stormwater infrastructure (GSI) to both increase safe cycling and mitigate floods. The project proposal transforms the automobile-oriented urban arterial, connecting the municipalities into an alternative soft mobility system and providing a network of bicycle and pedestrian paths connected to a system of nature-based green infrastructure solutions (
Figure 5).
The project objective also includes the improvement of local climatic conditions, the reconnection of disrupted and degraded hydrologic flows, and the redesign of safe and usable public spaces accessible through pedestrian and bicycle connections. The study contributes to a wider discourse on urban regeneration in the peri-urban landscape of metropolitan regions, particularly Mediterranean regions, offering an updatable, scalable, and replicable digital database tool collecting comprehensive survey and analysis data useful in current and future sustainable urban regeneration projects.
2.2. Climatic and Morphological Conditions in the Case Study
The study area (
Figure 1 and
Figure 2) is in the central sector of the Campania Plain, a 6.5 km length of roadway between the towns of Melito di Napoli (SE), Giugliano, Sant’Antimo and Aversa (NW), 40°55′08” N latitude–14°13′59″ E longitude and 40°58′24″ N latitude–14°12′28″ E. The S-N average elevation ranges from 89 to 39 m a.s.l., and the average gradient is 2.2%.
The area falls to the left bank in the southern zone of the Volturno River alluvial plain, featuring flat topography with reworked Quaternary fluvial–marine and pyroclastic deposits of the Phlegraean Fields, a still-active volcanic area in unrest phase to the south. In particular, the surface soils consist of a sequence of stratified ashes with interspersed greyish pumice and an ocher paleosol at the base. These deposits are remodeled, have thicknesses from 4 to over 8 m, and an age >8000 years. About 3 km west of the study area outcrops of Neapolitan Yellow Tuff occur, from lithified to incoherent and about 15,000 years old [
24]. The incoherent pyroclastic deposits lie on a stone substrate formed by Campanian Ignimbrite with an age of about 40,000 years [
25,
26], outcropping in the northwest (Frignano), and southwest (Parete). This tuff has a thickness of more than 10–16 m at 4–6 m of depth below the ground level.
The river drainage network of the study area is characterized by a dendritic pattern in the peri-urban zones, almost entirely within incised channels. This pattern is the morphological expression of erosion processes on soft rocks with a low gradient, affected by a volcano-tectonic control only to the south. In the densely urbanized areas due to both the poor natural soil and the high percentage of impervious surfaces, the drainage network follows the more or less rectangular street pattern, which at the city margin gradually connects to the dendritic one. Notably, rectangular drainage patterns generally develop on a fractured substratum, and are controlled by tectonics, while in these cities the pattern is structured by manmade interventions of the last millennium.
The geomorphological aspects and the stratigraphic sequence influence both the water infiltration in the subsoil and permeability. The latter varies from low to medium with the underground drainage towards W-NW, partly coinciding with the surface runoff.
The area is characterized by a Mediterranean climate [
27,
28,
29], subtype Csa. The elaboration of 24,910 daily data registered by the thermo-pluviometric station of Grazzanise (41°05′33.80” N latitude, 14°06′19.70″ E longitude, 14 m a.s.l.) in the period 2000–2016 indicate an average annual temperature of 16.3 °C, average rainfall 850.2 mm/yr (
Figure 6), relative humidity 62.3%, and global solar radiation 177.6 W/m
2 day.
Applying the Köppen’s climatic formula (1936), with less than 4 months with an average T > 20 °C (4 months, ~23.4 °C), 4 to 12 months with an average T between 10 and 20 °C (5 months, 15.1 °C) and less than 4 months with average T < 10 °C (3 months, ~9 °C), the climate of the study area results as
temperate. Briefly, the absolute maximum T ~39 °C was recorded in August 2007, the minimum T = −2.7 °C in January 2002 and December 2010. The minimum rainfall of ~19 mm is in July, the maximum of ~129 mm in November. The minimum relative humidity is ~57% in August, the maximum ~69% in December. The maximum global solar radiation is ~299 W/m
2 day in July and the minimum ~62 W/m
2 day in December. The calculation of Ivanow’s continentality index [
30] results in K = 164%, classifying it as a continental climate due to the distance from the Tyrrhenian Sea (~15 km) and proximity to the Apennine chain (~20 km). In particular, the average daytime temperature excursion in the period 2000–2016 oscillates between 8.7 (2004) and 10.5 °C (2012), with an increasing trend towards 2016 and an average value of almost 10 °C. De Martonne’s (1941) aridity index calculation results in A = 32.33, classifying the study area as humid. In the densely urbanized zones of the study area, the phenomenon of the urban heat island also occurs, with an increase in temperatures of up to 3–4 °C compared to the surrounding rural areas [
31,
32].
Considering meteoclimatic indices, and since the natural soil surfaces are negligible compared to the extent of the manmade impervious surfaces, intense rainfall flows through an artificial and ephemeral drainage network. This network, featured by a hierarchical order i = 4 according to Strahler (1957), shows a subrectangular pattern, controlled by the orientation and confluence of the roads at right or acute angles and by a low gradient. Therefore, the runoff from the lateral areas gradually converges towards the mainstem, represented by the road axis of the SS 7 bis, along which they flow out towards the northwest.
Analysis of hypso-pluviometric maps and literature reveals the landscape’s geomorphology and the natural and artificial drainage network related to the sub-basin of the hydrographic system of the Volturno River. This information provides an overview of the distribution of historic average rainfall related to the study area [
33,
34,
35] and completed with data recorded from the thermo-pluviometric station of Grazzanise. The cartographic analysis allows reconstruction of the pattern of the hydrographic network, which in the developed areas shows a subrectangular pattern due to man-made structures and dense urbanization, while on the natural soil of peripheral areas it is mainly dendritic [
36]. The stormwater flows at the drainage basin margins through sub-rectilinear runoffs dissected by constructed channels which during heavy rains flow into a central channel following the State Road 7 bis. The meteoclimatic analysis of the study area [
37] demonstrates an increase in the minimum average temperatures between February and August and a decrease between September and December, an increase in the annual rainfall with arid conditions in the months of June and October, and a significantly increased frequency of storm events lasting 1–3 h in the autumn [
38,
39].
The National Plan for Adaptation to Climate Change by the Italian Ministry of the Environment and the Protection of the Territory and the Sea [
40] forecasts for the study area an increase of 14 days of extreme heat in summer, an 8% increase in rainfall in winter but with intense episodes, and a 25% decrease in rainfall in summer. This confirms the documented, and already prevalent, roadway flooding caused by geomorphology and settlement patterns, as well as risk from heat waves with prolonged phases of aridity. These trends [
41] describe unsustainable scenarios for this urbanized territory, with non-negligible effects on habitability, health, and safety.
3. Methods and Results
The study analyzed road sections along the busy arterial route State Road 7 bis between the provinces of Naples and Caserta and along the network of roads connected to it by traffic and stormwater flows (
Figure 7). The geomorphological analysis demonstrates the influence of impervious surfaces and the constructed hydrologic networks of the territory (roads, channels, sub-surface systems) moderating stormwater infiltration capacity and increasing runoff. The gradual rise in summer temperatures, expected to increase, and the parallel increase in winter rainfall, characterized by a stronger intensity and longer duration of events, represent a further factor for the redesign of existing roadways, not all of which have capacity to address these new conditions without generating serious inconvenience, if not hazards, for vehicular, bicycle, and pedestrian traffic.
To prioritize road sections suitable for a bicycle network, the study first analyzes existing conditions regarding road geometry (including intersections), urban aspect ratios, landscape morphology (slope, existing vegetation), and climatic conditions including existing shade patterns (
Figure 8). The study then develops a classification, or environmental reading, of typical road sections, incorporating critical criteria regarding height and location of adjacent buildings, available width in the road right-of-way, adjacency to public parcels, and land use patterns and densities (from sparsely developed unregulated development to dense urban centers). These classifications then determine the potential design strategies for each typical section. The GIS database records geo-references and synthesizes this information, constituting a useful and updatable basis for inevitably incremental urban regeneration projects. The database also provides data for modeling optimized re-designs that addresses both urban mobility and environmental amelioration.
For each road section, a data sheet summarizes the existing environmental characteristics (
Figure 9) and optimized redesign strategies. The study accepted that some values (height and width of street cross-sections, slope, urban aspect ratios) remain the same in the proposed redesign. The redesigns modify other critical values, such as the PMV, extent of shade, the mean radiant temperature, and CO
2 concentrations. The summary analysis of pros and cons outlined on each Section data sheet suggest a starting point for future interventions, considering favorable and unfavorable data relating to urban form, climate, water management, and the safety of pedestrians and cyclists.
In Italy, national laws, such as the Codice della Strada (Art. 182. Comma 9), regulate the use of bicycle and pedestrian paths as well as policies issued by local administrations. Presumably due to the complex conditions of urban paths in Italian cities, the regulations are fairly vague, which tends to make them somewhat ineffective. This case study presumes that pedestrian and bicyclist comfort and physical safety constitute the primary dictations of the redesign standards.
The results indicate that in the peri-urban areas along the State Road 7 bis, the width of the roads averages more than 26 m (85 feet), allowing sufficient space to integrate green infrastructure. Therefore, soft mobility redesign can take place while providing comfortable and healthy environmental conditions through a system of nature-based solutions for stormwater management, urban heat island mitigation, and the improvement of air quality. Furthermore, the modeling results indicate strategies to provide environmental comfort (shading, PMV, ventilation) necessary for the optimal use of cycle-pedestrian routes in all months of the year [
23], in some instances significantly increasing comfort levels through shading and reductions in urban heat island effects.
Along the State Road 7 bis outside of the historic centre of Aversa, the existing buildings minimally shade the sidewalks but not enough to shelter in the hottest periods of the day, while the values of the PMV and the average radiant temperature indicate a far worse condition than in the more densely urbanized areas. The road Section 6 on Via Oasi (also typical of the area immediately outside of Aversa) currently contains parking, street hardware (lighting, etc.), and tree rows intermittent on both sides (see Section 6 in
Figure 7 and
Figure 9). The street redesign provides for a two-way bike path extension on one side of the road, and green infrastructure, rows of
Tilia Cordata, along both sides the roadway. The modeling confirms that in addition to absorbing all the rainwater runoff, pedestrians and cyclists are protected from the sun and isolated from vehicular traffic, making the path safe, while, nonetheless, leaving vehicle parking areas.
Table 1 provides the values of the CO
2, PMV, Potential Temperatures, Surface Temperatures, Mean Radiant Temperatures reductions pre-project and post-project for road sections 1–6 (
Figure 9) based on ENVI-met modeling on pilot area projects, while the section data sheets in
Figure 9 enumerate average values.
In the stretch of State Road 7 bis extending between Sant’Antimo and Giugliano, the building pattern becomes sparser and edifices, when present, do not exceed three stories and thus do not provide any sun protection. Section 2 (
Figure 7 and
Figure 9) shows its typical configuration, the largest road width of the study area. This redesign provides substantial continuity with adjacent stretches of proposed pathways and green infrastructure. Stormwater calculations verify a more than adequate stormwater management capacity both for current and future climate change scenarios. The size of the road allows a split bicycle-pedestrian path on both sides of the roadway, ensuring maximum safety without compromising the vehicular flow and parking. The integration of green infrastructure on both sides of the road doubles the presence of vegetation, which in addition to separating soft and hard mobility paths, provides year-round shading and protection from sudden rains, making it safe to use in every month of the year. Urbanistically, the stately rows of tall trees form the
trait d’union for the whole project.
In the stretch farthest from the dense urban centers, the State Road 7 bis passes through some remarkable sites, which represent an opportunity to connect the project to places of historic and cultural relevance. The design connects the soft mobility network to public destinations and spaces protected from traffic and environmental hazards. Vegetation helps to distinguish these areas from the rest of the path with the presence of tall Quercus Ilex trees.
The scenario changes drastically in sections of dense urban fabric along State Road 7 bis in the town centres of Giugliano, Melito, and Aversa. In these dense contexts, the minimum size of the road sections and the U.A.R. ratio do not leave adequate space for the insertion of the bicycle and pedestrian paths and extensive green infrastructure. The sun protection map does show that these urban areas provide sidewalk shade and shelter almost year-round, but the small size of the road cross-sections does not allow the integration of the pathways with any nature-based solution for stormwater management, or adaptation adequate for current or future environmental conditions. In these cases, the viable mitigation strategy is to identify micro-areas to insert singular drainage features integrated into the existing urban fabric.
As described in Section 1 (
Figure 9), the Arch of the Annunziata, in the historic center of Aversa (CE), exemplifies these conditions. The redesign of the roadway allows a single two-lane bicycle way, connecting the city’s bicycle network with those of Giugliano, Melito and Sant’Antimo, ensuring a continuity of travel. Existing pedestrian areas with historic paving cannot change but they do limit vehicular speeds, which would be slowed further by reproportioning the road cross-section in favor of the bicycle path, providing additional safety to both pedestrians and bicyclists. In these dense, built-up zones, stormwater management consists only of individual trees inserted within the dense urban fabric, enabling rainwater harvesting into tree wells.
At the opposite end of the study area, in the center of Giugliano (NA), with similar U.A.R., shading and PMV conditions to Aversa, a different strategy proves possible. As delineated in Sections 3 and 4 (
Figure 8), the redesign creates “Urban Green Oases” to collect and control stormwater, enlarging green areas for neighborhoods currently with minimal access to open space (
Figure 10). Because of the dense building pattern and narrow streets, a constant shade covers these stretches of Via Colonne in Giugliano. The shade protects pedestrians and bicyclists even in the hottest days of the year and the average PMV values remain at comfortable levels. The redesign inserts a bike path, integrating it with green infrastructure at some points, improving air quality and stormwater management.
Without substantially subtracting space from the roadway, urban green oases use permeable paving and the presence of tall trees, planters, and swales. They also create “slow” green spaces where the pedestrian and bicycle paths merge and find a place to rest and meet. This allows the use of public space in a safe and protected way, even in the densest urban centers. To complete the stretch of Via Colonne, at the intersection with Via Oasi, the reorganization of the churchyard of the Church of San Nicola Section 4 (
Figure 9) exemplifies the conjoining of green infrastructure and a renewed social space. While the redesign does not lower the PMV to a consistently desirable level compared to existing conditions, it does afford green forecourt to a locally significant place that is regularly used as a social space.
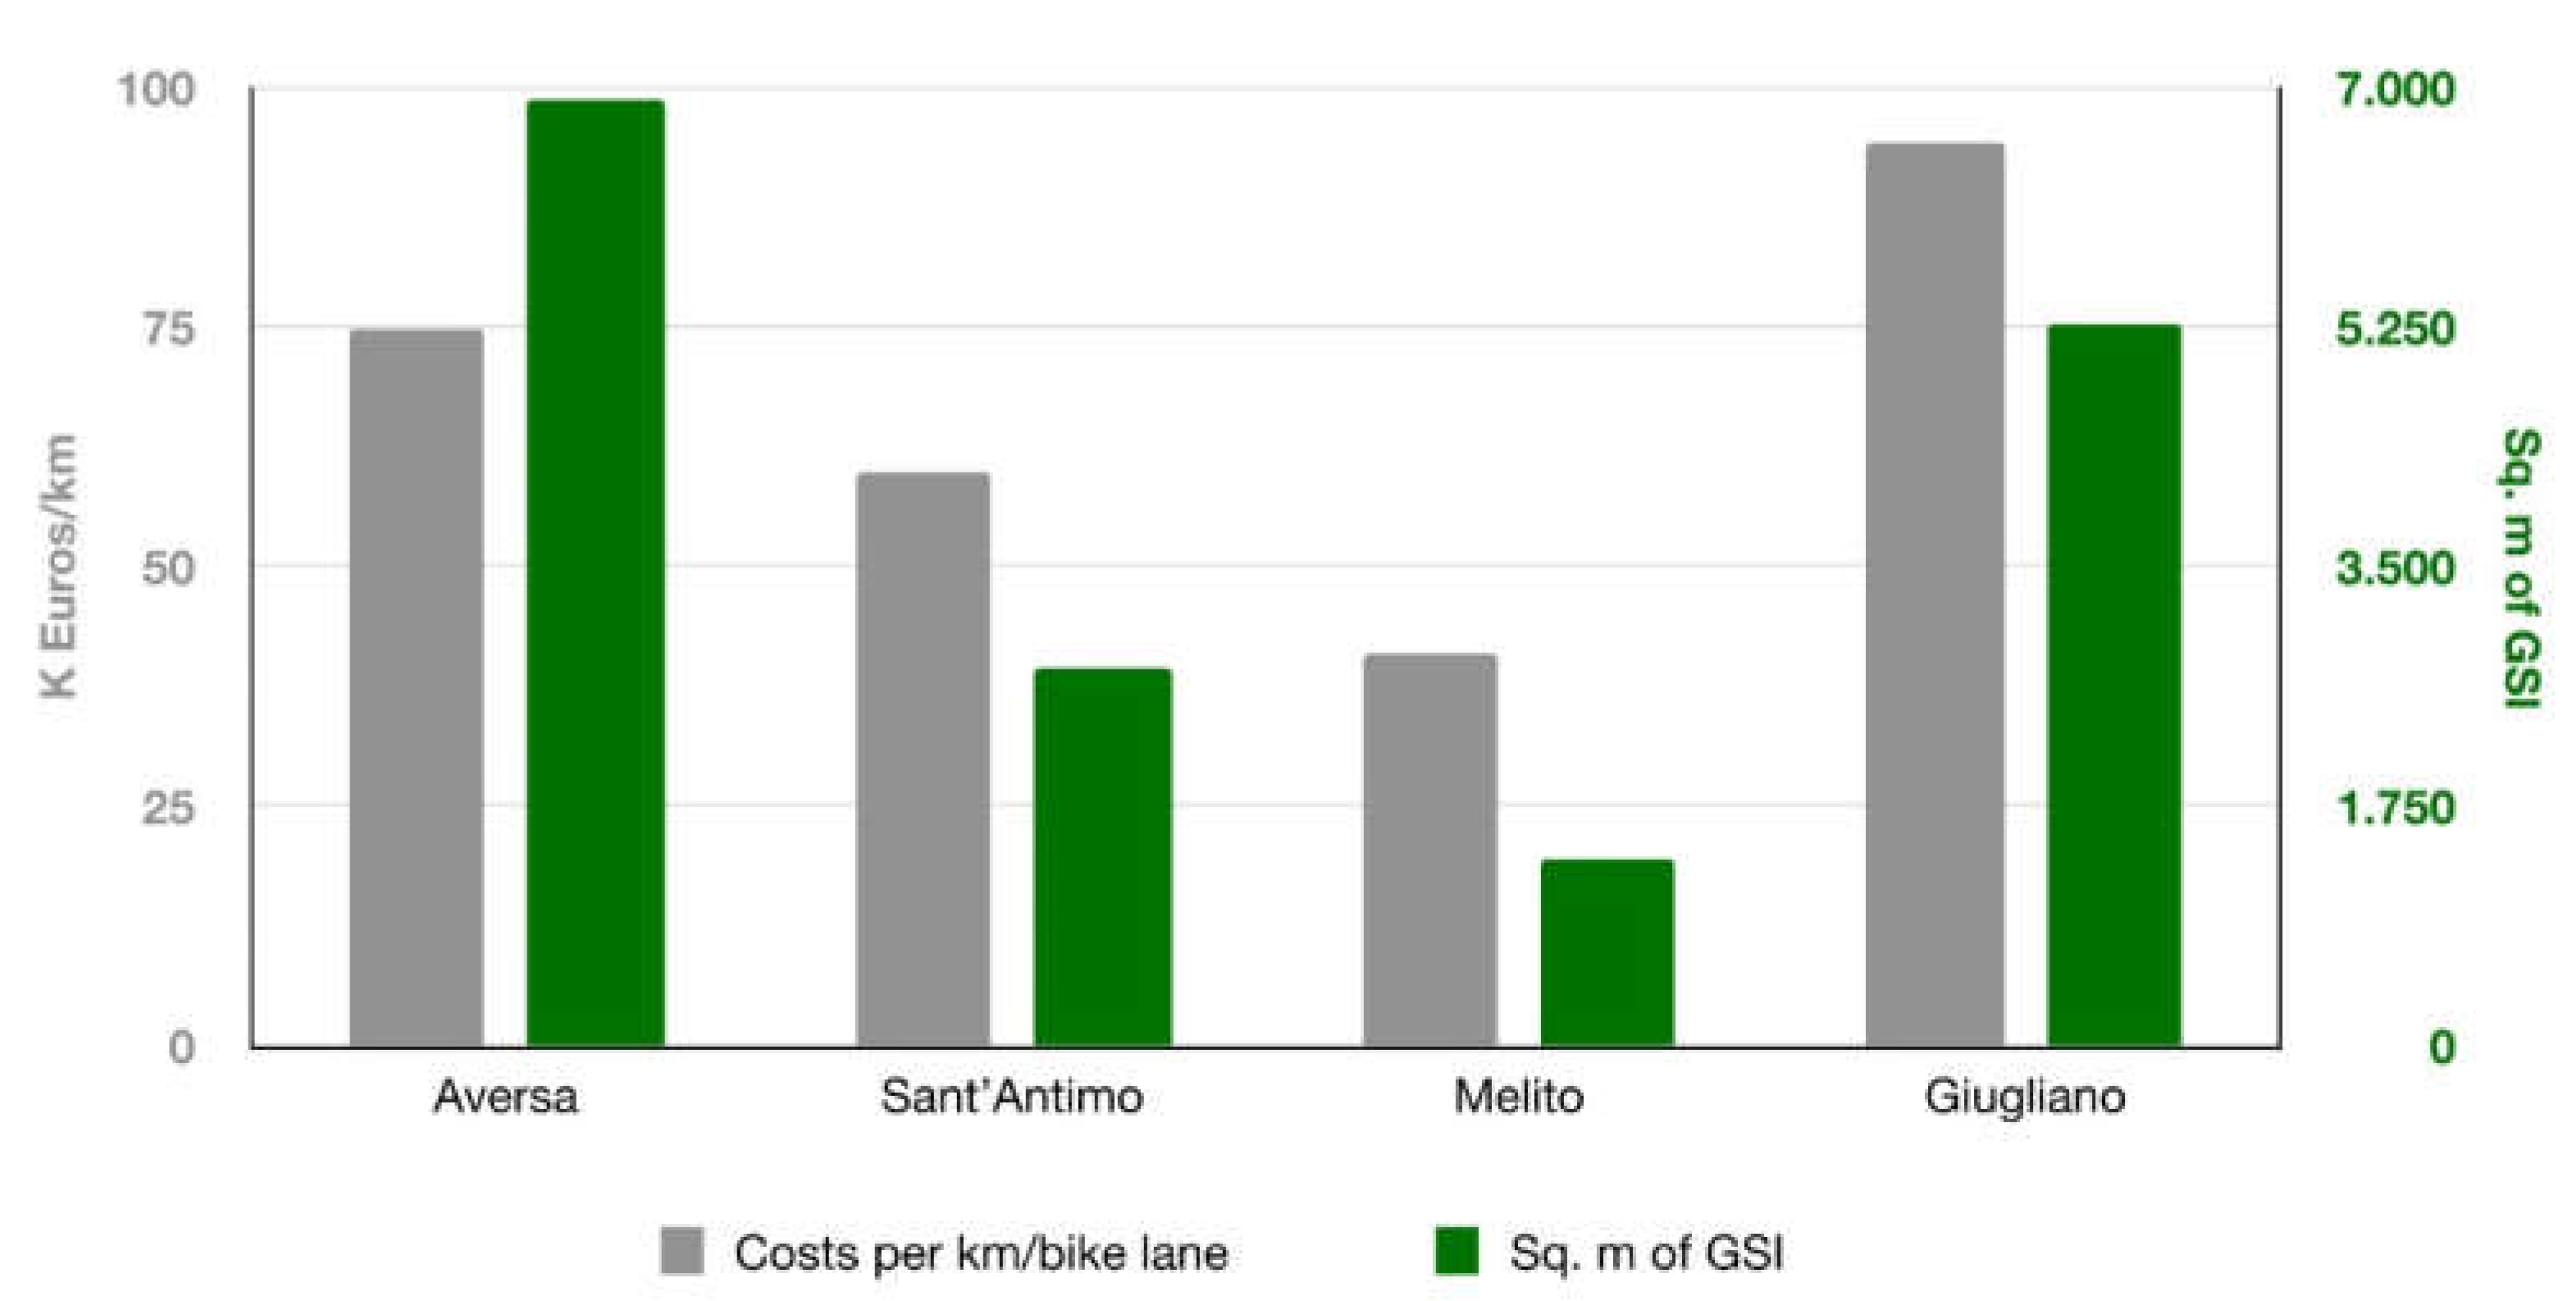
The study also assesses the costs for each road section’s pathways and green infrastructure providing overall values across the study area towns of Aversa, Giugliano, Melito, and S. Antimo, calculating costs per km/bike lane, as shown in the
Figure 11. These values can be compared to the standard costs for the bike lane alone, showing a very low percentage of increase against a very high level of environmental benefits. This includes green spaces for collection, bio-retention, purification, and shading (planter, bumpout, tree trench, swale, tree pit) [
18], and a network of special places in the study area providing multiple co-benefits. The GIS database registers types, sizes, volumes, materials, costs, and vegetation of the devices to facilitate planning and management.
The value assessments demonstrate the cost-effectiveness of simultaneously implementing GSI improvements and soft mobility improvements, especially when compared to the savings over typical engineered hard infrastructure. Added to these savings are savings in averted flood damage plus the value gained in ecosystem and social services.
By documenting analyses and key projects, the GIS database provides strategic information for design, implementation, and management supporting phased implementation. The GIS database can reconfigure the size or location of the devices, incorporating additional data from the sub-basin system and climate or social change forecasts, validating the redesign’s effectiveness in changing conditions. The value and cost assessments in the GIS database accommodates incremental implementation as resources become available. Pragmatically, the GIS database facilitates project prioritization for each road section considering vulnerability indices as well as inconveniences and interruptions caused by construction, while considering the greatest number of benefits in relation to traffic flows, environmental needs, and public health. The database can also incorporate the future addition of environmental sensors deployed across the landscape to monitor bikes and pedestrians, gauge stormwater devices, or any number of other useful data points.
The State Road 7 bis urban regeneration project proposes a holistic research study approach considering an integrated set of parameters. Survey information defines the width and extent of the roadway available for redesign; the relationship of the road to the height of the adjacent buildings allows the analysis of the microclimatic conditions critical for comfort and health. Slope analysis establishes the ease of the cycling route and favorable conditions for green infrastructure in relation to stormwater flows. The evaluation of the road sections’ PMVs inform the appropriate strategies for the creation of comfortable bicycle and pedestrian paths for mobility and recreational activities. The data analysis of the road sections identifies criteria that can be easily applied to other urban contexts. The methods developed to analyze the specific road sections offer a tool to evaluate the integration of green infrastructure and soft mobility in other urban settings. In addition, a GIS platform records and integrates the data, analysis and results, both for now, and in the future.
4. Discussion of Results and Concluding Remarks
Catalyzed by the extraordinary conditions of the pandemic, this study models the prospects for a new integrated pedestrian, bicycle, and vehicular corridor between Melito and Aversa in the urban periphery of Naples. The study encompasses a range of environmental conditions to free soft mobility corridors from vehicular traffic and define spaces to walk, bike, and socialize. The project considers very different types of road sections and urban conditions while consistently ensuring safe and healthy conditions for pedestrians and bicyclists while providing considerable, measurable environmental benefits through green infrastructure. As the study’s redesign proposals demonstrate, safe paths for pedestrians and bicyclists and green infrastructure prove possible at the unregrettable expense of the vehicular roadway, often oversized compared to automobile traffic flows.
Three categories of information ground the criteria of the potential redesign of urban corridors integrating soft mobility networks and green infrastructure. First, the essential physical landscape parameters: existing road widths, cross-section, shade patterns, vegetation, slope, and urban morphology. Second, the meteo-climatic parameters: temperature, PMV, CO2 concentrations, existing hydrologic patterns, and expected climate change. Third, the sociocultural parameters: land use patterns, public parcels, locally significant places, and historic structures. The GIS platform accumulates this data, enabling the analysis of existing conditions, the optimization of redesign strategies, and the quantification of environmental benefits and the concomitant social benefits. These quantifications include the optimal PMV, the reduction of urban heat island effects, the infiltration and management of stormwater, producing water quality benefits and reducing floods, an increase in vegetation cover, and adequately sized and sited pedestrian and bicycle pathways. These can then be summarized as easy to understand pro and con statements. The criteria for redesign success are safe, comfortable, and contiguous pedestrian and bicycle pathways, the management of urban run-off, and environmental amelioration.
The study presents a process to evaluate and design the regeneration of peripheral urban corridors as sustainable, integrated soft mobility and green infrastructure networks as a central multi-benefit urban asset. It presents a classification system of existing conditions, redesigns, costs, and associated benefits, specifically for a geographic area in a Mediterranean climate. In relation to the global response to the pandemic crisis, the work proposes interventions for permanent reconfiguration with a view to the sustainable transformation of private mobility and urban stormwater management.
The case study offers a useful process to local administrations, confronting the challenge of transformational change in the urban environment. The adaptability of the GIS platform, designed as a responsive tool, over time and as conditions change, meets the need of local administrators to assess priority improvement projects, support incremental implementation, and advocate for interventions that address climate change and public health issues [
23]. During the last few months Aversa, one of the four towns in the study area, initiated a “Biciplan” (Bikeplan). This research will directly inform local authorities regarding existing physical conditions, standards for safety and health, potential redesigns and their benefits, and maximizing cost effectiveness. Should the planning extend beyond the study area, the GIS database can be easily updated to include additional districts and zones.
Looking to the future, the GIS database linked to sensor devices recording the conditions of a soft mobility and green streets network can also make a major contribution to the tracking systems needed in a pandemic and in other foreseeable environmental emergencies. The possibility of creating agile systems for the provision urban data addresses the need to provide skills and services to local administrations to manage strategic visions, to implement systems to improve urban quality of life, and to inform managers and citizens. The quantity, integration, and complexity of this study involves an interdisciplinary framework: urban design, planning, engineering, environmental science, and data science. Accordingly, the on-the-ground realization of integrated soft mobility systems and green stormwater infrastructure implies the integrated action of departments of environment, urban planning, public works, transport and mobility, public health, social and cultural policies, and cultural heritage, as demonstrated in successfully implemented projects.
This interdisciplinary integration suggests one of the important limits of the study. Collecting teams of researchers with disparate investigative approaches to build a complex GIS-based system of cohesive, verifiable analyses is a resource-intensive operation, even for the case study’s limited study area. At this point, applying an equally detailed approach to wide swaths of the urbanized environment seems unfeasible as part of the ordinary course of building cities. This becomes even more of a concern when considering the usual capacities of local administrators whose time demands, available resources, and professional skills can be limited. We consequently underscore the important role that university research centres can supply local authorities in providing data, methods, and training, as indeed this project between the University of Campania Luigi Vanvitelli, and its local community, exemplifies.
The international research literature establishes how environmental design research conducted with a holistic approach, supported by comparable data and parameters, serves to provide replicable models [
42]. This case study applies to many situations in Southern Italy characterised by similar conditions: scattered conurbations connected by spontaneous territorial expansions without regulation; longitudinal settlement routes along regional arterials connecting older town centres; issues of intermittent flooding, urban heat island effects, and acute climate change; and lack of soft mobility networks. If the need for a technical, social, and performative rethinking of the various types of arterial roads has been evident for a long time [
43], and was certainly desirable before 2020, it is now essential in the light of the pandemic emergency to counteract social isolation, the intense use of public transport, the sedentary habits of the population, environmental pollution, and health threats due to climatic stress. Whether the impact of COVID-19 on public space will be as profound as many other aspects of daily life remains to be seen [
44]. It may take years to fully realise the changes induced by the pandemic in terms of urban design and sustainability as we are not yet able to determine the extent to which the pandemic will represent a dividing line in the planning and design of public areas for community well-being. In any case, the need to drive urban design and planning towards integrated sustainable scenarios remains urgent.


 ,
, 


