Abstract
Lentil is a versatile and profitable pulse crop with high nutritional food and feed values. The objectives of the study were to determine suitable locations for high yield and quality in terms of production and/or breeding, and to identify promising genotypes. For this reason, five lentil genotypes were evaluated in a multi-location network consisting of ten diverse sites for two consecutive growing seasons, for seed yield (SY), other agronomic traits, crude protein (CP), cooking time (CT) and crude protein yield (CPY). A significant diversification and specialization of the locations was identified with regards to SY, CP, CT and CPY. Different locations showed optimal values for each trait. Locations E4 and E3, followed by E10, were “ideal” for SY; locations E1, E3 and E7 were ideal for high CP; and the “ideal” locations for CT were E3 and E5, followed by E2. Therefore, the scope of the cultivation determined the optimum locations for lentil cultivation. The GGE-biplot analysis revealed different discriminating abilities and representativeness among the locations for the identification of the most productive and stable genotypes. Location E3 (Orestiada, Region of Thrace) was recognized as being optimal for lentil breeding, as it was the “ideal” or close to “ideal” for the selection of superior genotypes for SY, CP, CT and CPY. Adaptable genotypes (cv. Dimitra, Samos) showed a high SY along with excellent values for CP, CT and CPY, and are suggested either for cultivation in many regions or to be exploited in breeding programs.
1. Introduction
Lentil (Lens culinaris Medik.; Fabaceae) is among the major cool season annual grain legume crops, and is best adapted to semi-arid regions of the Mediterranean Basin and the Indian subcontinent. It is among the oldest crops, together with cereals like barley and wheat [1], and is probably the oldest domesticated grain legume because carbonized remains of lentil were found in the Franchthi cave in Greece, dated 11,000 BC, and from Tell Mureybit in Syria, dated 8500–7500 BC [2,3]. Lentil is the fourth major cool season grain legume in the world after dry pea (Pisum sativum), chickpea (Cicer arietinum) and broad bean (Vicia faba) produced for human consumption, and it constitutes an excellent source of complex carbohydrates, protein, minerals, vitamins and dietary fibers for humans, as well as being highly valuable as feed and fodder for livestock [4,5,6,7,8]. As well as its prominent role in the food and feed industry, lentil also grown for the diversification and intensification of cropping systems [9]. It exhibits ecological advantages as a rotational crop in cereal-based cropping systems by acting as break crop for the better control of pests, weeds and diseases, and the better management of herbicide residue, and at the same time plays an important role in maintaining soil fertility due to its capacity to fix atmospheric nitrogen (N2) [10]. For instance, the range in quantity of N2 fixed by Lens esculents Medik. through bacteria (Rhizobium) reaches 40–68 kg ha−1 year−1 [11,12].
In 2019, lentil was grown on more than 4.8 M ha across 52 countries, accounting for an annual production of 5.7 Mt [13] whereas, between 2010 and 2015, it accounted for 6% of the total dry pulse production, with an average yield of 926 kg ha−1 [14]. However, despite its agronomic and nutritional value, until recently, lentil seed production remained at low levels and attracted much less attention from plant breeders than cereal grains [15,16].
For lentil genotypes to become commercially successful, high production levels and yield stability are required under variable farming conditions. However, lentil production is controlled by several biotic and abiotic factors such as drought, salinity, high temperatures and mineral deficiency, and is trialed in many regions of the world under constant pressure from biotic and abiotic stresses, in the context of climate change and the food security crisis [17]. In order to achieve this goal, multi-location trials are conducted annually with the purpose of identifying superior genotypes for the target locations. As lentil can be grown in a wide range of environments, the yield of the tested genotypes across different locations and over the years can be different because of its high genotype (G) × environment (E) interactions. In plant breeding programs, the structure of the G × E interactions is very important in order to achieve a high rate of adoption of new improved cultivars [18]. It is often difficult to determine the pattern of genotypic responses across environments. Moreover, lentil, which has a relatively a narrow genetic base, may exhibit a low buffering capacity against environmental changes, which challenges this response [19].
The G plus G × E (GGE) biplot model provides a powerful solution to this problem as it graphically displays the genotype (G) plus the interaction G × E (Environment) of multi-environment data in a way that facilitates visual evaluation and mega-environment identification; that is, a group of locations that consistently share the same best genotype or genotypes. In addition, the GGE biplot technique is useful in selecting superior genotypes and test environments for a given mega-environment [20,21].
The development of new lentil cultivars with desirable seed quality attributes is possible because primary traits such as total starch, protein, 1000-seed weight, seed color, and other quality characteristics are significantly controlled by genetic factors, as well as by local pedoclimatic conditions [22]. It is also widely accepted that G affects seed lentil chemical properties considerably [23,24,25]. The seed protein of lentil is an important nutritional trait that has particular meaning for the food and feed industry. Protein quantity and protein yield are complex quantitative traits that depend on a number of factors and are highly influenced by genetic and environmental fluctuations [26]. The average crude protein in lentil seeds is about 26% on a dry weight basis [27], although several studies have reported seed crude protein in cultivated lentil ranging from 10.5–36.4% dry weight depending on the number of tested lentil genotypes, environments and methods of analysis [28,29].
The seed cooking quality is another important factor for lentil’s utilization as a food crop because the seeds are largely consumed in their cooked form. This key culinary attribute of lentils is associated with the ease and the low cost of food preparation [5]. The cooking time, which is defined as the time needed from the start of boiling until the seeds become soft, constitutes one of the most important quality characteristics, and is believed to be a heritable trait, although the environmental and storage conditions are also known to be influencing factors [30,31]. In addition, high air temperatures and soil moisture are important in increasing the cooking time of lentils [32]. Furthermore, different cooking times were found when the lentil was cultivated in different locations, and this was mainly attributed to different levels of soil fertility [33,34,35]. The duration of the cooking time is of central importance in breeding programs, because a longer time to cook of a new variety may be penalized in the marketplace owing to the lower demand for such a product. In contrast, a quick-cooking variety may achieve premiums because of cooking convenience and reduced energy cost requirements [36].
Lentil is an important pulse crop in Greece, traditionally consumed as a soup with whole seeds, and it shows an increasing pace of production; however, its production levels do not meet the domestic consumption requirements, which are largely covered by imports. The dietary value of lentil is currently gaining recognition, while a remarkable shift of consumers to this crop is attributed to its high nutritional and culinary value. Lentil, as with many other pulses, can be regarded as key component of lowering the environment footprint of food production and consumption, and as an important ingredient of a sustainable diet. The former is mainly attributed to lentil’s ability to fix atmospheric N, both for its own use and for the use of subsequent crops, thus replacing the expensive synthetic N fertilizers and thereby reducing greenhouse gas emissions. The latter emanates of the fact that lentil seeds are broadly consumed as sources of dietary proteins by over one billion people and constitute an excellent source of plant-based proteins for human food and animal feed. Nowadays, high lentil seed yields, stability and seed quality traits are attainable by the choice of the most adapted cultivar in a given pedoclimatic environment. In Greece, the majority of the cultivated varieties are commercial cultivars; however, there is a small number of lentil landraces with interesting agronomic, physiological and quality traits. The edaphic and climatic conditions play a key role for the achievement of elevated production and enhanced seed quality, although their interaction with the genotype has not yet been thoroughly explored. The objectives of this research-work were to identify: (i) the optimum locations in terms of high production and quality by investigating G × E interactions through a multi-location experimental network, (ii) suitable locations for lentil breeding for yield and quality traits, and (iii) the most suitable genotypes among those registered in the Greek National Varietal Catalogue to be cultivated by lentil growers, and for possible exploitation by future breeding programs targeting high yield and/or seed quality traits.
2. Materials and Methods
2.1. Genetic Material
Five lentil genotypes (four commercial cultivars and one improved population) were evaluated for two consecutive growing seasons (2018/2019 and 2019/2020, hereafter mentioned as 2019 and 2020, respectively) at ten (10) locations from various pedo-climatic zones in Greece where lentil is widely cultivated.
The commercial cultivars were ‘Samos’ (G1), ‘Dimitra’ (G2), ‘Thessalia’ (G3) and ‘Elpida’ (G4), and the local population was the ‘03-24L’ (G5). All of the cultivars were developed by the Institute of Industrial and Forage Crops (IIFC) in Larissa, Greece, while the population (G5) originated from ICARDA and was improved by IIFC. G5 was improved with the method described by Tokaltidis and Vlachostergios [37]. The genotypes were selected based on their popularity among growers, their high yield potential and their differentiation in flowering and maturity earliness. Their basic characteristics with respect to cotyledon color, seed size, and earliness can be found in Table 1.

Table 1.
Seed traits (cotyledon color and size) and earliness of the five lentil genotypes evaluated in the study.
2.2. Test Locations, Pedoclimatic and Growing Conditions
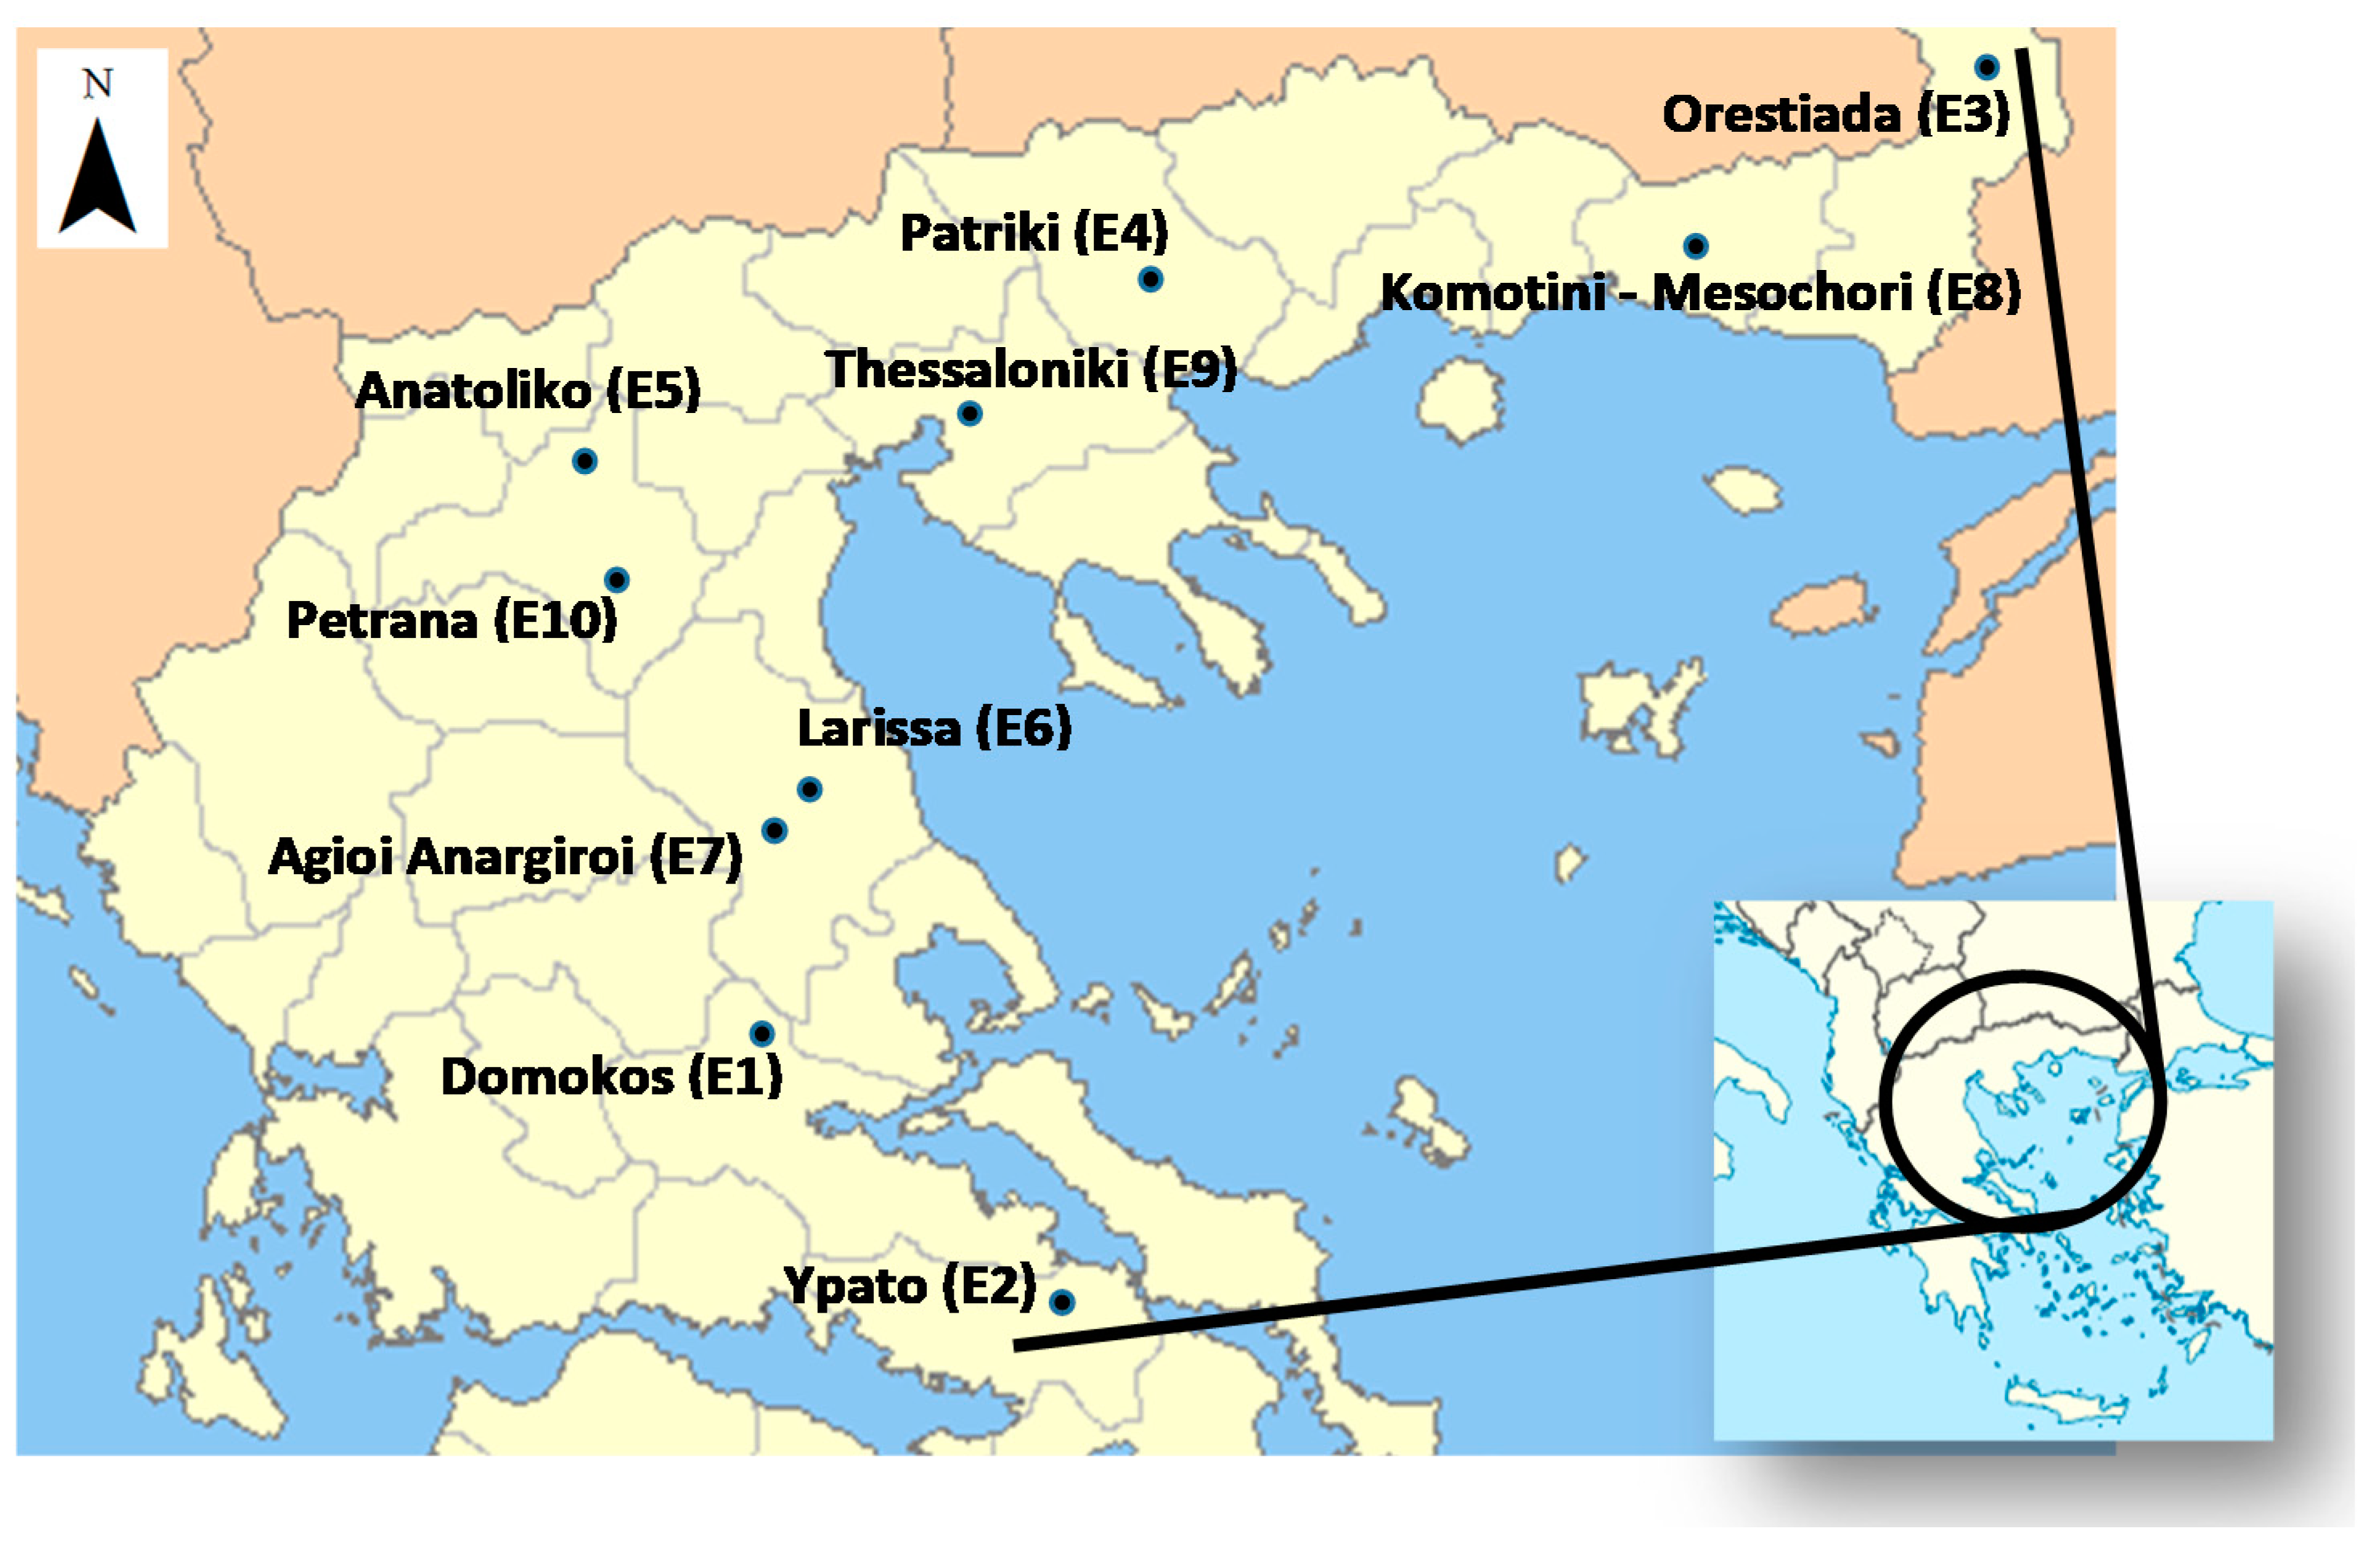
The 10 test locations (listed with codes from E1–E10; Figure 1) included 5 Regions across Greece, as follows: south, the region of Sterea (St); central, the region of Central Greece (Ce); north, the regions of Central Macedonia (CM) and West Macedonia (WM); and northeast, the Region of Thrace (Th).
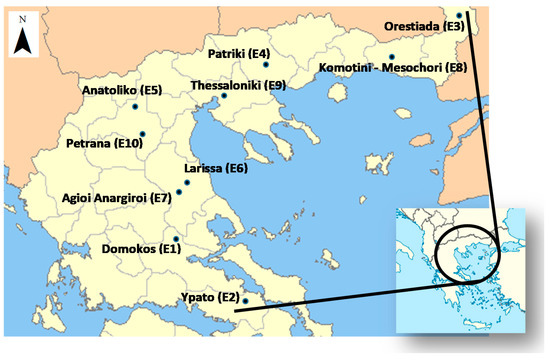
Figure 1.
Simplified map showing the multi-location lentil field experiments in Greece.
Their geographical co-ordinates are given in Table 2. All of the locations had altitudes lower than 150 m above sea level, except of locations E1, E5 and E10, with elevations of 500 m, 624 m and 476 m respectively.
Table 2.
Geographic position, location and edaphoclimatic description of the 10 locations for the evaluation of the lentil genotypes across Central and Northern Greece over 2019 and 2020. The soil parameters refer to a 0–30 cm depth.
The climate in Greece is typically Mediterranean, characterized as semiarid by mild and rainy winters, relatively hot and dry summers and prolonged sunshine periods for most of the year. However, due to its specific geographical position in the Mediterranean and its diverse topographical relief, Greece is characterized by various climatic zones. The study locations included, basically, three types of climates according to the Köppen–Geiger classification [38,39]. BSk (arid, steppe, cold) in E1, E8 and E9; Csa (temperate, dry summer, hot summer) in E2 and E3; a combination of BSk/Csa in E6 and E7; and Cfa (temperate, without dry season, hot summer) in E4, E5 and E10 (Table 2).
In the 2019 growing season (November to July), the precipitation ranged from 367.2 mm (E3) to 676.3 mm (E2), whereas the 2020 growing season was wetter, with precipitation ranging from 402.5 mm (E5) to 731.9 mm (E2). Similarly, the precipitation between April and May (the early reproductive till pod filling growth stages) was lower in 2019, ranging from 68.6 mm (E4) to 144.7 mm (E5) in comparison to wetter the 2020 growing season, which ranged from 99.0 mm (E6) to 186.4 mm (E1). Interestingly, among the 10 test locations, the northern locations had the lowest season (November to July) precipitation (i.e., at E3, 367.2 mm in 2019, and at E5, 402.5 mm in 2020, respectively), whereas the season precipitation was higher in Ypato-Thiva (St) (E2) in both years (676.3 mm in 2019 and 731.9 mm in 2020), which was the southernmost location (Table 2). The season (November to July) mean temperature was relatively higher in 2020 compared to 2019. The lowest temperatures (10.1 °C and 11.1 °C) were recorded in E5, and the highest (14.1 °C and 15.1 °C) in E2 in the growing seasons 2019 and 2020, respectively.
Under the influence of soil genesis factors (parent material, time, climate, organisms, and topography), soils in the broader tested area have been classified in the orders of Fluvisols, Cambisols, Vertisols, Luvisols and Regosols [40,41]. Briefly, Fluvisols are mainly young azonal soils in alluvial deposits (floodplain), lacustrine (lake) and marine deposits. Cambisols are moderately developed soils with weak horizon differentiation, and they generally make good agricultural land and are used intensively. Vertisols are productive soils if properly managed, but become very hard in the dry season and sticky in the wet season. Luvisols, commonly found in colluvial deposits of limestone weathering, are fertile soils suitable for a wide range of agricultural uses. Finally, Regosols are young mineral soils with little profile development.
The monitoring of the top soil (0–30 cm) physicochemical parameters included the soil texture [42], pH(1:1) [43], soil electrical conductivity (ΕC, 25 °C) [44], percentage soil organic matter (SOM) [45], calcium carbonate equivalent (%, CaCO3) [46] and available phosphorous (POlsen) [47] (Table 2). Most of the soils had a clayey soil texture, a slightly alkaline soil pH (7.1–8.0) and low EC (<1.00 mS cm−1). The SOM content was mostly low (<1.5%) (except of E10, which was medium in SOM content), and the soils were either deficient (<10.0 mg P kg−1 soil) or moderately sufficient (>10 και <20 mg kg−1 soil) in POlsen. The other soil properties included the total soil nitrogen (TSN), which was found to be either low (0.13%) or extremely low (0.06%), whereas in most locations the soils were sufficient in exchangeable potassium (K+) (data not shown). Furthermore, in most locations, the cation exchange capacity (CEC) was high (>25 cmol+ kg−1 soil), and exchangeable cations were found in the following decreasing order: Ca++ > Mg++ > K+ > Na+ (data not shown).
In all of the trials, the genotypes were arranged in plots following a randomized complete block design (RCBD) with four replications. The plots consisted of seven (7) plant rows of 4m length each, with a distance of 0.25 m between the rows. The seeding rate was 80–120 kg ha−1 and the sowing was continuous in the furrows, with the uniform distribution of the seed. The sowing was performed during the last week of November 2018 and November 2019 in all of the locations, with the exception of location E5, where the sowing date was at the last week of February due to the very low temperatures that prevail during the winter period.
The trials at the 10 locations were accounted as rain-fed environments. In the two growing seasons (2019 and 2020) in each location, the trials were initiated on the same position of the field or in a nearby position of the same field. A balanced basal fertilization with 160 kg ha−1 (0N-46P2O5-0K2O) was incorporated pre-sowing, and the phytosanitary practices such as weed removal were performed by hand; diseases and pest control were followed according to the local recommendations.
2.3. Yield and Agronomic Measurements
The agronomic traits that were recorded from the three inner plant rows in each plot incuded the seed yield (SY), plant height after flowering (PH), number of pods per plant (PP) and 1000-seed weight (1000 SW). The description of the growth stages (phenological development of 50% of the plants in each plot) was conducted using the extended BBCH scale [48]. The PH and PP were determined as the average of ten (10) randomly selected plants per plot. PH was recorded after the flowering was completed (BBCH growth stages 69–71), while the PP was determined at physiological maturity (BBCH stage 89). In order to assess the SY, the plots were harvested by hand and threshed using a laboratory thresher (Wintersteiger LD350) when the plants of each genotype reached their physiological maturity. The SY was calculated on a plot basis (3 m2 per plot) and converted to t ha−1 after adjusting to 13% seed moisture content.
2.4. Protein and Cooking Time
The cooking time of each lentil sample was estimated according to the tactile method [49], with some modifications. Briefly, 5 g lentil seeds were transferred in beakers (100 mL capacity) covered with aluminum foil containing 50 mL of boiling distilled water (ratio 1:10). The beakers were then placed on a hotplate, and after approximately 20 min of cooking, the softness of the cooked seeds was checked every 30 seconds. The cooking was considered complete when the seeds were soft enough to make uniform transparent mass (with no opaque core in the seeds) when placed between two glass slides and pressed against each other with no lateral movement. The optimum cooking time in minutes was determined as an average of triplicate determinations.
For the assessment of the seed crude protein concentration (% CP) and seed crude protein yield (CPY) at physiological maturity, samples consisting of the 3 inner plant rows of the plots were cut, bagged and dried to a constant weight in a dryer room. These samples were threshed whilst the seed was weighed for yield and monitored for moisture content. The seed crude protein concentration (% CP) was determined on uniformly ground samples obtained from all plots for each genotype using the Kjeldahl method, and expressed as the % CP = total N × 6.25. The seed crude protein yield (CPY) was the product of the SY and % CP content. The data presented for the % CP and CPY are expressed on a 0% moisture basis.
2.5. Statistical Analysis
The sources of variation and the appropriate F-ratios were estimated through analysis of variance (ANOVA) for balanced combined randomized complete block experimental designs (RCBD) over the years (Y) and locations (L), considering genotypes (G) and L as fixed treatment effects (variables of interest), and Y as random effects [50]. In order to estimate the contribution of each source of variation to the variability of each trait studied, the ANOVA treatment sum of squares (SSTRMT = SSG + SSL + SSY + SSG×L + SSY×G + SSL×Y + SSG×L×Y), including G, L, Y, and their respective two- and three-way interactions, was partitioned into its components (SSG, SSL, SSY, SSL×Y, SSG×Y, SSG×L, SSY×L×G) as the percentage of the sum of squares of the SSTRMT.
The Shapiro–Wilk test for normality showed that the variables were normally distributed, whereas the ANOVA’s assumptions for the equality of the error variances and residual normality were met by Levene’s test and the normal quantile–quantile (QQ) plot method, respectively [51]. The trial means were compared using Fishers’ least significant difference test (LSD) at p ≤ 0.05, whereas Pearson phenotypic correlation coefficients (r) between the agronomic traits, yield and quality were calculated in order to identify the most prominent correlations. The statistical analyses were conducted using the statistical software JMP 11.0.0 (SAS Institute, 2013) [52] and IBM SPSS package v. 23 (IBM Corp., 2015) [53].
A genotype (G) plus genotype × environment (GGE) biplot model was used: (i) To generate graphs showing the polygon view of the pattern (i.e., which genotype had the highest yield in which location, or which genotype had the highest value in which trait). The combinations of G × Y were equated to G × L in order to reveal cross-over interactions across the two years of experimentation. (ii) For the ranking of the genotypes against the “ideal” (the ideal is the virtual highest yielding and stable genotype defined by the center of concentric circles on the biplot graph).(iii) On the same biplots, test environments were ranked against the “ideal”, which was the virtual environment with the highest discriminating ability and representativeness for each trait [21]. The GGE biplot analysis was performed by the software package GGE Biplots in R version 1.0-8 [54].
3. Results
3.1. Seed yield, Yield Components and Plant Height
The genotype (G), location (L), and the two-way (Y × L, G × Y, G × L) and three-way interaction (Y × L × G) were highly significant (p < 0.01) for SY, PP, and 1000 SW. Less consistent were the results for PH: although the year (Y) effect was significant only for PH, this trait was further affected by the L and G, and the two way (Y × L and G × L) interactions (Table 3).
Table 3.
Analysis of variance (ANOVA), sum of squares (SS) and partitioning of the treatment SS (SSTRMT) of the five lentil genotypes tested across the ten locations for two growing seasons (2019 and 2020).
For SY, PP and PH, L contributed to most of the variation—54.3%, 65.4% and 60.7%, respectively—whereas Y accounted for only 0.0–2.0% of SSTRMT. The G × L contribution to the variation was also much higher in comparison to G × Y. The SSG×L/SSG×Y ratio was 4.6-fold higher for SY, and for this reason the GGE biplot with the polygon view based on the G × L interaction was used to study the genotypic adaptation across the two years. Among the agronomic traits, the 1000 SW was highly genetically controlled, given that the G effect accounted for the 82.2% of SSTRMT. Over the Y and G, E8 and E3, followed by E7, were the most productive locations, with a mean SY of 2.32 t ha−1, 2.27 t ha−1 and 1.96 t ha−1, respectively.
Accordingly, of the yield components, location E8 had the highest PP (77.6 pods plant−1), whereas location E3 exhibited the highest 1000 SW (48.5 g). The tallest plants over Y and G were recorded in location E2, with PH = 39.5 cm (Table 4). The growing season of 2019 was more productive in SY by 9.3% in comparison to 2020, whereas there was small differentiation for the rest of the agronomic traits. Over Y and L, G1 followed by G2 were the best performing genotypes in SY (1.73 t ha−1 and 1.65 t ha−1, respectively, Table 4). G1 and G2 had the highest PP (59.0 and 57.5, respectively), whereas G4 had the highest 1000 SW (59.9 gr). G1 and G3 were the tallest genotypes, with PHs of 35.8 cm and 35.1 cm, respectively.
Table 4.
Comparison of the means for the seed yield (SY) and other agronomic traits of the lentil genotypes (across locations) and of the locations (across genotypes) for two growing seasons (2019, 2020).
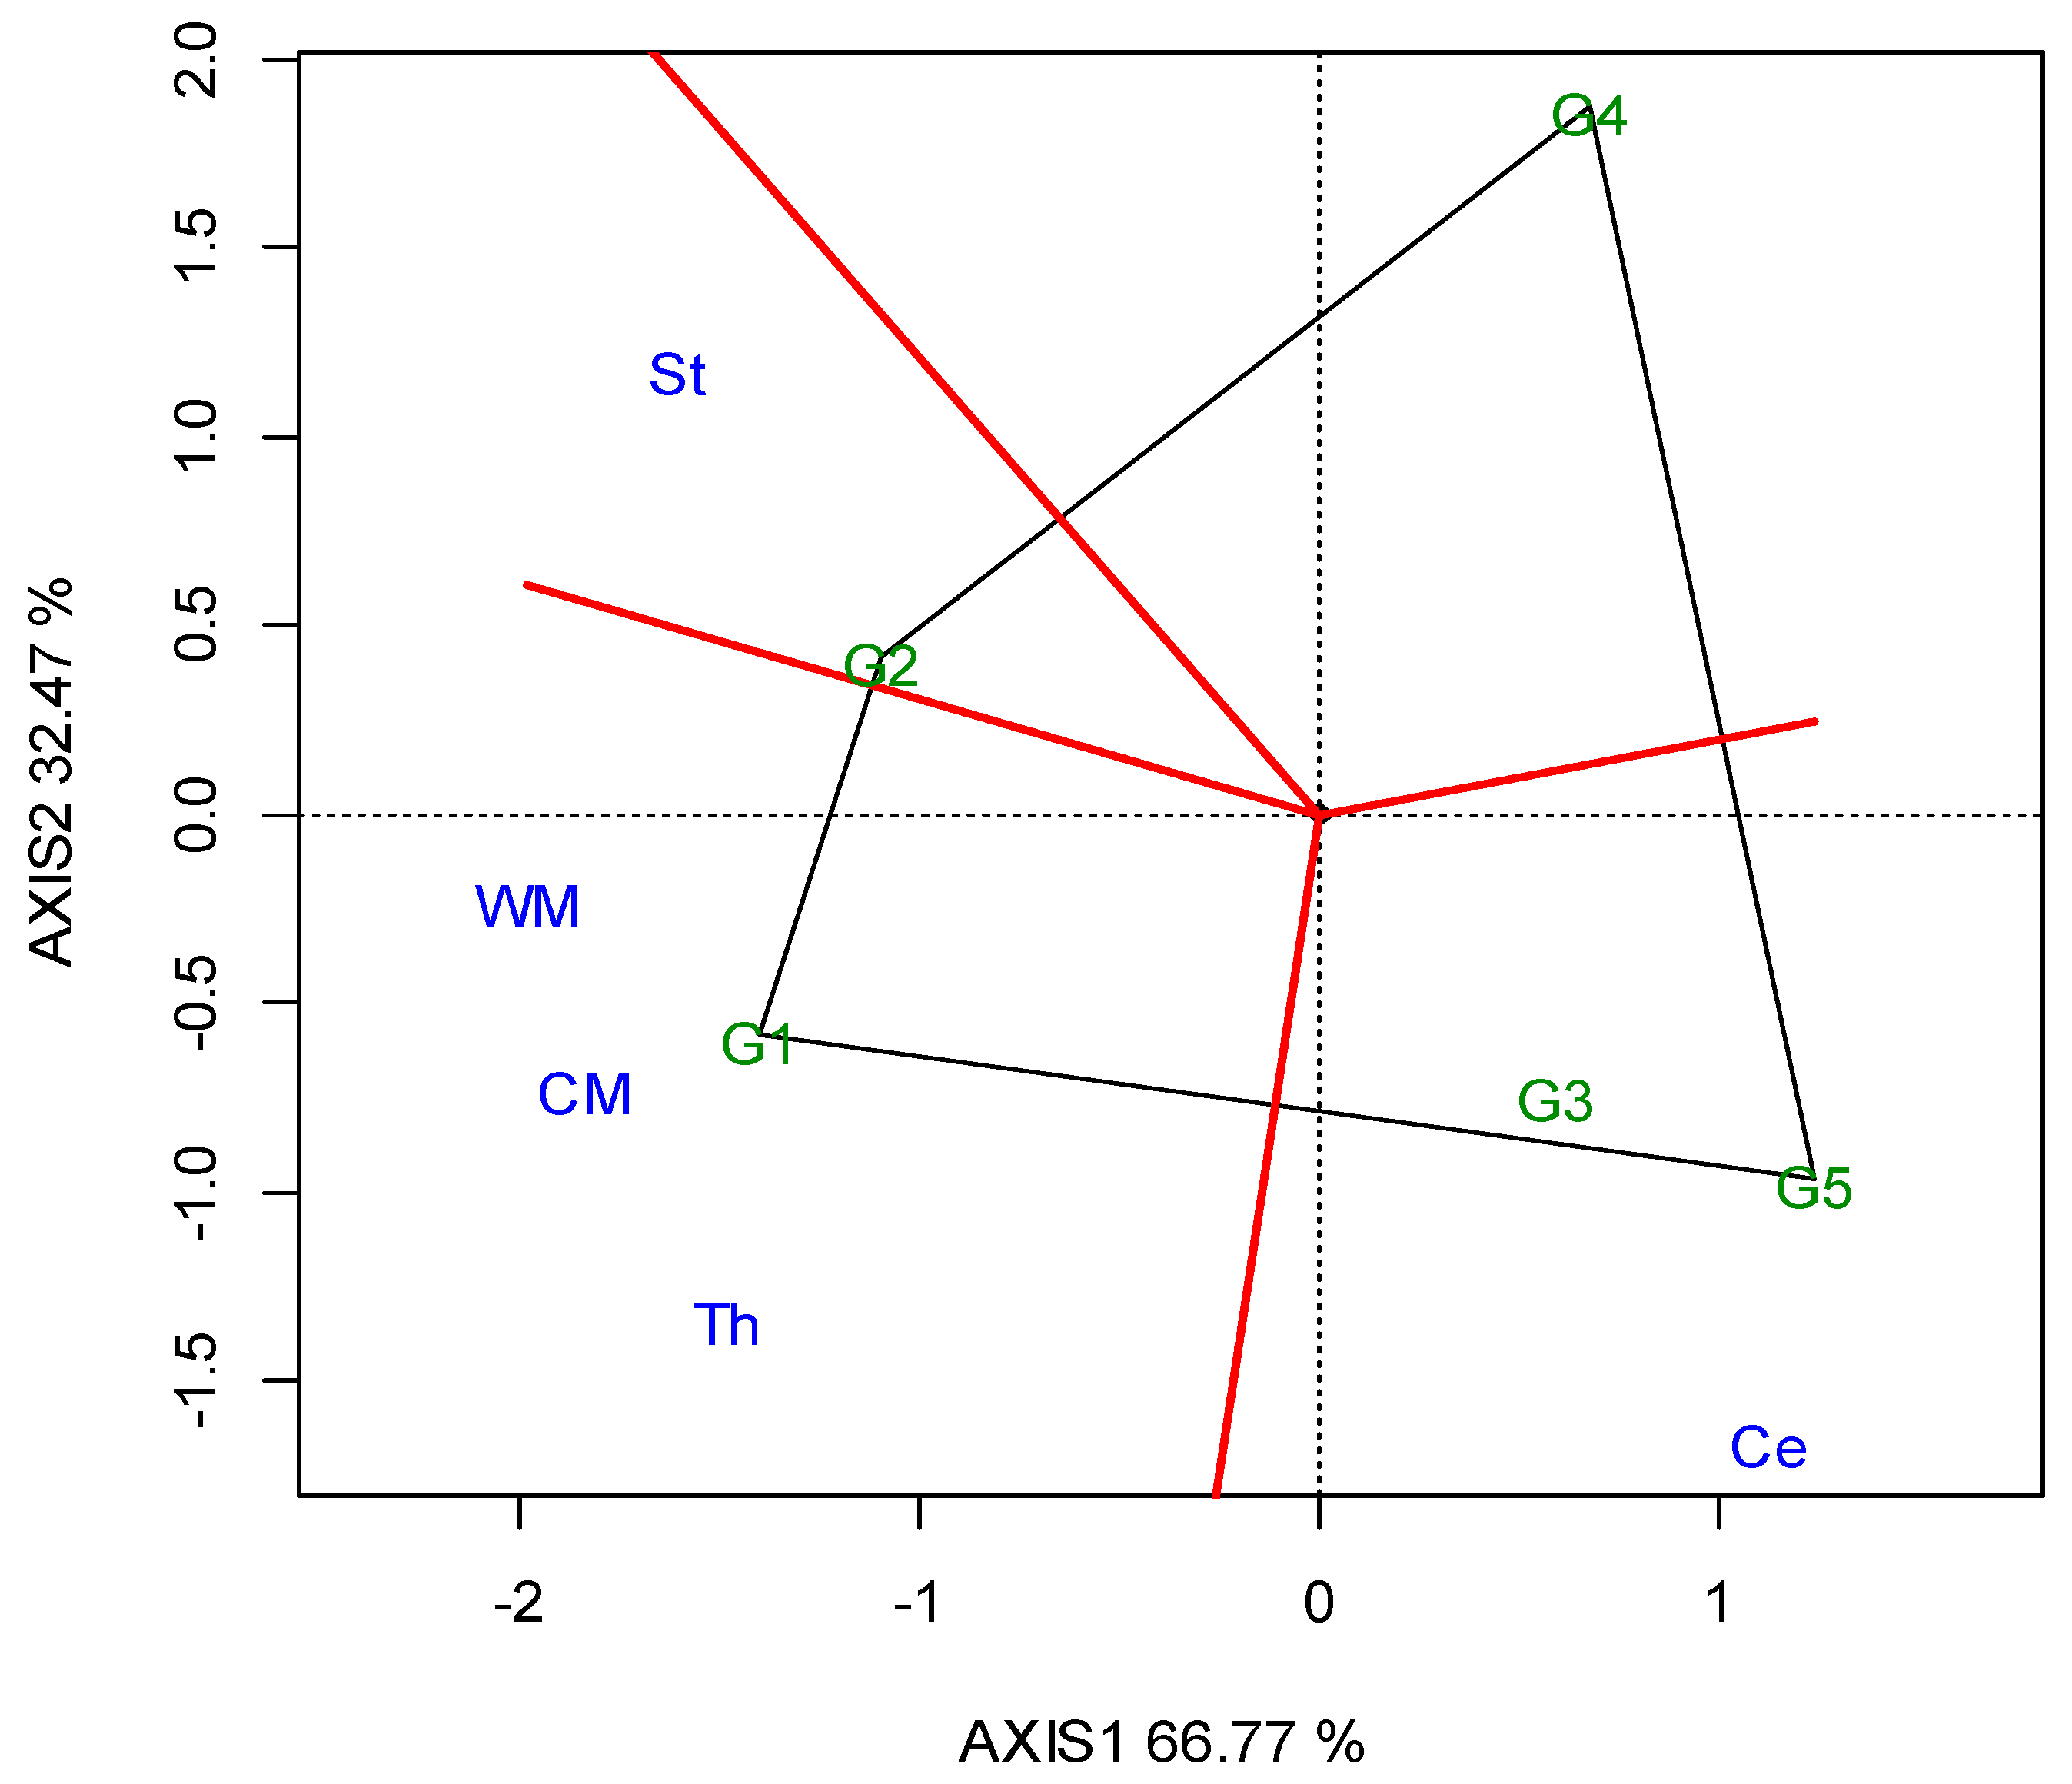
The two annual GGE biplots, based on the SY data of the 2019 (Figure A1; Appendix A) and 2020 growing seasons (Figure A2; Appendix A), were constructed with the polygon view. The polygon view of the biplot presents which genotypes performed the best in one or more locations, in order to reveal the presence or absence of crossover G × L interactions, which are suggestive of the absence or existence of different mega-environments. However, the data show that the location grouping pattern was not repeatable, but seemed to be year dependent. Thus, e.g., G3 was the winning genotype in the different environments in each growing season, and there was not repeatable grouping. The across-the-years GGE biplot indicated three regional groupings, as follows: G1 for WM, West Macedonia; CM, Central Macedonia; Th, Thrace; G2 for St, Sterea; and G5 for Ce, Central Greece; Figure 2.

Figure 2.
GGE biplot with the “which-won-where” pattern based on the seed yield of five lentil genotypes (abbreviated, G1–G5) across ten locations, based on two-year data in a regional grouping (where: St, Sterea; WM, West Macedonia; CM, Central Macedonia; Th, Thrace; Ce, Central).
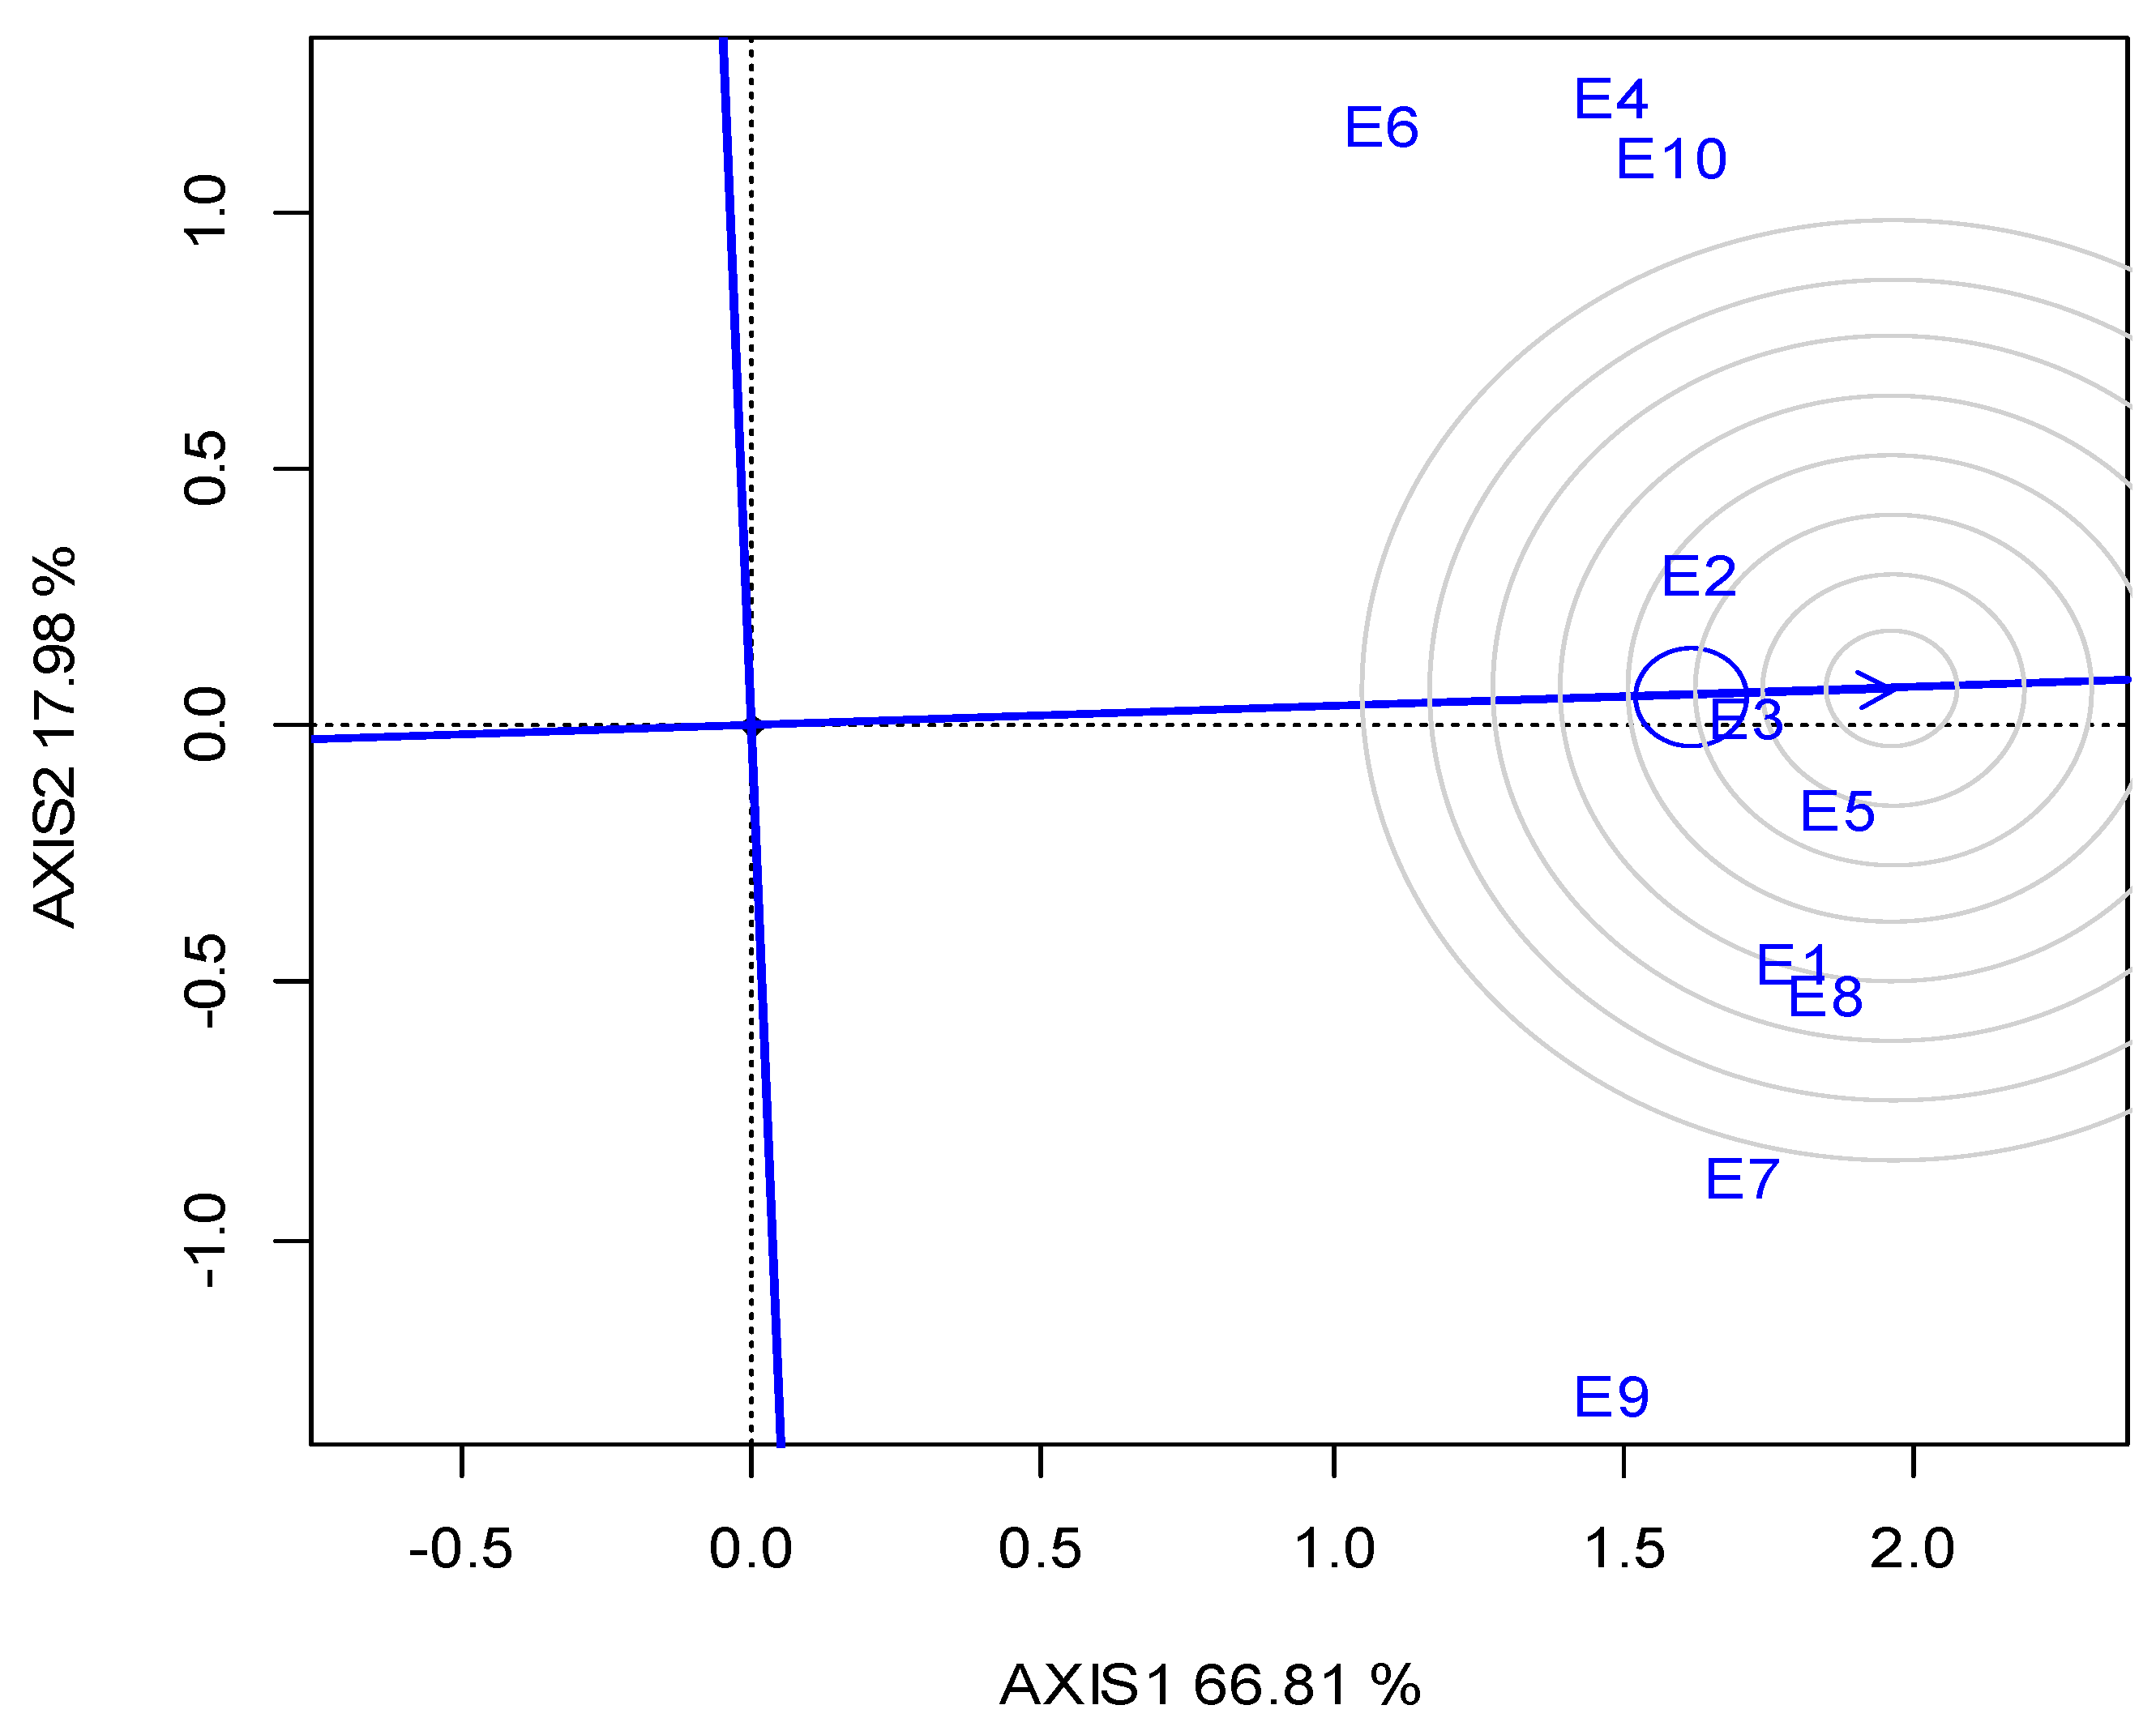
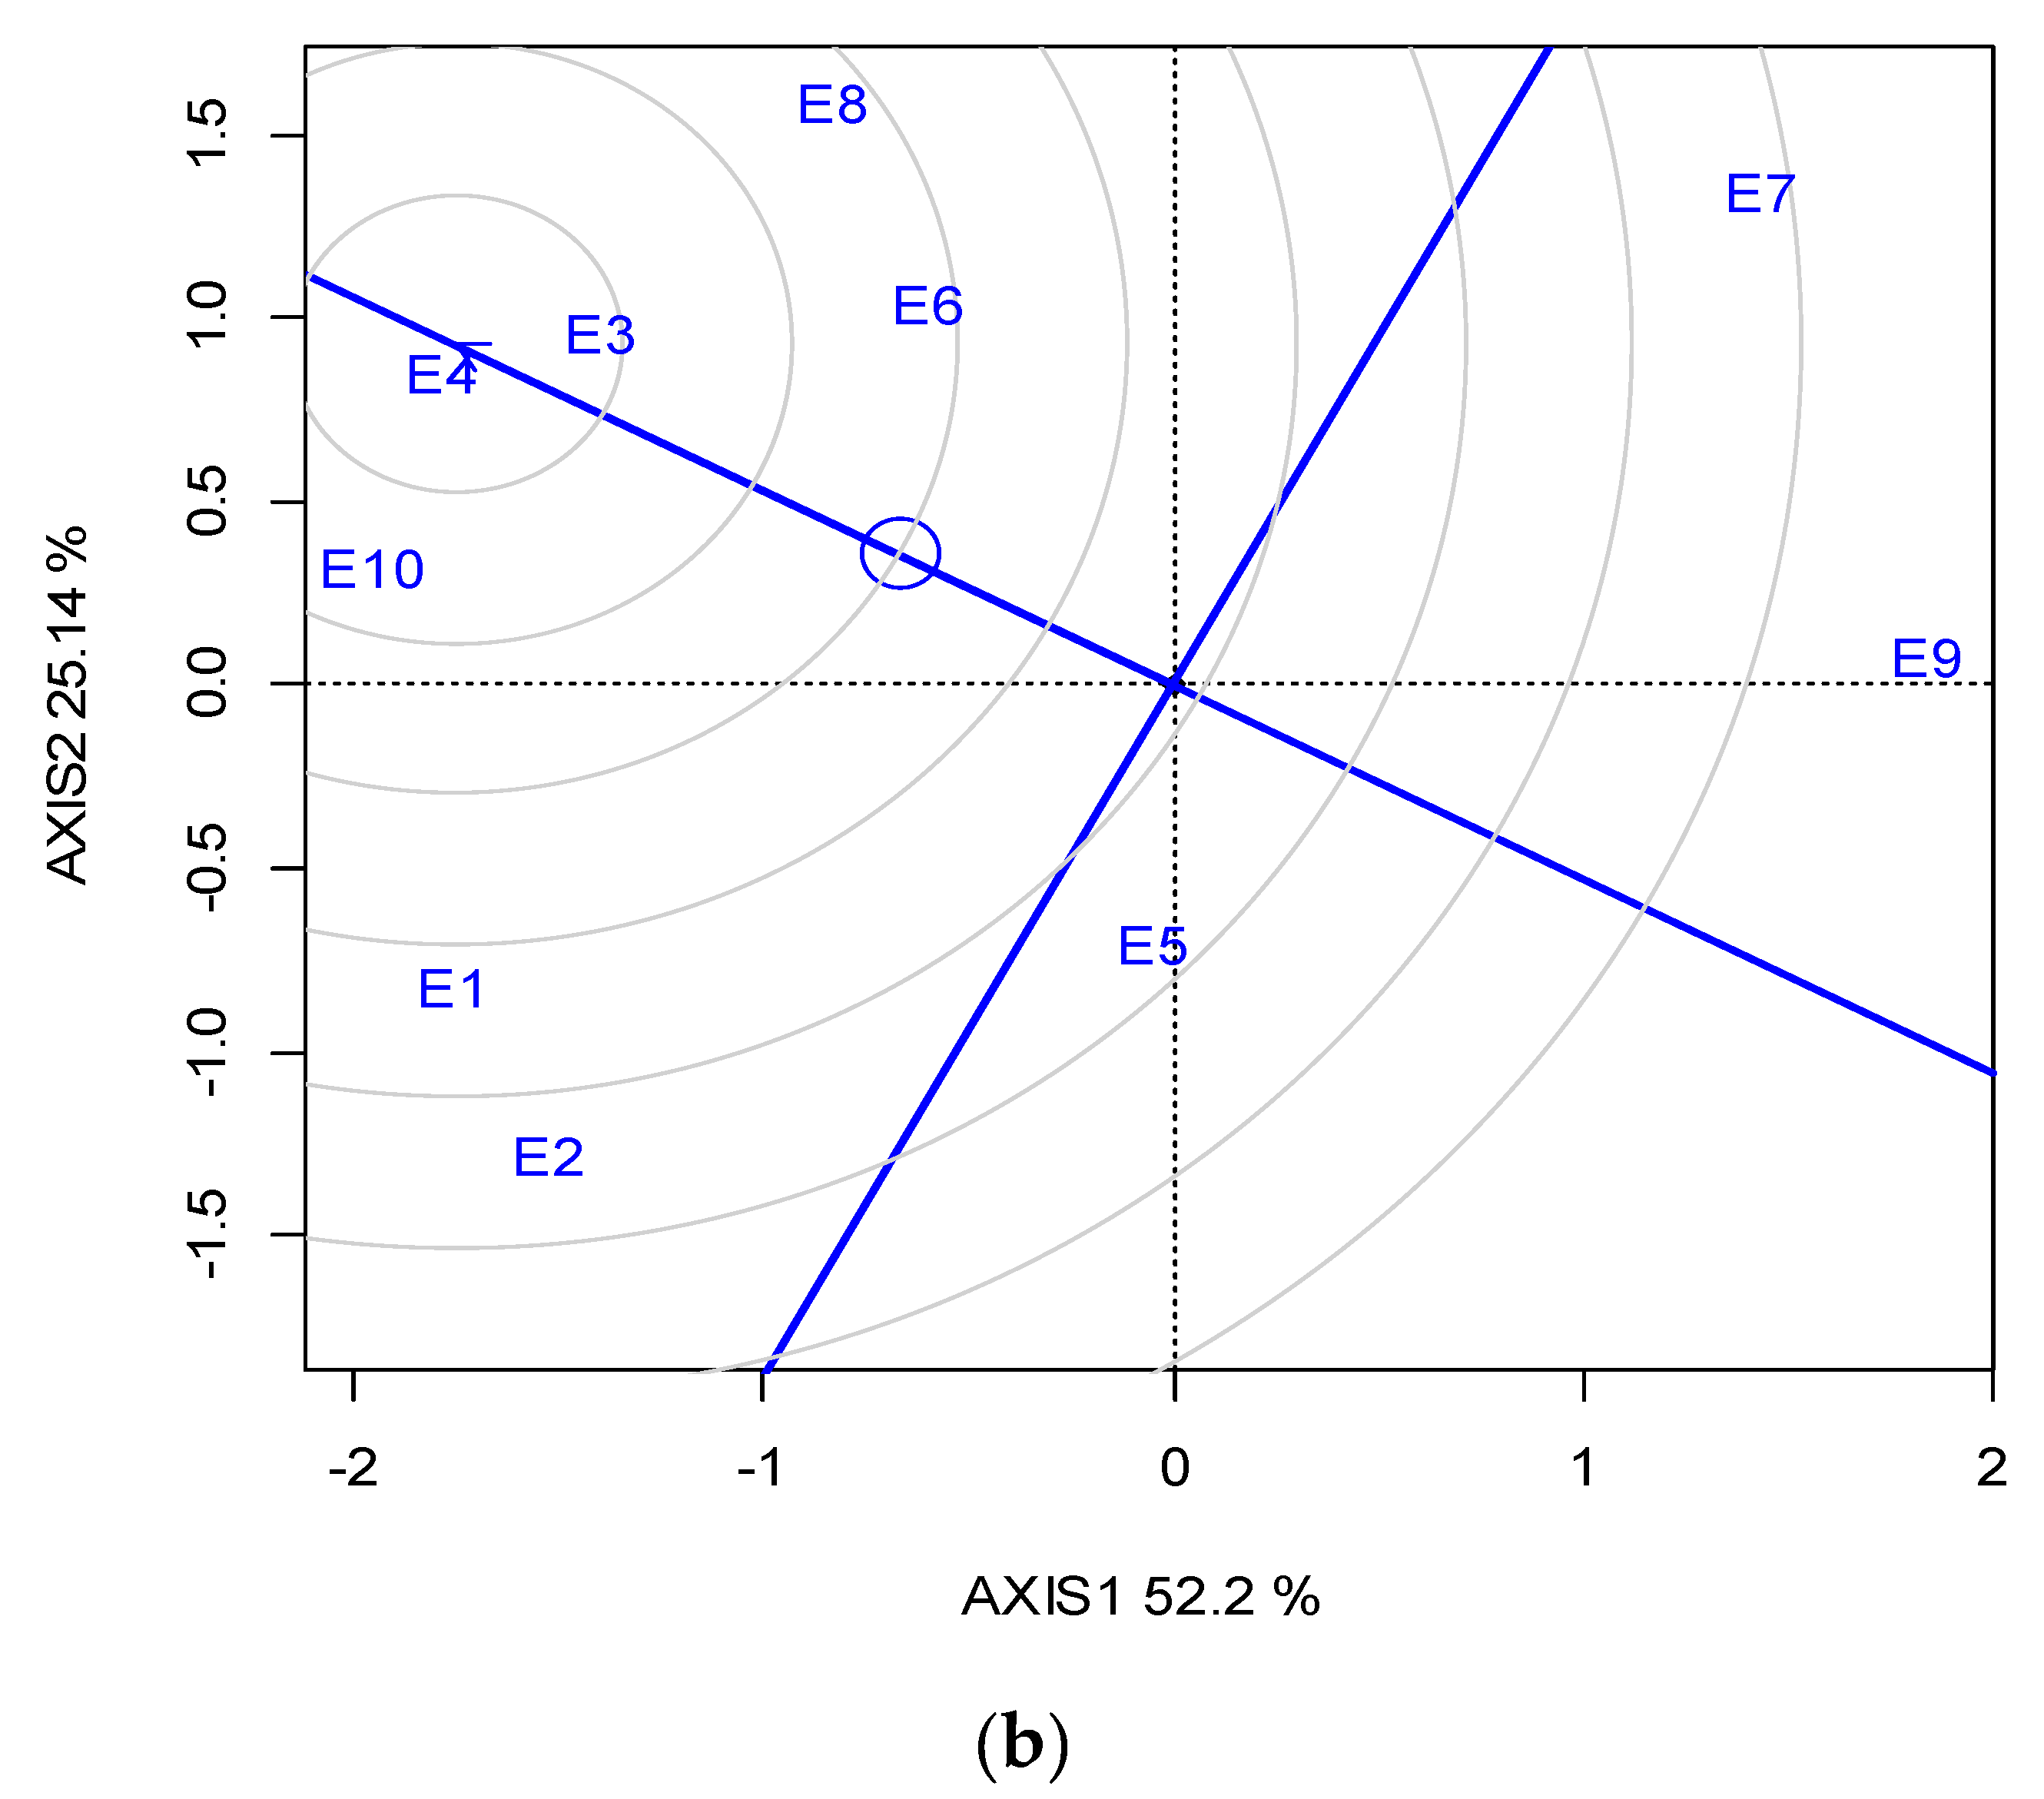
Across the ten locations, the closest to the “ideal” for SY and stability was G1, followed by G2; however, G1 was the most stable (Figure 3a). The “ideal” locations in terms of representativeness and discriminating ability were E3 and E4, followed by E10 (Figure 3b).

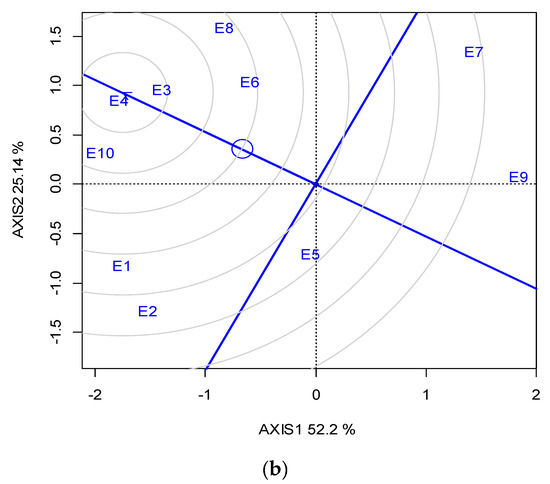
Figure 3.
GGE biplot based on the seed yield for (a) the ranking of five lentil genotypes against the “ideal”, (b) the ranking of the ten locations (abbreviated, E1-E10) against the “ideal” (the ideal is the most representative and discriminating) for two growing seasons (2019 and 2020).
3.2. Protein and Cooking Time
The year (Y), G, L, and the two-way (Y × L, G × Y, G × L) and three-way interactions (Y × L × G) were highly significant (p ≤ 0.01) for CP, CT and CPY (Table 3). The cooking time was genetically controlled, with G explaining 38.6% of the SSTRMT, whereas CP and CPY were mainly affected by L (60.3% and 51.9% of the SSTRMT, respectively). However, the SSG×L/SSG×Y ratio was 38-fold for CP and sevenfold for CT, and for this reason the GGE biplot with the polygon view based on the G×L interaction could be useful to study the pattern observed.
G5 and G2 were significantly the highest in CP (26.23% and 26.20%, respectively), whereas G1 exhibited the lowest value (24.76%, Table 5). The GGE biplot also indicated that G2 was the best performing genotype in E4, E6 and E10, whereas G5 was better in E1, E3, E7, E8 and E9 (Figure A3; Appendix A). The “ideal” locations for CP were E1 and E3, followed by E7 (Figure A4; Appendix A).
Table 5.
Comparisons of the means for the crude protein concentration (CP), cooking time (CT) and crude protein yield (CPY) of the five lentil genotypes across the ten locations over two years (2019–2020).
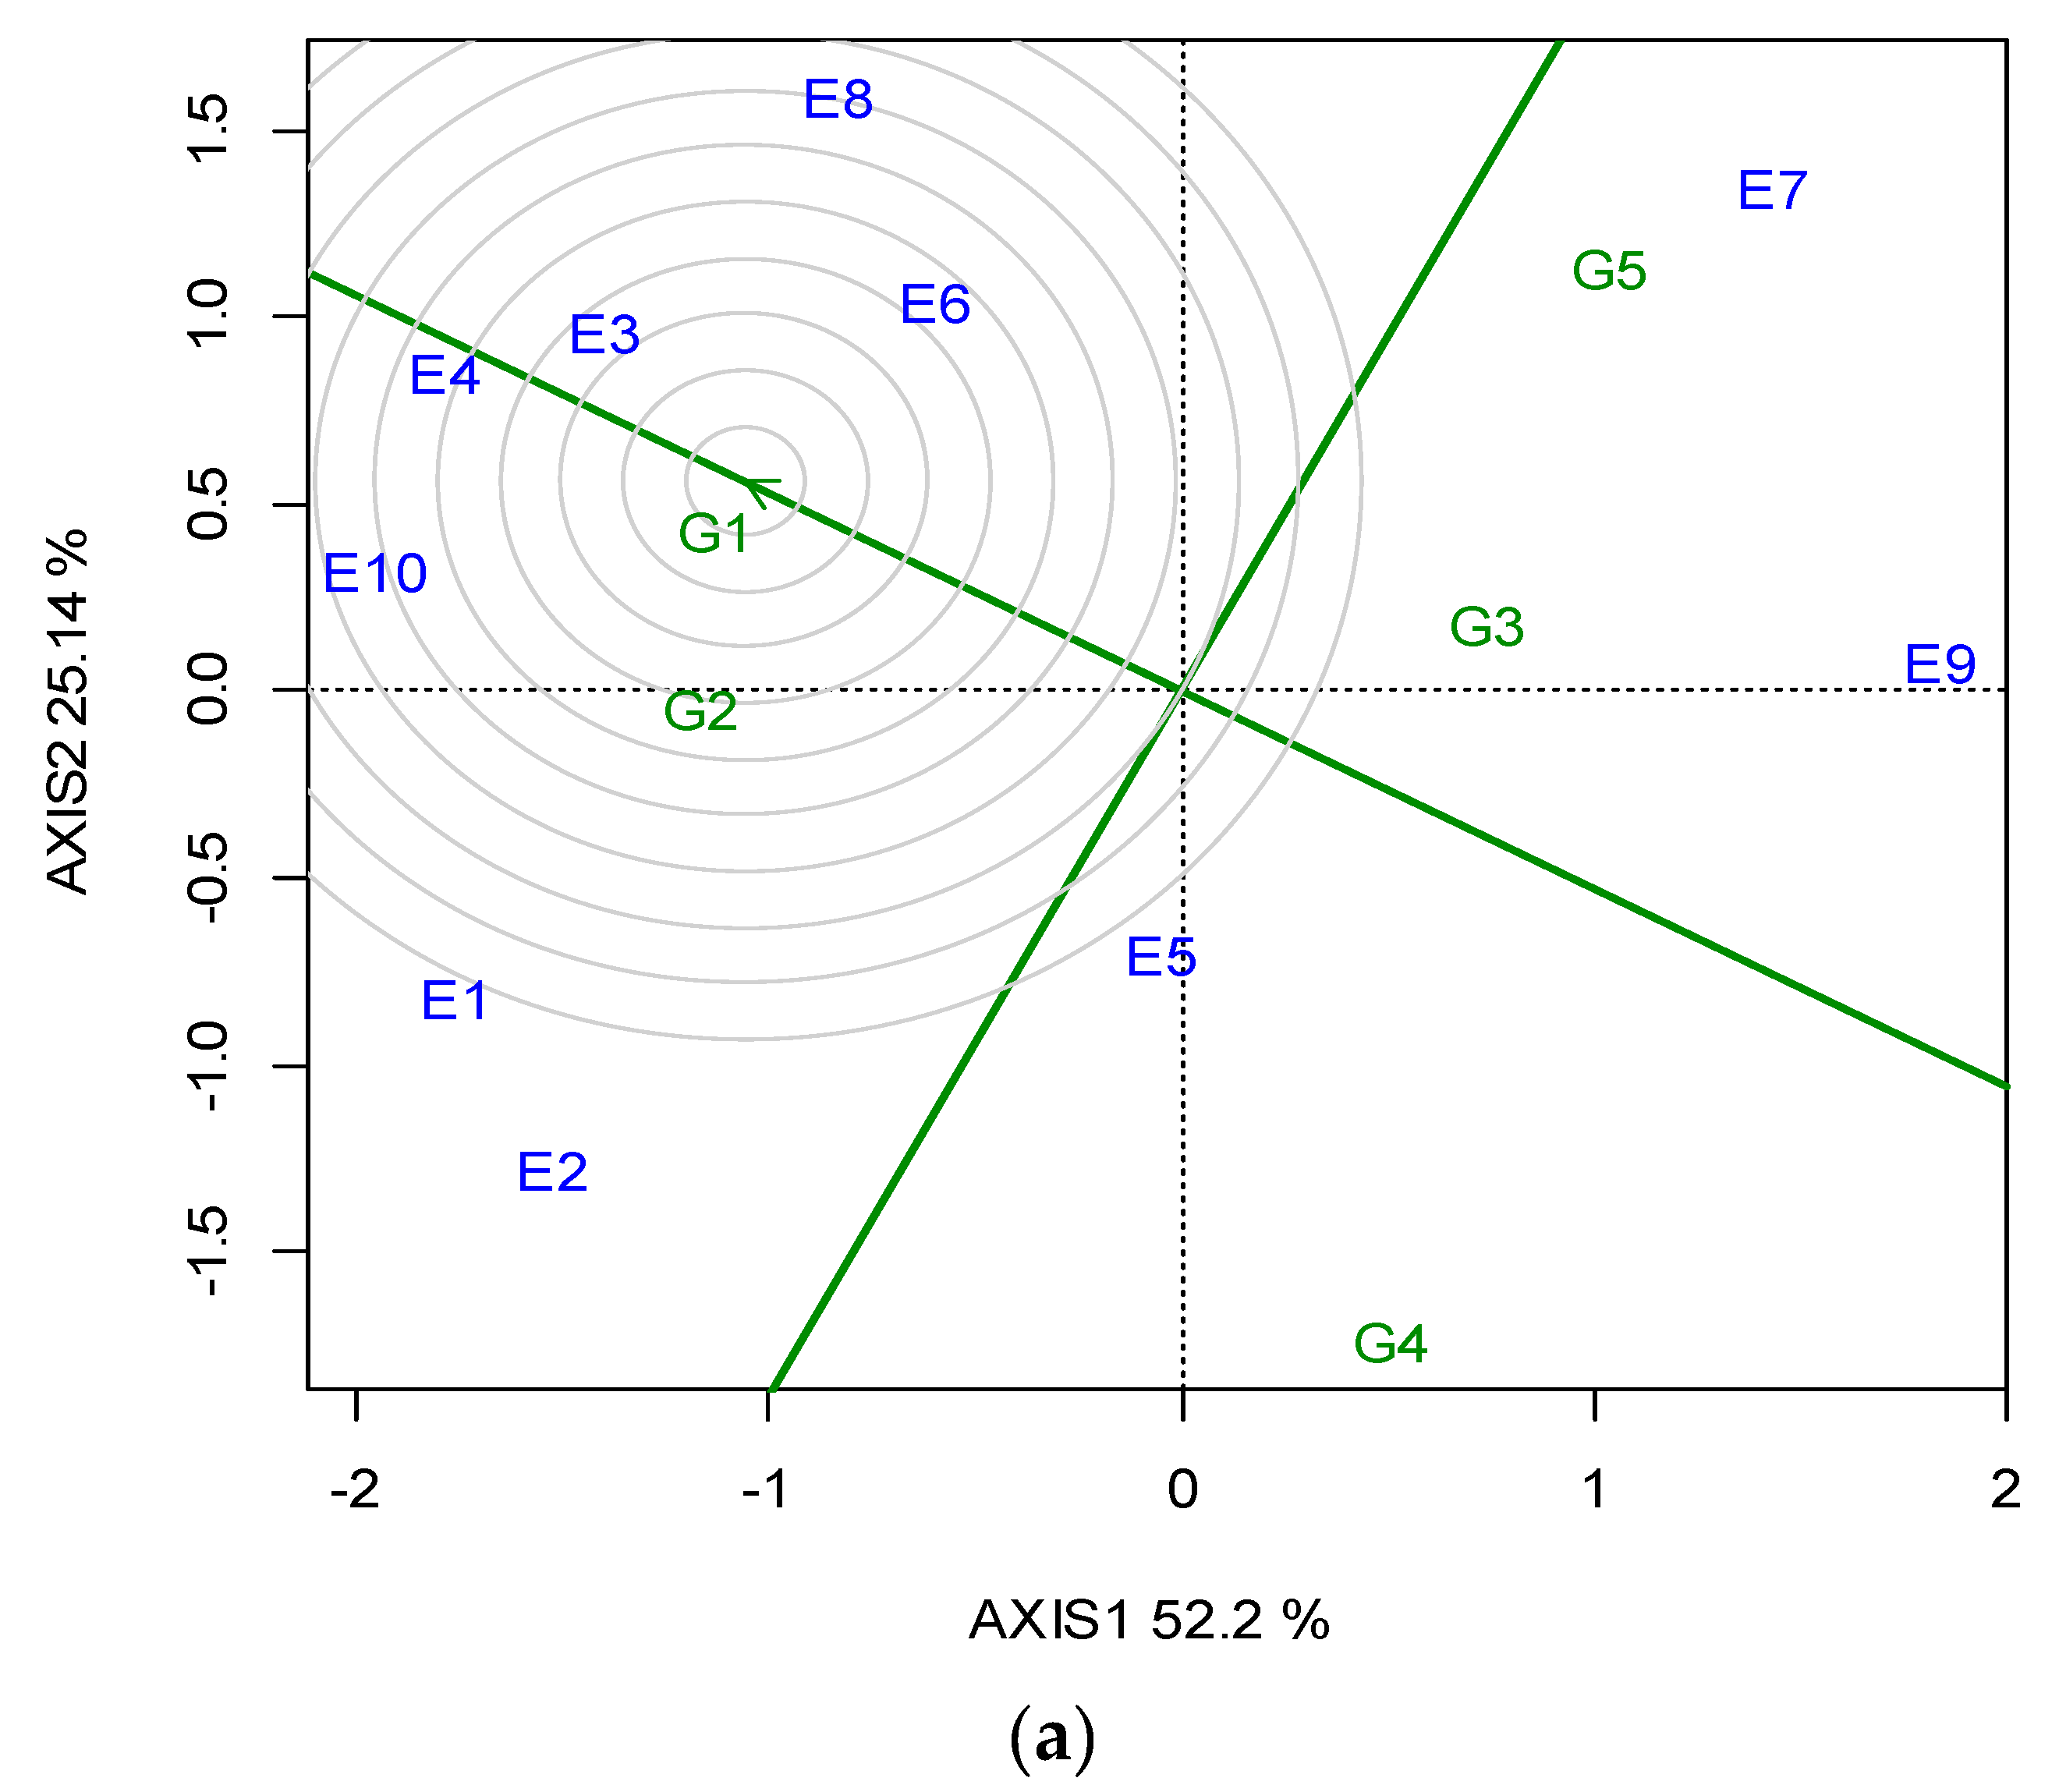
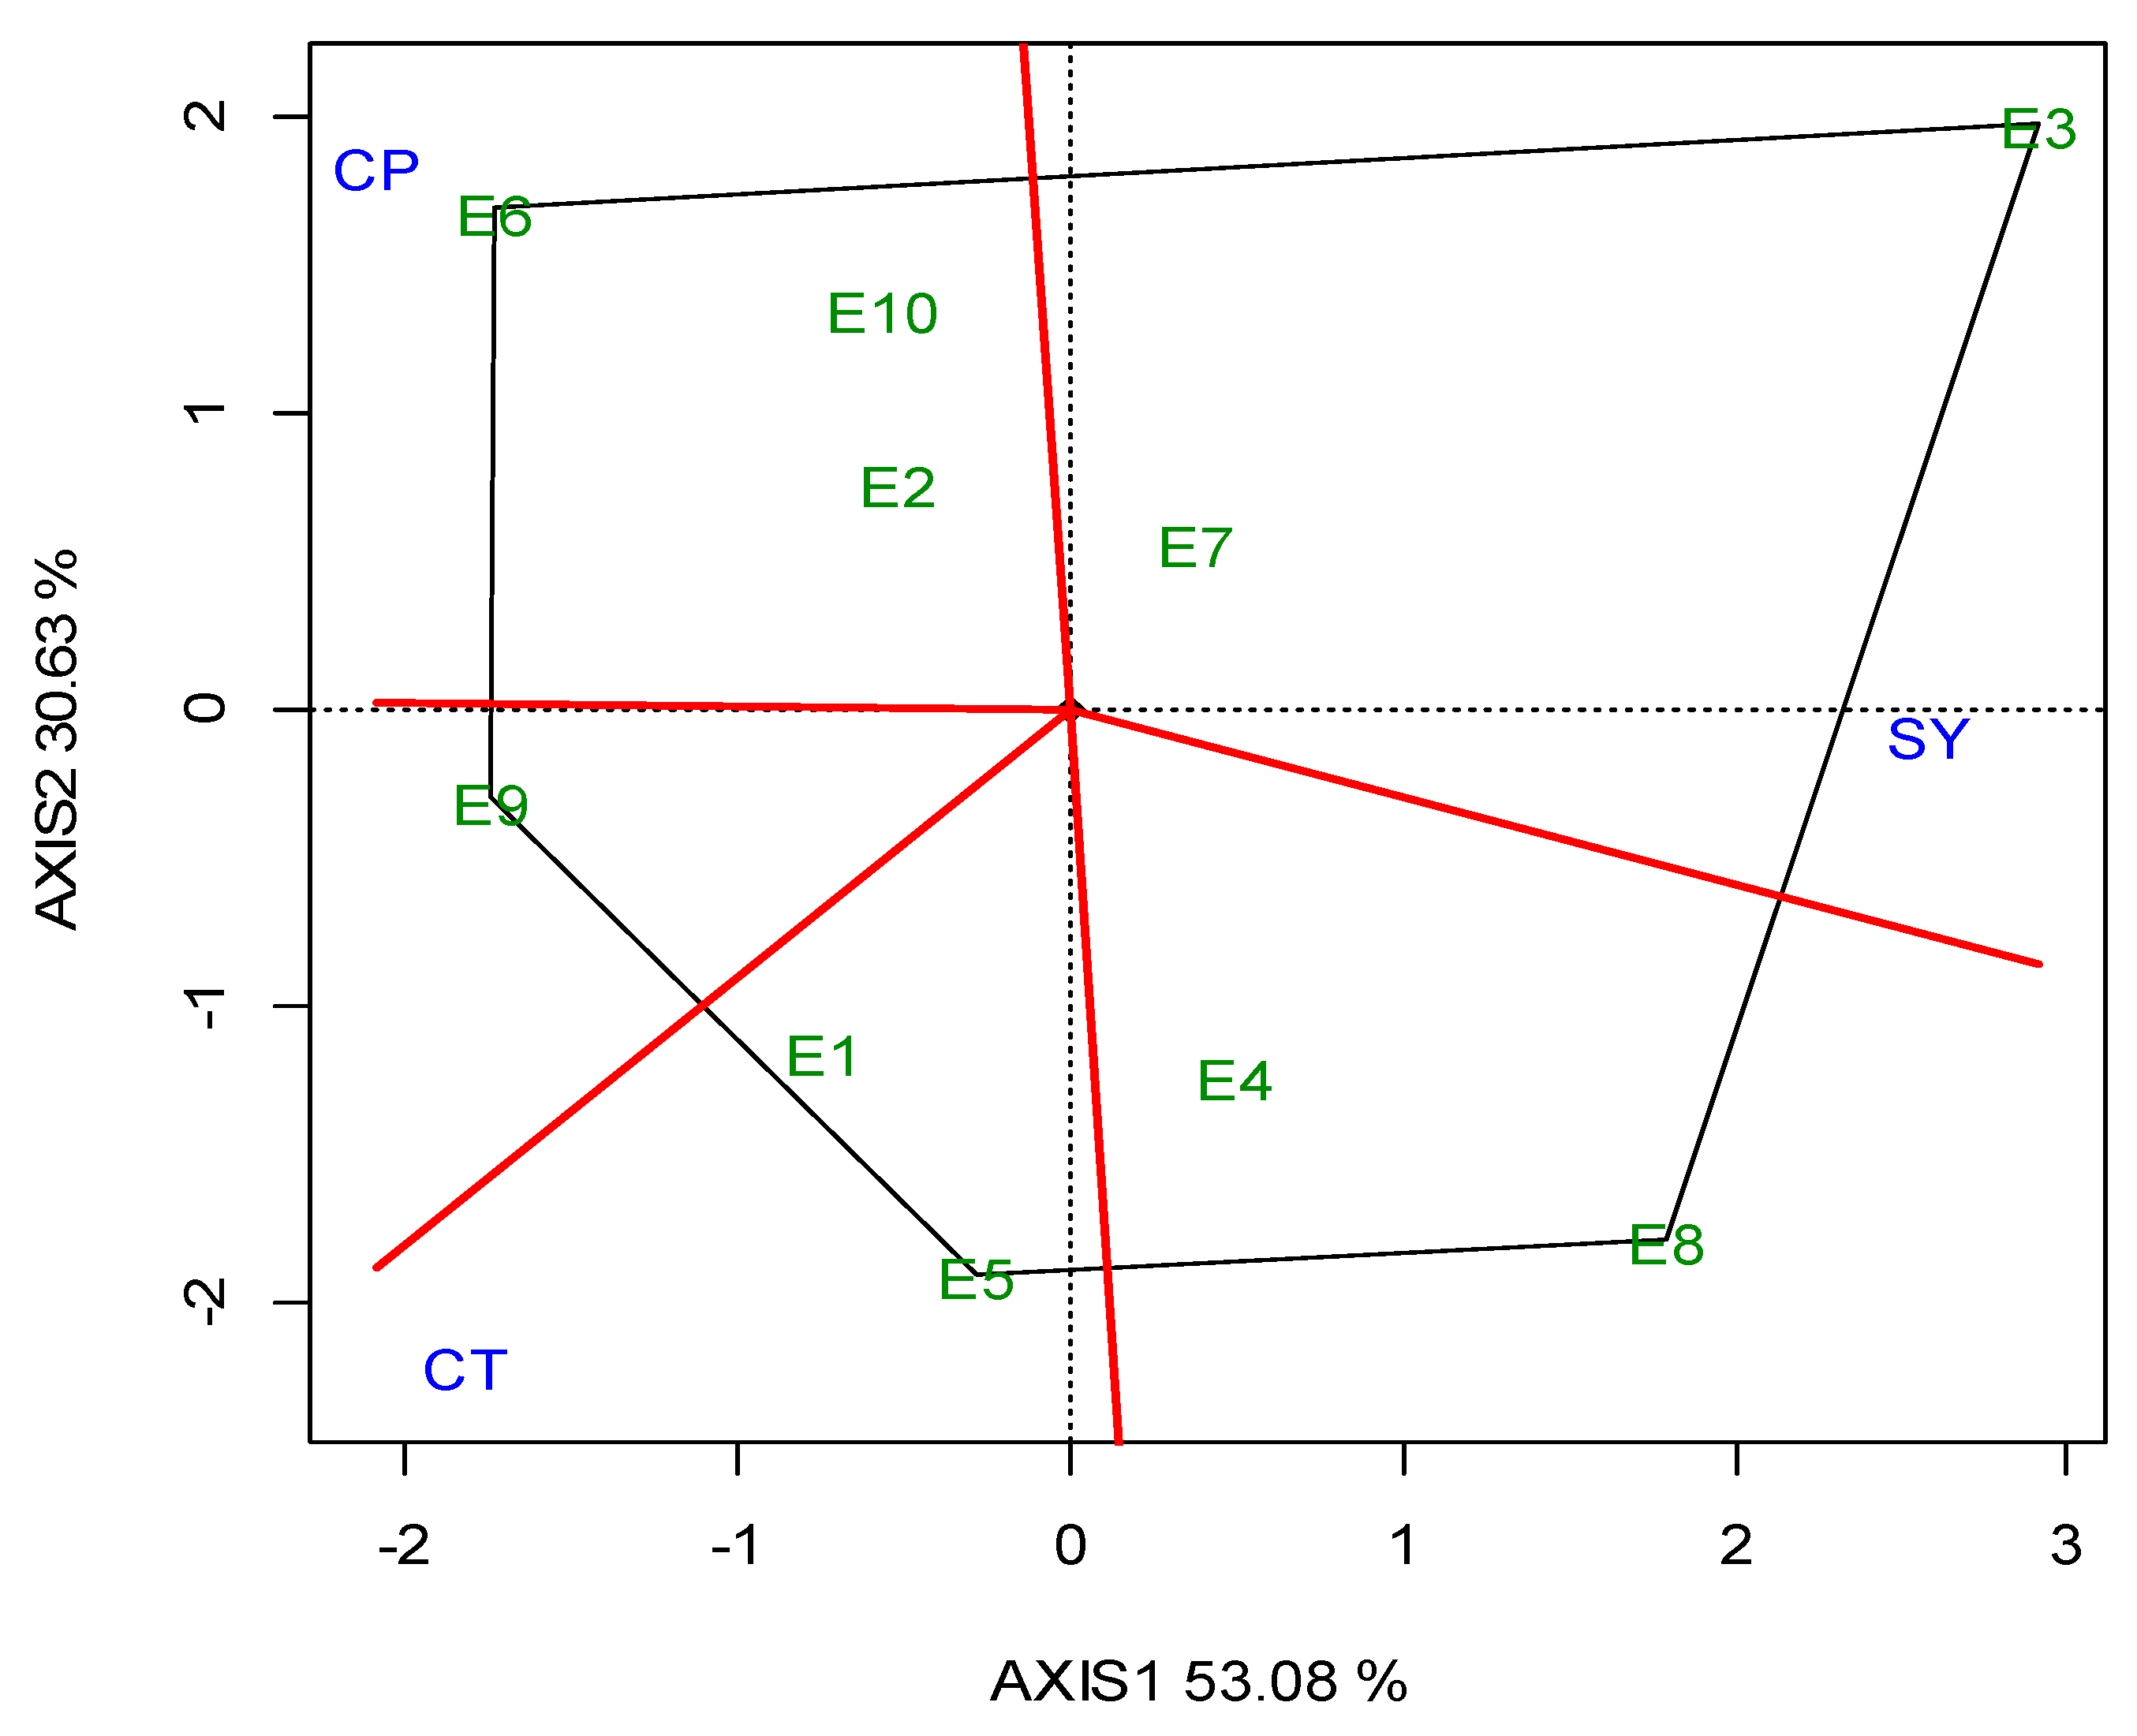
G2 was the best performing in CT (23.05 min) over the years, and for each growing season (Table 5). The GGE biplot also indicated that G2 was the single “winner” genotype (Figure A5; Appendix A). The ideal locations for CT were E3 and E5, followed by E2 (Figure A6; Appendix A). The mean CPY ranged from 0.20 (E10) t ha−1 to 0.51 t ha−1 (E3, E8), with an average of 0.36 t ha−1 across the locations (Table 5). The high-yielding genotypes or locations exhibited a respectively high CPY. Regarding the GGE biplot analyses, the “ideal” locations, exhibiting high discriminating ability and representativeness for the selection of superior genotypes and for the examined traits, the rankings were as follows: for SY E3, E4 > E10; for CP E1, E3 > E7; and for CT E3, E5 > E2 (Figure 4).
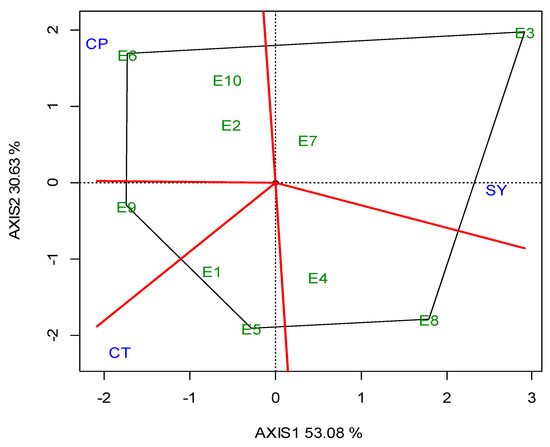
Figure 4.
GGE biplot with the “which-won-where” pattern based on the seed yield (SY), crude protein (CP) and cooking time (CT) of five lentil genotypes across the ten locations (abbreviated, E1–E10) for two growing seasons (2019, 2020).
3.3. Phenotypic Correlations (Based on Genotypes)
The seed yield was positively highly correlated with PP (r = 0.97 p < 0.01), and medium with PH (r = 0.72 p < 0.05), whereas it was negatively correlated with 1000 SW, CT and CP (r = 0.79 p < 0.01, r = −0.63 p < 0.05, r = −0.28 ns, respectively). The plant height was positively correlated with PP (r = 0.67 p < 0.05), and the 1000 SW was negatively correlated with PP (r = 0.88 p < 0.001, Table 6).
Table 6.
Correlation coefficients for SY, seed yield (kg ha−1); PP, number of pods per plant; PH, plant height; 1000 SW, thousand seed weight; CP, crude protein concentration; CT, cooking time. (n = 20).
4. Discussion
Knowledge of the relative contribution of the genotype, location and growing season, and their interaction on SY, yield components, 1000 SW, CP and CT is important for the implementation of breeding programs and guidance for local farmers and private companies.
Due to high concern about the higher productivity of grain legumes, environmental sustainability, healthy diets of plant-based proteins and food/feed security, there is increasing interest about protein crops like lentils [25].
4.1. Seed Yield, Yield Components and PH
The combined ANOVA for the SY, PP and 1000 SW of the five genotypes across the 10 locations for the two growing seasons (2019 and 2020) revealed highly significant single treatment effects (L, G) and their combinations (two-way Y × L, G × Y, G × L and three-way Y × L × G interactions), except for the Y. The treatment effects were less consistent for PH (Table 3).
Dealing with the G × E interaction in breeding programs is crucial, and could be managed in three ways [55]: it can be ignored, reduced or exploited. When the G × E is ignored, genotype recommendations are based on the mean performance across all of the testing environments. In the other two cases, stability analysis is required as a step where a decision has to be made regarding the division into sub-groups. Then, a genotype recommendation is made separately for each subgroup (reduction) or for particular environments (exploitation). Based on the SY data of the 2019 (Figure A1; Appendix A) and 2020 growing seasons (Figure A2; Appendix A), the two annual GGE biplots of the five lentil genotypes in the ten locations (E1–E10) were constructed with the polygon view. The polygon view of the biplot presents which genotypes performed the best in one or more locations, thus enabling the identification of mega environments [18,20]. Genotypes G1, G2, G3 and G5 in Figure A1 (Appendix A), and G1, G2, G3 and G4 in Figure A2 (Appendix A) are located at the top of the polygons. These genotypes are the highest or the lowest yielding genotypes in some or all of the locations, as they are located at the maximum distance from the biplot center. However, the annual polygon view reveals the absence of a unique mega-environment in the tested area. The annual biplots indicated a non-repeatable location grouping pattern and inconsistency in the performance of the genotypes, which is not suggestive of the existence of different mega-environments. For example, G3 (cv. Thessalia), which is located on the top of the polygons in both growing seasons (2019, 2020) was the winning genotype in different locations in each growing season, and there was not a repeatable grouping over the years. Then, it would be more suitable to select for superior lentil genotypes based on the combination of high average SY and SY stability.
Across Y and L, the mean SY among the genotypes ranged from 1.37 t ha−1 to 1.73 t ha−1, and fell within the SY range of 0.78 t ha−1 to 2.89 t ha−1, in compliance with previous studies in Mediterranean conditions [56]. G1 ranked in the top for SY and PP, indicating a highly productive and stable genotype across the locations and years. On the other hand, G4 was a large-seeded genotype exhibiting significantly higher 1000 SW, which ranked at the bottom, with 21% less SY than G1, corroborating previous studies about the lower yield potential of large-seeded genotypes compared to their small-seeded counterparts [57]. The negative correlation between SY and 1000 SW could be attributed to the lower PP of large-seeded genotypes [7].
The large SS for L (54.3%) indicated that locations were diverse and that differences among location pedoclimatic conditions caused most of the variation in SY which was widely ranged from 0.91 t ha−1 to 2.27 t ha−1. Data across Y and G, indicated that E8 (Komotini-Mesochori) and E3 (Orestiada) (both in the same Region of Thrace) were the most productive locations, with mean SYs of 2.32 t ha−1 and 2.27 t ha−1, respectively (Table 4). Seed yield is one of the most variable traits, and even though it is genetically controlled by many genes with small effects, it is also manipulated by many agronomic factors and environmental variables, such as soil characteristics and climatic conditions. In location E8, the higher SY may be attributed to the highest mean PP (77.6 pods plant−1), whereas in E3 it may be attributed to the highest mean 1000 SW (48.5 gr) (Table 4), which is one of the most important parameters related to ultimate crop yields. These results are in accordance with Tyagi and Khan [58], who concluded that PP is the most important trait responsible for SY in lentil. Their correlation studies indicated that PP was positively and significantly correlated with SY at both the phenotypic and genotypic levels. Similar results were also recorder by Salehi et al. [59] for twenty lentil genotypes under normal and drought stress conditions, whereas a recent field evaluation of high yielding lentil genotypes revealed a highly significant correlation between agronomic parameters (number of branches plant−1, seeds pod−1 and 1000 SW) and the SY of lentil [60].
The pedoclimatic conditions recorded in these locations were also favorable for sustaining high lentil SYs. From the flowering to pod filling stages, the amount of precipitation (>105 mm) in locations E3 and E8 (April–May precipitation) may have secured adequate soil moisture for the proper growth of the lentil genotypes. A deficiency of water during any growth stage in lentil, as in any legume species, often results in a loss of SY [61]. More particularly, the seedling and flowering stages are the most sensitive to water availability and drought stress [59]. Moreover, the soil types classified in these locations revealed very fertile soils which belong in the orders of Fluvisols (E3) and Luvisols (E8) (Table 2) (soils with intrinsic high fertility), typically with a high cation exchange capacity (CEC) and high levels of clay (37–49% in E3 and 34–47% in E8, data not shown). These soils are well-drained (100–150 cm) (E8) or moderately well-drained (50–100 cm) (E3), exhibit an absence of a cultivation pan, show good soil structure and consistency, and show no (E3) or weak (E8) erosion (data not shown, derived from classification map symbols). Conversely, over Y and G the lowest SY (0.91 t ha−1) was recorded in E10 (Petrana), a location which is characterized by calcareous soils (the presence of calcium carbonate from 30–39%; Table 2), which may be rather problematic under certain conditions for lentil crop production (i.e., the low availability of soil P and Zn).
With regards to location representativeness and discriminating ability, E4, followed by E3 and E10, showed the maximum proximity to the ideal environment for selection (Figure 3b), and therefore these locations were suggested as suitable locations for lentil breeding when targeting high SY. It is noteworthy that the locations suggested for breeding are not always the most productive (e.g., E10), but those in which phenotypic differences are maximized and thus selection is more efficient.
The location effect was the main source of variation for PP (65.4%), while the PP values ranged from 25.3 pods per plant−1 to 77.6 pods per plant−1 among the environments. A high significant correlation (r = 0.97, p < 0.01, Table 6) of SY and PP showed that PP is a reliable criterion to select lentils for seed yield, confirming previous results [58,59,60]. The location and genotype effect were similar for PP and PH, while their correlation was positive and relatively high (r = 0.67, p < 0.05, Table 6).
Seed size is an important seed quality trait that determines the market categories and the relative market value of lentil cultivars. Low L and G × L effect (5% and 5.7%, respectively) were detected for the 1000 SW, which was mainly affected by G, as it explained 82.2% of the total variation. Therefore, the selection of the appropriate cultivar must be the criterion for seed size, as this trait is independent of the growing environment effect.
The tallest plants across Y and G were recorded in E2 (Ypato: the southernmost location among the tested locations) (PH = 39.5 cm) (Table 3). This was the location with the highest precipitation and mean temperature among the test locations in both seasons. These conditions may result in prolonged growth seasons and the accumulation of large amounts of vegetative assimilates. However, although various parameters of lentil, including the PH, are influenced by both the genetic and the environmental factors, the changes in the genetic architecture seem to be the major determinant of PH [60].
4.2. Crude Protein
Lentils are an excellent source of plant proteins and an alternative to animal and soy protein for the food and feed industries [29]. The CP values ranged between the genotypes from 24.76% to 26.23%, while the red lentil G5 ranked first, followed by G2. In general, a higher seed protein content is observed in lentils with red cotyledons. Subedi et al. [26] tested 34 genotypes in 10 locations and found 3% higher protein content in red lentils compared to other categories. The GGE biplot analysis illustrated that G5 had higher and consistent CP values, and adapted better in five locations (E1, E3, E7, E8, E9), while G2 showed better adaptation in three (E4, E6, E10) (Figure A3; Appendix A). A clear cut explanation as to why these two genotypes exhibited a higher CP in these specific locations cannot be given. However, even though these locations exhibit diverse pedoclimatic conditions, some specific soil traits may partly explain these results. For example, other locations (i.e., E1, E7) exhibited sufficient soil P content, which may have favored the genotypes’ N-fixing ability, and other locations (i.e., E3 and E8) have soils with intrinsic high fertility (Fluvisols, Luvisols), high cation exchange capacity (CEC) and high levels of clay. Moreover, most of these locations contained medium or adequate quantities of CaCO3, which accounts for an important fraction of the C present in soils, linking the long-term geological C cycle with the faster biogeochemical cycling of soil organic carbon [62]. These conditions may have favored the mobilization of N to the seed, and thus may have increased the seed CP content.
The location explained 60.3% of the total variation, and was the main source of variability. Similar results were reported by Subedi et al. [26], although other researchers found low variation across locations [63]. The fact that the CP was highly affected by the location could be attributed to the low diversity between the tested genotypes, pedoclimatic differences between the locations, and the location effect on the N-fixing ability [64]. Moreover, CP is a quantitatively inherited trait [65], and thus it is strongly influenced by the environmental fluctuations [26,66]. In grain legumes, environmental variability affects the pod filling period, which is responsible for the increasement of seed CP [67].
The CP values ranged among the locations, from 23.05% to 28.87%. The higher CP was recorded in E6, which was characterized by very low precipitation during the crucial period of pod filling (April–May) in both years. It is possible then that the water deficit negatively impaired the starch synthesis, resulting in an increase of seed protein.
The mean CPY ranged from 0.20 to 0.51 t ha−1, with an average of 0.36 t ha−1 across the locations. This mean value was similar to the one reported by Lizarazo et al. [63] for Northern Europe regions (0.4 t ha−1), but was 38% lower than the one reported by Subedi et al. [26] in the USA. CPY followed the ranking of locations for SY. Therefore, E3 and E8 were the most productive locations for both SY and CPY. Locations E3 and E8, which were the most productive, were located in the same region (Thrace), and had similar elevation, soil properties and precipitation during the crucial period of anthesis and pod filling (Table 2).
The protein content and SY showed a negative correlation that was in accordance with other studies [31,68]. This indicates an independent selection for the two characteristics that makes a simultaneous selection for both traits very difficult, as the rate of genetic gain in one trait is reduced by the other. In this case, independent culling or truncation selection could be the most suitable breeding method for simultaneous selection for SY and CP [69]. The ideal environment for CP breeding was E1 and E3, followed by E7.
4.3. Cooking Time
Cooking time is an important commercial trait for pulse crops, which is characterized by high heritability values [30,31,68,70,71]. In the present study, genotype was the main contributor to CT variance (38.6%), whereas significant differences were detected among the genotypes. The mean CT across the years and locations ranged from 23.05 min to 28.03 min between the genotypes. G2 had the lowest CT and showed considerable stability across the locations and growing seasons. In comparison, G2 required 12% less time to reach the optimum cooking point than the second genotype in the ranking list and 17.7% less time than the genotype which ranked in the bottom. Other studies reported significant genotypic variability for CT [34]. More specifically, Erkine et al. [31] reported an average CT of 33 min in a collection of 24 genotypes, Jood et al. [72] reported values ranging between 38 min and 43 min, and Vandenberg [73] recorded CTs varying from 15 min to 20 min. The highest CT was observed for the red lentil G5. The same genotype was evaluated for CT by Theologidou et al. [74], and was characterized as unstable and highly affected by environmental fluctuations. Generally, red lentils are characterized by poor cooking quality, and this is the reason why they are consumed dehulled [75], as dehulling reduces their CT to as low as 15 min [76]. However, it should be underlined that the CT of G5 was commercially acceptable as it was less than 30 min and was comparable to cultivars like G3, which is categorized as a fast-cooking genotype among Greek varieties [77].
The location effect explained 19.1% of the total variation. The mean CT across the years and genotypes ranged between locations from 24.96 to 29.58 min. The lower CT was recorded in E9, followed by E1. Both locations pertained to the BSk climate category (arid, steppe, cold); however, their soil characteristics and altitude were quite different. Locations like E3 were expected to have high CT because of their very low precipitation [77]. Ultimately, a specific pattern linking climatic and soil conditions to CT was not identified, and this could be attributed to the significant G × L interactions.
However, it is remarkable that the range of mean CTs between the genotypes or locations was near 5 min. This CT range is not judged to be high according to the market criteria, and was attributed to the fact that most of the tested genotypes were commercial varieties that have already been screened for low CT before their release into the market.
A significant negative correlation was observed for CT with SY. Ninou et al. [7] investigated the indirect effect on the seed quality characteristics of an intense lentil breeding project for high yield [78], and reported the selection of higher-yielding plants with reduced CT compared to the parental landraces. The relatively high percentage of G in the total variability suggested that the phenotypic differences observed for CT between genotypes are highly controlled by genetic factors, and that phenotypic selection could be an effective means to develop fast-cooking lentil varieties. GGE-biplot diagrams (Figure A5 and Figure A6; Appendix A) illustrated that E3 and E5, followed by E2, showed the highest representativeness and discriminating ability for CT, and thus could be suggested as the most suitable locations for breeding for CT. Regarding the correlation of CT with seed size, expressed by 1000 SW, our findings showed a negative correlation. The references in this issue are contradictory, as Erkine et al. [31] found a high positive correlation (r = 0.919) between CT and seed size, and suggested that seed size can be used to predict CT, whereas Theologidou et al. [74] and Ninou et al. [7] concluded the opposite results.
4.4. Market and Breeding Implications
A significant diversification and specialization of locations was identified with regards to the traits of major interest (SY, CP, CT). As a consequence, different locations were found to be suitable for each trait (Figure 4). The purpose of the cultivation was the criterion that would determine the selection of the location in which the lentil will be cultivated. As such, when the purpose of the cultivation was a high SY, disregarding the CP content or CT, locations E8 and Ε3, followed by E7, were the best. This is important for seed companies, or when high lentil production is needed for food or feed products that are not related to CP content or CT. In the case where the purpose of cultivation was the production of lentil varieties with a high CP content, the most suitable locations were E6 followed by E9 and E2. These locations could be selected for cases where high protein food or feed are required. The best quality for CT was found in lentil varieties cultivated in location E9, followed by E1. Those locations were considered suitable for lentil production directed for wide human consumption, or to niche markets that are interested in lentils certified as PGI (Protected Geographical Indication) or PDO (Protected Designation of Origin). Ιt should also be emphasized that E9 was the optimum location for lentil production of high quality, as it combined optimum performance for both CP content and CT.
Breeding must be applied in locations that are characterized by a high discriminating ability and representativeness. Therefore, when the purpose of cultivation is the selection for SY, the “ideal” locations were E4 and E3, followed by E10, whereas when the purpose was high CP, the “ideal” locations were E1 and E3, followed by E7. As far as CT is concerned, the “ideal” locations were E3 and E5, followed by E2. The above clearly indicates that location E3 was serving the three purposes, as it was “ideal” or close to “ideal” for the selection of superior genotypes for SY, CP and CT, and therefore is suggested as the optimum location for lentil breeding.
A comparative investigation of the general performance of the five genotypes for the three basic traits (SY, CP, CT) revealed that G2 had a genotypic profile characterized by the top CP and CT values, and high SY, while G1 was defined as the higher yielding cultivar for SY, with very good CT across the ten diverse test locations. Both cultivars indicated a wide adaptation capacity, and thus are suggested for cultivation in many regions. It is noteworthy that G2 had the highest CP content and CPY, and it could be reclaimed by food or feed industries that are interested in alternative high-protein products. This is even more important because, nowadays, progress in food processing technologies has opened new avenues for the application of lentil protein in novel food formulations [25]. Finally, G2 is considered a promising genetic material to be included in future breeding programs as a donor parent for quality and productive traits, whereas G1 would be suitable for seed production companies.
5. Conclusions
- (i).
- Significant G × L interactions were detected for SY, CP and CT. Different locations were found to be suitable for each trait. The purpose of the lentil cultivation is the key point that will determine the location in which the crop will be established.
- (ii).
- Breeding must be applied in locations that exhibit a high discriminating ability and representativeness, regardless of their productivity potential. Location E3 (Orestiada, Region of Thrace) was identified as “ideal” or close to “ideal” for the selection of superior genotypes for SY, CP, CT and CPY, and is recommended as the optimum location for breeding lentils for major agronomic and quality traits.
- (iii).
- Suitable genetic material was identified either for cultivation by lentil growers or for further improvement by breeding programs. Genotype G2 (cv. Dimitra) showed the top CP, CT and CPY values along with high SY, whereas G1 (cv. Samos) was the most productive cultivar for SY, with very good CT and high CPY. Both cultivars indicated a wide adaptation capacity, and thus are suggested for cultivation in many regions.
Author Contributions
Conceptualization, D.N.V., C.N., I.T. and A.M.; methodology, D.N.V., D.B. (Dimitrios Baxevanos), C.N. and A.L.; validation, D.B. (Dimitrios Baxevanos) and A.K.; formal analysis, D.B. (Dimitrios Baxevanos); investigation, A.K., E.T., C.P., S.K., D.B. (Dimitrios Beslemes), M.I., M.T., C.D. and A.L.; data curation, D.B., A.K., D.B. (Dimitrios Beslemes) and C.N.; writing—original draft preparation, D.B. (Dimitrios Baxevanos), A.K. and C.N.; writing—review and editing, D.N.V., D.B. (Dimitrios Baxevanos) and C.N.; visualization, A.K. and D.B.; supervision, D.N.V. and C.N.; project administration, D.N.V., I.T., A.M. and D.B. (Dimitrios Beslemes); funding acquisition, D.N.V., I.T. and A.M. All authors have read and agreed to the published version of the manuscript.
Funding
This research was cofinanced by the European Regional Development Fund of the European Union and Greek national funds through the Operational Program Competitiveness, Entrepreneurship and Innovation, under the call RESEARCH-CREATE-INNOVATE, (Project code: T1EDK-04633).
Institutional Review Board Statement
Not applicable.
Informed Consent Statement
Not applicable.
Data Availability Statement
The data presented in this study are available on request from the corresponding author. The data are not publicly available due to privacy restrictions.
Acknowledgments
We thank the staff of the Institute of Industrial and Forage Crops, the Farm of Aristotle University of Thessaloniki and the Department of Agricultural Development of Democritus University of Thrace for their help during the course of the experimentation. The authors also thank the field crew for conducting the samplings.
Conflicts of Interest
The authors declare no conflict of interest.
Appendix A

Figure A1.
GGE biplot with the “which-won-where” pattern based on the seed yield of five lentil genotypes (abbreviated G1–G5) across the ten locations (abbreviated E1–E10), based on the 2019 growing season.
Figure A1.
GGE biplot with the “which-won-where” pattern based on the seed yield of five lentil genotypes (abbreviated G1–G5) across the ten locations (abbreviated E1–E10), based on the 2019 growing season.
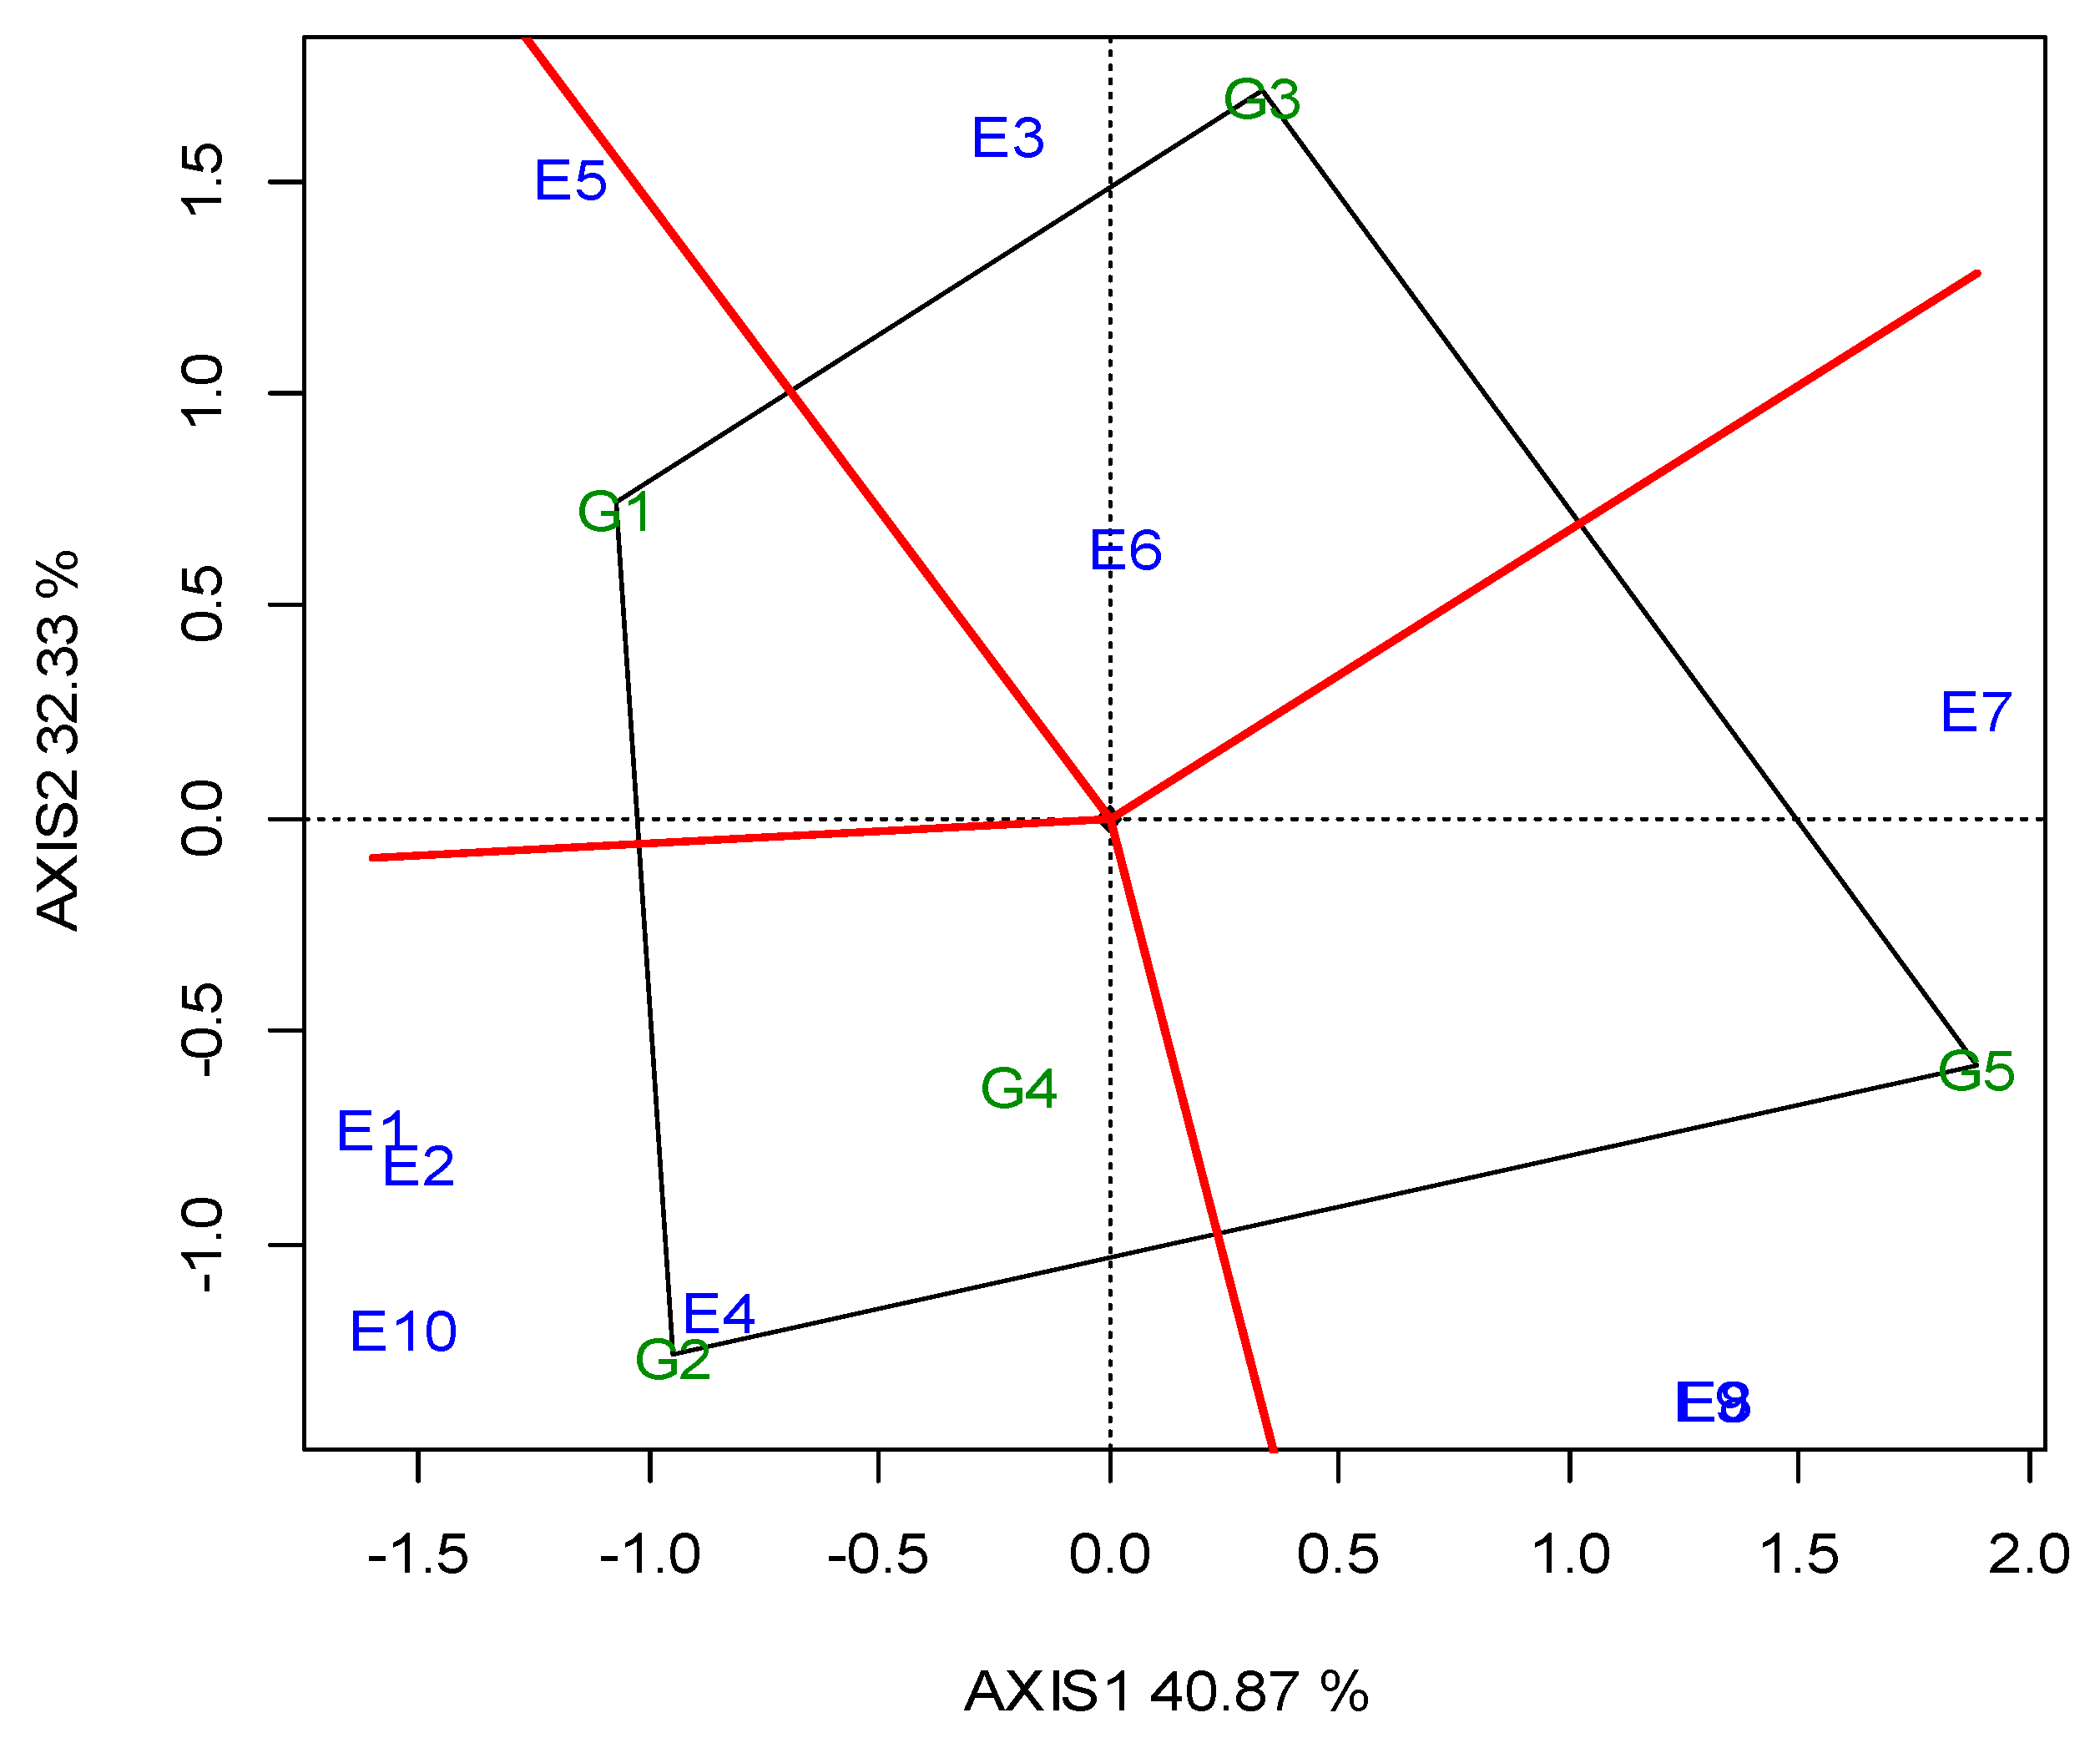
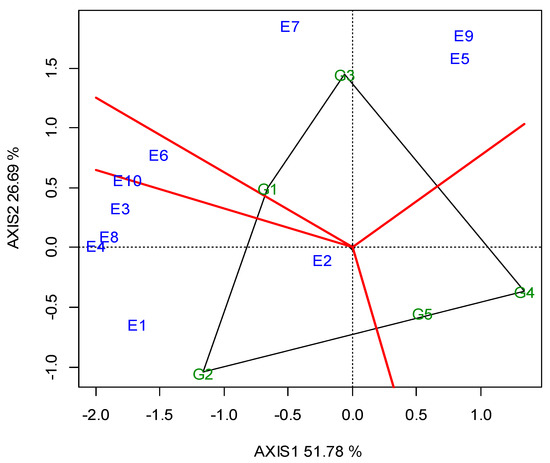
Figure A2.
GGE biplot with the “which-won-where” pattern based on the seed yield of the five lentil genotypes (abbreviated G1–G5) across the ten locations (abbreviated E1–E10), based on the 2020 growing season.
Figure A2.
GGE biplot with the “which-won-where” pattern based on the seed yield of the five lentil genotypes (abbreviated G1–G5) across the ten locations (abbreviated E1–E10), based on the 2020 growing season.


Figure A3.
GGE biplot with the “which-won-where” pattern, for the crude protein concentration of the five lentil genotypes (abbreviated G1–G5) across the ten locations (abbreviated E1–E10) in the two growing seasons (2019, 2020).
Figure A3.
GGE biplot with the “which-won-where” pattern, for the crude protein concentration of the five lentil genotypes (abbreviated G1–G5) across the ten locations (abbreviated E1–E10) in the two growing seasons (2019, 2020).
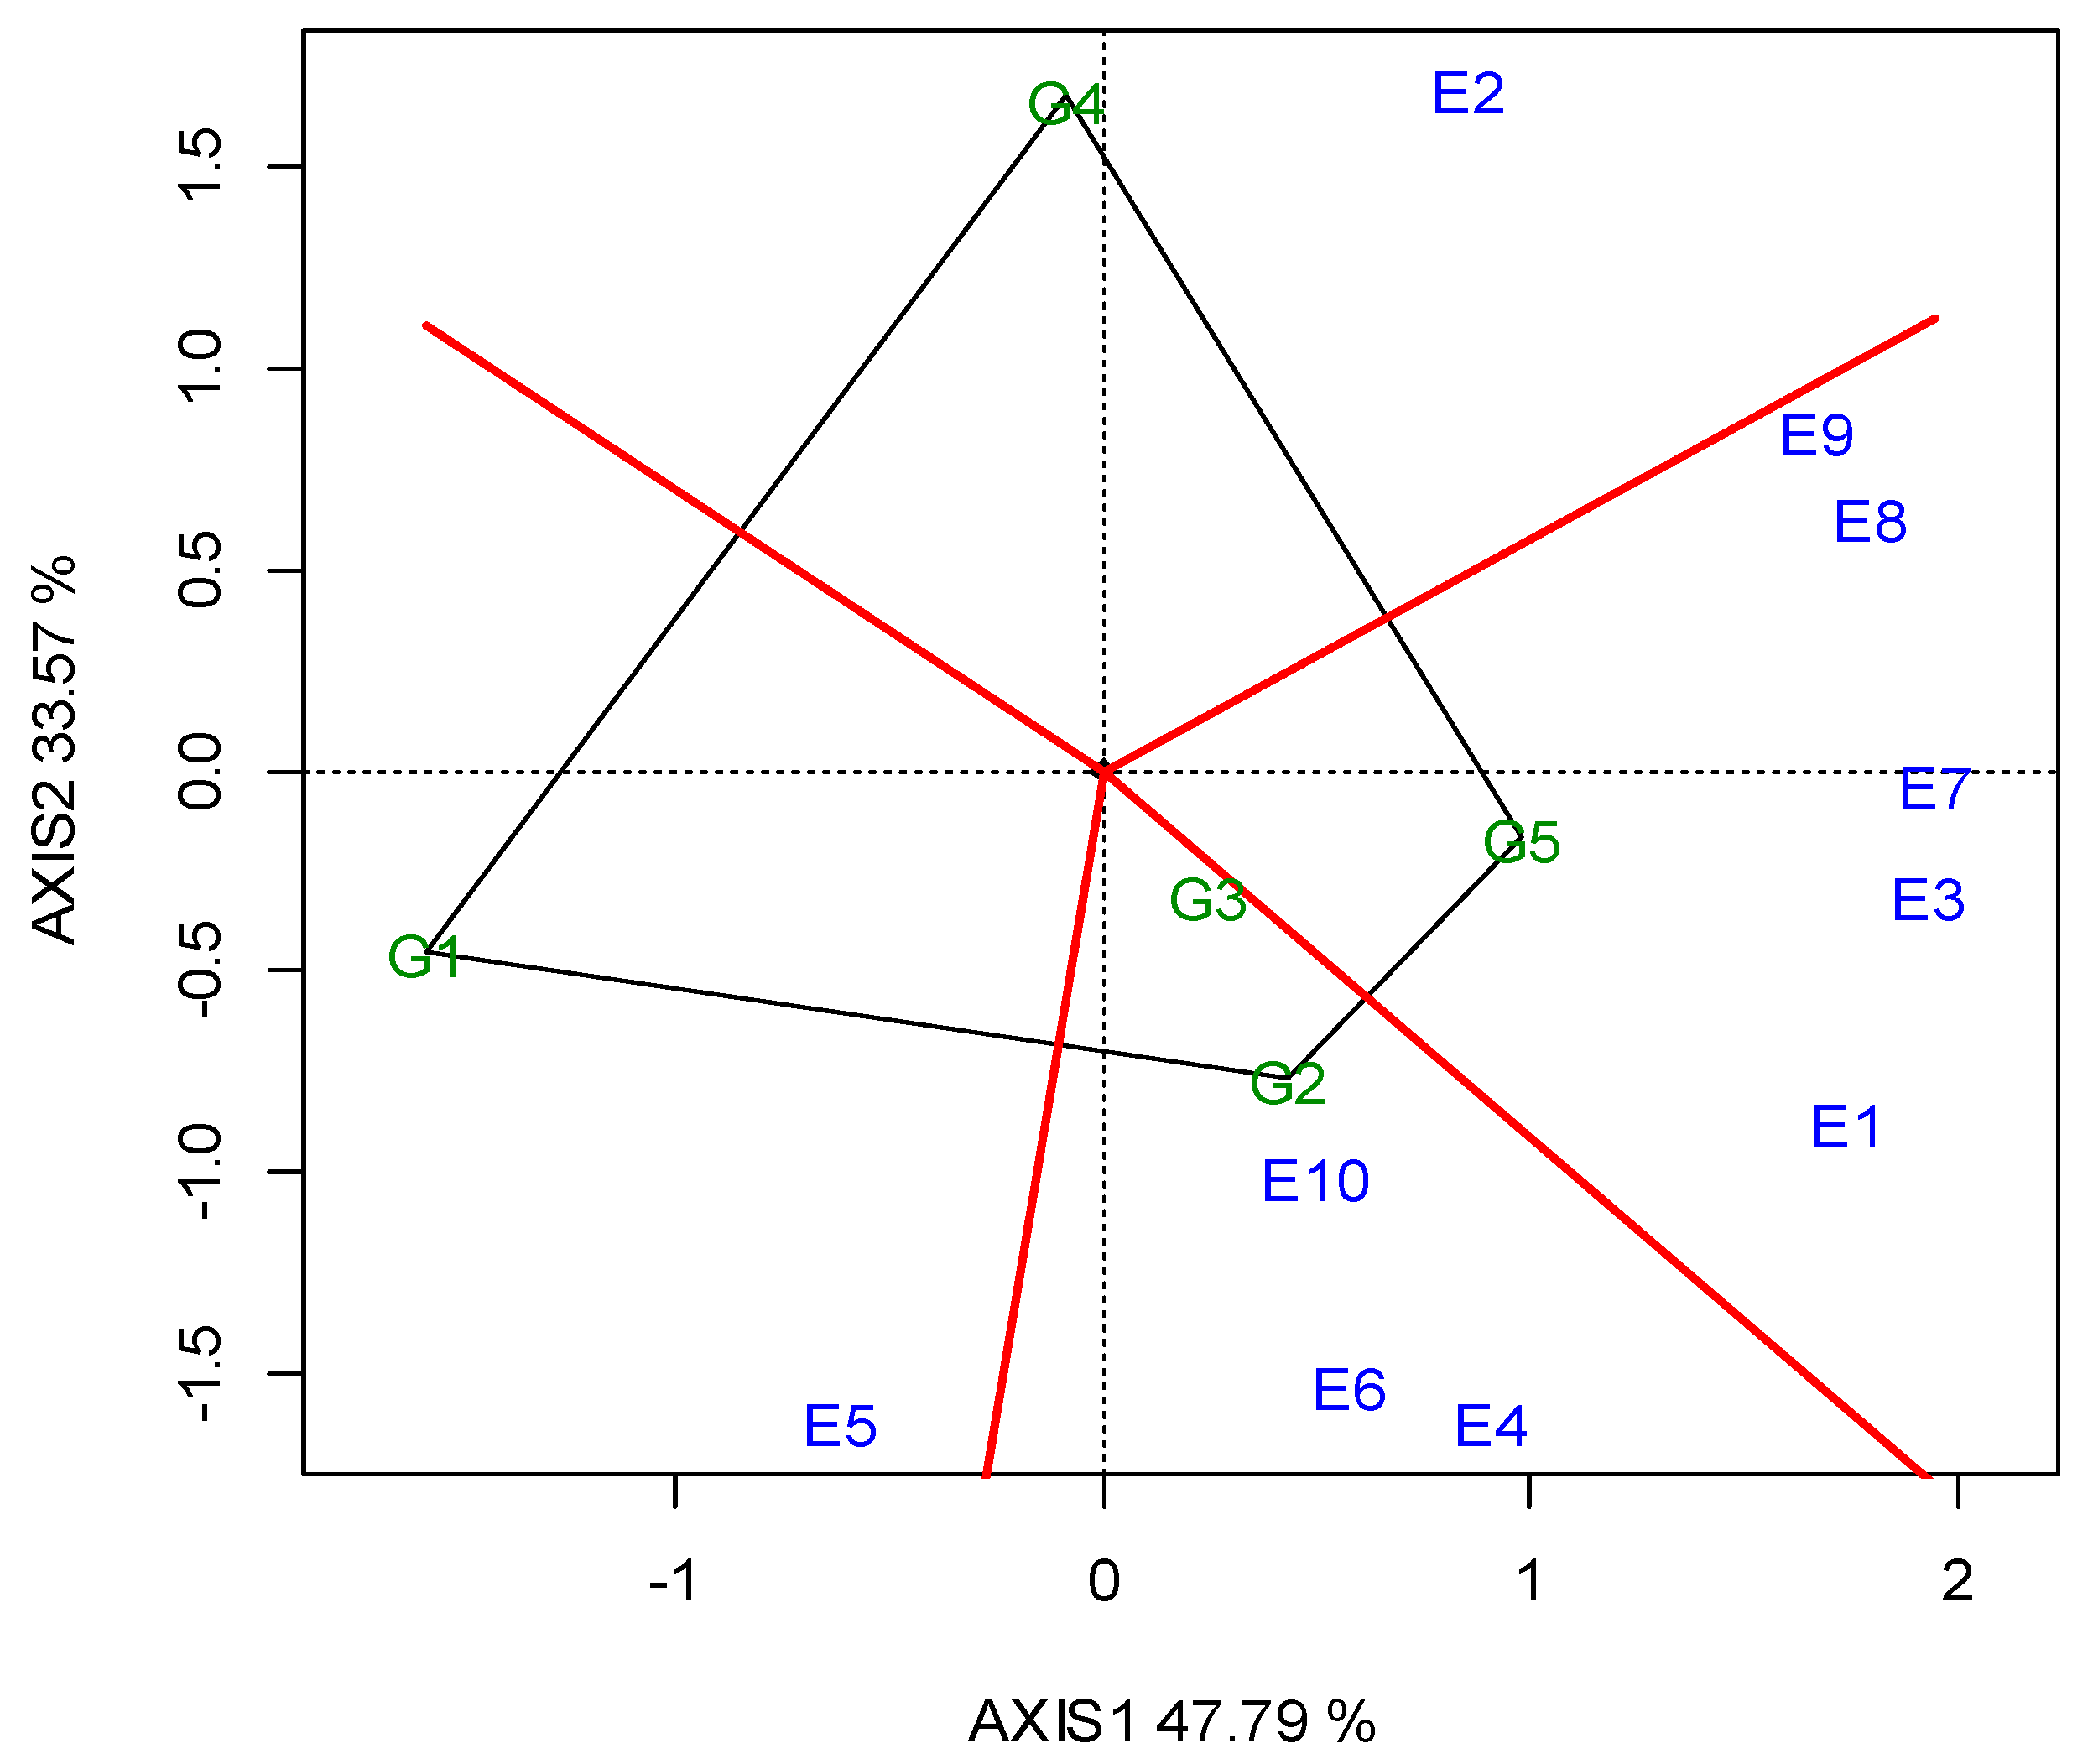

Figure A4.
GGE biplot for the crude protein concentration, with the ranking of locations (abbreviated E1–E10) against the “ideal” in the two growing seasons (2019, 2020).
Figure A4.
GGE biplot for the crude protein concentration, with the ranking of locations (abbreviated E1–E10) against the “ideal” in the two growing seasons (2019, 2020).
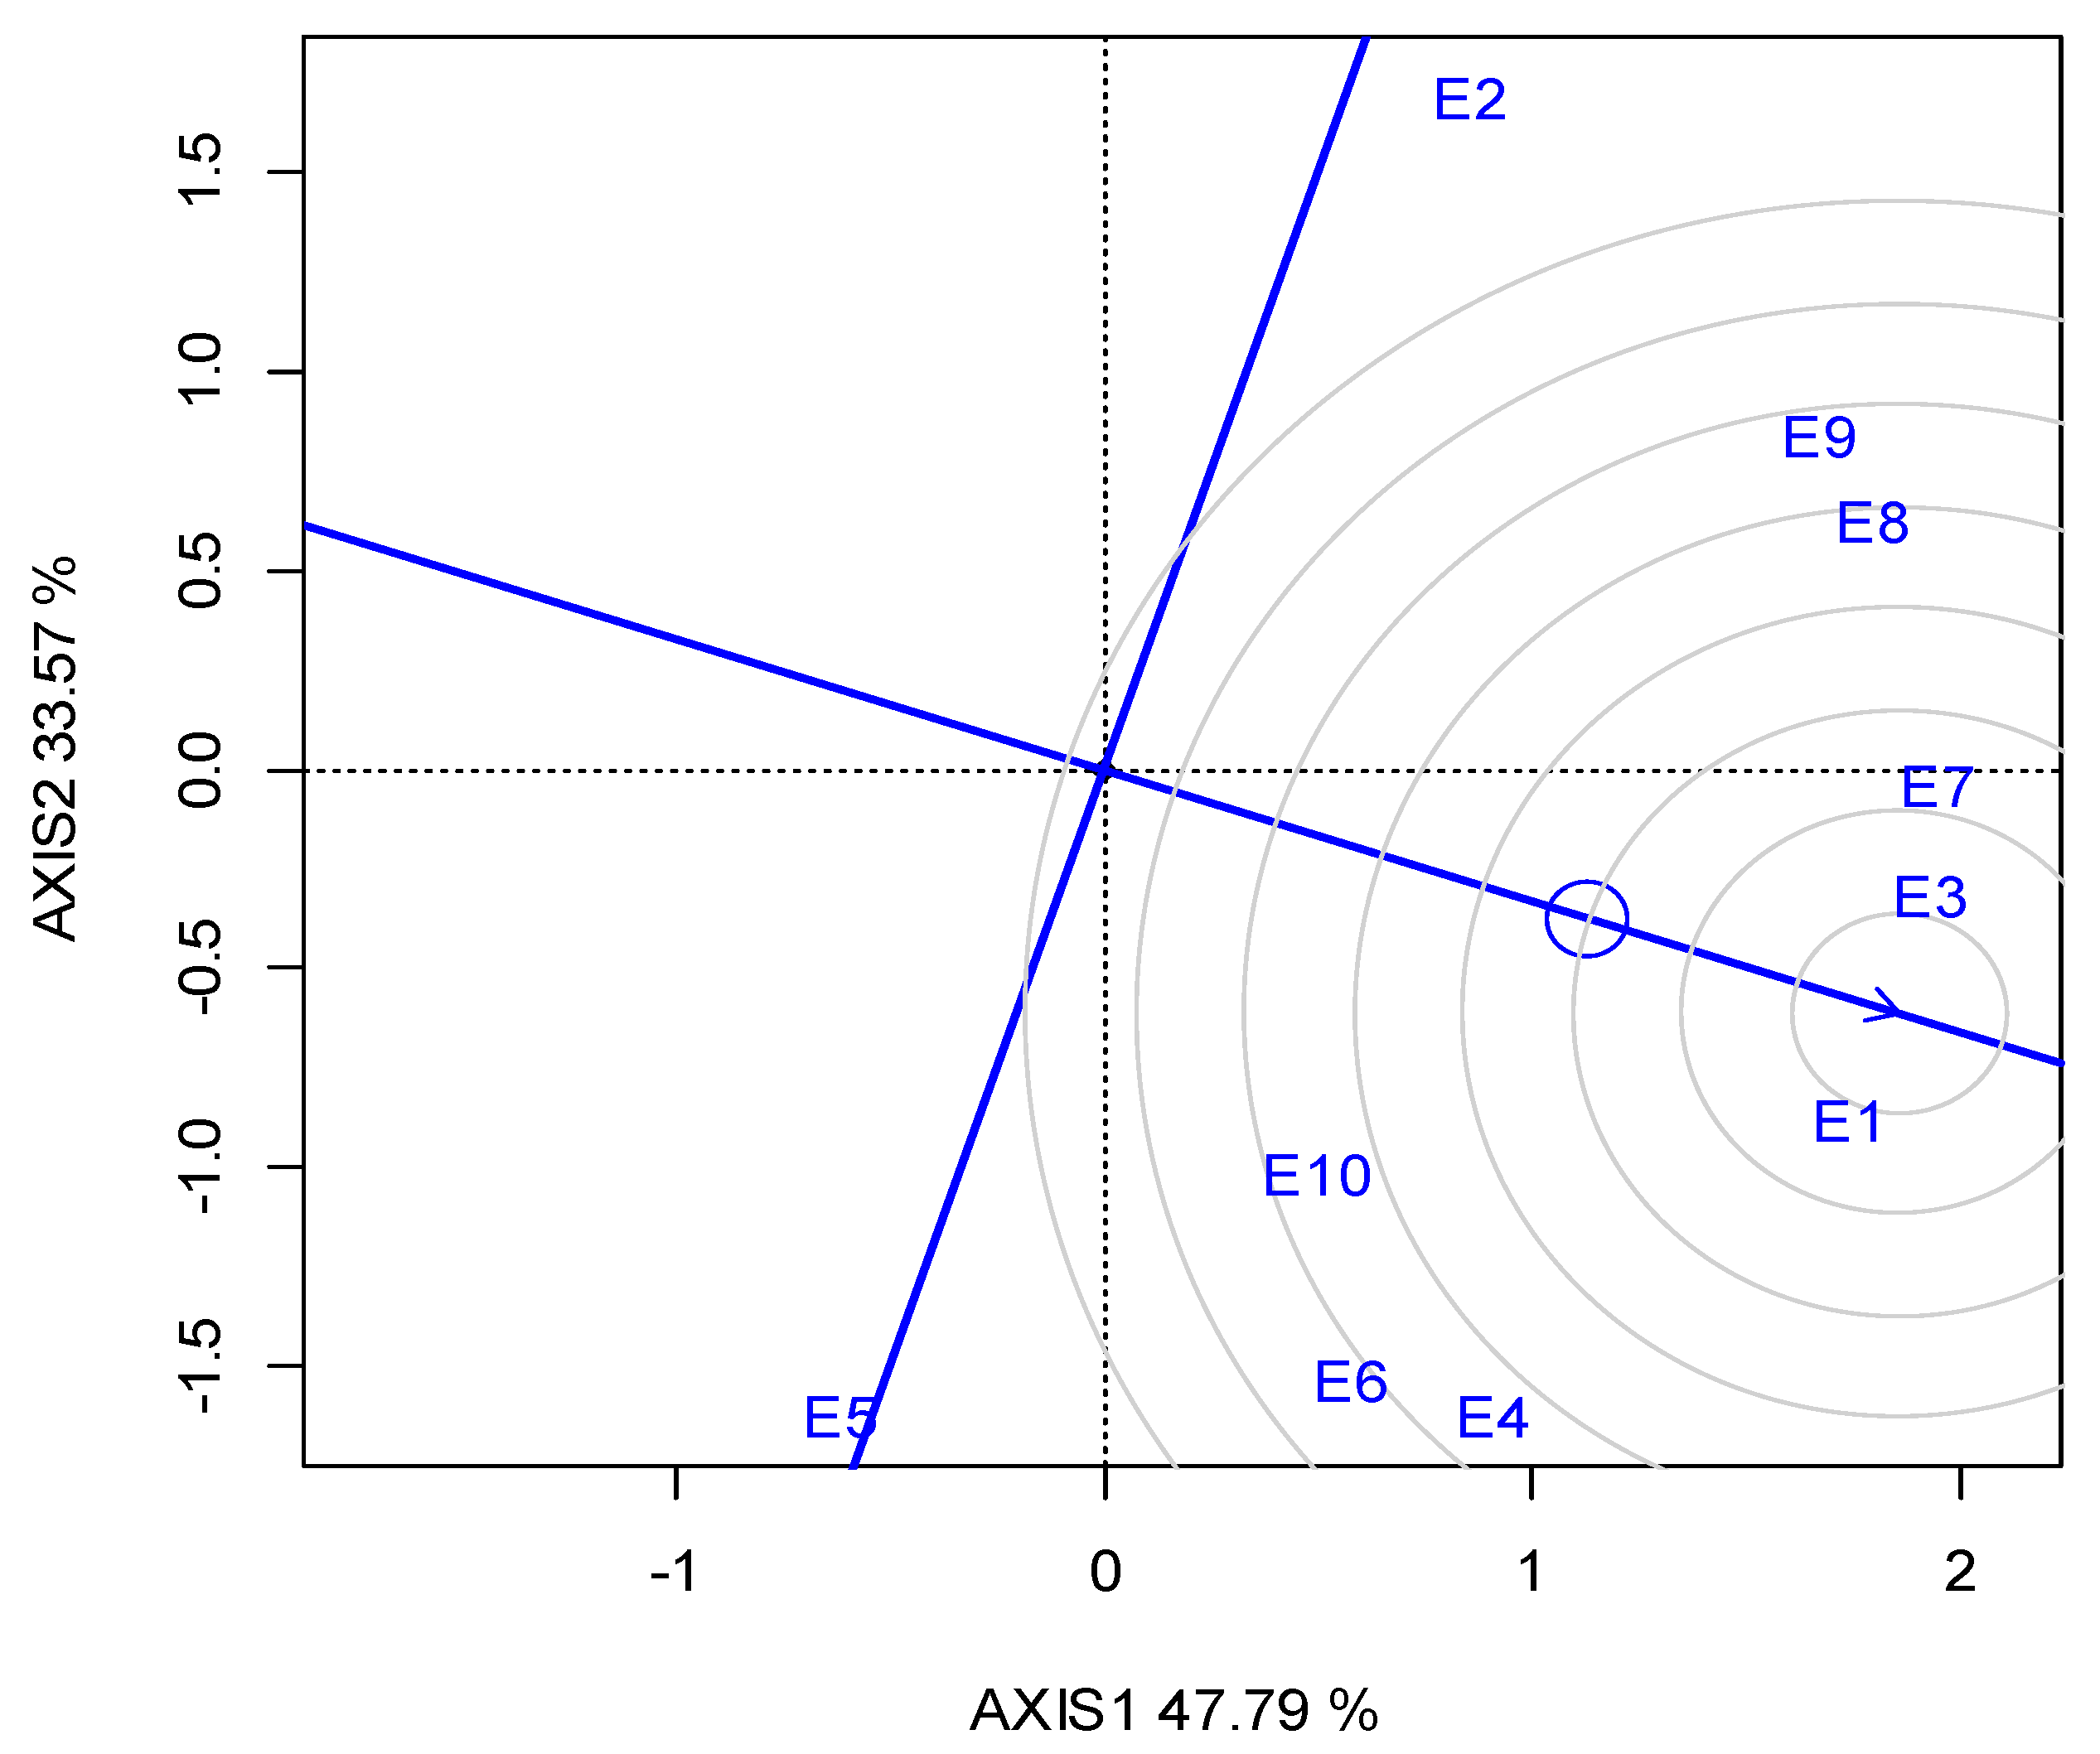

Figure A5.
GGE biplot for the cooking time with the “which-won-where” pattern of the five lentil genotypes (abbreviated G1–G5) across the ten locations (abbreviated E1–E10) and two growing seasons (2019, 2020).
Figure A5.
GGE biplot for the cooking time with the “which-won-where” pattern of the five lentil genotypes (abbreviated G1–G5) across the ten locations (abbreviated E1–E10) and two growing seasons (2019, 2020).

Figure A6.
GGE biplot for the cooking time with the ranking of locations (abbreviated E1–E10) against the “ideal” in the two growing seasons (2019, 2020).
Figure A6.
GGE biplot for the cooking time with the ranking of locations (abbreviated E1–E10) against the “ideal” in the two growing seasons (2019, 2020).
References
- Lev-Yadun, S.; Gopher, A.; Abbo, S. The cradle of agriculture. Science 2000, 288, 1602–1603. [Google Scholar] [CrossRef]
- Hansen, J.; Renfrew, J.M. Palaeolithic–Neolithic seed remains at Franchthi Cave, Greece. Nature 1978, 271, 349–352. [Google Scholar] [CrossRef]
- Sandhu, J.S.; Singh, S. History and origin. In Lentil: An Ancient Crop for Modern Times; Yadav, S.S., McNeil, D.L., Stevenson, P.C., Eds.; Springer: Dordrecht, The Netherlands, 2007; pp. 1–9. [Google Scholar] [CrossRef]
- Bahl, P.N.; Lal, S.; Sharma, B.M. An overview of the production and problems in South East Asia. In Lentil in South Asia, Proceedings of the Seminar on Lentils in South Asia, New Delhi, India, 11–15 March 1991; Erskine, W., Saxena, M.C., Eds.; ICARDA: Aleppo, Syria, 1993; pp. 1–10. [Google Scholar]
- Joshi, M.; Adhikari, B.; Aldred, P.; Panozzo, J.F.; Kasapis, S. Physicochemical and functional properties of lentil protein isolates prepared by different drying methods. Food Chem. 2011, 129, 1513–1522. [Google Scholar] [CrossRef]
- Sabaghnia, N.; Dehgani, H.; Sabaghpour, S.H. Nonparametric Methods for Interpreting Genotype × Environment Interaction of Lentil Genotypes. Crop Sci. 2006, 46, 1100–1106. [Google Scholar] [CrossRef]
- Ninou, E.; Papathanasiou, F.; Vlachostergios, D.N.; Mylonas, I.; Kargiotidou, A.; Pankou, C.; Papadopoulos, I.; Sinapidou, E.; Tokatlidis, I. Intense Breeding within Lentil Landraces for High-Yielding Pure Lines Sustained the Seed Quality Characteristics. Agriculture 2019, 9, 175. [Google Scholar] [CrossRef] [Green Version]
- Wang, N.; Hatcher, D.W.; Toews, R.; Gawalko, E.J. Influence of cooking and dehulling on nutritional composition of several varieties of lentils (Lens culinaris). LWT Food Sci. Technol. 2009, 42, 842–848. [Google Scholar] [CrossRef]
- Fratini, R.M.; de la Vega, M.P.; Sánchez, M.L.R. Lentil. In Broadening the Genetic Base of Grain Legumes; Singh, M., Bisht, M.S., Dutta, M., Eds.; Springer: New Delhi, India, 2014; pp. 115–148. [Google Scholar]
- Kakraliya, S.K.; Singh, U.; Bohra, A.; Choudhary, K.K.; Kumar, S.; Meena, R.S.; Jat, M.L. Nitrogen and Legumes: A Meta-analysis. In Legumes for Soil Health and Sustainable Management; Meena, R., Das, A., Yadav, G., Lal, R., Eds.; Springer: Singapore, 2018; pp. 277–314. [Google Scholar] [CrossRef]
- Shaha, Z.; Shahb, S.H.; Peoplesc, M.B.; Schwenked, G.D.; Herridge, D.F. Crop residue and fertilizer N effects on nitrogen fixation and yields of legume-cereal rotations and soil organic fertility. Field Crop. Res. 2003, 83, 1–11. [Google Scholar] [CrossRef]
- Mugwe, J.; Mugendi, D.N.; Mucheru-Muna, M.; Kungu, J. Soil inorganic N and N uptake by maize following application of legume biomass, tithonia, manure and mineral fertilizer in central Kenya. In Innovations as Key to the Green Revolution in Africa; Bationo, A., Waswa, B., Okeyo, J., Maina, F., Kihara, J., Eds.; Springer: Dordrecht, The Netherland, 2011; pp. 605–612. [Google Scholar] [CrossRef]
- FAO (Food and Agriculture Organization of the United Nations). Crops; FAOSTAT 2019: Rome, Italy, 2019; Available online: http://www.fao.org/faostat/en/#data/QC/visualize (accessed on 17 June 2021).
- Sehgal, A.; Sita, K.; Rehman, A.; Farooq, M.; Kumar, S.; Yadav, R.; Nayyar, H.; Singh, S.; Siddique, K.H.M. Chapter 13—Lentil. In Crop Physiology Case Histories for Major Crops; Sadras, V.O., Calderini, D.F., Eds.; Academic Press: Cambridge, MA, USA, 2021; pp. 408–428. [Google Scholar] [CrossRef]
- Muehlbauer, F.J.; Kaiser, W.J.; Clement, S.L.; Summerfield, R.J. Production and Breeding of Lentil; Sparks, D.L., Ed.; Advances in Agronomy; Academic Press: San Diego, CA, USA, 1995; Volume 54, pp. 283–332. [Google Scholar] [CrossRef]
- Erskine, W.; Sarker, A. Lentil-Breeding. In Encyclopedia of Grain Science; Wrigley, C., Corke, H., Walker, C., Eds.; Elsevier: Amsterdam, The Netherlands, 2004; pp. 142–150. [Google Scholar]
- Muehlbauer, F.J.; Cho, S.; Sarker, A.; McPhee, K.E.; Coyne, C.J.; Rajesh, P.N.; Ford, R. Application of biotechnology in breeding lentil for resistance to biotic and abiotic stress. Euphytica 2006, 147, 149–165. [Google Scholar] [CrossRef]
- Sabaghnia, N.; Dehghani, H.; Sabaghpour, S.H. Graphic Analysis of Genotype by Environment Interaction for Lentil Yield in Iran. Agron. J. 2008, 100, 760–764. [Google Scholar] [CrossRef]
- Khazaei, H.; Caron, C.T.; Fedoruk, M.; Diapari, M.; Vandenberg, A.; Coyne, C.J.; McGee, R.; Bett, K.E. Genetic diversity of cultivated lentil (Lens culinaris Medik.) and its relation to the World’s agro-ecological zones. Front. Plant Sci. 2016, 7, 1093. [Google Scholar] [CrossRef] [Green Version]
- Yan, W.; Hunt, L.A.; Sheng, Q.; Szlavnics, Z. Cultivar evaluation and mega-environment investigation based on the GGE biplot. Crop Sci. 2000, 40, 597–605. [Google Scholar] [CrossRef]
- Yan, W.; Kang, M.S. GGE Biplot Analysis: A Graphical Tool for Breeders, Geneticists, and Agronomists, 1st ed.; CRC Press: Boca Raton, FL, USA, 2002. [Google Scholar] [CrossRef]
- Tahir, M.; Lindeboom, N.; Båga, M.; Vandenberg, A.; Ravindra, C.N. Composition and correlation between major seed constituents in selected lentil (Lens culinaris. Medik). Can. J. Plant Sci. 2011, 91, 825–835. [Google Scholar] [CrossRef]
- Savage, G.P. Antinutritional factors in peas. In Recent Advances of Research in Antinutritional Factors in Legume Seeds; Huisman, J., van der Poel, T.F.B., Liener, I.E., Eds.; Centre for Agricultural Publishing and Documentation: Wageningen, The Netherlands, 1989; pp. 342–350. [Google Scholar]
- Wang, N.; Daun, J.K. Effects of variety and crude protein content on nutrients and anti-nutrients in lentils (Lens culinaris). Food Chem. 2006, 95, 493–502. [Google Scholar] [CrossRef]
- Joshi, M.; Timilsena, Y.; Adhikari, B. Global production, processing and utilization of lentil: A review. J. Integ. Agric. 2017, 16, 2898–2913. [Google Scholar] [CrossRef]
- Subedi, M.; Khazaei1, H.; Arganosa, G.; Etukudo, E.; Vandenberg, A. Genetic stability and genotype × environment interaction analysis for seed protein content and protein yield of lentil. Crop Sci. 2020, 61, 342–356. [Google Scholar] [CrossRef]
- Heuzé, V.; Tran, G.; Sauvant, D.; Bastianelli, D.; Lebas, F. Lentil (Lens culinaris). Feedipedia 2015. Available online: https://www.feedipedia.org/node/284 (accessed on 20 May 2021).
- Kumar, J.; Singh, J.; Kanaujia, R.; Gupta, S. Protein content in wild and cultivated taxa of lentil (Lens culinaris ssp. culinaris Medikus). Indian J. Genet 2016, 76, 631–634. [Google Scholar] [CrossRef] [Green Version]
- Khazaei, H.; Subedi, M.; Nickerson, M.; Martínez-Villaluenga, C.; Frias, J.; Vandenberg, A. Seed protein of lentils: Current status, progress, and food applications. Foods 2019, 8, 391. [Google Scholar] [CrossRef] [Green Version]
- Williams, P.C.; Nakoul, H.; Singh, K.B. Relationship between cooking time and some physical characteristics in chickpeas (Cicer arietinum L.). J. Sci. Food Agric. 1983, 34, 492–496. [Google Scholar] [CrossRef]
- Erskine, W.; Williams, P.C.; Nakkoul, H. Genetic and environmental variation in the seed size, protein, yield, and cooking quality of lentils. Field Crop. Res. 1985, 12, 153–161. [Google Scholar] [CrossRef]
- Bressani, R.; Elías, L.G. Seed quality and nutritional goals in pea, lentil, faba bean and chickpea breeding. In World Crops: Cool Season Food Legumes. Current Plant Science and Biotechnology in Agriculture; Summerfield, R.J., Ed.; Springer: Dordrecht, The Netherland, 1988; pp. 381–404. [Google Scholar] [CrossRef]
- Wassimi, N.; Abu-Shakra, S.; Tannous, R.; Hallab, A.H. Effect of mineralnutrition on cooking quality of lentils. Can. J. Plant Sci. 1978, 58, 165. [Google Scholar] [CrossRef] [Green Version]
- Bhatty, R.S.; Nielsen, M.A.; Slinkard, A.E. Comparison of the cooking quality of Laird and commercial Chilean lentils grown in the Canadian Prairies. Can. Inst. Food Sci. Technol. J. 1983, 16, 104–110. [Google Scholar] [CrossRef]
- Bhatty, R.S.; Nielsen, M.A.; Slinkard, A.E. Cooking quality of lentils grown in the Canadian Prairies. Can. J. Plant Sci. 1984, 64, 17–24. [Google Scholar] [CrossRef] [Green Version]
- Wood, J.A. Evaluation of Cooking Time in Pulses: A Review. Cereal Chem. 2017, 94, 32–48. [Google Scholar] [CrossRef]
- Tokatlidis, I.; Vlachostergios, D. Sustainable Stewardship of the Landrace Diversity. Diversity 2016, 8, 29. [Google Scholar] [CrossRef]
- Peel, M.C.; Finlayson, B.L.; McMahon, T.A. Updated world map of the Köppen-Geiger climate classification. Hydrol. Earth Syst. Sci. 2007, 11, 1633–1644. [Google Scholar] [CrossRef] [Green Version]
- Beck, H.E.; Zimmermann, N.E.; McVicar, T.R.; Vergopolan, N.; Berg, A.; Wood, E.F. Present and future Köppen-Geiger climate classification maps at 1-km resolution. Sci. Data 2018, 5, 180214. [Google Scholar] [CrossRef] [PubMed] [Green Version]
- Yassoglou, N.; Nychas, A.; Kosmas, C. Parametric designation of mapping units for soil surveys and land evaluation in Greece based on Soil Taxonomy. In Agronomy Abstracts, Proceedings of the Diamond Jubilee of the American Society of Agronomy, 74th Annual Meeting; American Society of Agronomy–Crop Science Society of America–Soil Science Society of America: Anaheim, CA, USA, 1982; p. 212. [Google Scholar]
- WRB (World Reference Base for Soil Resources 2015). World Reference Base for Soil Resources 2014, Update 2015 International Soil Classification System for Naming Soils and Creating Legends for Soil Maps; World Soil Resources Reports No. 106; International Union of Soil Sciences; FAO: Rome, Italy, 2015. [Google Scholar]
- Gee, G.W.; Bauder, J.W. Particle-size analysis. In Methods of Soil Analysis: Part. 1–Physical and Mineralogical Methods; Soil Society of America: Madison, WI, USA, 1986; pp. 383–411. [Google Scholar]
- McLean, E.O. Soil pH and lime requirement. In Methods of Soil Analysis: Part 2—Chemical and Microbiological Properties; American Society Agronomy: Madison, WI, USA, 1982; pp. 199–224. [Google Scholar]
- Bower, C.A.; Wilcox, L.V. Soluble salts. In Methods of Soil Chemical Analysis: Part 2—Chemical and Microbiological Properties; American Society Agronomy: Madison, WI, USA, 1965; pp. 933–951. [Google Scholar]
- Nelson, D.W.; Sommers, L.E. Total carbon, organic carbon and organic matter. In Methods of Soil Analysis: Part 2—Chemical and Microbiological Properties; American Society Agronomy: Madison, WI, USA, 1982; pp. 539–579. [Google Scholar]
- Allison, L.E.; Moodie, C.D. Carbonates. In Methods of Soil Analysis: Part 2—Chemical and Microbiological Properties; American Society Agronomy: Madison, WI, USA, 1965; pp. 1389–1396. [Google Scholar]
- Olsen, S.R.; Dean, L.A. Phosphorus. In Methods of Soil Chemical Analysis: Part 2—Chemical and Microbiological Properties; American Society Agronomy: Madison, WI, USA, 1965; pp. 1035–1049. [Google Scholar]
- Meier, U. Growth Stages of Mono-and Dicotyledonous Plants. BBCH Monograph, 2nd ed.; Blackwell Science: Berlin, Germany, 2001; p. 158. [Google Scholar]
- Taiwo, A.; Akanbi, O.C.; Ajibola, O.O. The effects of soaking and cooking time on the cooking properties of two cowpea varieties. J. Food Eng. 1997, 33, 337–346. [Google Scholar] [CrossRef]
- McIntosh, M.S. Analysis of combined experiments. Agron. J. 1983, 75, 153–155. [Google Scholar] [CrossRef]
- Kozak, M.; Piepho, H.P. What’s normal anyway? Residual plots are more telling than significance tests when checking ANOVA assumptions. J. Agron. Crop Sci. 2018, 204, 86–98. [Google Scholar] [CrossRef]
- SAS Institute. JMP 11.0.0; SAS Institute Inc.: Cary, NC, USA, 2013. [Google Scholar]
- IBM Corp. IBM SPSS Statistics for Windows, Version 23.0; IBM Corp.: Armonk, NY, USA, 2015. [Google Scholar]
- Frutos, E.; Galindo, M.P.; Leiva, V. An interactive biplot implementation in R for modeling genotype-by-environment interaction. Stoch. Environ. Res. Risk. Assess. 2014, 28, 1629–1641. [Google Scholar] [CrossRef]
- Bernardo, R. Breeding for Quantitative Traits in Plants; Stemma Press: Woodbury, MN, USA, 2002; p. 369. [Google Scholar]
- Vlachostergios, D.N.; Roupakias, D.G. Response to conventional and organic environment of thirty-six lentil (Lens culinaris Medik.) varieties. Euphytica 2008, 163, 449–457. [Google Scholar] [CrossRef]
- Pandey, A.; Singh, D.P.; Singh, B.B. Evaluation of Indigenous Germplasm for Yield and Yield Components in Lentil (Lens culinaris Medik.); Research Bulletin No.1 N. D.; University of Agriculture and Technology: Faizabad, India, 1992; p. 45. [Google Scholar]
- Tyagi, S.D.; Khan, M.H. Studies on genetic variability and interrelationship among the different traits in Microsperma lentil (Lens culinaris Medik). J. Agric. Biotech. Sustain. Dev. 2010, 2, 15–20. [Google Scholar] [CrossRef]
- Salehi, M.; Haghnazari, A.; Shekari, F.; Faramarzi, A. The Study of Seed Yield and Seed Yield Components of Lentil (Lens culinaris Medik) under Normal and Drought Stress Conditions. Pak. J. Biol. Sci. 2008, 11, 758–762. [Google Scholar] [CrossRef] [PubMed]
- Siddiqui, M.A.; Khan, M.T.; Nizamani, G.S.; Yasmeen, S.; Khan, I.A.; Khatri, A.; Soomro, N.S. Field evaluation of high yielding genotypes of lentil (Lens culinaris Medik.) developed through induced mutagenesis. Pak. J. Agric. Res. 2020, 33, 164–169. [Google Scholar] [CrossRef]
- Hamdi, A.; Erskine, W.; Gates, P. Adaptation of Lentil Seed Yield to Varying Moisture Supply. Crop Sci. 1992, 32, 987–990. [Google Scholar] [CrossRef]
- Rowley, M.C.; Grand, S.; Adatte, T.; Verrecchia, E.P. A cascading influence of calcium carbonate on the biogeochemistry and pedogenic trajectories of subalpine soils, Switzerland. Geoderma 2020, 361, 114065. [Google Scholar] [CrossRef]
- Lizarazo, C.I.; Lampi, A.M.; Liu, J.; Sontag-Strohm, T.; Piironen, V.; Stoddard, F.L. Nutritive quality and protein production from grain legumes in a boreal climate. J. Sci. Food Agric. 2015, 95, 2053–2064. [Google Scholar] [CrossRef] [Green Version]
- Stoddard, F.L.; Marshall, D.R.; Ali, S.M. Variability in grain protein concentration of peas and lentils grown in Australia. Aust. J. Agric. Res. 1993, 44, 1415–1419. [Google Scholar] [CrossRef]
- Chauhan, M.P.; Singh, I.S. Inheritance of protein content in lentil ( Lens culinaris Medik). Legum. Res. 1995, 18, 5–8. [Google Scholar]
- Subedi, M.; Bett, K.E.; Khazaei, H.; Vandenberg, A. Genetic Mapping of milling quality traits in lentil (Lens culinaris Medik.). Plant Genome 2018, 11, 170092. [Google Scholar] [CrossRef] [PubMed] [Green Version]
- Le, B.H.; Wagmaister, J.A.; Kawashima, T.; Bui, A.Q.; Harada, J.J.; Goldberg, R.B. Using genomics to study legume seed development. Plant Physiol. 2007, 144, 562–574. [Google Scholar] [CrossRef] [PubMed] [Green Version]
- Hamdi, A.; Erskine, W.; Gates, P. Relationships among economic characters in lentil. Euphytica 1991, 57, 109–116. [Google Scholar] [CrossRef]
- Rana, M.; Sood, A.; Hussain, W.; Kaldate, R.; Sharma, T.R.; Gill, R.K.; Agrawal, S.K.; Singh, S. Gene Pyramiding and Multiple Character Breeding. In Lentils: Potential Resources for Enhancing Genetic Gains; Singh, M., Ed.; Elsevier: Amsterdam, The Netherlands, 2019; pp. 83–124. [Google Scholar] [CrossRef]
- Vakali, C.; Baxevanos, D.; Vlachostergios, D.; Tamoutsidis, E.; Papathanasiou, F.; Papadopoulos, I. Genetic characterization of agronomic, physiochemical, and quality parameters of dry bean landraces under low-input farming. J. Agric. Sci. Technol. 2017, 19, 757–767. [Google Scholar]
- Kazai, P.; Noulas, C.; Khah, E.; Vlachostergios, D. Yield and seed quality parameters of common bean cultivars grown under water and heat stress field conditions. AIMS Agric. Food 2019, 4, 285–302. [Google Scholar] [CrossRef]
- Jood, S.; Bishnoi, S.; Sharma, A. Chemical analysis and physico-chemical properties of chickpea and lentil cultivars. Nahrung 1998, 42, 71–74. [Google Scholar] [CrossRef]
- Vandenberg, A. Postharvest processing and value addition. In The Lentil: Botany, Production and Uses; Erskine, W., Muehlbauer, F., Sarker, A., Sharma, B., Eds.; CABI: Oxford, UK, 2009; pp. 391–408. [Google Scholar]
- Theologidou, G.S.; Lazaridou, A.; Zorić, L.; Tsialtas, I.T. Cooking Quality of Lentils Produced under Mediterranean Conditions. Crop Sci. 2018, 58, 2121–2130. [Google Scholar] [CrossRef]
- Wang, N. Effect of variety and crude protein content on dehulling quality and on the resulting chemical composition of red lentil (Lens culinaris). J. Sci. Food Agric. 2008, 88, 885–890. [Google Scholar] [CrossRef]
- Ross, K.A.; Alejo-Lucas, D.; Malcolmson, L.; Arntfield, S.D.; Cenkowski, S. Interpretation of the force–deformation curves of cooked red lentils (Lens culinaris). J. Texture Stud. 2009, 40, 109–126. [Google Scholar] [CrossRef]
- Iliadis, C. Influence of genotype and soil type on cooking time in lentil (Lens culinaris Medikus). Int. J. Food Sci. Technol. 2003, 38, 89–93. [Google Scholar] [CrossRef]
- Vlachostergios, D.N.; Tzantarmas, C.; Kargiotidou, A.; Ninou, E.; Pankou, C.; Gaintatzi, C.; Mylonas, I.; Papadopoulos, I.; Foti, C.; Chatzivassiliou, E.K.; et al. Single-plant selection within lentil landraces at ultra-low density: A short-time tool to breed high yielding and stable varieties across divergent environments. Euphytica 2018, 214, 58. [Google Scholar] [CrossRef]
Publisher’s Note: MDPI stays neutral with regard to jurisdictional claims in published maps and institutional affiliations. |
© 2021 by the authors. Licensee MDPI, Basel, Switzerland. This article is an open access article distributed under the terms and conditions of the Creative Commons Attribution (CC BY) license (https://creativecommons.org/licenses/by/4.0/).