
Synthesis of Two Decades of US EPA’s Ecosystem Services Research to Inform Environmental, Community and Sustainability Decision Making


Abstract
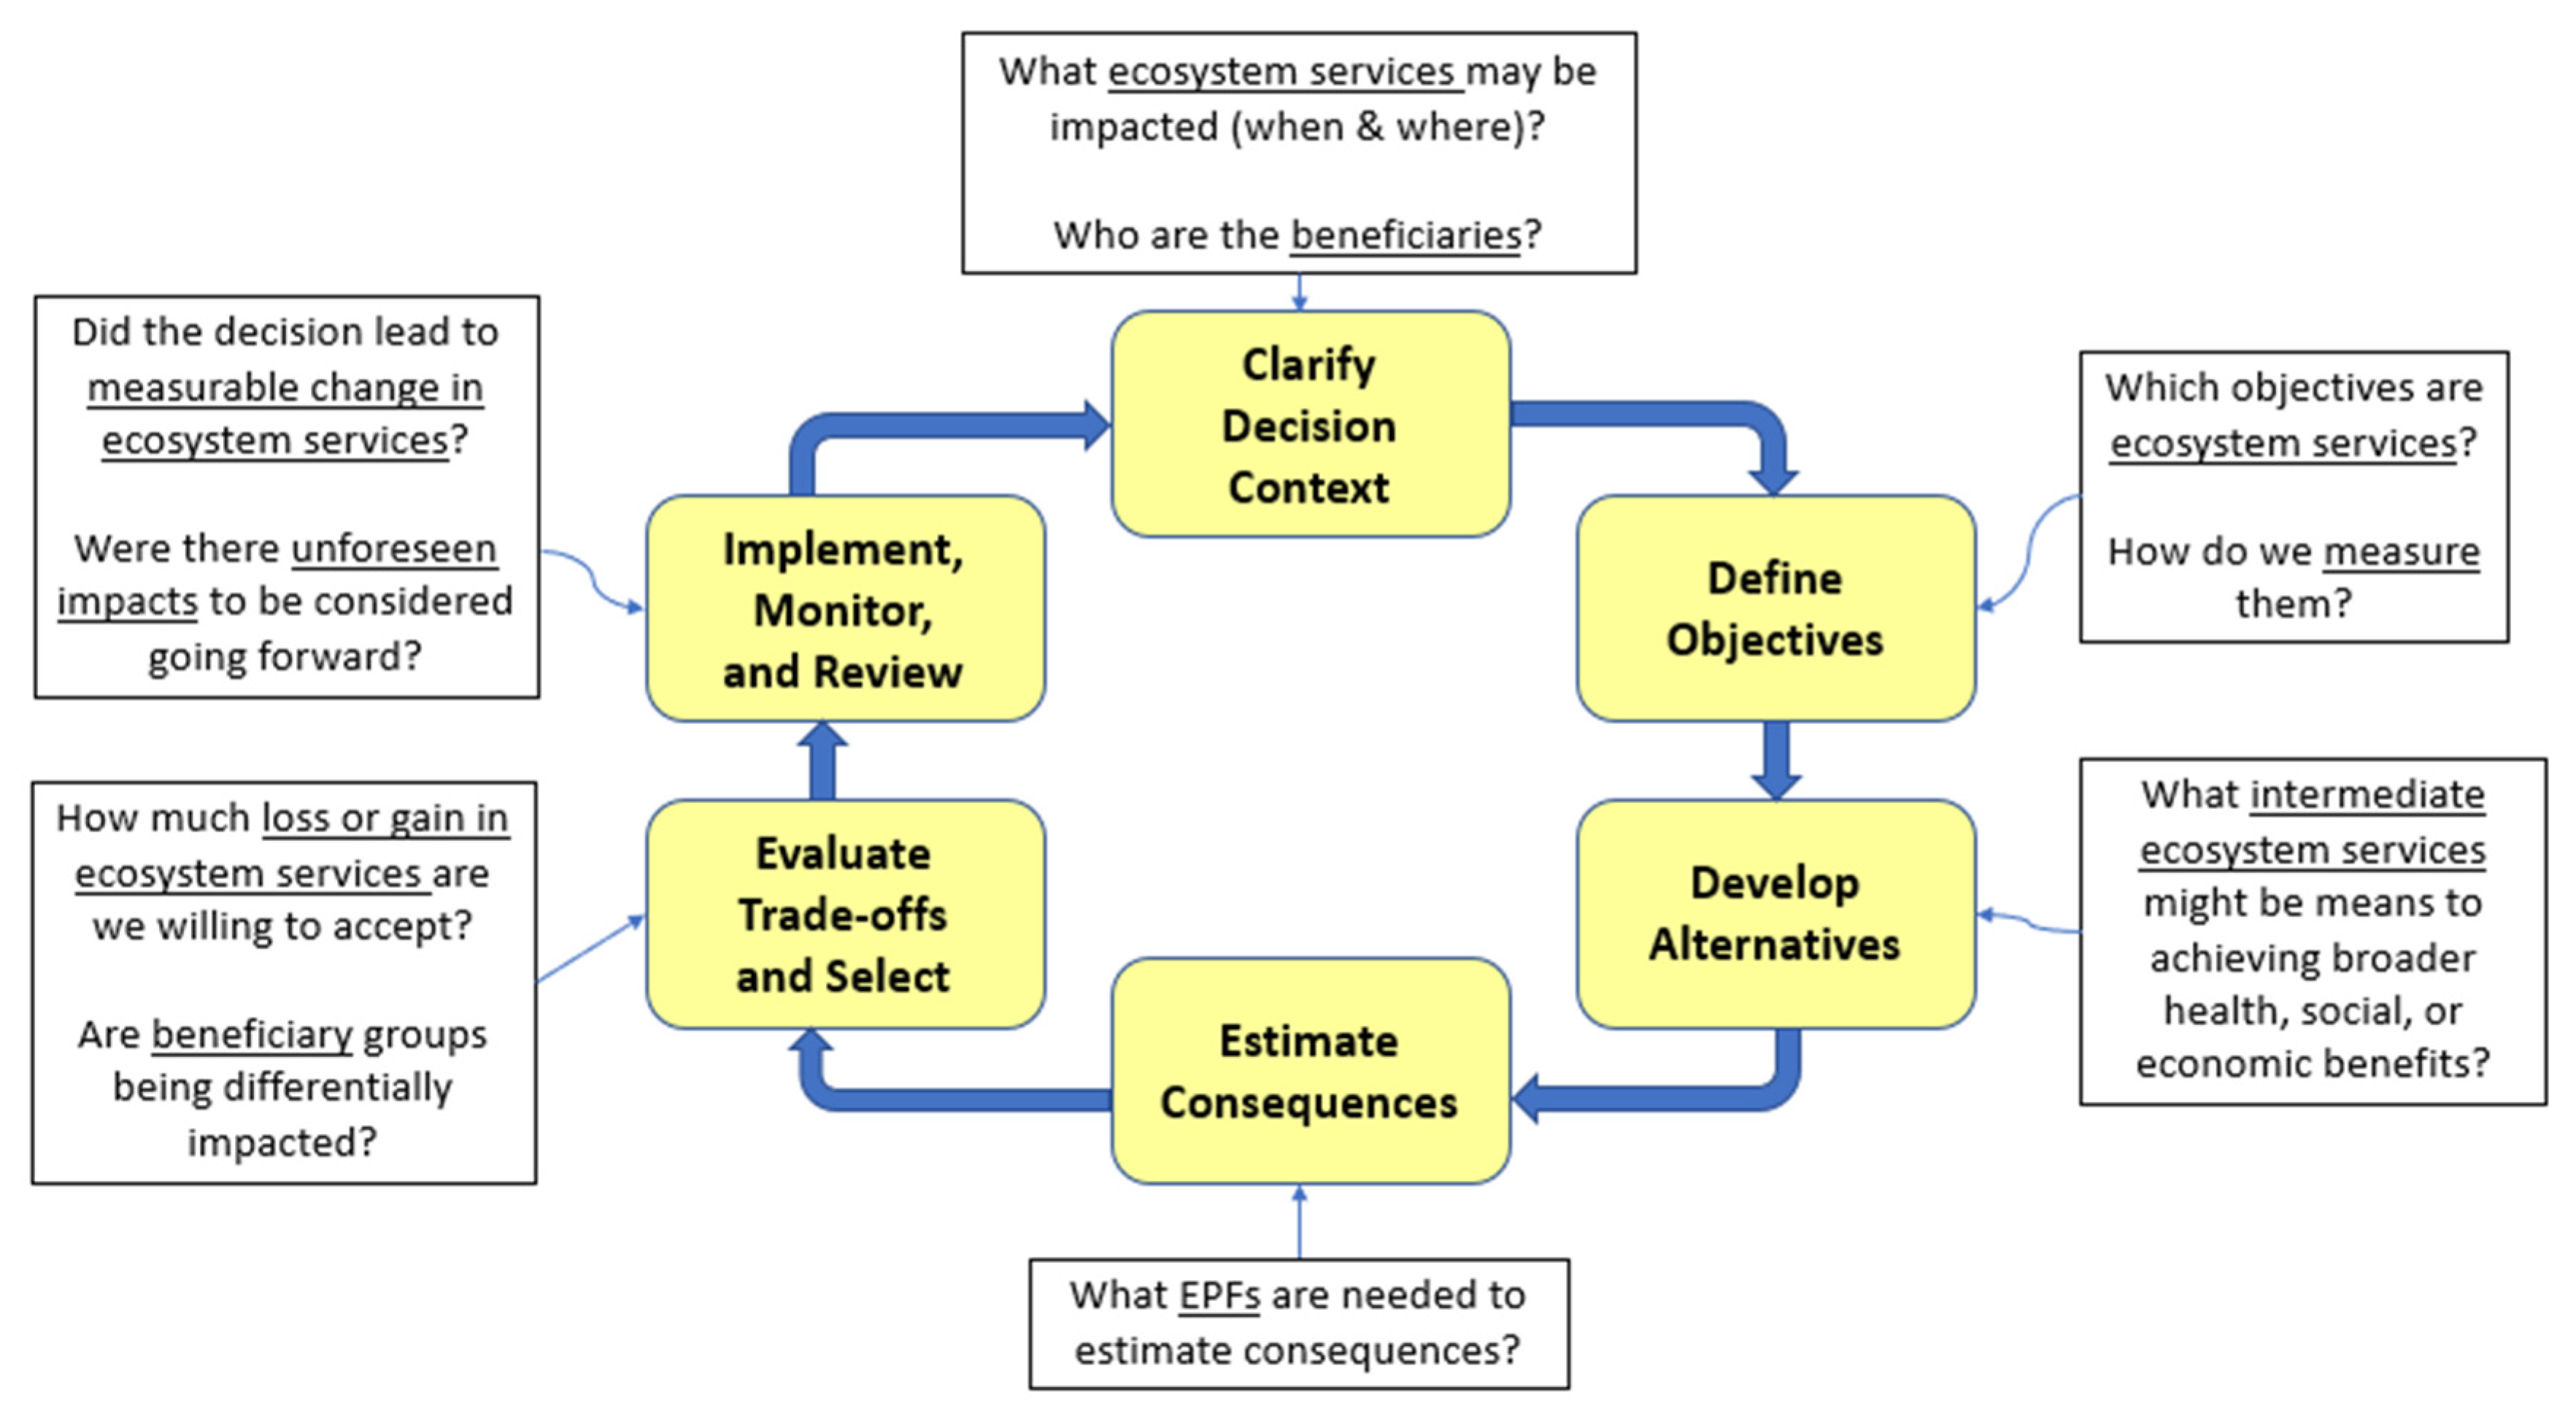
:1. Introduction, Conceptual Framework
2. Literature Review Methodology
3. Results and Discussion—The US EPA’s Ecosystem Services Research Elements
3.1. Decision Alternatives (A) and Impact Functions (B)
3.2. External Forces
3.3. Intermediate Ecosystem Goods and Services (Intermediate ES)
3.4. Ecological Production Functions (EPFs)
- Estimate indicators of final ES;
- Quantify ES outcomes;
- Respond to ecosystem condition;
- Respond to stressor levels or potential management scenarios;
- Appropriately reflect ecological complexity;
- Rely on data with broad coverage;
- Are shown to perform well;
- Are practical to use; and
- Are open and transparent ([60], p. 54).
3.4.1. EPFs in Marine Systems
3.4.2. EPFs in Freshwater Systems
3.4.3. EPFs in Terrestrial Systems
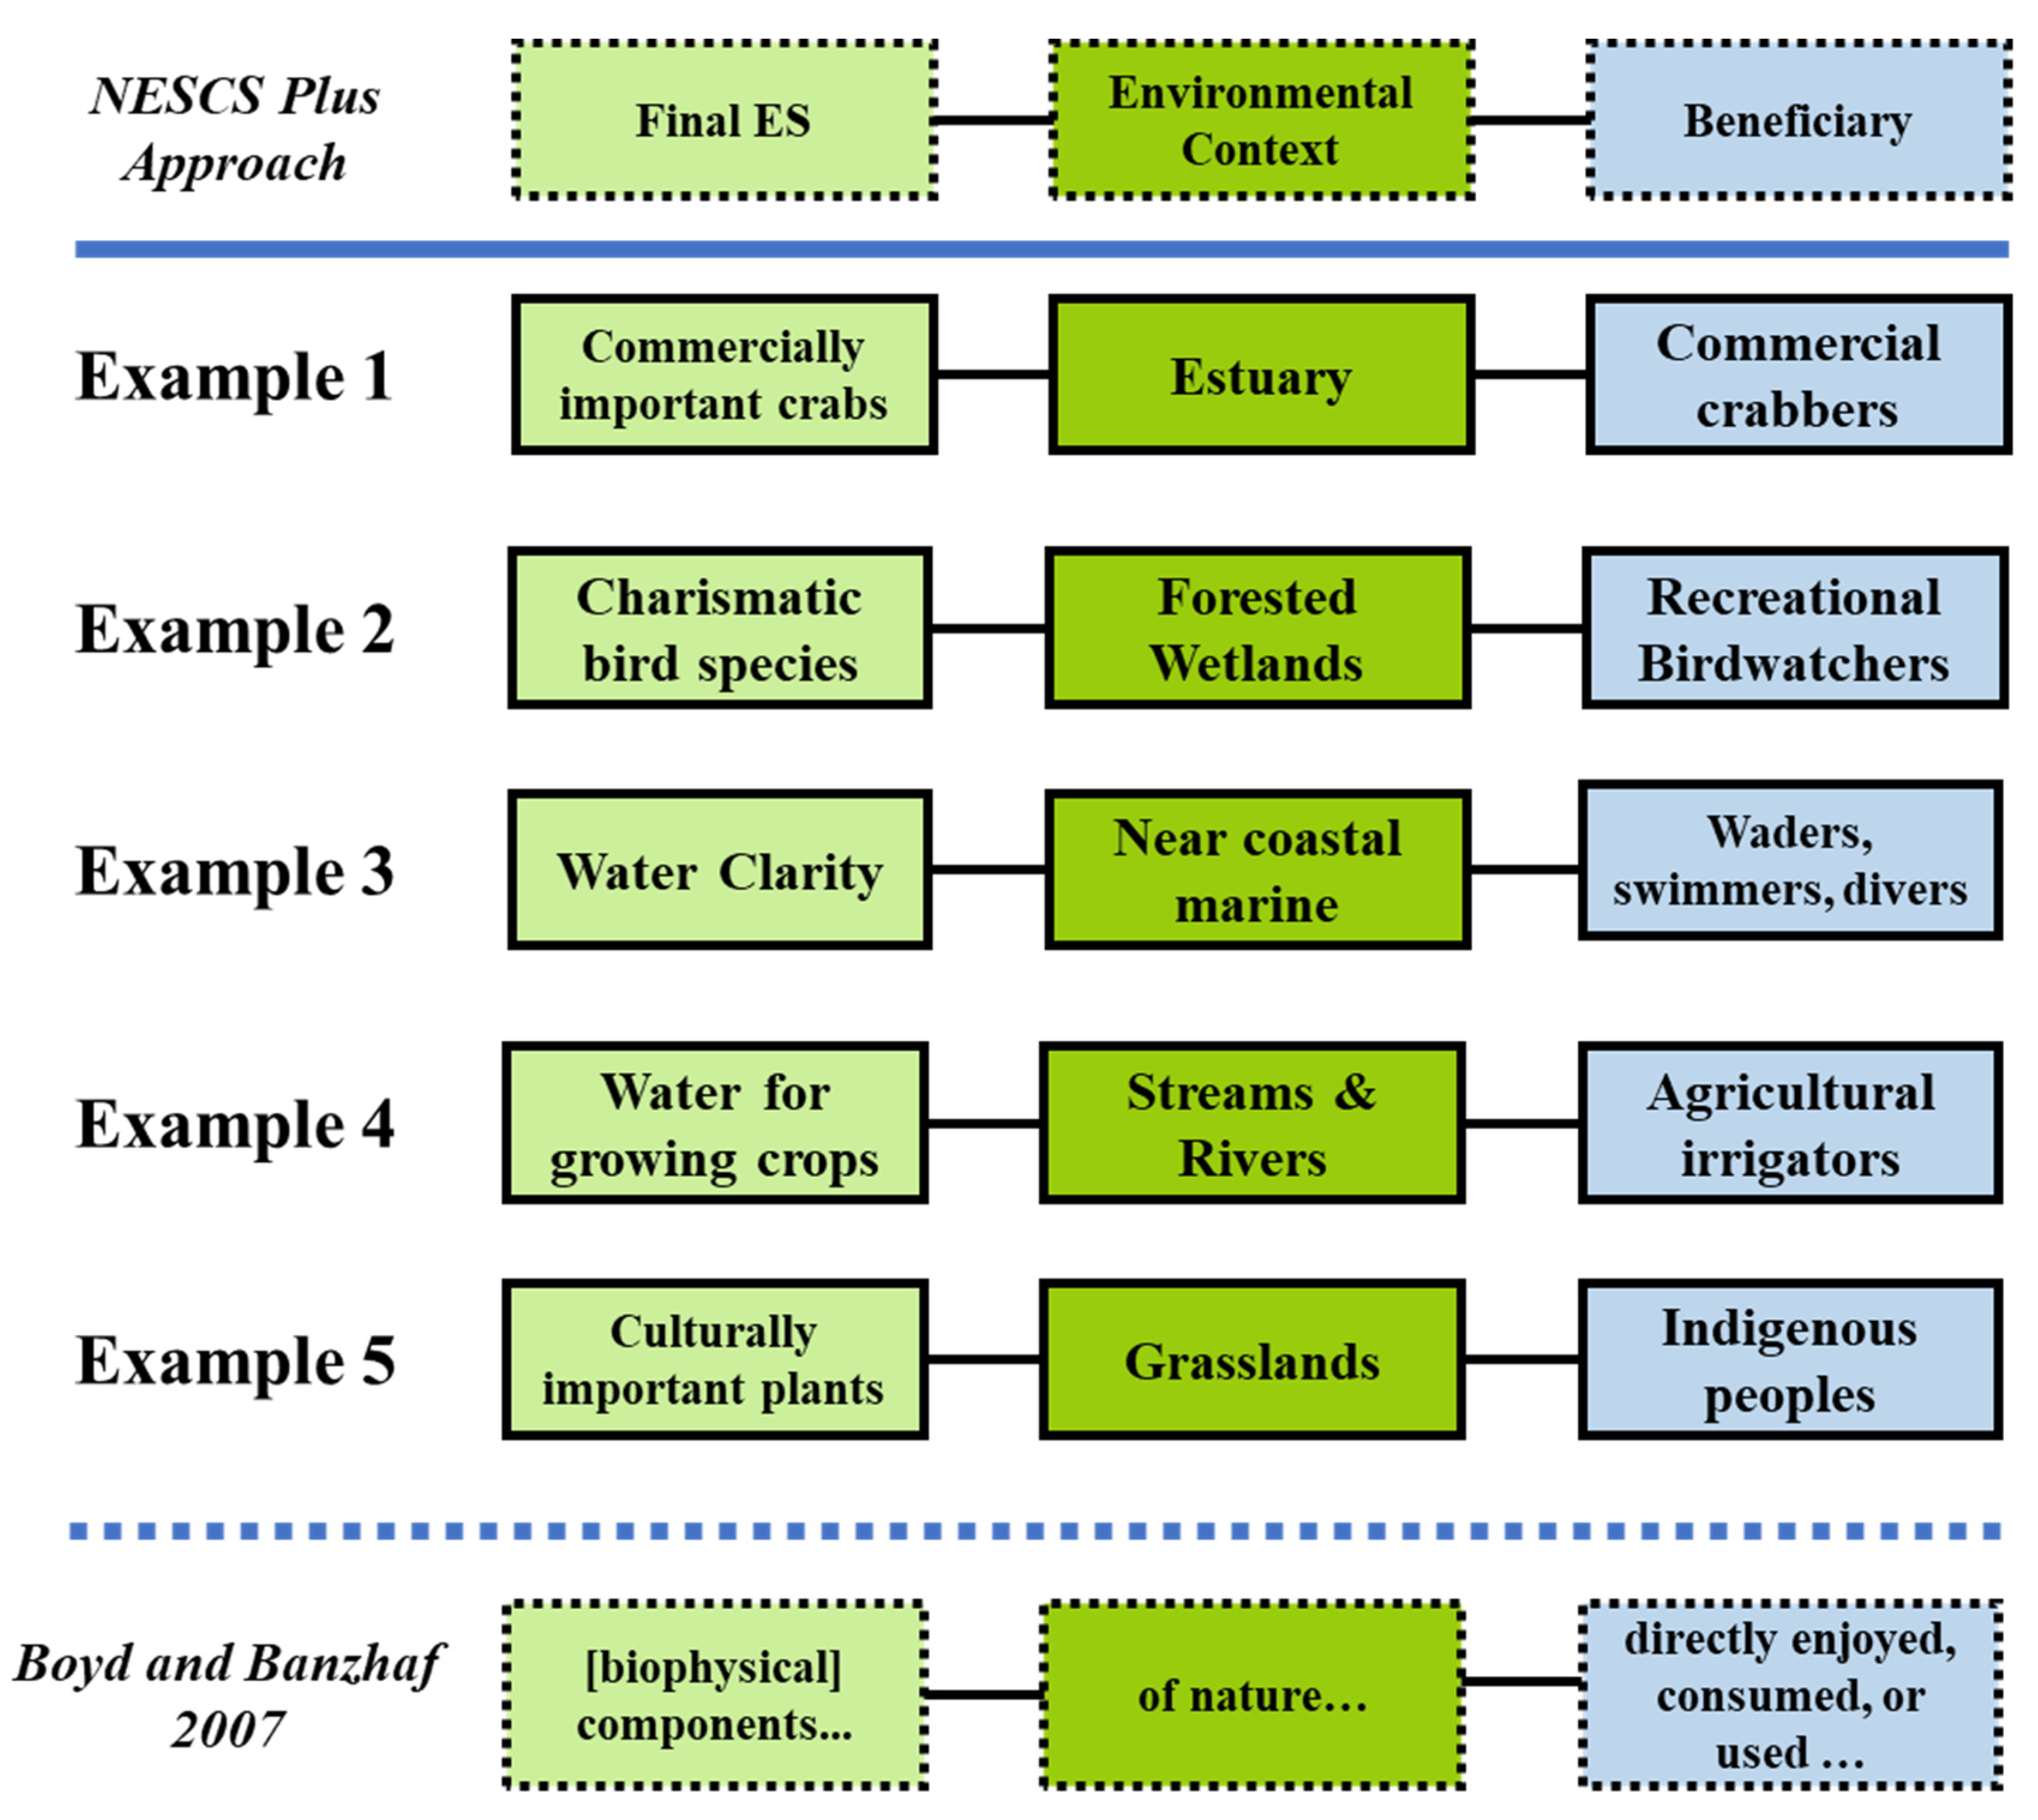
3.5. Final Ecosystem Goods and Services (Final ES)
3.6. Benefit Functions
3.6.1. Economic Valuation
3.6.2. Health Impact Assessments
3.6.3. Ethnographic Methods
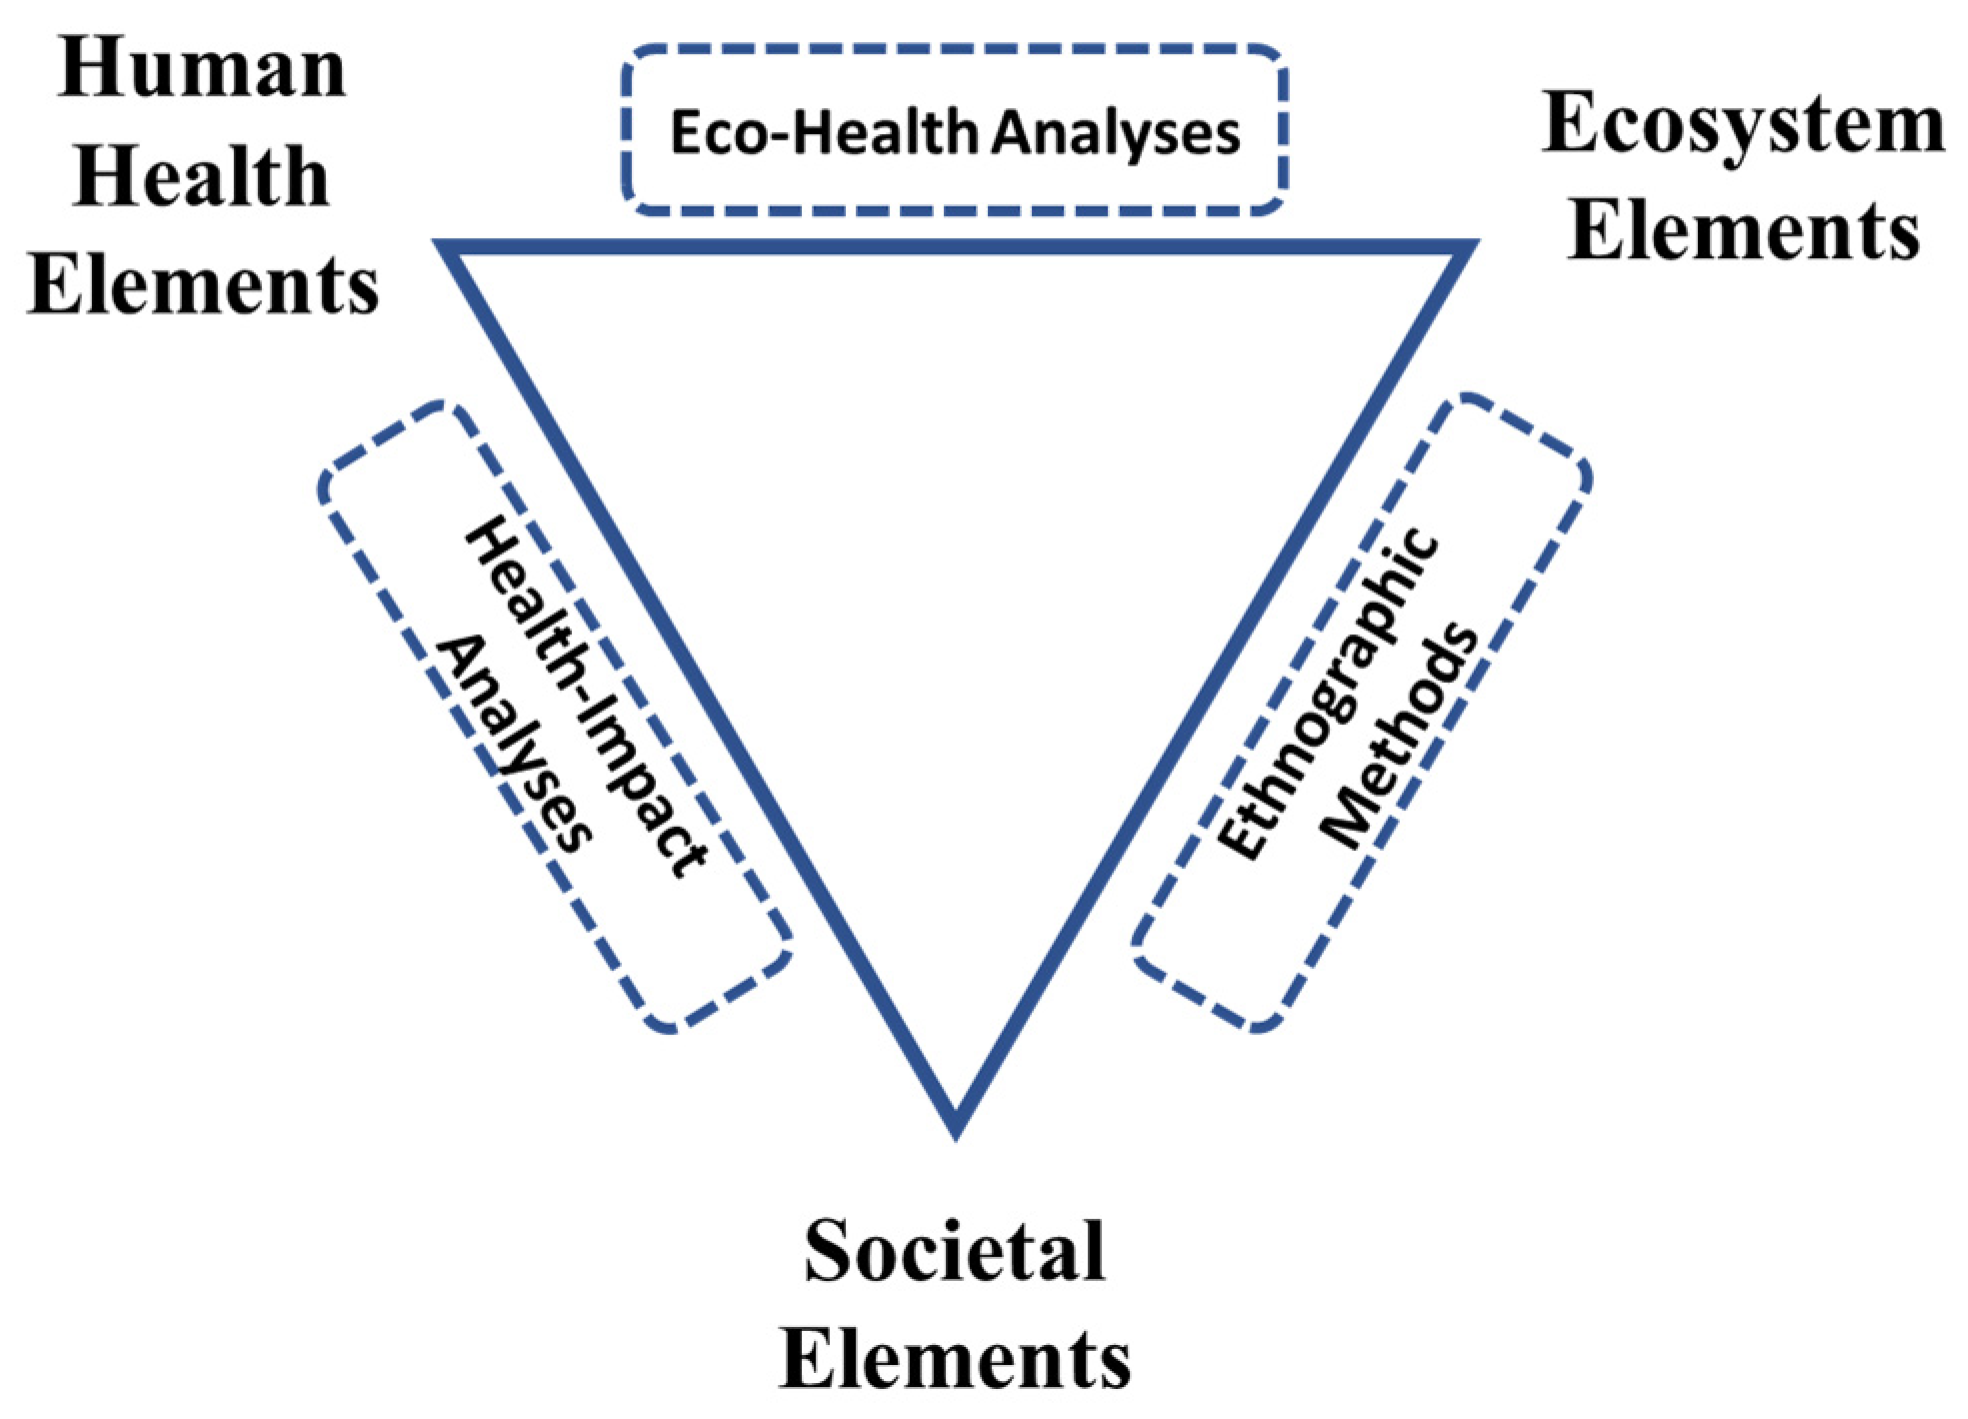
3.7. Human Health and Well-Being and Socio-Economic Services
3.8. Information for Decision Support
4. Results and Discussion—Operationalizing the US EPA’s Approach
4.1. Final ES Research in the Great Lakes
4.2. Final ES Research in Puerto Rico
4.3. Final ES Research in the Pacific Northwest
4.4. Final ES Research in the Gulf of Mexico
4.5. Final ES Research in the Southern Plains
5. Conclusions
- Greater awareness within the [ecosystem-based management] community of practice, including developing case-study applications, of the usefulness of [final ES] and the availability of tools useful for identifying, prioritizing, and quantifying them.
- A standardized list of metrics or indicators for each [final ES], based on the attributes of ecosystem types that each beneficiary class uses, enjoys, or appreciates. Site-specific metrics or indicators could then be developed from those generic attributes.
- Integration of the [final ES] tools (e.g., NESCS Plus, FEGS Scoping Tool, Rapid Benefits Indicators, EcoService Models Library) to facilitate identification of priority [final ES], relevant metrics and indicators for [final ES] endpoints and benefits, and models for estimating responses of those [final ES] to environmental change or stressors ([8] p. 129).
Author Contributions
Funding
Data Availability Statement
Acknowledgments
Conflicts of Interest
Disclaimer
References
- Daily, G.C. Nature’s Services; Island Press: Washington, DC, USA, 1997. [Google Scholar]
- Costanza, R.; d’Arge, R.; De Groot, R.; Farber, S.; Grasso, M.; Hannon, B.; Limburg, K.; Naeem, S.; O’Neill, R.V.; Paruelo, J.; et al. The value of the world’s ecosystem services and natural capital. Nature 1997, 387, 253–260. [Google Scholar] [CrossRef]
- Costanza, R.; De Groot, R.; Braat, L.; Kubiszewski, I.; Fioramonti, L.; Sutton, P.; Farber, S.; Grasso, M. Twenty years of ecosystem services: How far have we come and how far do we still need to go? Ecosyst. Serv. 2017, 28, 1–16. [Google Scholar] [CrossRef]
- MEA (Millennium Ecosystem Assessment). Ecosystems and Human Well-Being: Synthesis; Island Press: Washington, DC, USA, 2005. [Google Scholar]
- Yee, S.; Bousquin, J.; Bruins, R.; Canfield, T.J.; De Witt, T.H.; de Jesús-Crespo, R.; Dyson, B.; Fulford, R.; Harwell, M.; Hoffman, J.; et al. Practical Strategies for Integrating Final Ecosystem Goods and Services into Community Decision-Making; EPA/600/R-17/266; U.S. Environmental Protection Agency: Washington, DC, USA, 2017.
- Williams, K.C.; Bolgrien, D.W.; Hoffman, J.C.; Angradi, T.R.; Carlson, J.; Clarke, R.; Fulton, A.; MacGregor, M.; Timm-Bijold, H.; Trebitz, A.; et al. How the Community Value of Ecosystem Goods and Services Empowers Communities to Impact the Outcomes of Remediation, Restoration, and Revitalization Projects; EPA/600/R-17/292; U.S. Environmental Protection Agency: Washington, DC, USA, 2018.
- Potschin-Young, M.; Haines-Young, R.; Görg, C.; Heink, U.; Jax, K.; Schleyer, C. Understanding the role of conceptual frameworks: Reading the ecosystem service cascade. Ecosyst. Serv. 2018, 29, 428–440. [Google Scholar] [CrossRef] [PubMed]
- DeWitt, T.H.; Berry, W.J.; Canfield, T.J.; Fulford, R.S.; Harwell, M.C.; Hoffman, J.C.; Johnston, J.M.; Newcomer-Johnson, T.A.; Ringold, P.L.; Russell, M.J.; et al. The final ecosystem goods and services (FEGS) approach: A beneficiary centric method to support ecosystem-based management. In Ecosystem Based Management and Ecosystem Services: Theory, Tools, and Practice; Springer: Cham, Switzerland, 2020; pp. 127–148. [Google Scholar]
- Boyd, J.; Banzhaf, S. What are ecosystem services? The need for standardized environmental accounting units. Ecol. Econ. 2007, 63, 616–626. [Google Scholar] [CrossRef] [Green Version]
- United States Environmental Protection Agency. Ecosystem Services as Assessment Endpoints in Ecological Risk Assessment—Technical Background Paper; EPA/100/F-15/004; U.S. Environmental Protection Agency: Washington, DC, USA, 2015.
- Munns, W.R., Jr.; Rea, A.W.; Suter, G.W.; Martin, L.; Blake-Hedges, L.; Crk, T.; Davis, C.; Ferreira, G.; Jordan, S.; Mahoney, M.; et al. Ecosystem services as assessment endpoints for ecological risk assessment. Integr. Environ. Assess. Manag. 2016, 12, 522–528. [Google Scholar] [CrossRef]
- United States Environmental Protection Agency. Generic Ecological Assessment Endpoints (GEAE) for Ecological Risk Assessment, 2nd ed.; EPA100/F-15/005; U.S. Environmental Protection Agency: Washington, DC, USA, 2016.
- Munns, W.R., Jr.; Poulsen, V.; Gala, W.R.; Marshall, S.J.; Rea, A.W.; Sorensen, M.T.; von Stackelberg, K. Ecosystem services in risk assessment and management. Integr. Environ. Assess. Manag. 2017, 13, 62–73. [Google Scholar] [CrossRef]
- United States Environmental Protection Agency. Ecosystem Services at Contaminated Site Cleanups; EPA/542/R-17/004; U.S. Environmental Protection Agency Engineering Forum Issue Paper; U.S. Environmental Protection Agency: Washington, DC, USA, 2017.
- Harwell, M.C.; Jackson, C.; Kravitz, M.; Lynch, K.; Tomasula, J.; Neale, A.; Mahoney, M.; Pachon, C.; Scheuermann, K.; Grissom, G.; et al. Ecosystem services consideration in the remediation process for contaminated sites. J. Environ. Manag. 2021, 285, 112102. [Google Scholar] [CrossRef] [PubMed]
- United States Environmental Protection Agency. Green Remediation: Incorporating Sustainable Environmental Practices into Remediation of Contaminated Sites; EPA/542/R-08/002; U.S. Environmental Protection Agency: Washington, DC, USA, 2008.
- Gregory, R.; Failing, L.; Harstone, M.; Long, G.; McDaniels, T.; Ohlson, D. Structured Decision Making: A Practical Guide to Environmental Management Choices; John Wiley & Sons: Hoboken, NJ, USA, 2012. [Google Scholar]
- Sharpe, L.; Hernandez, C.; Jackson, C. Prioritizing stakeholders, beneficiaries and environmental attributes: A tool for ecosystem-based management. In Ecosystem Based Management and Ecosystem Services: Theory, Tools, and Practice; Springer: Cham, Switzerland, 2020; pp. 189–212. [Google Scholar]
- Newcomer-Johnson, T.; Andrews, F.; Corona, J.; DeWitt, T.; Harwell, M.C.; Rhodes, C.; Ringold, P.; Russell, M.; Sinha, P.; Van Houtven, G. National Ecosystem Services Classification System (NESCS Plus); EPA/600/R-20/267; U.S. Environmental Protection Agency: Washington, DC, USA, 2020.
- Fulford, R.; Bruins, R.; Canfield, T.; Handy, J.; Johnston, J.; Ringold, P.; Russell, M.; Seeteram, N.; Winters, K.; Yee, S. Lessons Learned in Applying Ecosystem Goods and Services to Community Decision Making; EPA/600/R-16/136; U.S. Environmental Protection Agency: Washington, DC, USA, 2016.
- Fulford, R.; Krauss, I.; Yee, S.; Russell, M. A keyword approach to finding common ground in community-based definitions of human well-being. Hum. Ecol. 2017, 45, 809–821. [Google Scholar] [CrossRef]
- Yee, S.H.; Sullivan, A.; Williams, K.C.; Winters, K. Who benefits from national estuaries? Applying the FEGS Classification System to identify ecosystem services and their beneficiaries. Int. J. Environ. Res. Public Health 2019, 16, 2351. [Google Scholar] [CrossRef] [Green Version]
- Fulford, R.; Russell, M.; Harvey, J.; Harwell, M.C. Sustainability at the Community Level: Searching for Common Ground as a Part of a National Strategy for Decision Support; EPA/600/R-16/178; U.S. Environmental Protection Agency: Washington, DC, USA, 2016.
- Fulford, R.S.; Smith, L.M.; Harwell, M.; Dantin, D.; Russell, M.; Harvey, J. Human well-being differs by community type: Toward reference points in a human well-being indicator useful for decision support. Ecol. Indic. 2015, 56, 194–204. [Google Scholar] [CrossRef]
- Sharpe, L.; Harwell, M.C.; Jackson, C. Integrated stakeholder prioritization for environmental management. J. Environ. Manag. 2021, 282, 111719. [Google Scholar] [CrossRef]
- Orlando, J.L.; Yee, S.H. Linking terrigenous sediment delivery to declines in coral reef ecosystem services. Estuaries Coasts 2017, 40, 359–375. [Google Scholar] [CrossRef]
- Angradi, T.R.; Launspach, J.J.; Debbout, R. Determining preferences for ecosystem benefits in Great Lakes Areas of Concern from photographs posted to social media. J. Great Lakes Res. 2018, 44, 340–351. [Google Scholar] [CrossRef] [PubMed]
- Littles, C.; Jackson, C.; De Witt, T.; Harwell, M.C. Linking people to coastal habitats: A meta-analysis of final ecosystem goods and services (FEGS) on the coast. Ocean. Coast. Manag. 2018, 165, 356–369. [Google Scholar] [CrossRef]
- Gibble, R.; Miller, L.; Harwell, M.C. Using stakeholder engagement, translational science and decision support tools for ecosystem-based management in the Florida Everglades. In Ecosystem Based Management and Ecosystem Services: Theory, Tools, and Practice; Springer: Cham, Switzerland, 2020; pp. 517–541. [Google Scholar]
- Holifield, R.; Williams, K.C. Watershed or bank-to-bank? Scales of governance and the geographic definition of Great Lakes Areas of Concern. Environ. Plan. E Nat. Space 2020. [Google Scholar] [CrossRef]
- Russell, M.; Rogers, J.; Jordan, S.; Dantin, D.; Harvey, J.; Nestlerode, J.; Alvarez, F. Prioritization of ecosystem services research: Tampa Bay demonstration project. J. Coast. Conserv. 2011, 15, 647–658. [Google Scholar] [CrossRef]
- Sumner, R.; Schubauer-Berigan, J.; Mulcahy, T.; Minter, J.; Dyson, B.; Godfrey, C.; Blue, J. Alternative Futures Analysis of Farmington Bay Wetlands in the Great Salt Lake Ecosystem; EPA/600/R-10/032; U.S. Environmental Protection Agency: Washington, DC, USA, 2010.
- Hoghooghi, N.; Golden, H.E.; Bledsoe, B.P.; Barnhart, B.L.; Brookes, A.F.; Djang, K.S.; Halama, J.J.; McKane, R.B.; Nietch, C.T.; Pettus, P.P. Cumulative effects of low impact development on watershed hydrology in a mixed land-cover system. Water 2018, 10, 991. [Google Scholar] [CrossRef] [PubMed] [Green Version]
- Angradi, T.R.; Launspach, J.J.; Bolgrien, D.W.; Bellinger, B.J.; Starry, M.A.; Hoffman, J.C.; Trebitz, A.S.; Sierszen, M.E.; Hollenhorst, T.P. Mapping ecosystem service indicators in a Great Lakes estuarine Area of Concern. J. Great Lakes Res. 2016, 42, 717–727. [Google Scholar] [CrossRef]
- Russell, M.; Harvey, J.; Ranade, P.; Murphy, K. EPA H2O User Manual; EPA/600/R-15/090; U.S. Environmental Protection Agency: Washington, DC, USA, 2015.
- Landyut, D.; Lemmens, P.; D’hondt, R.; Broekx, S.; Liekens, I.; De Bie, T.; Declerk, S.A.J.; De Meester, L.; Goethals, P.L.M. An ecosystem service approach to support integrated pond management: A case study using Bayesian belief networks—Highlighting opportunities and risks. J. Environ. Manag. 2014, 145, 79–87. [Google Scholar] [CrossRef]
- Carriger, J.F.; Yee, S.H.; Fisher, W.S. An introduction to Bayesian networks as assessment and decision support tools for managing coral reef ecosystem services. Ocean. Coast. Manag. 2019, 177, 188–199. [Google Scholar] [CrossRef]
- Carriger, J.F.; Yee, S.H.; Fisher, W.S. Assessing coral reef condition indicators for local and global stressors using Bayesian networks. Integr. Environ. Assess. Manag. 2020, 17, 165–187. [Google Scholar] [CrossRef] [PubMed]
- O’Higgins, T.G.; De Witt, T.H.; Lago, M. Using the concepts and tools of social ecological systems and ecosystem services to advance the practice of ecosystem-based management. In Ecosystem Based Management and Ecosystem Services: Theory, Tools, and Practice; Springer: Cham, Switzerland, 2020; pp. 3–14. [Google Scholar]
- Myer, M.; Johnston, J.M. Models and mapping tools to inform resilience planning after disasters: A case study of hurricane Sandy and Long Island ecosystem services. In Ecosystem Based Management and Ecosystem Services: Theory, Tools, and Practice; Springer: Cham, Switzerland, 2020; pp. 417–430. [Google Scholar]
- McKane, R.B.; Brookes, A.F.; Djang, K.S.; Halama, J.J.; Pettus, P.B.; Barnhart, B.L.; Russell, M.J.; Vache, K.B.; Bolte, J.B. An integrated multi-model decision support framework for evaluating ecosystem-based management options for coupled human-natural systems. In Ecosystem Based Management and Ecosystem Services: Theory, Tools, and Practice; Springer: Cham, Switzerland, 2020; pp. 255–274. [Google Scholar]
- Weijerman, M.; Veazey, L.; Yee, S.; Vaché, K.; Delevaux, J.; Donovan, M.K.; Falinski, K.; Lecky, J.; Oleson, K.L. Managing local stressors for coral reef condition and ecosystem services delivery under climate scenarios. Front. Mar. Sci. 2018, 5, 425. [Google Scholar] [CrossRef] [Green Version]
- Norman, L.; Tallent-Halsell, N.; Labiosa, W.; Weber, M.; McCoy, A.; Hirschboeck, K.; Callegary, J.; Van Riper, C.; Gray, F. Developing an ecosystem services online decision support tool to assess the impacts of climate change and urban growth in the Santa Cruz watershed; where we live, work, and play. Sustainability 2010, 2, 2044–2069. [Google Scholar] [CrossRef] [Green Version]
- Jackson, C.A.; Schmutz, P.; Harwell, M.C.; Littles, C.J. The ecosystem service of property protection and exposure to environmental stressors in the Gulf of Mexico. Ocean. Coast. Manag. 2020, 184, 105017. [Google Scholar] [CrossRef]
- Yee, S.; Paulukonis, E.; Simmons, C.; Russell, M.; Fulford, R.; Harwell, L.; Smith, L. Projecting effects of land-use change on human well-being through changes in ecosystem services. Ecol. Model. 2021, 440, 1093582. [Google Scholar] [CrossRef] [PubMed]
- Trisurat, Y.; Aekakkararungroj, A.; Ma, H.; Johnston, J.M. Basin-wide impacts of climate change on ecosystem services in the Lower Mekong Basin. Ecol. Res. 2018, 33, 73–86. [Google Scholar] [CrossRef]
- Trisurat, Y.; Shirakawa, H.; Johnston, J.M. Land-use/land-cover change from socio-economic drivers and their impact on biodiversity in Nan Province, Thailand. Sustainability 2019, 11, 649. [Google Scholar] [CrossRef] [Green Version]
- Johnston, J.M.; Zomer, R.J.; Wang, M.C. Predicting future vegetated landscapes under climate change: Application of the environmental stratification methodology to protected areas in the lower Mekong Basin. In Ecosystem Based Management and Ecosystem Services: Theory, Tools, and Practice; Springer: Cham, Switzerland, 2020; pp. 561–580. [Google Scholar]
- Craft, C.; Schubauer-Berigan, J.P. The role of freshwater wetlands in a water quality trading program. In Innovations in Reducing Nonpoint Source Pollution: Methods, Policies, Programs and Measurements; River’s Institute at Hanover College: Hanover, NH, USA, 2006; pp. 143–158. [Google Scholar]
- Jordan, S.J.; Stoffer, J.; Nestlerode, J.A. Wetlands as sinks for reactive nitrogen at continental and global scales: A meta-analysis. Ecosystems 2011, 14, 144–155. [Google Scholar] [CrossRef]
- Craft, C.; Herbert, E.; Li, F.; Smith, D.; Schubauer-Berigan, J.; Widney, S.; Angelini, C.; Pennings, S.; Medeiros, P.; Byers, J.; et al. Climate change and the fate of coastal wetlands. Wetl. Sci. Pract. 2016, 33, 70–73. [Google Scholar]
- Sierszen, M.E.; Morrice, J.A.; Trebitz, A.S.; Hoffman, J.C. A review of selected ecosystem services provided by coastal wetlands of the Laurentian Great Lakes. Aquat. Ecosyst. Health Manag. 2012, 15, 92–106. [Google Scholar] [CrossRef]
- Kreiling, R.M.; Schubauer-Berigan, J.P.; Richardson, W.B.; Bartsch, L.A.; Hughes, P.E.; Cavanaugh, J.C.; Strauss, E.A. Wetland management reduces sediment and nutrient loading to the upper Mississippi River. J. Environ. Qual. 2013, 42, 573–583. [Google Scholar] [CrossRef]
- Bellinger, B.J.; Hoffman, J.C.; Angradi, T.R.; Bolgrien, D.W.; Starry, M.; Elonen, C.; Jicha, T.M.; Lehto, L.P.; Seifert-Monson, L.R.; Pearson, M.S.; et al. Water quality in the St. Louis River Area of Concern, Lake Superior: Historical and current conditions and delisting implications. J. Great Lakes Res. 2016, 42, 28–38. [Google Scholar] [CrossRef]
- Steinman, A.D.; Cardinale, B.J.; Munns, W.R., Jr.; Ogdahl, M.E.; Allan, J.D.; Angadi, T.; Bartlett, S.; Brauman, K.; Byappanahalli, M.; Doss, M.; et al. Ecosystem services in the Great Lakes. J. Great Lakes Res. 2017, 43, 161–168. [Google Scholar] [CrossRef]
- Reistetter, J.A.; Russell, M. High-resolution land cover datasets, composite curve numbers, and storm water retention in the Tampa Bay, FL region. Appl. Geogr. 2011, 31, 740–747. [Google Scholar] [CrossRef]
- Jordan, S.J.; Hayes, S.E.; Yoskowitz, D.; Smith, L.M.; Summers, J.K.; Russell, M.; Benson, W.H. Accounting for natural resources and environmental sustainability: Linking ecosystem services to human well-being. Environ. Sci. Technol. 2010, 44, 1530–1536. [Google Scholar] [CrossRef]
- Mazzotta, M.; Bousquin, J.; Ojo, C.; Hychka, K.; Gottschalk Druschke, C.; Berry, W.; McKinney, R. Assessing the Benefits of Wetland Restoration: A Rapid Benefit Indicators Approach for Decision Makers; EPA/600/R-18/084; U.S. Environmental Protection Agency: Washington, DC, USA, 2016.
- Bousquin, J.; Mazzotta, M. Rapid Benefit Indicator Tools. In Ecosystem Based Management and Ecosystem Services: Theory, Tools, and Practice; Springer: Cham, Switzerland, 2020; pp. 309–330. [Google Scholar]
- Bruins, R.J.; Canfield, T.J.; Duke, C.; Kapustka, L.; Nahlik, A.M.; Schäfer, R.B. Using ecological production functions to link ecological processes to ecosystem services. Integr. Environ. Assess. Manag. 2017, 13, 52–61. [Google Scholar] [CrossRef] [PubMed] [Green Version]
- Newcomer-Johnson, T.; Bruins, R.; Moon, J.; Errend, M.; Gray, M.; Wilson, J.; Lomnicky, G. The EcoService Models Library (ESML): A Searchable Database of Ecological Models for Estimating the Production of Ecosystem Goods and Services. Available online: https://esml.epa.gov/home (accessed on 15 February 2021).
- Moon, J.B.; DeWitt, T.H.; Errend, M.N.; Bruins, R.J.F.; Kentula, M.E.; Chamberlain, S.J.; Fennessy, M.S.; Naithani, K.J. Model application niche analysis: Assessing the transferability and generalizability of ecological models. Ecol. Appl. 2017, 8, e01974. [Google Scholar] [CrossRef]
- Fulford, R.; Heymans, S.; Wu, W. Mathematical modeling for Ecosystem-based Management (EBM) and Ecosystem Goods and Services (EGS) assessment. In Ecosystem Based Management and Ecosystem Services: Theory, Tools, and Practice; Springer: Cham, Switzerland, 2020; pp. 275–289. [Google Scholar]
- Marcot, B.G.; Raphael, M.G.; Schumaker, N.H.; Galleher, B. How big and how close? Habitat patch size and spacing to conserve a threatened species. Nat. Resour. Modeling 2013, 26, 194–214. [Google Scholar] [CrossRef]
- Fordham, D.A.; Shoemaker, K.T.; Schumaker, N.H.; Akçakaya, H.R.; Clisby, N.; Brook, B.W. How interactions between animal movement and landscape processes modify local range dynamics and extinction risk. Biol. Lett. 2014, 10, 20140198. [Google Scholar] [CrossRef] [Green Version]
- Rugani, B.; de Souza, D.M.; Weidema, B.P.; Bare, J.; Bakshi, B.; Grann, B.; Johnston, J.M.; Pavan, A.L.R.; Liu, X.; Laurent, A.; et al. Towards integrating the ecosystem services cascade framework within the Life Cycle Assessment (LCA) cause-effect methodology. Sci. Total Environ. 2019, 690, 1284–1298. [Google Scholar] [CrossRef]
- Liu, X.; Bakshi, B.R.; Rugani, B.; de Souza, D.M.; Bare, J.; Johnston, J.M.; Laurent, A.; Verones, F. Quantification and valuation of ecosystem services in life cycle assessment: Application of the cascade framework to rice farming systems. Sci. Total Environ. 2020, 747, 141278. [Google Scholar] [CrossRef]
- Principe, P.; Bradley, P.; Yee, S.; Fisher, W.; Johnson, E.; Allen, P.; Campbell, D. Quantifying Coral Reef Ecosystem Services; EPA/600/R-11/206; U.S. Environmental Protection Agency: Washington, DC, USA, 2012.
- Yee, S.H.; Dittmar, J.A.; Oliver, L.M. Comparison of methods for quantifying reef ecosystem services: A case study mapping services for St. Croix, USVI. Ecosyst. Serv. 2014, 8, 1–15. [Google Scholar] [CrossRef]
- Principe, P.; Fisher, W. Spatial distribution of collections yielding marine natural products. J. Nat. Prod. 2018, 81, 2307–2320. [Google Scholar] [CrossRef] [PubMed]
- Frazier, M.R.; Lamberson, J.O.; Nelson, W.G. Intertidal habitat utilization patterns of birds in a Northeast Pacific estuary. Wetl. Ecol. Manag. 2014, 22, 451–466. [Google Scholar] [CrossRef] [Green Version]
- Jordan, S.J.; O’Higgins, T.; Dittmar, J.A. Ecosystem services of coastal habitats and fisheries: Multiscale ecological and economic models in support of ecosystem-based management. Mar. Coast. Fish. 2012, 4, 573–586. [Google Scholar] [CrossRef]
- Lewis, M.; Kirschenfeld, J.T.; Goodhart, T. Environmental Quality of the Pensacola Bay System: Retrospective Review for Future Resource Management and Rehabilitation; EPA/600/R-16/169; U.S. Environmental Protection Agency: Washington, DC, USA, 2016.
- Ayvazian, S.; Gerber-Williams, A.; Grabbert, S.; Miller, K.; Hancock, B.; Helt, W.; Cobb, D.; Strobel, C. Habitat benefits of restored oyster reefs and aquaculture to fish and invertebrates in a coastal pond in Rhode Island, United States. J. Shellfish. Res. 2020, 39, 563–587. [Google Scholar] [CrossRef]
- Bricker, S.; Grizzle, R.; Trowbridge, P.; Rose, J.; Ferriera, J.; Wellman, K.; Zhu, C.; Galimany, E.; Wikfors, G.; Saurel, C.; et al. Bioextractive removal of nitrogen by oysters in great bay piscataqua river estuary, New Hampshire, USA. Estuaries Coasts 2020, 43, 23–38. [Google Scholar] [CrossRef] [Green Version]
- Lewis, N.; Marois, D.; Littles, C.; Fulford, R. Projecting changes to coastal and estuarine ecosystem goods and services—Models and tools. In Ecosystem Based Management and Ecosystem Services: Theory, Tools, and Practice; Springer: Cham, Switzerland, 2020; pp. 235–253. [Google Scholar]
- Fulford, R.; Russell, M.; Hagy, J.; Breitburg, D. Managing estuaries for ecosystem function. Glob. Ecol. Conserv. 2020, 21, e00892. [Google Scholar] [CrossRef]
- Trebitz, A.S.; Hoffman, J.C. Coastal wetland support of Great Lakes fisheries: Progress from concept to quantification. Trans. Am. Fish. Soc. 2015, 144, 352–372. [Google Scholar] [CrossRef]
- Weber, M.A.; Ringold, P.L. Priority river metrics for residents of an urbanized arid watershed. Landsc. Urban Plan. 2015, 133, 37–52. [Google Scholar] [CrossRef]
- Weber, M.A.; Ringold, P.L. River metrics by the public, for the public. PLoS ONE 2019, 14, e0214986. [Google Scholar] [CrossRef] [PubMed] [Green Version]
- Engle, V.D. Estimating the provision of ecosystem services by Gulf of Mexico coastal wetlands. Wetlands 2011, 31, 179–193. [Google Scholar] [CrossRef]
- Herbert, E.; Schubauer-Berigan, J.; Craft, C. Differential effects of chronic and acute simulated seawater intrusion on tidal freshwater marsh carbon cycling. Biogeochemistry 2018, 138, 137–154. [Google Scholar] [CrossRef]
- Li, S.; Hopkinson, C.S.; Schubauer-Berigan, J.P.; Pennings, S.C. Climate drivers of Zizaniopsis miliacea biomass in a Georgia, USA tidal fresh marsh. Limnol. Oceanogr. 2018, 63, 2266–2276. [Google Scholar] [CrossRef]
- Hill, B.H.; Kolka, R.K.; McCormick, F.H.; Starry, M.A. A synoptic survey of ecosystem services from headwater catchments in the United States. Ecosyst. Serv. 2014, 7, 106–115. [Google Scholar] [CrossRef]
- Teague, A.; Russell, M.; Harvey, J.; Dantin, D.; Nestlerode, J.; Alvarez, F. A spatially-explicit technique for evaluation of alternative scenarios in the context of ecosystem goods and services. Ecosyst. Serv. 2016, 20, 15–29. [Google Scholar] [CrossRef]
- Harvey, J.E.; Russell, M.J.; Dantin, D.D.; Nestlerode, J.; Greening, H.; Cooper, S. Integrated approaches to estuarine use and protection: Tampa Bay ecosystem services case study. In Estuaries: Types, Movement Patterns and Climatical Impacts; Nova Science Publishers, Inc.: Hauppauge, NY, USA, 2010; pp. 263–277. [Google Scholar]
- Russell, M.; Teague, A.; Alvarez, F.; Dantin, D.; Osland, M.; Harvey, J.; Nestlerode, J.; Rogers, J.; Jackson, L.; Pilant, S.; et al. Neighborhood Scale Quantification of Ecosystem Goods and Services; EPA/600/R-13/295; U.S. Environmental Protection Agency: Washington, DC, USA, 2013.
- McCrackin, M.L.; Cooter, E.J.; Dennis, R.L.; Harrison, J.A.; Compton, J.E. Alternative futures of dissolved inorganic nitrogen export from the Mississippi River Basin: Influence of crop management, atmospheric deposition, and population growth. Biogeochemistry 2017, 133, 263–277. [Google Scholar] [CrossRef]
- Yuan, Y.; Wang, R.; Cooter, E.; Ran, L.; Daggupati, P.; Yang, D.; Srinivasan, R.; Jalowska, A. Integrating multimedia models to assess nitrogen losses from the Mississippi River basin to the Gulf of Mexico. Biogeosciences 2018, 15, 7059–7076. [Google Scholar] [CrossRef] [Green Version]
- Mengistu, S.G.; Golden, H.E.; Lane, C.R.; Christensen, J.R.; Wine, M.L.; D’Amico, E.; Prues, A.; Leibowitz, S.G.; Compton, J.E.; Weber, M.H.; et al. Wetland flowpaths mediate nitrogen and phosphorus concentrations across the Upper Mississippi River Basin. J. Am. Water Resour. Assoc. 2020. [Google Scholar] [CrossRef]
- Abdelnour, A.; McKane, R.; Stieglitz, M.; Pan, F.; Cheng, Y. Effects of harvest on carbon and nitrogen dynamics in a Pacific Northwest forest catchment. Water Resour. Res. 2013, 49, 1292–1313. [Google Scholar] [CrossRef] [Green Version]
- Abdelnour, A.; Stieglitz, M.; Pan, F.; McKane, R. Catchment hydrological responses to forest harvest amount and spatial pattern. Water Resour. Res. 2011, 47, W09521. [Google Scholar] [CrossRef]
- Weber, M.; Ringold, P. Ecosystems and people: Qualitative insights. In EHS Bulletin; Center for Environmental Research INF: Cincinnati, OH, USA, 2012; pp. 2–8. [Google Scholar]
- Ringold, P.L.; Boyd, J.; Landers, D.; Weber, M. What data should we collect? A framework for identifying indicators of ecosystem contributions to human well-being. Front. Ecol. Environ. 2013, 11, 98–105. [Google Scholar] [CrossRef]
- Finisdore, J.; Rhodes, C.; Haines-Young, R.; Maynard, S.; Wielgus, J.; Dvarskas, A.; Houdet, J.; Quétier, F.; Lamothe, K.A.; Ding, H.; et al. The 18 benefits of using ecosystem services classification systems. Ecosyst. Serv. 2020, 45, 101160. [Google Scholar] [CrossRef]
- Finisdore, J.; Lamothe, K.A.; Rhodes, C.R.; Obst, C.; Booth, P.; Haines-Young, R.; Russell, M.; Houdet, J.R.; Maynard, S.; Wielgus, J.; et al. Letter to the editor: Using classification systems to integrate ecosystem services with decision making tools. Ecosyst. Serv. 2021, 48, 101257. [Google Scholar] [CrossRef]
- Landers, D.H.; Nahlik, A.M. Final Ecosystem Goods and Services Classification System (FEGS-CS); EPA/600/R-13/004914; U.S. Environmental Protection Agency: Washington, DC, USA, 2013.
- United States Environmental Protection Agency. National Ecosystem Services Classification System (NESCS): Framework Design and Policy Application; EPA/600/R-15/002; U.S. Environmental Protection Agency: Washington, DC, USA, 2015.
- Johnston, R.J.; Russell, M. An operational structure for clarity in ecosystem service values. Ecological Economics 2011, 70, 2243–2249. [Google Scholar] [CrossRef]
- Hall, K. National and Regional FEGS Metrics and Indicators 2016 Workshop Report; EPA/600/R-17/189; U.S. Environmental Protection Agency: Washington, DC, USA, 2017.
- United States Environmental Protection Agency. Metrics for National and Regional Assessment of Aquatic, Marine, and Terrestrial Final Ecosystem Goods and Services; EPA/600/R-20/002; U.S. Environmental Protection Agency: Washington, DC, USA, 2020.
- Pickard, B.R.; Daniel, J.; Mehaffey, M.; Jackson, L.E.; Neale, A. EnviroAtlas: A new geospatial tool to foster ecosystem services science and resource management. Ecosyst. Serv. 2015, 14, 45–55. [Google Scholar] [CrossRef] [Green Version]
- United States Environmental Protection Agency. EnviroAtlas. 2020. Available online: https://www.epa.gov/enviroatlas (accessed on 15 February 2021).
- Tashie, A.; Ringold, P. A critical assessment of available ecosystem services data according to the final ecosystem goods and services framework. Ecosphere 2019, 10, e02665. [Google Scholar] [CrossRef] [PubMed] [Green Version]
- Bell, M.; Phelan, J.; Blett, T.; Landers, D.; Nahlik, A.; Van Houtven, G.; Davis, C.; Clark, C.; Hewitt, J. A framework to quantify the strength of the ecological links between an environmental stressor and final ecosystem services. Ecosphere 2017, 8, e01806. [Google Scholar] [CrossRef] [PubMed] [Green Version]
- O’Dea, C.; Anderson, S.; Sullivan, T.; Landers, D.; Casey, F. Impacts to ecosystem services from aquatic acidification: Using FEGS-CS to understand the impacts of air pollution. Ecosphere 2017, 8, e01807. [Google Scholar] [CrossRef] [Green Version]
- Rhodes, C.; Bingham, A.; Heard, A.M.; Hewitt, J.; Lynch, J.; Waite, R.; Bell, M.D. Diatoms to human uses: Linking nitrogen deposition, aquatic eutrophication, and ecosystem services. Ecosphere 2017, 8, e01858. [Google Scholar] [CrossRef] [Green Version]
- Yoskowitz, D.; Russell, M. Human dimensions of our estuaries and coasts. Estuaries Coasts 2015, 38, 1–8. [Google Scholar] [CrossRef] [Green Version]
- Boyd, J.; Ringold, P.; Krupnick, A.; Johnson, R.; Weber, M.; Hall, K.M. Ecosystem services indicators: Improving the linkage between biophysical and economic analyses. Int. Rev. Environ. Resour. Econ. 2014, 8, 369–433. [Google Scholar]
- Russell, M.; Greening, H. Estimating benefits in a recovering estuary: Tampa Bay, Florida. Estuaries Coasts 2015, 38, 9–18. [Google Scholar] [CrossRef]
- Weber, M. EPA use of ecological nonmarket valuation. Assoc. Environ. Resour. Econ. Newsl. 2010, 30, 26–35. [Google Scholar]
- Jewhurst, S.; Mazzotta, M. Economic Tools for Managing Nitrogen in Coastal Watersheds; EPA/600/R-16/036; U.S. Environmental Protection Agency: Washington, DC, USA, 2016.
- Russell, M.; Rhodes, C.; Van Houtven, G.; Sinha, P.; Warnell, K.; Harwell, M.C. Ecosystem Based Management and Natural Capital Accounting In Ecosystem Based Management and Ecosystem Services: Theory, Tools, and Practice; Springer: Cham, Switzerland, 2020; pp. 149–163. [Google Scholar]
- Johnston, J.; de Jesus Crespo, R.; Harwell, M.; Jackson, C.; Myer, M.; Seeteram, N.; Yee, S.; Hoffman, J. Valuing Community Benefits of Final Ecosystem Goods and Services: Human Health and Ethnographic Approaches; EPA/600/R-17/309; U.S. Environmental Protection Agency: Washington, DC, USA, 2017.
- Jackson, L.E.; Daniel, J.; McCorkle, B.; Sears, A.; Bush, K.F. Linking ecosystem services and human health: The Eco-Health Relationship Browser. Int. J. Public Health 2013, 58, 747–755. [Google Scholar] [CrossRef] [PubMed]
- Angradi, T.; Ringold, P.; Hall, K. Water clarity measures as indicators of recreational benefits provided by U.S. lakes: Swimming and aesthetics. Ecol. Indic. 2018, 93, 1005–1019. [Google Scholar] [CrossRef]
- De Jesus Crespo, R.; Fulford, R. Eco-health linkages: Assessing the role of ecosystem goods and services on human health using causal criteria analysis. Int. J. Public Health 2018, 63, 81–92. [Google Scholar] [CrossRef]
- Johnston, J.M. Quantitative and Qualitative Linkages between Final Ecosystem Goods and Services and Human Health; Sustainable and Healthy Communities Research Program. EPA/Fact Sheet 2.61.4; U.S. Environmental Protection Agency: Washington, DC, USA, 2019.
- Williams, K.; Hoffman, J. Remediation to restoration to revitalization: Ecosystem based management to support community engagement at clean-up sites in the Laurentian Great Lakes. In Ecosystem Based Management and Ecosystem Services: Theory, Tools, and Practice; Springer: Cham, Switzerland, 2020; pp. 543–559. [Google Scholar]
- Lomnicky, G.A.; Hughes, R.M.; Peck, D.V.; Ringold, P.L. Correspondence between a recreational fishery index and ecological condition for USA streams and rivers. Fish. Res. 2021, 233, 105749. [Google Scholar] [CrossRef]
- Mazzotta, M.; Bousquin, J.; Berry, W.; Ojo, C.; McKinney, R.; Hyckha, K.; Druschke, C.G. Evaluating the ecosystem services and benefits of wetland restoration by use of the rapid benefit indicators approach. Integr. Environ. Assess. Manag. 2019, 15, 148–159. [Google Scholar] [CrossRef] [Green Version]
- Bousquin, J.; Kristen, H. A geospatial assessment of flood vulnerability reduction by freshwater wetlands—A Benefit Indicators Approach. Front. Environ. Sci. 2019, 7, 54. [Google Scholar] [CrossRef] [Green Version]
- Jewhurst, S.L.; Mulvaney, K.K.; Mazzotta, M.J. The application and usefulness of economic analyses for water quality management in coastal areas. J. Ocean. Coast. Econ. 2017, 4, 7. [Google Scholar] [CrossRef] [PubMed] [Green Version]
- Heberling, M.T.; García, J.H. Thurston, H.W. Does encouraging the use of wetlands in water quality trading programs make economic sense? Ecol. Econ. 2010, 69, 1988–1994. [Google Scholar] [CrossRef]
- Warnell, K.J.; Russell, M.; Rhodes, C.; Bagstad, K.J.; Olander, L.P.; Nowak, D.J.; Poudel, R.; Glynn, P.D.; Hass, J.L.; Hirabayashi, S.; et al. Testing ecosystem accounting in the United States: A case study for the Southeast. Ecosyst. Serv. 2020, 43, 101099. [Google Scholar] [CrossRef]
- Weber, M.A.; Mozumder, P.; Berrens, R.P. Accounting for unobserved time-varying quality in recreation demand: An application to a Sonoran Desert wilderness. Water Resour. Res. 2012, 48, W05515. [Google Scholar] [CrossRef]
- World Health Organization. Health Technology Assessment 2020. Available online: https://www.who.int/news-room/q-a-detail/health-technology-assessment (accessed on 15 February 2021).
- Smith, L.M.; Case, J.L.; Smith, H.M.; Harwell, L.C.; Summers, J.K. Relating ecosystem services to domains of human well-being: Foundation for a US index. Ecol. Indic. 2013, 28, 79–90. [Google Scholar] [CrossRef]
- Smith, L.M.; Smith, H.M.; Case, J.L.; Harwell, L. Indicators and Methods for Constructing a U.S. Human Well-Being Index (HWBI) for Ecosystem Services Research; EPA/600/R-12/023; U.S. Environmental Protection Agency: Washington, DC, USA, 2012.
- Smith, L.; Harwell, L.; Summers, J.K.; Smith, H.; Wade, C.; Straub, K.; Case, J. A U.S. Human Well-Being Index (HWBI) for Multiple scales: Linking Services Provisioning to Human Well-Being Endpoints (2000–2010); EPA/600/R-14/223; U.S. Environmental Protection Agency: Washington, DC, USA, 2014.
- Smith, L.M.; Wade, C.M.; Case, J.L.; Harwell, L.C.; Straub, K.R.; Summers, J.K. Evaluating the transferability of a US human well-being index (HWBI) framework to Native American populations. Soc. Indic. Res. 2015, 124, 157–182. [Google Scholar] [CrossRef]
- Orlando, J.; Yee, S.; Harwell, L.; Smith, L. Technical Guidance for Constructing a Human Well-Being Index (HWBI): A Puerto Rico Example; EPA/600/R-16/363; U.S. Environmental Protection Agency: Washington, DC, USA, 2017.
- Yee, S.H.; Paulukonis, E.; Buck, K.D. Downscaling a human well-being index for environmental management and environmental justice applications in Puerto Rico. Appl. Geogr. 2020, 123, 102231. [Google Scholar] [CrossRef]
- Bolgrien, D.; Angradi, T.; Bousquin, J.; Canfield, T.; DeWitt, T.; Fulford, R.; Harwell, M.C.; Hoffman, J.; Hollenhorst, T.; Johnston, J.M.; et al. Ecosystem Goods and Services Case Studies and Models Support Community Decision Making Using the EnviroAtlas and the Eco-Health Relationship Browser; EPA/600/R-18/167; U.S. Environmental Protection Agency: Washington, DC, USA, 2018.
- Wu, J.; Jackson, J. Inverse relationship between urban green space and childhood autism in California elementary school districts. Environ. Int. 2017, 107, 140–146. [Google Scholar] [CrossRef]
- Wu, J.; Rappazzo, K.M.; Simpson, R.J., Jr.; Joodi, G.; Pursell, I.W.; Mounsey, J.P.; Cascio, W.E.; Jackson, L.E. Exploring links between greenspace and sudden unexpected death: A spatial analysis. Environ. Int. 2018, 113, 114–121. [Google Scholar] [CrossRef]
- Wu, J.; Jackson, J. Greenspace Inversely Associated with the Risk of Alzheimer’s Disease in the Mid-Atlantic United States. Earth 2021, 2, 140–150. [Google Scholar] [CrossRef]
- Tsai, W.L.; Davis, A.J.; Jackson, L.E. Associations between types of greenery along neighborhood roads and weight status in different climates. Urban For. Urban Green. 2019, 41, 104–117. [Google Scholar] [CrossRef]
- Tsai, W.L.; Nash, M.S.; Rosenbaum, D.J.; Prince, S.E.; D’Aloisio, A.A.; Neale, A.C.; Sandler, D.P.; Buckley, T.J.; Jackson, L.E. Types and spatial contexts of neighborhood greenery matter in associations with weight status in women across 28 US communities. Environ. Res. 2021, 199, 111327. [Google Scholar] [CrossRef] [PubMed]
- Tsai, W.L.; Yngve, L.; Zhou, Y.; Beyer, K.M.; Bersch, A.; Malecki, K.M.; Jackson, L.E. Street-level neighborhood greenery linked to active transportation: A case study in Milwaukee and Green Bay, WI, USA. Landsc. Urban Plan. 2019, 191, 103619. [Google Scholar] [CrossRef]
- Egorov, A.I.; Griffin, S.M.; Converse, R.R.; Styles, J.N.; Sams, E.A.; Wilson, A.; Jackson, L.E.; Wade, T.J. Vegetated land cover near residence is associated with reduced allostatic load and improved biomarkers of neuroendocrine, metabolic and immune functions. Environ. Res. 2017, 158, 508–521. [Google Scholar] [CrossRef] [PubMed]
- Egorov, A.I.; Converse, R.; Griffin, S.M.; Styles, J.; Klein, E.; Sams, E.; Hudgens, E.; Wade, T.J. Environmental risk factors for Toxoplasma gondii infections and the impact of latent infections on allostatic load in residents of Central North Carolina. BMC Infect. Dis. 2018, 18, 1–11. [Google Scholar] [CrossRef]
- Tsai, W.L.; Silva, R.A.; Nash, M.S.; Cochran, F.V.; Prince, S.E.; Rosenbaum, D.J.; D’Aloisio, A.A.; Jackson, L.E.; Mehaffey, M.H.; Neale, A.C.; et al. How do natural features in the residential environment influence women’s self-reported general health? Results from cross-sectional analyses of a US national cohort. Environ. Res. 2020, 183, 109176. [Google Scholar] [CrossRef] [PubMed]
- Summers, J.K.; Vivian, D.N. Ecotherapy—A forgotten ecosystem service: A review. Front. Psychol. 2018, 9, 1389. [Google Scholar] [CrossRef]
- De Jesus Crespo, R.; Wu, J.; Myer, M.; Yee, S.; Fulford, R. Flood protection ecosystem services in the coast of Puerto Rico: Associations between extreme weather, flood hazard mitigation and gastrointestinal illness. Sci. Total. Environ. 2019, 676, 343–355. [Google Scholar] [CrossRef]
- De Jesús Crespo, R.; Méndez-Lázaro, P.; Yee, S. Linking wetland ecosystem services to vector-borne disease: Dengue fever in the San Juan Bay Estuary, Puerto Rico. Wetlands 2018, 39, 1281–1293. [Google Scholar] [CrossRef]
- Myer, M.H.; Campbell, S.R.; Johnston, J.M. Spatiotemporal modeling of ecological and sociological predictors of West Nile virus in Suffolk County, NY, mosquitoes. Ecosphere 2017, 8, e01854. [Google Scholar] [CrossRef] [Green Version]
- Myer, M.H.; Johnston, J.M. Spatiotemporal Bayesian modeling of West Nile virus: Identifying risk of infection in mosquitoes with local-scale predictors. Sci. Total Environ. 2018, 650, 2818–2829. [Google Scholar] [CrossRef] [PubMed]
- Myer, M.H.; Fizer, C.M.; McPherson, K.R.; Neale, A.C.; Pilant, A.N.; Rodriguez, A.; Whung, P.-Y.; Johnston, J.M. Mapping Aedes aegypti (Diptera: Culicidae) and Aedes albopictus vector mosquito distribution in Brownsville, TX. J. Med. Entomol. 2019, 57, 231–240. [Google Scholar] [CrossRef] [PubMed]
- Yee, D.; DeJesus-Crespo, R.; Hunter, F.; Bai, F. Assessing natural infection with Zika virus in the southern house mosquito, Culex quinquefasciatus, during 2016 in Puerto Rico. Med Vet. Entomol. 2018, 32, 255–258. [Google Scholar] [CrossRef] [PubMed]
- Yee, S.; Yee, D.; de Jesús-Crespo, R.; Oczkowski, A.; Bai, F.; Friedman, S. Linking water quality to Aedes aegypti populations and Zika infection in flood-prone neighborhoods in San Juan, Puerto Rico. EcoHealth 2019, 16, 191–209. [Google Scholar] [CrossRef] [PubMed]
- Shifflett, S.D.; Newcomer-Johnson, T.; Yess, T.; Jacobs, S. Interdisciplinary collaboration on green infrastructure for urban watershed management: An Ohio case study. Water 2019, 11, 738. [Google Scholar] [CrossRef] [Green Version]
- Rea, A.W.; Davis, C.; Evans, D.A.; Heninger, B.T.; Van Houtven, G. Using ecosystem services to inform decisions on US air quality standards. Environ. Sci. Technol. 2012, 46, 6481–6488. [Google Scholar] [CrossRef]
- Sinha, P.; Ringold, P.; Van Houtven, G.; Krupnik, A. Using a final ecosystem goods and services approach to support policy analysis. Ecosphere 2018, 9, e02382. [Google Scholar] [CrossRef]
- Munns, W.R., Jr.; Rea, A.W.; Mazzotta, M.J.; Wainger, L.A.; Saterson, K. Toward a standard lexicon for ecosystem services. Integr. Environ. Assess. Manag. 2015, 11, 666–673. [Google Scholar] [CrossRef]
- Harwell, M.C.; Molleda, J.L.; Jackson, C.A.; Sharpe, L. Establishing a common framework for strategic communications in ecosystem-based management and the natural sciences. In Ecosystem Based Management and Ecosystem Services: Theory, Tools, and Practice; Springer: Cham, Switzerland, 2020; pp. 165–188. [Google Scholar]
- Harwell, M.; Jackson, C. FY 17 Output SHC 2.61 Practical Strategies for Assessing Final Ecosystem Goods and Services in Community Decision Making; EPA/600/R-18/183; U.S. Environmental Protection Agency: Washington, DC, USA, 2018.
- Harwell, M.; Molleda, J. FY 16 Output SHC 2.61 Ecosystem Goods and Services Production and Benefit Functions Case Studies Report; EPA/600/R-18/189; U.S. Environmental Protection Agency: Washington, DC, USA, 2018.
- Harwell, M.; Jackson, C. FY18 Output—SHC 2.61.3—Incorporation of Ecosystem Goods and Services into Community-Level Decision Support Using EnviroAtlas and Other Tools; EPA/600/R-19/087; U.S. Environmental Protection Agency: Washington, DC, USA, 2019.
- Williams, K.; Hoffman, J.; French, N. From remediation to restoration and revitalization: The St. Louis River story. In Great Lakes Revival—How Restoring Polluted Waters Leads to Rebirth of Great Lakes Communities; International Association for Great Lakes Research: Ann Arbor, MI, USA, 2019; pp. 61–66. [Google Scholar]
- Angradi, T.; Williams, K.; Hoffman, J.; Bolgrien, D. Goals, beneficiaries, and indicators of waterfront revitalization in Great Lakes Areas of Concern and coastal communities. J. Great Lakes Res. 2019, 45, 851–863. [Google Scholar] [CrossRef] [PubMed]
- Holifield, R.; Williams, K. Recruiting, integrating, and sustaining stakeholder participation in environmental management: A case study from the Great Lakes Areas of Concern. J. Environ. Manag. 2019, 230, 422–433. [Google Scholar] [CrossRef] [PubMed]
- Yee, S.H. Contributions of Ecosystem Services to Human Well-Being in Puerto Rico. Sustainability 2020, 12, 9625. [Google Scholar] [CrossRef]
- Bradley, M.P.; Fisher, W.; Dyson, B.; Yee, S.; Carriger, J.; Gambirazzio, G.; Bousquin, J.; Huertas, E. Application of a Structured Decision Process for Informing Watershed Management Options in Guánica Bay, Puerto Rico; EPA/600/R-15/248; U.S. Environmental Protection Agency: Washington, DC, USA, 2016.
- Carriger, J.F.; Fisher, W.S.; Stockton, T.B., Jr.; Sturm, P.E. Advancing the Guánica Bay (Puerto Rico) watershed management plan. Coast. Manag. 2013, 41, 19–38. [Google Scholar] [CrossRef]
- Yee, S.H.; Carriger, J.F.; Bradley, P.; Fisher, W.S.; Dyson, B. Developing scientific information to support decisions for sustainable coral reef ecosystem services. Ecol. Econ. 2015, 115, 39–50. [Google Scholar] [CrossRef]
- Bradley, P.; Yee, S. Using the DPSIR Framework to Develop a Conceptual Model: Technical Support Document; EPA/600/R-15/154; U.S. Environmental Protection Agency: Washington, DC, USA, 2015.
- Rehr, A.P.; Small, M.J.; Fischbeck, P.S.; Bradley, P.; Fisher, W.S. The role of scientific studies in building consensus in environmental decision making: A coral reef example. Environ. Syst. Decis. 2014, 34, 60–87. [Google Scholar] [CrossRef]
- Bolte, J.; McKane, R.; Phillips, D.; Schumaker, N.; White, D.; Brookes, A.; Olszyk, D.M. In Oregon, the EPA calculates nature’s worth now and in the future. Solut. Sustain. Desirable Future 2011, 2, 35–41. [Google Scholar]
- Lewis, N.; Fox, E.; De Witt, T. Estimating the distribution of harvested estuarine bivalves with natural-history-based habitat suitability models. Estuar. Coast. Shelf Sci. 2019, 219, 453–472. [Google Scholar] [CrossRef] [PubMed]
- Lewis, N.; Young, D.; Folger, C.; De Witt, T. Assessing the relative importance of estuarine nursery habitats—A dungeness crab (Cancer magister) case study. Estuaries Coasts 2020, 44, 1062–1073. [Google Scholar] [CrossRef] [PubMed]
- Lewis, N.; DeWitt, T. Effect of Green Macroalgal Blooms on the Behavior, Growth, and Survival of Cockles (Clinocardium nuttallii) in Pacific NW Estuaries. Mar. Ecol. Prog. Ser. 2017, 582, 105–120. [Google Scholar] [CrossRef]
- Zimmer-Faust, A.; Brown, C.; Manderson, A. Statistical models of fecal coliform levels in Pacific Northwest estuaries for improved shellfish harvest area closure decision making. Mar. Pollut. Bull. 2018, 137, 360–369. [Google Scholar] [CrossRef] [PubMed]
- Dyson, B.; Carriger, J.; Newcomer Johnson, T.; Moura, R.; Richardson, T.; Canfield, T.J. Community Resilience Planning: A Decision-Making Framework for Coastal Communities; EPA/600/R-19/066; U.S. Environmental Protection Agency: Washington, DC, USA, 2019.
- Yee, S.; Cicchetti, G.; DeWitt, T.H.; Harwell, M.C.; Jackson, S.; Pryor, M.; Rocha, K.; Santavy, D.; Sharpe, L.; Shumchenia, E. The ecosystem services gradient: A descriptive model for identifying levels of meaningful change. In Ecosystem Based Management and Ecosystem Services: Theory, Tools, and Practice; Springer: Cham, Switzerland, 2020; pp. 291–307. [Google Scholar]


| Step | Description |
|---|---|
| Step 1: Ecosystem Delineation | Explain how to define the boundaries of the ecosystem(s) of interest for practical purposes. |
| Step 2: Beneficiary Specification | Describe the beneficiaries to be considered for each ecosystem. |
| Step 2: Attribute Specification | Identify the biophysical components of nature that link with the ecosystem service and beneficiary’s interests. |
| Step 4: Metric Specification | Describe the units of the attribute and discuss the difference between available and ideal metrics. |
| Step 5: Data Availability | Consider the availability of appropriately selected data for the proposed metric. |
Publisher’s Note: MDPI stays neutral with regard to jurisdictional claims in published maps and institutional affiliations. |
© 2021 by the authors. Licensee MDPI, Basel, Switzerland. This article is an open access article distributed under the terms and conditions of the Creative Commons Attribution (CC BY) license (https://creativecommons.org/licenses/by/4.0/).
Share and Cite
Harwell, M.C.; Jackson, C.A. Synthesis of Two Decades of US EPA’s Ecosystem Services Research to Inform Environmental, Community and Sustainability Decision Making. Sustainability 2021, 13, 8249. https://doi.org/10.3390/su13158249
Harwell MC, Jackson CA. Synthesis of Two Decades of US EPA’s Ecosystem Services Research to Inform Environmental, Community and Sustainability Decision Making. Sustainability. 2021; 13(15):8249. https://doi.org/10.3390/su13158249
Chicago/Turabian StyleHarwell, Matthew C., and Chloe A. Jackson. 2021. "Synthesis of Two Decades of US EPA’s Ecosystem Services Research to Inform Environmental, Community and Sustainability Decision Making" Sustainability 13, no. 15: 8249. https://doi.org/10.3390/su13158249