Abstract
Background: Recently (in 2018), females were legally allowed to drive and use automobiles in Saudi Arabia (SA) for the first time. This study investigated and analyzed the general fear of driving (GFDS), perceived self-confidence (PSCR), socio-economic variables, demographic distribution, and self-reported RTCs in novice female drivers from SA. Methods: The work was based on survey responses from 9608 participants from the first generation of female drivers from SA. Factor analysis was used to extract GFDS and PSCR scales. Results: Cronbach’s α values of 0.781 and 0.800 were observed for GFDS and PSCR, respectively. Logistic regression was employed to model road traffic collisions (RTCs) as a function of all significant variables. The results showed that of the 17.4% of geographically distributed respondents who reported RTCs, only 4% reported severe or minor injuries, and the rest (96.0%) of the accidents involved property damage. The GFDS and PSCR values showed a positive association with the RTCs of novice female drivers. Furthermore, age was not a significant influencing factor in the RTCs of novice female drivers. However, exposure factors were positively associated with the risk of RTC involvement. Conclusions: Female novice drivers who were single, divorced/widowed, employed, and had higher individual incomes were at higher risk of getting into RTCs. The female drivers who hired personal trainers, compared to those who did not, exhibited similar chances of getting involved in RTCs. An extra on-road in-traffic driving lesson is suggested to be included in the new-driver license training program for drivers with higher GFDS in SA.
1. Introduction
Road traffic crashes (RTCs) are still among the leading causes of death and injury worldwide [1]. An estimated 1.35 million global annual deaths occur due to RTCs [2]. A substantial proportion of RTCs are attributed to young and novice drivers [3,4,5]. For this reason, numerous past studies have focused on the attitudes [6], driving behavior [3,5,7,8], etc., of novice drivers. The aim of such studies is to understand and establish factors leading to the over-representation of novice drivers in RTCs. In this process, crash and behavior-predictive models have been developed to assist in devising traffic safety measures and improvements in driver training programs [9,10,11].
The analysis of self-reported accidents involving male and female novice drivers (young and middle aged) has revealed that different driving conditions/circumstances (day/night; slippery roads, etc.) lead to different crash risk levels among the various classes of drivers [7]. An earlier study showed no significant association between driving confidence in slippery road conditions and the crash frequency due to slippery road conditions among novice drivers [6]. It was also established that novice drivers perceive hazards less holistically, overestimate their driving skills, and take risks more frequently than experienced drivers [3]. Non-fatal accidents were found to be due to errors in attention and visual searching, speeding, as well as errors in hazard recognition and emergency maneuvers [8]. Young learner drivers who practiced driving from 16 years of age before acquiring a license at 18 showed an up to 40% lower risk of being involved in traffic crashes [12]. Young female novice drivers were reported to drive less frequently and showed fewer chances of being involved in a traffic crash than their male counterparts [13]. The findings from these and similar studies play a crucial role in understanding and decreasing road traffic accidents among novice drivers.
Saudi Arabia (SA) is among the countries struggling with a high number of RTCs, reporting a fatality rate of 28.8 per hundred thousand in 2018 [2]. This fatality rate is significantly higher than those of similar countries in the Gulf region, such as the United Arab Emirates, with 18.1/100,000, etc. According to the Saudi Ministry of the Interior—General Directorate of Traffic (MI-GDT), a total of 437,602 RTCs were recorded in 2019, with more than 37% reported from the capital city of Riyadh [14]. These RTC statistics are high for a population of 34.2 million [15]. A significantly higher proportion of young male Saudi drivers were reported to be involved in severe injury and fatal RTCs than older male drivers [16,17]. The reason for this was that young Saudi male drivers were associated with risky, aggressive, and high-speed driving behavior [18,19,20]. More than 50% of young male Saudi drivers who engaged in risky driving behavior also engaged in stunts and dangerous driving activities [19]. On 24 June 2018, a law restricting females from driving in SA was abolished. Since then, a significant number of females have claimed their rights, secured a driving license, and are now also behind the wheel [21]. According to MI-GDT accident statistics from 2019, 5295 male and 730 females lost their lives in RTCs, whereas 25,314 males and 4903 females were injured [16]. These accident statistics did not separate the number of accident victims involved in the crash as passengers, pedestrians, drivers, etc. However, a significantly higher number of males were involved in RTCs than females, at a minimum ratio of 5:1. In addition, almost all previous RTC studies reported from SA were based on data consisting of male drivers’ behavior and their involvement in RTCs. Thus, a good overview of the variables associated with male RTC involvement is available in the literature, and several such studies have been mentioned in this section. However, there is little to no in-depth studies reporting on RTCs involving female drivers from SA.
This study is one of the first to report findings on female drivers and their accident involvement from SA. What makes this study more interesting is that most previous studies on novice drivers (either male, female, or both) have been based on drivers aged between 16 and 20 years old [8,10,12,13,19] or between 17 and 25 years old [18,20,22], whereas this study is more comprehensive. The few studies that have included novice drivers aged over 25 had to deal with the problem of limited representation and a less comprehensive age range for the older age group [6,7,11]. In this study, the previous absence of the right to drive among women in SA resulted in a novice driver population encompassing a broader age range (from 17 to 66 years). Both young and middle-aged drivers are well represented.
The main purpose of this study is to investigate the factors influencing the RTCs of novice females from Saudi Arabia (SA). Variables considered in this work include driver attributes such as a fear of driving and perceived self-confidence, as well as socio-economic and demographic factors.
2. Materials and Methods
Nine thousand six hundred and eight (9608) female participant responses were analyzed in this study. The mean ± standard deviation (SD), maximum, and minimum age of the participants were 38.2 ± 8 years, 66 years, and 17 years, respectively. The average period of driving experience among participants was 10.8 months (SD = 6 months). Participants were from the first generation of female drivers in Saudi Arabia. The driving license procedure includes limited hours of driving lessons and virtual driving simulation within the driving school environment, followed by physical and virtual driving tests.
The data utilized in this study were extracted from a national survey study conducted from June to November of 2019 [21]. The criteria for selection included female participants of all ages, who had obtained a driving license after 26 September 2017, and who were currently driving within Saudi Arabia. Only RTCs in which the participant was the drivers, which occurred after the ban on female driving was lifted, were considered. Self-reported RTCs were used in this study [5,18,22,23,24], making it easier to establish a relationship between crash involvement and some key driver attributes. Socio-demographic variables, such as the participants’ age, education level, employment status, marital status, travel time to work/study and the frequency of this travel, income levels, the use of a private trainer, the average duration of driving experience, etc., were collected and analyzed.
Additionally, six items with five-point Likert scale questions (see Table 1) that explored the participants’ driving-related fears, perceived self-confidence, and fear of public judgment/criticism were included. Previous studies have utilized specific driving events and circumstances (e.g., driving at night, in the rain, in peak hours, in congested traffic, etc.) to estimate driving confidence [25,26]. Several studies used a similar approach to estimate driving fear or phobia by considering situational avoidance or the expression of confidence in such driving events/circumstances as indicative of a participant’s level of fear [27,28]. The results have shown that no significant association exists between such driving fear scales and RTCs [27]. In this study, a simple and generalized driving fear score (GDFS) was used to capture the overall state of fear of the novice drivers’ minds during their early driving stage. Conventional fear of driving scales include specific questions and circumstances that novice drivers might not have experienced and which can always be avoided, especially if they appear too risky. It has been established that older drivers avoid driving when they feel less confident [25]. These reasons could explain why the RTCs of drivers are unrelated to their expressed fears or their level of fear as captured by these scales. In addition, specific circumstance/event questions have the potential to skew the general average level of driving fear associated with a given driver because the mental average provided by the driver themselves could be different from that computed using the known scales. For the same reason, the simplified perceived self-confidence rating (PSCR) of the participants, which is independent of driving, was also analyzed because the conventional scale of driving confidence was also reported not to be associated with driving performance [29] or with the risk of RTC [6].

Table 1.
Self-reported road traffic accidents stratified by demographics and other variables, N = 9608.
The association between self-reported RTCs and the studied variables was analyzed using Chi-squared statistics. Factor analysis was employed to extract three constructs from the six items assessed using the five-point Likert scale. Cronbach’s alpha statistics for factors with more than 1 item were estimated to ensure internal consistency and reliability. Spearman’s coefficient of correlation ρ was used to examine the inter-relationship between the extracted components. Finally, ordinal logistic regression analysis (with the logit link function) was used to model RTC involvement. MiniTab™ 18 and IBM SPSS™ (26th version) statistical software were utilized to carry out the statistical analysis.
3. Results
Table 1 summarizes a cross-tabular analysis of the association between observed variables and the RTC involvements of the female drivers. Out of the 9608 respondents, 1672 (17.40%) of them reported having been involved in property damage crashes, whereas only 70 (0.72%) were involved in road traffic accidents involving minor or serious injury. Except for participants’ age and hiring a private trainer, all other observed variables were significantly associated with participants being involved in an RTC (p-value < 0.05). A substantially higher proportion of “divorced/widowed” and “single” female drivers were involved in RTCs as compared to “married” female drivers (p-value < 0.001). More “Saudi” female drivers reported being involved in RTC than their “non-Saudi” counterparts. Female drivers with higher education levels reported being involved in traffic crashes more than those with lower education (p-value = 0.019). A larger proportion of “employed” female drivers reported being in RTCs than those without employment (p-value < 0.001). The ratio of participants with higher “individual income” that were involved in RTCs was significantly higher than those with lower individual income (p-value < 0.001). A higher percentage of female driver respondents with longer “travel time to work/education” were involved in a traffic crash than those with shorter travel times (p-value < 0.001). A lower proportion of female drivers with lower “weekly trip frequencies” were involved in a road traffic accident than those with higher trip frequencies (p-value < 0.001). A significantly higher percentage of female drivers who secured licenses earlier reported being involved in RTCs than those who obtained their licenses later (p-value < 0.001). This implies that the length of the period from securing a driving license to the present significantly influences the participants’ chances of getting involved in a traffic crash.
Figure 1 shows the percentage of geographical distribution of the RTCs reported by trained and licensed drivers from the various driving schools across SA. The highest percentage of severe- or minor-injury RTCs (1.44%) was reported by Eastern drivers who received their licenses from the women’s driving school at Imam Abdulrahman bin Faisal University. Drivers who obtained a license from the Saudi driving school at Princess Noura University in Riyadh reported the highest percentage of property damage accidents (17.78%).
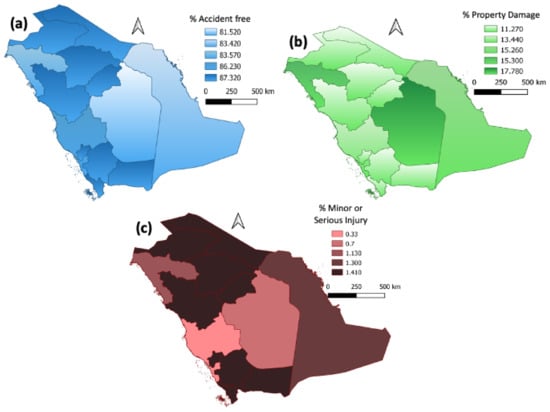
Figure 1.
Spatial distribution of RTC types across Saudi Arabia: (a) percentage of RTC-free drivers, (b) percentage of drivers who reported property damage RTCs, (c) percentage of drivers who reported minor- or serious-injury RTCs.
Table 2 presents the descriptive statistics of the six five-point Likert scale items presented to the participants. Factor analysis using oblimin rotation with Kaiser normalization was employed to extract three factors from the set of listed items, as shown in Table 3. The rotation converged in four iterations with a 0.63 Kaiser–Meyer–Olkin measure of sampling adequacy. Bartlett’s test of sphericity showed statistical significance (χ2 = 16725.01, df = 15, p-value < 0.001). The three factors explained 80.03% of the total variance. Items #1, #2, and #3 were loaded together to form factor 1 (mean = 8.97, SD = 3.10, ranges from 3 to 15). Factor 1 represents the general fear of driving score (GFDS). The higher the GFDS, the stronger the fear of driving of the participant. Items #4 and #5 were loaded together and were selected to form factor 2 (mean = 9.34, SD = 1.28, ranges from 2–10). Factor 2 represents the respondents’ perceived self-confidence rating (PSCR) regarding their newfound freedom and decision to drive. Cronbach’s α of 0.781 and 0.800 were observed for factor 1 (GFDS) and factor 2 (PSCR), respectively. This indicates good reliability and internal consistency of the two constructs. Item #6 did not fit into any of the previous two factors and was considered as factor 3. Factor 3 represents the participants’ concern/fear of public judgment when seen driving. The term ‘fear of public criticism on decision to drive (FPCDD)’ was used to summarize this factor.
Table 2.
List of items measuring general fear of driving, perceived self-confidence, and concern for public judgment.
Table 3.
Pattern matrix for various items.
The associations between GFDS, PSCR, and FPCDD and RTC involvement are presented in Table 4. Statistically, a significant association existed between participants’ GFDS and traffic crash involvement (p-value < 0.001). Female drivers with higher GFDS were involved in RTCs more than those with lower GFDS. More female drivers with higher PSCR values were also involved in RTCs than those with low PSCR values (p-value = 0.013). No significant association was found between RTC involvement and FPCDD (p-value > 0.05). A fair degree of correlation was observed between the three components. FPCDD was found to be positively correlated with GFDS (ρ = 0.271, p-value < 0.001). This implies that participants with high FPCDD will more likely exhibit higher GFDS. But PSCR correlated negatively with FPCDD (ρ = −0.25, p-value < 0.001), meaning that higher PSCR in a participant indicates a good chance that the participant will demonstrate lower FPCDD. A weak negative correlation was also observed between GFDS and PSCR (ρ = −0.212, p-value < 0.001). Female drivers with high PSCR values were likely to exhibit lower GFDS. Both GFDF and PSCR were considered in the traffic crash regression model because of the low inter-correlations between the two constructs (−0.70 > −0.212 < 0.70), and their significant association with traffic crash involvement.
Table 4.
Self-reported road traffic accidents stratified at various levels of the new constructs.
Because GFDS is a training-driving-related construct, the associations between GFDS and various driving schools, travel time to work, and trip frequency were also analyzed. No significant connection was found between the driving schools where drivers received their license and the GFDS of drivers (p-value = 0.814). GFDS was also found to be unassociated with the “travel time to work/education” of the drivers (p-value = 0.790). However, the “weekly trip frequency” of the drivers was slightly associated with their GFDS (p-value = 0.045).
A regression model of RTC involvement is presented in Table 4. The test of the slopes of the regression model yielded a significant result (p-value < 0.001), which indicates that traffic crash involvement was significantly associated with at least one of the predictors. The model’s deviance (goodness of fit) was insignificant (p-value > 0.05), indicating that the predicted probabilities did not deviate from the observed probabilities. The duration of the period after obtaining the license (months), travel time to work/education (minutes), PSCR, and GFDF were used as covariates, whereas other categorical variables were considered as factors. All predictors in the model showed significant associations with RTC involvement except “education level”. The “education level” was kept in the model because it showed a p-value very close to the significance level of 0.05 and improved the model’s predictability.
Drivers showed an increased probability of being involved in a road traffic accident (odds ratio = 1.05, p-value < 0.001) for every unit increase in GFDS. Similarly, female drivers with higher PSCR values were associated with a 1.05 times higher risk of getting involved in an RTC (p-value = 0.020). For every 1-min increase in travel time, there was an associated 1.01-times-higher chance of being involved in a traffic crash (p-value < 0.05). There was a 1.02-times-higher tendency to get into a traffic crash for every month that passed after the time when the driver obtained their license (p-value < 0.001). “Single” and “divorced/widowed” female drivers showed 1.49 and 1.78 higher tendencies to get involved in RTCs, respectively. “Employed” female drivers were 1.33 times more likely to report being in traffic crashes than their “unemployed” counterparts. Drivers earning individual income showed increased odds of being in traffic crashes than those without an individual income. The increase in the odds ratios from “none” to higher levels was consistent with the previously observed results, as shown in Table 5.
Table 5.
Ordinal logistic regression model for the self-reported road traffic accidents.
4. Discussion
Univariate and logistic regression analyses were performed to analyze the connection between self-reported RTCs involving novice female drivers from SA with their GFDS, PSCR, socio-economic variables, demographics, etc. The study included novice drivers from young (18–25 years), intermediate (26–35 years), and middle (36–66 years) age categories. The participant drivers had an average of 10.8 months of driving experience (SD = 6 months). The reliability and internal consistency of the GFDS and PSCR scales were assessed and established.
The majority of the drivers were not involved in any form of RTC; only 17.40% and 0.72% reported property damage and minor/serious-injury RTCs, respectively. No fatal RTCs were reported among the novice female drivers. This finding is in accordance with previous studies on female drivers from Australia, who mainly reported property damage RTCs [23]. Another study showed that women drivers are generally involved in less severe RTCs [30]. This is a positive outcome given the high rate of fatal RTCs among young male novice drivers from SA [16,19]. It also debunks earlier pessimistic predictions made by several conservative individuals and religious clerics about the supposed threat of an increase in the incidence and severity of RTCs due to the new female driving law [31].
No significant differences in RTC involvement between the very young (18–25 years), intermediate (26–35 years), and the older (above 36 years) novice female drivers were observed. This is because, regardless of the significant difference in tge ages of the driver population, they are all inexperienced (with an average driving duration of 10.8 ± 6 months). A similar observation was reported in a comparative study of young novice drivers (16–19 years) [8]. However, in cases where the different driver groups have significantly different driving experiences, younger drivers have been found to be more frequently involved in RTCs than middle-aged drivers [23,30]. This reaffirms findings from previous studies, which showed that the impact of driving experience exceeded that of age at the early stage of driving [4,8]. Similarly, no association between RTCs and additional private training was observed in this study. This is a positive indication that the current public driver training program provides the basic required training and even that additional private training does not make a difference regarding risks of RTC.
The average travel time to work/education, weekly trip frequency, and average duration of holding a driving license were proportional to the amount of driving. These variables showed a positive relationship with the RTC involvement of drivers. This is in line with the findings from another study, showing that the risk of RTCs in novice drivers increases with the distance driven during the first 24 months of driving [7]. Consistently with the observations of the current study, other studies have also shown that married females tend to have a lower risk of being involved in RTCs than single and widowed/divorced female drivers [23,32]. This might not be unassociated with a potential higher trip frequency of single/widowed/divorced female drivers as compared to married drivers, because weekly trip frequency showed a positive association with the RTC involvement of the participants. For a similar reason (most likely), the “employed” drivers showed a higher tendency to be involved in RTCs than the unemployed. Similar observations with respect to employment status were also previously reported by Sehat et al. [32].
Although “education level” showed some association with RTC, it was not found to be a significant predictor of RTC involvement among these female drivers. This observation is also consistent with a previous study on young male drivers’ RTCs in the same country [18]. Drivers with higher “individual income” showed a higher likelihood of being in an RTC than those with lower income. Participants with higher “individual income” are mainly employed and travel more frequently. As a result, they are more exposed as compared to those with lower income levels.
The odds of drivers getting into RTCs increases with an increase in GFDS. Novice female drivers with a stronger fear of driving are more likely to be involved in RTCs than those with less fear. Previous studies that used the conventional fear of driving scale, which consisted of specific driving event items, reported a non-association of driving fear with RTC [27]. The GFDS employed in this study showed a significant association with the RTC involvement of these novice drivers. As mentioned earlier, this could be because the conventional scales used in previous studies captured specific situations that drivers feared and avoided during their driving [25], or these driving fears may be independent of the RTC involvement of the drivers, as reported. Another possible reason for this observation is that findings from the previous studies were mostly based on experienced and older drivers, whereas this study was based on novice female drivers from a wide range of age categories (young to middle-aged). The association of GFDS with RTCs could also be due to the limitations of the new driver-license training program, which include only limited driving lessons in isolated real and virtual environments. It was mentioned in Section 3 that the GFDS values were uniform across all the driving schools in KSA. The new drivers in KSA do not undergo in-traffic lessons/monitoring, as practiced in some countries with better road traffic safety records. Based on findings from the GFDS scale, on-road in-traffic driving lessons can go a long way in reducing the fear of driving among new drivers. As a result, it would be a welcome development and a further step toward safer roads if on-road in-traffic lessons could be added to the new-driver-license training in KSA.
The observed higher tendency towards RTCs in female drivers with higher PSCR values could be associated with some of the novice drivers’ natural over self-confidence. Earlier studies have shown that novice drivers tend to overestimate their driving skills, underestimate the risk of potential hazards, and take uncalculated risks [3]. However, the fear of public judgment on being seen driving (FPCDD) was not found to be associated with RTCs in this study. This item and finding are unique to this study. The category was intended to capture the effect of potential cultural stigmatization that some of the new female drivers might have been subjected to in their RTC involvements. It is general knowledge that SA is a highly conservative country with some portion of the population that is opposed to the new female driving rights [31]. A similar fear of public judgment/resentment in female drivers has also been reported among ultra-orthodox Jewish communities in Israel [33]. In this study, we found there to be no significant association between the fear of public stigmatization among the female drivers and their involvement in RTCs. This finding is not an indication of the absence of incidences of stigmatization or harassment faced by female drivers.
5. Conclusions
Based on the findings from this study and some other previous studies, age is not a significant influencing factor in RTCs involving novice female drivers. But exposure (trip frequency, travel time to work/education, duration after license, etc.) is positively associated with the risk of RTC involvement in female novice drivers. Female novice drivers who are single, divorced/widowed, employed, and have higher individual incomes are at higher risk of getting into RTCs. Female drivers who hired private trainers and those who did not have a similar risk of getting involved in RTCs. The general fear of driving (GFDS) and perceived self-confidence (PSCR) scales utilized in this study showed good reliability, internal consistency, and a positive association with RTCs. Further evaluation of these simple scales is recommended to establish repeatability because the new scales can serve as additional criteria for targeted intervention programs to curb RTC levels in novice drivers. An example of such an intervention is providing extra on-road in-traffic lessons to new drivers who showed higher GFDS values.
This study revealed that the rate of severe- or minor-injury RTCs was 1.44%. Drivers who obtained a license from the Saudi driving school at Princess Noura University in Riyadh reported the highest percentage of property damage accidents (17.78%).
Some of the limitations of this study that are worth noting are similar to those reported in previous studies that also utilized self-reported RTCs [18]. It should be mentioned that the use of self-reported RTCs in the study was justified, considering the objectives and scope of the study. Findings from the study can be considered valid for the population sample. Moreover, the large number of participants included in the study is a positive factor that should be considered with regards to the reliability of the constructs/scales used in the study.
Author Contributions
Conceptualization, N.A.-G. and O.A.; methodology, M.A.D. and O.A.; software, M.A.D.; formal analysis, O.A. and M.A.D.; investigation, N.A.-G., M.A.D. and O.A.; resources, N.A.-G.; data curation, M.A.D. and O.A.; writing—original draft preparation, N.A.-G., M.A.D. and O.A.; writing—review and editing, M.A.D., N.A.-G. and O.A.; visualization, O.A.; supervision, O.A. and N.A.-G.; project administration, N.A.-G. and O.A.; funding acquisition, N.A.-G. All authors have read and agreed to the published version of the manuscript.
Funding
This research received no external funding.
Data Availability Statement
Conflicts of Interest
The authors declare no conflict of interest.
References
- WHO. Monitoring Health for the SDGs, Sustainable Development Goals; World Health Organization: Geneva, Switzerland, 2020. [Google Scholar]
- WHO. Global Status Report on Road Safety 2018; World Health Organization: Geneva, Switzerland, 2018. [Google Scholar]
- Deery, H.A. Hazard and Risk Perception among Young Novice Drivers. J. Safety Res. 1999, 30, 225–236. [Google Scholar] [CrossRef]
- Maycock, G. Novice Driver Accidents and the Driving Test; Crowthorne House: Berkshire, UK, 2002. [Google Scholar]
- Scott-Parker, B.; Proffitt, C. Validation of the Behaviour of Young Novice Drivers Scale (BYNDS) in a New Zealand young driver population. Accid. Anal. Prev. 2015, 77, 62–71. [Google Scholar] [CrossRef]
- Katila, A.; Keskinen, E.; Hatakka, M.; Laapotti, S. Does increased confidence among novice drivers imply a decrease in safety? The effects of skid training on slippery road accidents. Accid. Anal. Prev. 2004, 36, 543–550. [Google Scholar] [CrossRef]
- Laapotti, S.; Keskinen, E.; Hatakka, M.; Hernetkoski, K.; Katila, A.; Peräaho, M.; Salo, I. Driving Circumstances and Accidents Among Novice Drivers. Traffic Inj. Prev. 2006, 7, 232–237. [Google Scholar] [CrossRef]
- McKnight, A.J.; McKnight, A.S. Young novice drivers: Careless or clueless? Accid. Anal. Prev. 2003, 35, 921–925. [Google Scholar] [CrossRef]
- Gregersen, N.P.; Bjurulf, P. Young novice drivers: Towards a model of their accident involvement. Accid. Anal. Prev. 1996, 28, 229–241. [Google Scholar] [CrossRef] [Green Version]
- Ehsani, J.P.; Seymour, K.E.; Chirles, T.; Kinnear, N. Developing and testing a hazard prediction task for novice drivers: A novel application of naturalistic driving videos. J. Saf. Res. 2020, 73, 303–309. [Google Scholar] [CrossRef] [PubMed]
- de Winter, J.C.F. Predicting self-reported violations among novice license drivers using pre-license simulator measures. Accid. Anal. Prev. 2013, 52, 71–79. [Google Scholar] [CrossRef]
- Gregersen, N.P.; Berg, H.-Y.; Engström, I.; Nolén, S.; Nyberg, A.; Rimmö, P.-A. Sixteen years age limit for learner drivers in Sweden—an evaluation of safety effects. Accid. Anal. Prev. 2000, 32, 25–35. [Google Scholar] [CrossRef] [Green Version]
- Prato, C.G.; Toledo, T.; Lotan, T.; Taubman-Ben-Ari, O. Modeling the behavior of novice young drivers during the first year after licensure. Accid. Anal. Prev. 2010, 42, 480–486. [Google Scholar] [CrossRef]
- MI-GDT. Traffic Accident Statistics as of 2018; Ministry of Interior—General Directorate of Traffic (MI-GDT): Riyadh, Saudi Arabia, 2019. [Google Scholar]
- GAS-KSA Statistics Library. General Authority for Statistics Kingdom of Saudi Arabia (GAS-KSA): Saudi Arabia. Available online: https://www.stats.gov.sa/en (accessed on 31 July 2021).
- MI-GDT. Injured and Dead in Accidents 1439 H.; Ministry-of-Interior-General-Directorate-of-Traffic (MI-GDT): Riyadh, Saudi Arabia, 2019. [Google Scholar]
- Alogaili, A.; Mannering, F. Unobserved heterogeneity and the effects of driver nationality on crash injury severities in Saudi Arabia. Accid. Anal. Prev. 2020, 144, 105618. [Google Scholar] [CrossRef]
- Mohamed, M.; Bromfield, N.F. Attitudes, driving behavior, and accident involvement among young male drivers in Saudi Arabia. Transp. Res. Part F Traffic Psychol. Behav. 2017, 47, 59–71. [Google Scholar] [CrossRef]
- Ramisetty-Mikler, S.; Almakadma, A. Attitudes and behaviors towards risky driving among adolescents in Saudi Arabia. Int. J. Pediatr. Adolesc. Med. 2016, 3, 55–63. [Google Scholar] [CrossRef] [Green Version]
- Hassan, H.M. Investigation of the self-reported aberrant driving behavior of young male Saudi drivers: A survey-based study. J. Transp. Saf. Secur. 2016, 8, 113–128. [Google Scholar] [CrossRef]
- Al-Garawi, N.; Kamargianni, M. Impact of Women Driving Cars on the Sustainable Development and Traffic Safety in the Kingdom of Saudi Arabia—Phase 2 Survey Results; Dammam, Saudi Arabia, 2020. Available online: https://www.iau.edu.sa/sites/default/files/resources/report_wave_2_final.pdf (accessed on 31 July 2021).
- Scott-Parker, B.; Watson, B.; King, M.J.; Hyde, M.K. Confirmatory factor analysis of the Behaviour of Young Novice Drivers Scale (BYNDS). Accid. Anal. Prev. 2012, 49, 385–391. [Google Scholar] [CrossRef] [Green Version]
- Dobson, A.; Brown, W.; Ball, J.; Powers, J.; McFadden, M. Women drivers’ behaviour, socio-demographic characteristics and accidents. Accid. Anal. Prev. 1999, 31, 525–535. [Google Scholar] [CrossRef]
- Chen, Y.-L. Driver personality characteristics related to self-reported accident involvement and mobile phone use while driving. Saf. Sci. 2007, 45, 823–831. [Google Scholar] [CrossRef]
- Marottoli, R.A.; Richardson, E.D. Confidence in, and self-rating of, driving ability among older drivers. Accid. Anal. Prev. 1998, 30, 331–336. [Google Scholar] [CrossRef]
- Coxon, K.; Chevalier, A.; Lo, S.; Ivers, R.; Brown, J.; Keay, L. Behind the Wheel: Confidence and Naturalistic Measures of Driving Exposure Among Older Drivers. Transp. Res. Rec. 2015, 2516, 35–43. [Google Scholar] [CrossRef]
- Taylor, J.; Deane, F.; Podd, J. Driving-related fear: A review. Clin. Psychol. Rev. 2002, 22, 631–645. [Google Scholar] [CrossRef]
- Taylor, J.E.; Deane, F.P. Acquisition and severity of driving-related fears. Behav. Res. Ther. 1999, 37, 435–449. [Google Scholar] [CrossRef]
- Riendeau, J.A.; Maxwell, H.; Patterson, L.; Weaver, B.; Bédard, M. Self-rated confidence and on-road driving performance among older adults: Autoévaluation de la confiance et de la performance au volant chez les personnes âgées. Can. J. Occup. Ther. 2016, 83, 177–183. [Google Scholar] [CrossRef]
- Santamariña-Rubio, E.; Pérez, K.; Olabarria, M.; Novoa, A.M. Gender differences in road traffic injury rate using time travelled as a measure of exposure. Accid. Anal. Prev. 2014, 65, 1–7. [Google Scholar] [CrossRef] [PubMed]
- Wheeler, D.L. Saudi Women Driving Change? Rebranding, Resistance, and the Kingdom of Change. J. Middle East Afr. 2020, 11, 87–109. [Google Scholar] [CrossRef]
- Sehat, M.; Naieni, K.H.; Asadi-Lari, M.; Foroushani, A.R.; Malek-Afzali, H. Socioeconomic Status and Incidence of Traffic Accidents in Metropolitan Tehran: A Population-based Study. Int. J. Prev. Med. 2012, 3, 181–190. [Google Scholar]
- Guggenheim, N.; Taubman-Ben-Ari, O. Women as a key to enhancing road safety in ultraorthodox communities in Israel. Transp. Res. Part F Traffic Psychol. Behav. 2015, 30, 22–29. [Google Scholar] [CrossRef]

Publisher’s Note: MDPI stays neutral with regard to jurisdictional claims in published maps and institutional affiliations. |
© 2021 by the authors. Licensee MDPI, Basel, Switzerland. This article is an open access article distributed under the terms and conditions of the Creative Commons Attribution (CC BY) license (https://creativecommons.org/licenses/by/4.0/).