Article

Shared Low-Speed Autonomous Vehicle System for Suburban Residential Areas

1
Department of Civil Engineering, Graduate School of Engineering, Nagoya University, Nagoya 4648601, Japan
2
Institutes of Innovation for Future Society, Nagoya University, Nagoya 4648601, Japan
3
Institute of Materials and Systems for Sustainability, Nagoya University, Nagoya 4648601, Japan
*
Author to whom correspondence should be addressed.
Sustainability 2021, 13(15), 8638; https://doi.org/10.3390/su13158638
Submission received: 21 June 2021 / Revised: 23 July 2021 / Accepted: 28 July 2021 / Published: 3 August 2021
(This article belongs to the Section Sustainable Transportation)

Abstract

:
In the context of global suburbanization and population aging, a low-speed, automated vehicle (LSAV) system provides essential mobility services in suburban residential areas. Although extensive studies on shared autonomous vehicle (SAV) services have been conducted, quantitative investigations on the operation of suburban LSAV systems are limited. Based on a demonstration pilot project of an autonomous vehicle called “Slocal Automated Driving”, we investigated the performance of an SAV system considering several scenarios in Kozoji Newtown, a suburban commuter town in Japan. The agent-based simulation results revealed that 40 LSAVs can satisfy the demands of 2263 daily trips with an average wait time of 15 min. However, in the case of a high-speed scenario, the same fleet size improved the level of service (LOS) by reducing the average wait time to two and a half minutes and halving the in-vehicle time. By contrast, the wait time in terms of the average and 95th percentile of the no-sharing ride scenario drastically deteriorated to an unacceptable level. Based on the fluctuations of hourly share rates, wait times, and the number of vacant vehicles, we determined that preparing for the potential fleet insufficiency periods from 7:00–13:00 and 15:00–18:00 can improve the LOS.

1. Introduction

1.1. Suburbanization and Autonomous Vehicles

The two trends of development that cause traffic demand include motorization and suburbanization. Typically, motorization results in economic development, which in turn improves the income and general wellbeing of the population [1]. Over the past five decades, vehicle registrations have increased over ten times worldwide [2]. For example, the United States of America as a developed country approached saturation at the beginning of the 21st century [2] in terms of mildly fluctuated numbers of cars in use. Suburbanization is the stage of urban development wherein the peripheral areas of the city are developed into residential spaces while the urban center undergoes depopulation [3]. It appears in developed countries, such as the Czech Republic and [4] Poland [3], along with developing countries [3,5,6]. Typically, the development of motorization and suburbanization generates traffic around urban areas.
Under these circumstances, autonomous vehicles (AVs) are essential in terms of potential solutions, particularly when dealing with the deterioration of personal mobility of suburban residents [7] and reducing the need for cars [1,7]. Based on the technologies and practices of AVs, two aspects are expected to improve. One is the aspect of urban areas [3,7,8,9], particularly in terms of forming city sprawl [7,10] and reducing parking demands [9] and labor costs [8]. The other involves individual aspects, such as better accessibility [7,11], lower stress [7], and safer services [12,13,14].
Several studies have been conducted on various topics of AVs, such as sharing AVs (car-sharing and ride-sharing), park-and-ride services [15], public transport [8,16,17], conceptual implementation [18,19,20,21], regional services [15,17], cost benefits [18,22,23], and placement of conventional vehicles [18,19,20,21]. Previously, it has been reported that vehicle sharing [15,24,25] and ridesharing [21,26] profoundly affect AVs. Inspired by the pilot project CarLink [27,28], even the park-and-ride scheme was considered in the field of AVs [15].

1.2. Low-Speed AV Pilot Projects

Based on the potential solutions and benefits of AVs, several pilot projects that utilize low-speed AVs (LSAVs) exist. For instance, short demonstrations and pilot deployments have spread across the United States. Typically, the short demonstrations are hosted in a closed-road environment of a campus for events or conferences. However, several projects are longer than short demonstrations and last for months or years, such as the one-year project of shuttles in the City of Arlington, Texas, in 2017. According to the report of the US Department of Transportation [29], low-speed automated shuttles are associated with common features, such as the maximum speed is limited to 25 mph (approximately 40 km/h) or lower, and cruising speeds are maintained at approximately 10–15 mph (approximately 16–24 km/h).
Moreover, projects such as CityMobil2 [30] have been introduced in several European cities, including La Rochelle (France), Vantaa (Finland), and San Sebastian (Spain). It generally runs at a low speed of approximately 10 km/h to ensure the safety of demonstration and captures positive attitudes from the residents [30]. Additionally, pilot demonstrations exist in other countries, including Singapore and Japan [29].
The demand for AVs is emerging in Japan for three reasons. First, in an aging society, elderly drivers are recommended to return their driver’s licenses owing to the high risk of traffic accidents. It is difficult for the elderly people residing in suburban or rural areas to live without cars as the city structure of those areas is car-dependent. Second, young people commonly tend to lose interest in cars. Third, specialized qualifications of professional chauffeurs are legally required, which increases the cost of transportation services in terms of manpower. Thus, research on AV systems in Japan is prominent as the technologies can be implemented. Additionally, considering the elderly residents’ driving safety and pre-existing demonstrations overseas, LSAV services can be suitably implemented in Japan.
To empower the aging society through advanced mobility based on the aforementioned reasons, the Center of Innovation (COI) of Nagoya University has been developing a project named “Slocal (slow and local) Automated Driving”, the implementation of which was attempted in Aichi Prefecture [31]. Herein, the pilot project in a suburban area near Nagoya city, which is the capital city of Aichi Prefecture, utilized low-speed (lower than 20 km/h) rather than high-speed vehicles to ensure safety. After several experiments, a plan to implement the operation was considered, which requires a system design that includes information on the number of potential demands, target areas, number of vehicles, type of ride (shared or individual), and capacity of the vehicles.

1.3. Agent-Based Simulation and Reaserch Gap

Agent-based simulation can be useful when considering the implementation of a shared autonomous vehicle (SAV) system as a mobility service. Based on a comprehensive literature review of SAV services [32], we determined that existing studies on agent-based simulations focus on changes in residential locations [33], urban parking demands [9], ownership, shared use [34], operational characteristics of electric SAVs [35], and impact of SAV services [26,36] such as environmental impact [37] and variation in a modal split [38].
However, suburban areas were absent when shared LSAVs were tested in agent-based simulations. Hence, the major objective of this study is to provide an investigation into the performance of shared LSAVs in suburban areas.

1.4. Motivation

The two motivations are the research gap above and the context of global suburbanization as well as population aging. Thus, this study aimed to propose a shared LSAV system in suburban areas. Using an agent-based simulation, we examined the system performance by two means: (1) evaluating from the perspectives of users and system operation efficiency (2) investigating the effects of speed and ride-sharing schemes.
We selected an area in Kozoji Newtown as the case study for the conceptual implementation of the sharing system before performing the simulations. The indications from the simulation results formed the basis for evaluating the proposed sharing system.
The remainder of this paper is organized as follows. Section 2 explains the structure of the proposed system and its adaptation to the case study. Section 3 discusses the specific simulation of this study in detail. Finally, the results and major findings with potential future applications are summarized in Section 4 and Section 5, respectively.

2. Case Study and the System

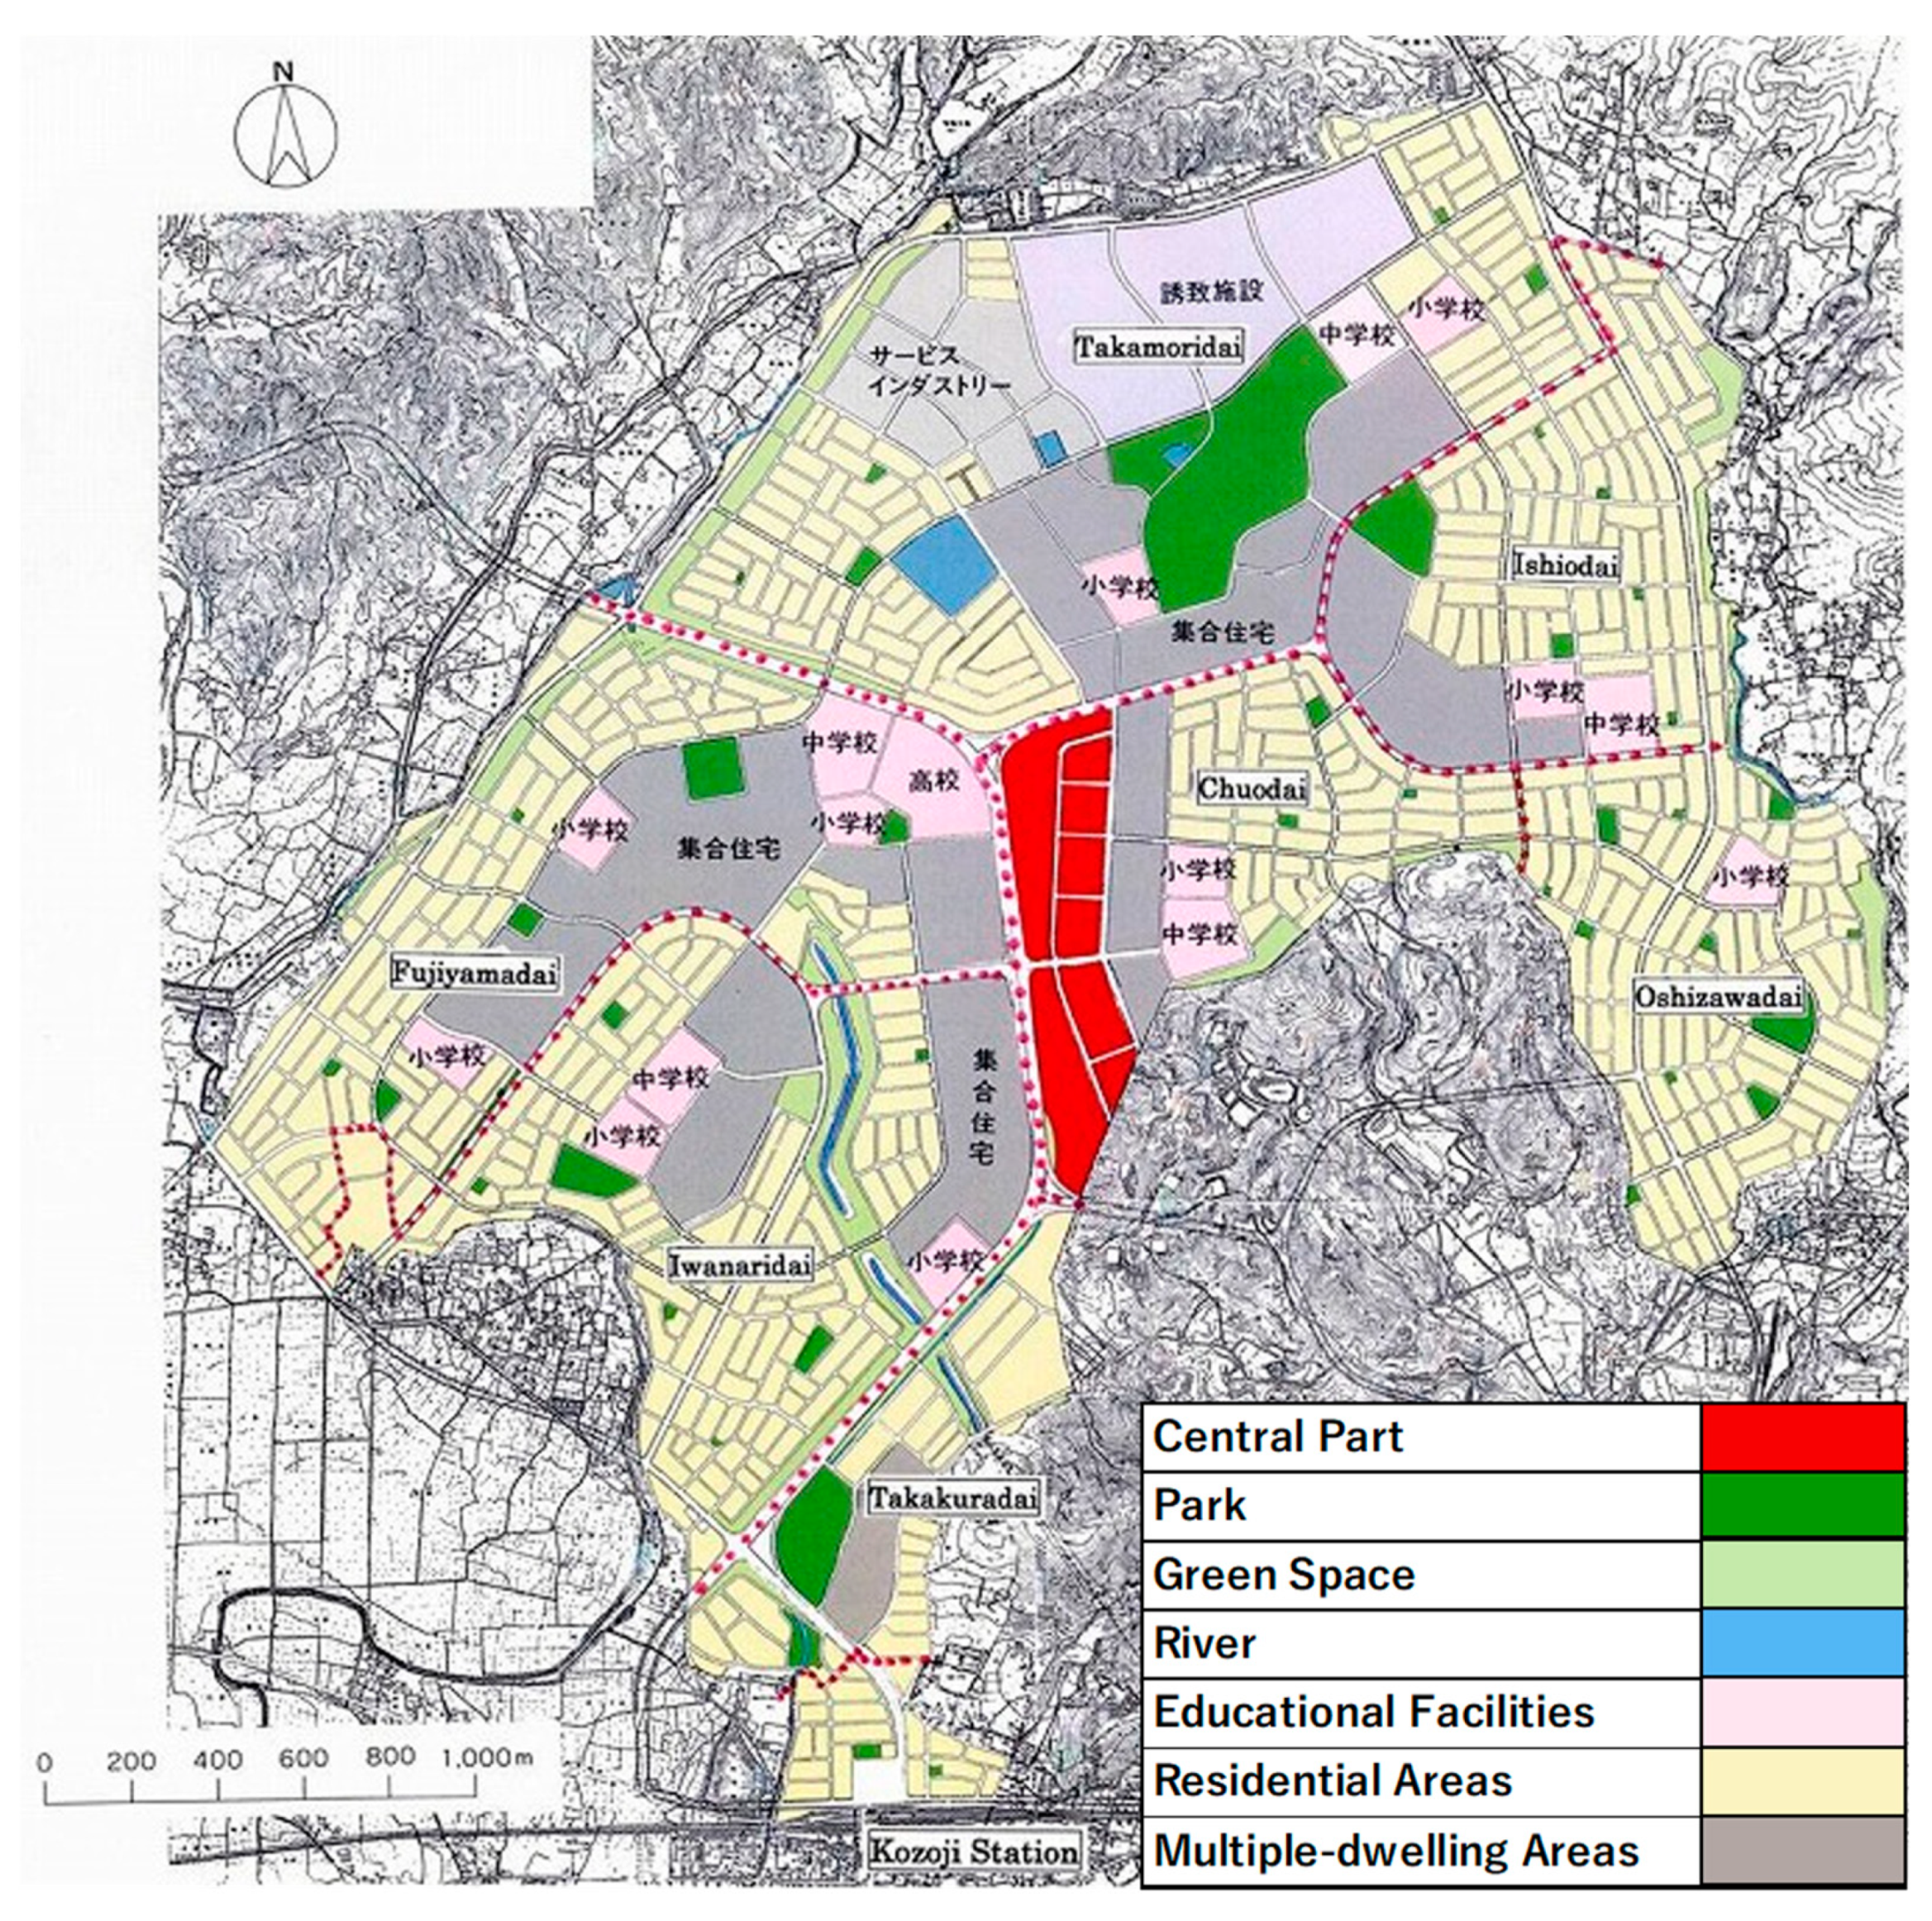
2.1. Case of Kozoji Newtown

2.1.1. Commuter Town with Aging Population

Kozoji Newtown is a typical commuter town that was developed in 1962 [39]. At present, the town has as aging population. From the perspective of city planning, the town was developed as a commuter town, also known as “bedroom community” or “dormitory town” (UK), within the metropolitan area of Nagoya, located approximately 17 km northeast of the center of Nagoya city. Hence, the town is considered to follow suburbanization and is attached to typical features of suburbs.
As one of the three typical commuter towns in Japan, its regional planning presents significant potential for mobility service studies. Additionally, the town was planned as a one-centered area before its construction. The central area of the town is depicted as the red sector (Figure 1), which includes a large shopping center.
From a demographic perspective, the town comprised 41,661 residents and 19,240 families in 2019 [40]. Moreover, population aging is an explicit feature of the town, with the percentage of elderly people (the population aged 65 years and above) exceeding the average for Japan. In other words, the town’s percentage of the elderly population was 35.5% [40], whereas the average in Japan was 28.4% [41] in 2019. However, this study did not particularly discriminate the traffic demand of the elderly population during the investigation.

2.1.2. Transportation Infrastructure and Travel Behavior

When it comes to the road network of Kozoji Newtown, it is planned with a one-center open community system, apartments and pedestrian roads are arranged radially from the center according to the terrain. Five arterial lines have been developed with branch roads [42,43].
As for the public transport system, there are about 20 bus lines running through the study area, including three loop-line bus lines, during daytime and nighttime [44].
As for the travel behavior, the share of trips taken using different modes of transportation to the center area are provided in the study of Kitamura. Generally, the mode of automobile and walking dominate all five subareas. More than 50% of residents departing from three peripheral subareas used automobile, while about 50% of residents from the other two subareas prefer walking [45].

2.1.3. Experiments on Slocal Automated Driving in Kozoji Newtown

To allow senior citizens to stay mobile and increase their participation in the community, the COI provides various applications and services, including Slocal Automated Driving. It can be applied to various vehicles, from micro-cars (e.g., vehicles with one seat) to buses based on road conditions. [31]
Since 2017, a part of Kozoji Newtown has been one of the experimental areas for the pilot demonstration of Slocal Automated Driving. It provides intra-regional last-mile mobility services, cooperating with people and society through LSAVs. Although the SAV system is designed based on the Slocal Automated Driving project, it was rarely used during the experiment because of the limited number of participants.

2.1.4. Possible Issues of LSAV

The users, operators, and stakeholders may worry about the possible future issues of LSAV in Kozoji Newtown. For example, congestion, parking, and safety. Utilizing LSAV may possibly cause congestion. This is because the proposed vehicles could potentially cause a bottleneck on a real road due to their low speed. Thus, when deploying in reality, support for the LSAV system is suggested. For example, deploying priority lanes for the LSAVs may help. As for parking, it is less likely to be an issue because there are some spare spaces resulting from the population decrease. Regarding safety, accidents caused by the elder drivers could be reduced since they would return their driver’s license with ease if there are alternative transport modes.

2.2. System Design for the Simulation

The system proposed in this study is designed to provide mobility services to users of the entire area in Kozoji Newtown. Furthermore, a sharing ride service was simulated for comparison. After consulting experts of the Slocal Automated Driving project, the speed was adjusted to 15.0 km/h on arterial roads and 7.5 km/h on other roads based on the vehicle performance and actual traffic conditions in the town.
The demand data determined the number of users with both origins and destinations within the town. Kozoji station was excluded as it is covered the loop-line bus and public transit, which has no cooperation with the proposed SAV system. Moreover, the demand data did not discriminate between the users based on age, occupation, or gender. The proposed SAV system is expected to provide service to all potential users in the area only during the designed operation hours from 6:00 a.m. to 11:59 p.m. The vehicle’s waiting areas were set in the central area of the town (Figure 1), including a large shopping center (central part) and a citizen communication center (educational facilities). In this study, all accessible public roads within the town area are considered the road network for the proposed system.

3. Simulation

3.1. Input Data

3.1.1. Demand Data

The demand data were obtained from a previous study [45] in terms of the average number of trips handled by SAVs from an origin to a destination with a zone size of 250 m-mesh. The researchers [45] processed three types of data, namely the mobile phone movement history data from a Japanese telecommunications operator called KDDI, the Person Trip Survey data of the Metropolitan Area of Chukyo (PT data of Nagoya Metropolitan) [46], and the stated preference (SP) data of the residents’ willingness to use the Slocal Automated Driving collected by a questionnaire survey. The PT data of the Nagoya Metropolitan area provide information on the number of personal trips with trip purpose and travel mode between five small zones in the town. Conversely, the KDDI’s mobile phone movement history data can provide the number of trips without trip purpose and travel mode information between 250 m-mesh zones in the town. The combined PT/KDDI data and SP data were used to estimate the travel mode choice model, referred to as the RP/SP combined multinominal logit model. Based on the model results, the demand was calculated when the SAV cost was 200 JPY per km (approximately 1.8 USD). In the case of simulation, the number of trips between the zones was randomly obtained using a Poisson distribution [9,32,35] based on the demand data’s hourly average number of trips [45]. Ten sets of demand data were prepared, wherein the total number of trips varied from 2197 to 2331 with an average of 2263 and a distribution as illustrated in Figure 2. The total number of trips per day in the PT data was 29,495 [45], which implies that 10% of these trips use SAVs.

3.1.2. Geographic Information System (GIS) Data

The road network of the case study primarily comprises links, nodes, and their attributes, such as arterial roads, where vehicles can perform at higher speeds. A set of 250 m-meshed demand data was utilized in this study, which is suitable for LSAVs that are expected to be operated in narrow areas of the town [45].

3.2. System Operation

All simulation experiments of the proposed LSAV system were performed using artisoc version 4.2. Artisoc is an agent-based simulation software. Its simulations are executed by multiple agents concurrently interacting with each other in accordance with their individual rules [47].
The operation flow, methods of dispatching the fleet, and settings of the ride sharing are explained in this section.

3.2.1. General Flow of Operation

The simulation flow involves four major components, namely the input data and settings, initialization, simulation, and final output.
The initialization begins after the input data and settings are loaded. Herein, the generation and attribute assignment of agents (passengers and vehicles) during the entire day is performed based on the demand data. The exact times of the requests generated from passengers are assigned randomly during initialization based on the demand data.
In the simulation, one step of the simulation is assumed to represent one second in real-time, and it repeats until the end of the operating time (1:00 a.m.). Simulation executions are performed within a single step, including the timely generation of passengers’ requests, vehicle operation, and related data recording. Meanwhile, the status of agents continues to interfere and change; for example, vehicles update their status to stand-by, search sharing rides, and canceling service. These interfering behaviors are based on preprogrammed rules, such as dispatching strategies and sharing methods written in Visual Basic.

3.2.2. Service Period and Routing

In the case of service periods of simulations, we focused on trips from 6:00 a.m. to 11:59 p.m. in this study. All routing operations of the fleet are based on the Dijkstra algorithm to identify the shortest paths between nodes in a road network. The actual congestion of the Kozoji Newtown’s road network was not considered in the study.

3.2.3. Dispatching Strategies

Two types of vehicle dispatching strategies, namely the initial dispatching and re-dispatching, were used in this study. The nearest vehicle is dispatched to a newly requested passenger or a user when there is an available vehicle(s) in the fleet. This is called initial dispatching. The available vehicles include those standing by and deadheading (backing to the generated location without passengers after completed trips).
After a request is accepted, the longest waiting passenger is given a second chance to request a new vehicle to save time. When a vehicle is available closer to the longest-waiting passenger in comparison with the dispatched vehicle, the nearer vehicle replaces the originally dispatched vehicle to pick the passenger up. This is called re-dispatching. Finally, passengers bear a “maximum time before cancel” (set as 500 min), wherein they are expected to cancel the trip if no vehicle is dispatched during this time.

3.2.4. Sharing

After dispatching, ride-sharing among passengers is a key operation in the proposed system (Figure 3).
Herein, all vehicles in the fleet are assumed to comprise two seats. The preconditions for a vehicle to ride-share are (a) the next node is not the destination for the in-vehicle passenger and (b) the vehicle is not full of passengers. The eligible vehicle searches the area within a circle of radius 100 m and considers the nearest passenger. Additionally, two types of preconditions exist for the embarked passenger and the one waiting at the origin. First, the absolute additional travel time by sharing the ride (the time length from the current moment until the passenger’s arrival) is less than 5 min in comparison with the non-sharing ride. Second, the rate of sharing the trip’s travel time divided by the non-sharing trip is less than 1.5 times.
A sharing ride is triggered only when the precondition of a vehicle and the preconditions of both passengers are satisfied. The vehicle then chooses the best order, leading to the shortest travel time for both passengers among all possible orders.

4. Results and Discussion

4.1. Output Logs and Calculation

4.1.1. Output Logs

Two output data were available after the simulation, namely the passenger logs and vehicle logs. The passenger logs were processed indispensably to analyze the level of service (LOS). Similarly, the vehicle logs offered suggestions for system efficiency.
The passenger logs recorded two types of passenger-related parameters. First, four moments essential for calculating LOS results, including the moments of requesting, embarking a vehicle, disembarking a vehicle, and canceling the request; second, preliminary attributes of an individual passenger, such as the Origin and Destination Node IDs, as well as the information attached terminally, such as Share Ride (bool) and Vehicle ID. These were recorded to enrich the information dimension. Unlike the passenger logs, the vehicle logs were less complex, comprising the time length of the vehicle’s different statuses and corresponding rates.

4.1.2. Calculation and Criteria

  • Definitions and Calculation
The key criterion of LOS in this study was the wait time, which refers to the time length from requesting the vehicle until being picked up irrespective of whether it is a shared vehicle. For instance, the wait time of trip p or a passenger, which are both regarded as the same concept in this study, can be calculated as:
T p _ w t = m p _ e b k m p _ r e q
where Tp_wt denotes the wait time of trip p, mp_ebk indicates the moment of the passenger’s embarking, and mp_req represents the moment of requesting of trip p.
Similarly, the in-vehicle time length is the difference between the moments of embarking and disembarking. Therefore, the total travel time is calculated as the sum of both the wait time and in-vehicle time of the same trip.
A shared trip is the trip of a passenger who shares the vehicle with the in-vehicle time. The share rate (%) of the entire AV system during the hour (h) is calculated using
R s t _ h = ( N s t _ h / N t _ h ) %
where Rst_h denotes the share rate during the hour h, Nst_h indicates the number of sharing rides that are requested in the hour h, and Nt_h represents the total number of trips that are requested in the hour h.
Finally, the fleet operational condition included three vehicle-related parameters, namely the wait time, vacant time, and utilized time. Herein, the wait time is the time length of a vehicle standing without request; vacant time is the time length of a vehicle picking up a passenger or going back to its generated space without passengers; and utilized time is the time length of a vehicle when carrying passengers.
The calculation of their rates was similar and simple. For example, the rate of wait time for a vehicle can be derived from
R v _ w t = ( T v _ w t / P ) %
where R v _ w t denotes the rate of wait time of the vehicle during its service period P and T v _ w t indicates the time length of the wait time of vehicle v.
The rate of vacant time and utilized time for a vehicle can be derived from (4) and (5), respectively:
R v _ v t = ( T v _ v t / P ) %
R v _ u t = ( T v _ u t / P ) %
where R v _ v t and R v _ u t respectively denote the rate of vacant time and utilized time of the vehicle during its service period P and T v _ v t and T v _ u t respectively indicate the time length of the vacant time and utilized time of vehicle v.
  • Criteria
In terms of average, maximum, and 95th percentile, wait time plays a key role in determining the LOS in this study. Additionally, the hourly share rates during the service period provide insight into the system’s ride-sharing situation.
From the passengers’ perspective, the wait time is an indispensable factor that can measure their experience of the services. Bischoff and Maciejewski [20] argued that waiting times for an autonomous taxi (AT) should never be considerably higher than the time it takes to park and un-park a vehicle. Apart from the average waiting times, the 95th percentile of wait time was introduced as a criterion in their study.
Furthermore, both the share rate and fleet operational condition are considered the criteria to indicate the system efficiency directly.

4.2. Scenario Results

We considered three experimental scenarios, namely the high-speed, low-speed, and no-sharing ride scenarios, which vary in terms of both speed setting and ride-sharing strategy (Table 1).

4.2.1. LOS

  • Wait Time
Based on the settings employed in the proposed system, the results of the low-speed scenario were obtained considering fleet sizes that varied from 40 to 70 (Table 2). In the low-speed scenario, fleet sizes of 60 and 70 exhibited the ability to provide a quick-response service in terms of an average wait time of less than 5 min, and nearly all passengers waited less than 12 min (95th percentile wait time). Conversely, the average wait time of 40 vehicles expanded to 15 min, and the 95th percentile wait time increased to an unacceptable level of 36 min.
In the case of a fleet size of 40 in the no-sharing ride scenario, the passengers waited for nearly two hours on average (Table 3). By contrast, the wait time in the high-speed scenario was drastically reduced to approximately two and a half minutes. Moreover, most passengers in the high-speed scenario waited for a short time of less than 6 min. However, the 95th percentile wait time of the no-sharing ride scenario exceeded three and a half hours, which is unacceptable for a short trip with an average in-vehicle time of approximately 8 min.
As indicated in Table 3, the ratios of passengers are significantly different in the three time-lengths of wait times. In the no-sharing ride scenario, fewer than 10% of the passengers waited for less than 30 min as the average time was approximately 2 h. Conversely, in the low-speed scenario, the number of passengers waiting for less than 30 min is approximately 90%, which is nearly nine times the number in the no-sharing scenario. Additionally, in the low-speed scenario, the number of passengers that waited for less than 10 or 5 min was significantly higher than the corresponding numbers for the no-sharing ride scenario. As the ride-sharing service is the only distinction between these two scenarios, we concluded that the ride-sharing strategy improves the LOS by offering a shorter wait time to a larger portion of passengers. Based on the comparison of the low-speed and high-speed scenarios, the clear differences appear only in the wait time of less than 10 or 5 min. Thus, it can be inferred that a higher speed prevents passengers from waiting long. In other words, a service with ride-sharing and higher speed can be more appealing from a passenger’s perspective.
  • Fleet Size
The fleet size ranging from 40 to 60 vehicles was set as the minimum fleet size of the no-sharing ride scenario because fewer than 40 vehicles resulted in an unignorable number of passengers who could not ride by the end of the simulation. The result of 60 vehicles for the no-sharing scenario exhibits an average wait time of 5 min and 9 s, which is not significantly different from the results of the low-speed scenario.
  • In-vehicle Time
Generally, the passengers in Kozoji Newtown undertake short and less fluctuating trips in response to the three scenarios. The average in-vehicle time of the fleet of 40 vehicles is close to eight minutes in the two low-speed scenarios; however, it is half of that in the high-speed scenario (Table 4).
Additionally, the 95th percentile of the in-vehicle time in the low-speed scenario is the longest (18 and a half minutes) among the three, which is close to the similar low-speed scenario without sharing rides (16 and a half minutes). Similar to the wait time, the in-vehicle time in the high-speed scenario reduced by half to 8 min.

4.2.2. Share Rate

The share rates of the low-speed scenario’s different fleet sizes varied significantly (Table 5). It was approximately 5% for 60 or 70 vehicles, whereas it increased by approximately eight times (43%) when the fleet size decreased by only one-third (40 vehicles). Nevertheless, a mere 2% of trips were shared in the high-speed scenario with a fleet size of 40.
Furthermore, the hourly wait times and share rates during the day are important from the operating company’s perspective. Together with various fleet sizes, they may also offer some constructive ideas. Figure 4 and Figure 5 indicate that the hourly wait time and share rate, respectively, fluctuate based on the time of day, and significantly increase at 11:00 and 16:00 to match the demand.
In the case of the fleet operational condition of the low-speed scenario, we calculated the time lengths and rates of wait time, vacant time, and utilized time (Table 6). The ratios of their average lengths were approximately 2:4:4 during a daily period of 18 h. Additionally, the wait time of vehicles was highly spread out in comparison with the vacant time or utilized time.
Figure 6 illustrates the vacant vehicles at different times of the day. As indicated in the figure, the insufficiency of the fleet explicitly occurred both in the morning and afternoon. In the low-speed scenario with 40 vehicles, the entire fleet was occupied during approximately 7:00–13:30 and 15:00–18:30.
Based on the fluctuations of share rates and hourly wait times, we determined that the time periods of 7:00–13:00 and 15:00–18:00 generally require a higher number of vehicles than other times during the day. From the standpoint of an operator, more available vehicles may come into use before the periods to improve the LOS. Based on the results of 40, 50, and 60 vehicles, it is suggested that deploying at least 10 additional vehicles may evidently shorten the overloaded period and wait time.

5. Conclusions

In this study, we investigated the performance of an LSAV system to improve mobility services in suburban areas using an agent-based simulation.

5.1. Major Findings

  • The proposed low-speed system based on Slocal Automated Driving for Kozoji Newtown satisfied the local demand using 40 vehicles within the service period.
  • Considerations regarding wait times:
    Although 40 vehicles of the proposed low-speed system managed to satisfy the daily demand of 2263 trips in the case study, the average wait time was 15 min long, which is not ideal.
    However, in the case of a high-speed scenario, the same fleet size improved the LOS significantly by reducing the average wait time to two and a half minutes.
    By contrast, the wait time in terms of the average and 95th percentile of the no-sharing ride scenario drastically deteriorated to an unacceptable level of over 100 min.
  • Considerations regarding the share rate and fleet occupation:
    The share rate of the low-speed scenario was substantially lower when utilizing a larger fleet size. It remained at approximately 5% for 60 vehicles, whereas it increased to 43% when the fleet size decreased by 20 vehicles.
    Under the same fleet size of 40 vehicles, the low-speed scenario exhibited a significantly higher share rate of approximately 43% than that of the high-speed scenario, which was approximately 2%.
    Based on the fluctuations of hourly share rates, wait times, and the number of vacant vehicles in the low-speed scenario with 40 vehicles, we determined that the operator should prepare for potential fleet insufficiency time periods from 7:00–13:00 and 15:00–18:00 to improve the LOS.

5.2. Future Work

The limitations of the system design and simulation observed in this study need to be addressed in the future.
  • The case of a 40-vehicle fleet has a low share rate. It is important to examine trade-offs under some thresholds, because changing the threshold may lead to a decrease in waiting time and an increase in travel time simultaneously.
  • The improvement of LOS in the high-speed scenario, wherein the wait time was reduced from 15 min to two and a half minutes, was evident. Thus, the operational speed must be explored further.
  • The concept of Slocal Automated Driving [31] states that a correlated system comprises two types of fleets that are arranged to support the local mobility service system simultaneously. For example, a fleet of shared mini-electric vehicles offers a short-distance service within a small zone, whereas loop-line buses link small zones together. This correlated system of the two fleets can be considered for future development of the proposed system, particularly in terms of the passenger capacity of the vehicles. Additionally, combining the current fleet with vehicles with higher passenger capacities (for example, six-seater minibuses) as a kind of service mix of the LSAV system may reduce the wait time during peak hours. Moreover, although the current system can serve between any origin and destination in the study area, a combination with other existing modes (for example, a bus line with fixed routes) of transportation should be considered.
  • This study did not discriminate between trip purposes when utilizing the demand data. However, a specific trip purpose may potentially reveal a further relationship between the proposed system and related user groups. Thus, it is meaningful to design new scenarios with different trip purposes.

Author Contributions

Conceptualization, T.Y. and H.S.; methodology, T.Y.; formal analysis, Y.Z. and H.S.; data curation, Y.Z. and H.S.; writing—original draft preparation, Y.Z.; writing—review and editing, T.Y., H.S. and Y.Z.; funding acquisition, T.Y. and H.S. All authors have read and agreed to the published version of the manuscript.

Funding

This work was supported by JSPS KAKENHI, grant numbers 16H02367 and JP19K04651.

Institutional Review Board Statement

Not applicable.

Informed Consent Statement

Not applicable.

Data Availability Statement

Restrictions apply to the availability of these data, including the Person Trip Survey data of the Metropolitan Area of Chukyo (PT data) and the KDDI’s mobile phone movement history data (mobile phone data) and the COI’s stated preference data of the residents’ willingness to use the Slocal Automated Driving (SP data). PT Data, mobile phone data and SP data were obtained from Ministry of Land, Infrastructure, Transport and Tourism Government of Japan (MLIT), KDDI cooperation and COI, respectively. They are available with the permission of MLIT, KDDI and COI individually. Additionally, the GIS mesh data used in this study is openly available in e-Stat (a governmental official statistics website) at https://www.e-stat.go.jp/en (accessed on 24 May 2021).

Acknowledgments

The authors express their appreciation to all individuals and organizations who supported this study.

Conflicts of Interest

The authors declare no conflict of interest.

References

  1. Ksenofontov, M.Y.; Milyakin, S.R. The Influence of the Spread of Automatic Control and Sharing Technologies on Motorization Processes: Concept, Calculation Scheme, Forecast. Stud. Russ. Econ. Dev. 2020, 31, 254–263. [Google Scholar] [CrossRef]
  2. Kulp, G.; Holcomb, M.C. Transportation Energy Data Book, 39 ed.; Oak Ridge National Laboratory: Oak Ridge, TN, USA, 2020. Available online: https://tedb.ornl.gov/ (accessed on 24 May 2021).
  3. Ostenda, A.; Nestorenko, T.; Yemchenko, I. The Suburbanization Process and Quality of Life. In Proceedings of the ITEMA 2019 Conference, Bratislava, Slovakia, 24 October 2019. College of Economics and Management in Public Administration. [Google Scholar] [CrossRef]
  4. Burian, J.; Voženílek, V. Identification and Analysis of Urbanization and Suburbanization in Olomouc region—Possibilities of GIS Analytical Tools. In Advances in Spatial Planning; InTech: London, UK, 2012; pp. 143–164. [Google Scholar]
  5. Feng, J.; Zhou, Y. Suburbanization and the Changes of Urban Internal Spatial Structure in Hangzhou, China. Urban Geogr. 2005, 26, 107–136. [Google Scholar] [CrossRef]
  6. Zhou, Y.; Ma, L.J.C. Economic restructuring and suburbanization in China. Urban Geogr. 2000, 21, 205–236. [Google Scholar] [CrossRef]
  7. Meyer, J.; Becker, H.; Bösch, P.M.; Axhausen, K.W. Autonomous vehicles: The next jump in accessibilities? Res. Transp. Econ. 2017, 62, 80–91. [Google Scholar] [CrossRef] [Green Version]
  8. Shen, Y.; Zhang, H.; Zhao, J. Integrating shared autonomous vehicle in public transportation system: A supply-side simulation of the first-mile service in Singapore. Transp. Res. Part A Policy Pract. 2018, 113, 125–136. [Google Scholar] [CrossRef]
  9. Zhang, W.; Guhathakurta, S.; Fang, J.; Zhang, G. Exploring the impact of shared autonomous vehicles on urban parking demand: An agent-based simulation approach. Sustain. Cities Soc. 2015, 19, 34–45. [Google Scholar] [CrossRef]
  10. Zakharenko, R. Self-driving cars will change cities. Reg. Sci. Urban Econ 2016, 61, 26–37. [Google Scholar] [CrossRef]
  11. Cohen, T.; Cavoli, C. Automated Vehicles: Exploring Possible Consequences of Government (non) intervention for Congestion and Accessibility. Transp. Rev. 2019, 39, 129–151. [Google Scholar] [CrossRef] [Green Version]
  12. Kang, N.; Feinberg, F.M.; Papalambros, P.Y. Autonomous electric vehicle sharing system design. J. Mech. Des. 2016, 139, 011402. [Google Scholar] [CrossRef]
  13. Fagnant, D.J.; Kockelman, K. Preparing a nation for autonomous vehicles: Opportunities, barriers and policy recommendations. Transp. Res. Part A Policy Pract. 2015, 77, 167–181. [Google Scholar] [CrossRef]
  14. Krueger, R.; Rashidi, T.H.; Dixit, V.V. Autonomous driving and residential location preferences: Evidence from a stated choice survey. Transp. Res. Part C Emerg. Technol. 2019, 108, 255–268. [Google Scholar] [CrossRef] [Green Version]
  15. Zhou, Y.; Li, Y.; Hao, M.; Yamamoto, T. A System of Shared Autonomous Vehicles Combined with Park-And-Ride in Residential Areas. Sustainability 2019, 11, 3113. [Google Scholar] [CrossRef]
  16. Wen, J.; Chen, Y.X.; Nassir, N.; Zhao, J. Transit-oriented autonomous vehicle operation with integrated demand-supply interaction. Transp. Res. Part C Emerg. Technol. 2018, 97, 216–234. [Google Scholar] [CrossRef]
  17. Sieber, L.; Ruch, C.; Hörl, S.; Axhausen, K.W.; Frazzoli, E. Improved public transportation in rural areas with self-driving cars: A study on the operation of Swiss train lines. Transp. Res. Part A Policy Pract. 2020, 134, 35–51. [Google Scholar] [CrossRef]
  18. Litman, T. Autonomous Vehicle Implementation Predictions; Victoria Transport Policy Institute: Victoria, BC, Canada, 2017. [Google Scholar]
  19. Bischoff, J.; Maciejewski, M. Autonomous taxicabs in Berlin—A spatiotemporal analysis of service performance. Transp. Res. Procedia 2016, 19, 176–186. [Google Scholar] [CrossRef]
  20. Bischoff, J.; Maciejewski, M. Simulation of city-wide replacement of private cars with autonomous taxis in Berlin. Procedia Comput. Sci. 2016, 83, 237–244. [Google Scholar] [CrossRef] [Green Version]
  21. Liu, Z.; Miwa, T.; Zeng, W.; Morikawa, T. An agent-based simulation model for shared autonomous taxi system. Asian Transp. Stud. 2018, 5, 1–13. [Google Scholar] [CrossRef]
  22. Bösch, P.M.; Becker, F.; Becker, H.; Axhausen, K.W. Cost-based analysis of autonomous mobility services. Transp. Policy 2018, 64, 76–91. [Google Scholar] [CrossRef]
  23. Fujigaki, Y.; Takami, K.; Ohmori, N.; Harata, N. Equilibrium Analysis and Profit Maximization Method for Highly Convenient Shared Ride Taxi. J. Jpn. Soc. Civ. Eng. 2015, 1, A_133–A_141. (In Japanese) [Google Scholar] [CrossRef]
  24. Moreno, A.T.; Michalski, A.; Llorca, C.; Moeckel, R. Shared Autonomous Vehicles Effect on Vehicle-Km Traveled and Average Trip Duration. J. Adv. Transp. 2018, 23, 8969353. [Google Scholar] [CrossRef] [Green Version]
  25. Chen, T.D.; Kockelman, K.M. Management of a shared autonomous electric vehicle fleet: Implications of pricing schemes. Transp. Res. Rec. 2016, 2572, 37–46. [Google Scholar] [CrossRef]
  26. Fagnant, D.J.; Kockelman, K.M. Dynamic ride-sharing and fleet sizing for a system of shared autonomous vehicles in Austin, Texas. Transportation 2018, 45, 143–158. [Google Scholar] [CrossRef]
  27. Shaheen, S.A.; Rodier, C.J. Travel effects of a suburban commuter carsharing service: CarLink case study. Transp. Res. Rec. 2005, 1927, 182–188. [Google Scholar] [CrossRef]
  28. Shaheen, S.A.; Novick, L. Framework for testing innovative transportation solutions: Case study of CarLink, a commuter carsharing program. Transp. Res. Rec. 2005, 1927, 149–157. [Google Scholar] [CrossRef]
  29. Cregger, J.; Dawes, M.; Fischer, S.; Lowenthal, C.; Machek, E.; Perlman, D. Low-Speed Automated Shuttles: State of the Practice Final Report (No. FHWA-JPO-18-692). United States. Joint Program Office for Intelligent Transportation Systems; 2018. Available online: https://rosap.ntl.bts.gov/view/dot/37060 (accessed on 5 April 2021).
  30. European Commission (EC). Final Report Summary—CITYMOBIL2 (Cities Demonstrating Cybernetic Mobility). 2016. Available online: https://cordis.europa.eu/project/id/314190/reporting (accessed on 5 April 2021).
  31. Official COI Website. Available online: http://www.coi.nagoya-u.ac.jp/develop/center/slocal (accessed on 11 April 2021).
  32. Narayanan, S.; Chaniotakis, E.; Antoniou, C. Shared autonomous vehicle services: A comprehensive review. Transp. Res. Part C Emerg. Technol. 2020, 111, 255–293. [Google Scholar] [CrossRef]
  33. Zhang, W.; Guhathakurta, S. Residential Location Choice in the Era of Shared Autonomous Vehicles. J. Plan. Educ. Res. 2018, 41, 135–148. [Google Scholar] [CrossRef] [Green Version]
  34. Hao, M.; Yamamoto, T. Analysis on supply and demand of shared autonomous vehicles considering household vehicle ownership and shared use. In Proceedings of the IEEE Conference on Intelligent Transportation Systems (ITSC), Yokohama, Japan, 16–19 October 2017; pp. 185–190. [Google Scholar] [CrossRef]
  35. Chen, T.D.; Kockelman, K.M.; Hanna, J.P. Operations of a shared, autonomous, electric vehicle fleet: Implications of vehicle & charging infrastructure decisions. Transp. Res. Part A Policy Pract. 2016, 94, 243–254. [Google Scholar] [CrossRef] [Green Version]
  36. Martinez, L.M.; Viegas, J.M. Assessing the impacts of deploying a shared self-driving urban mobility system: An agent-based model applied to the city of Lisbon, Portugal. Int. J. Transp. Sci. Technol. 2017, 6, 13–27. [Google Scholar] [CrossRef]
  37. Bauer, G.S.; Greenblatt, J.B.; Gerke, B.F. Cost, Energy, and Environmental Impact of Automated Electric Taxi Fleets in Manhattan. Environ. Sci. Technol. 2018, 52, 4920–4928. [Google Scholar] [CrossRef] [PubMed] [Green Version]
  38. Cyganski, R.; Heinrichs, M.; Von Schmidt, A.; Krajzewicz, D. Simulation of automated transport offers for the city of Brunswick. Procedia Comput. Sci. 2018, 130, 872–879. [Google Scholar] [CrossRef]
  39. Development of Commuter Town, the Official Website of Urban Renaissance Agency. Available online: https://www.ur-net.go.jp/central/nt/ (accessed on 11 May 2021).
  40. Demographic Data of Kozoji Newtown, Official Kasugai City Website. Available online: https://www.city.kasugai.lg.jp/shisei/gyousei/toukei/1008359.html (accessed on 20 April 2021).
  41. Annual Report on the Ageing Society (FY2020). Available online: https://www8.cao.go.jp/kourei/whitepaper/w-2020/html/gaiyou/s1_1.html (accessed on 20 April 2021).
  42. Website of Kasugai City. Available online: https://www.city.kasugai.lg.jp/shisei/machi/new_town/ (accessed on 22 July 2021).
  43. Website of Urban Renaissance Agency. Available online: https://www.ur-net.go.jp/central/nt/ (accessed on 22 July 2021).
  44. Website of Kozoji Newtown. Available online: https://kozoji-nt.com/access/ (accessed on 22 July 2021).
  45. Kitamura, S.; Mizuta, T.; Nakamura, T.; Sato, H.; Morikawa, T.; Nakasuga, A.; Minamikawa, A. A Practical Study on Demand Analysis for Introducing Low-speed Autonomous Vehicle. J. Jpn. Soc. Civ. Eng. Ser. 2021, 76, I_1093–I_1106. (In Japanese) [Google Scholar] [CrossRef]
  46. Ministry of Land, Infrastructure and Transport. Heisei 22nd National Road Traffic Survey (Road Traffic Census) General Traffic Survey Total List; Ministry of Land, Infrastructure and Transport: Tokyo, Japan, 2011. (In Japanese)
  47. Website of MAS Community. Available online: https://mas.kke.co.jp/en/ (accessed on 20 July 2021).
Figure 1. Plan diagram of Kozoji Newtown. (Source: Urban Renaissance Agency; https://www.ur-net.go.jp/central/nt/; accessed on 21 April 2021) [39].
Sustainability 13 08638 g001
Figure 2. Distribution of trips during the service hour. (Demand data No. 1, Sum = 2265).
Sustainability 13 08638 g002
Figure 3. Sharing ride flow.
Sustainability 13 08638 g003
Figure 4. Hourly wait times at different times of the day based on various fleet sizes.
Sustainability 13 08638 g004
Figure 5. Hourly share rates at different times of the day based on various fleet sizes.
Sustainability 13 08638 g005
Figure 6. Vacant vehicles at different times of the day in the low-speed scenario with a fleet size of 40 vehicles.
Sustainability 13 08638 g006
Table 1. Attributes of the three scenarios.
ScenarioNo-SharingLow-SpeedHigh-Speed
Maximum time before cancel (min)500
Service period6:00 a.m.–11:59 p.m.
Demand data10 sets, average 2263 trips/day
Share rideStrategy equippedFALSETRUETRUE
ThresholdNull<150% direct time
<5 min time difference
Speed (km/h)Arterial1530
Non-arterial7.515
Table 2. Wait time of the various fleet sizes in the low-speed scenario.
Fleet Size40506070
Average0:15:010:07:060:04:540:04:31
95th Percentile0:36:530:18:460:11:400:11:02
Table 3. Wait times of 40 fleets in three scenarios.
Fleet Size40
ScenarioNo-SharingLow-SpeedHigh-Speed
Average1:52:250:15:010:02:27
95th Percentile3:35:160:36:530:05:47
Ratio of passenger<30 min9.82%87.93%100.00%
<10 min3.56%42.06%99.97%
<5 min1.51%23.24%90.57%
Table 4. In-vehicle time of 40 fleets in three scenarios.
Fleet Size40
ScenarioNo-SharingLow-SpeedHigh-Speed
Average0:07:560:08:340:03:58
95th Percentile0:16:290:18:340:08:16
Table 5. Share rates of the low-speed scenario based on the fleet size.
Fleet Size40506070
Share rate (%)42.90%13.26%5.26%4.61%
Table 6. Average and standard deviation of wait, vacant, and utilized times and their rates of 40 vehicles in the low-speed scenario.
Time (s)Rate
Wait TimeVacant TimeUtilized TimeWait TimeVacant TimeUtilized Time
Average4:11:086:48:067:00:4623.25%37.79%38.96%
Std. deviation0:59:580:43:280:39:545.55%4.03%3.70%
Publisher’s Note: MDPI stays neutral with regard to jurisdictional claims in published maps and institutional affiliations.

